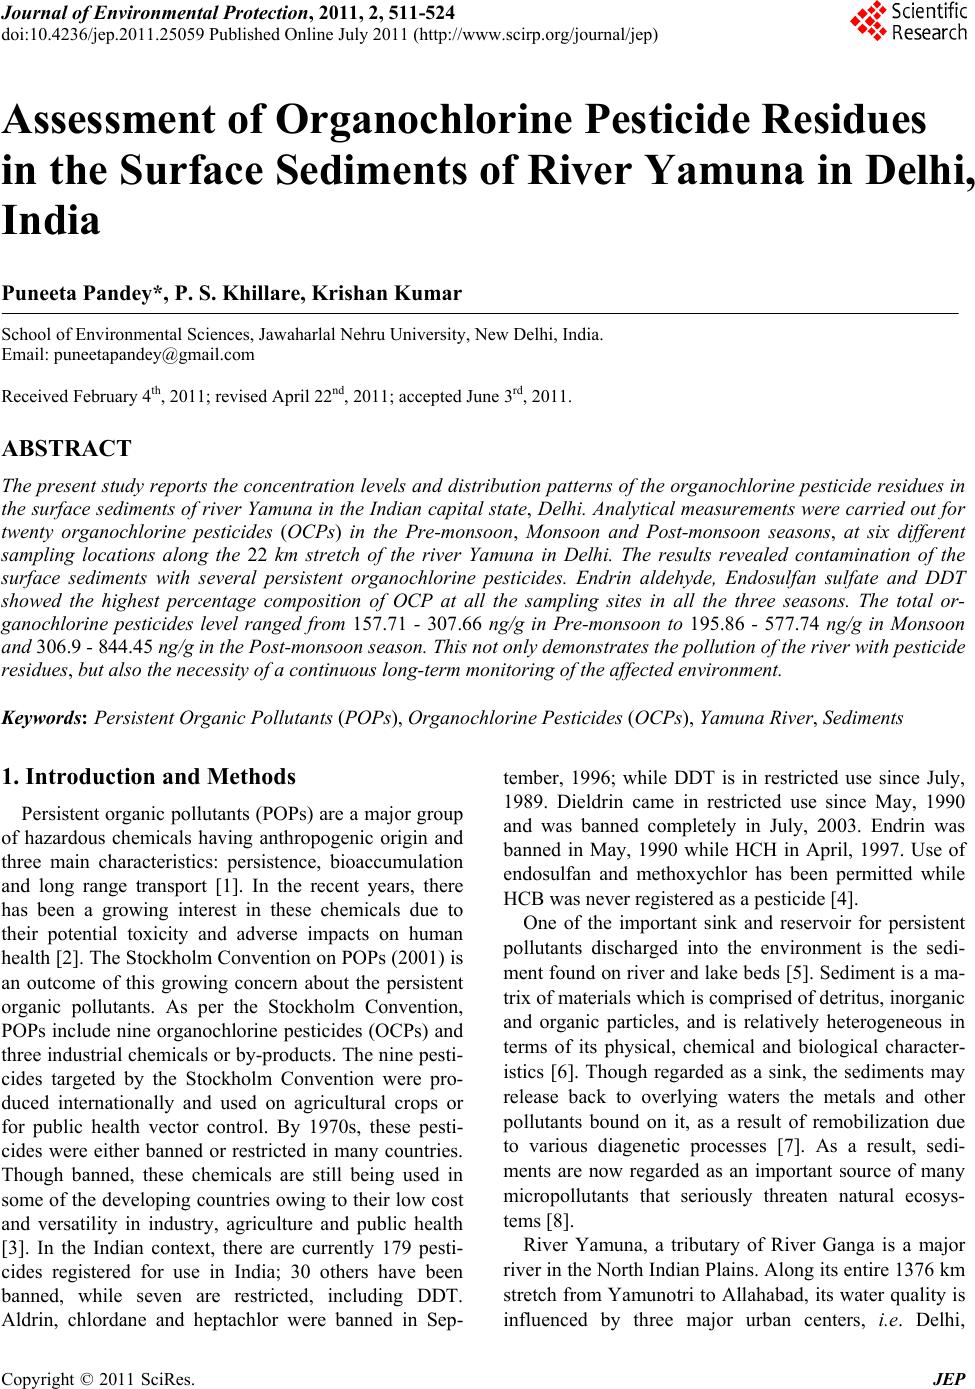
 Journal of Environmental Protection, 2011, 2, 511-524 doi:10.4236/jep.2011.25059 Published Online July 2011 (http://www.scirp.org/journal/jep) Copyright © 2011 SciRes. JEP Assessment of Organochlorine Pesticide Residues in the Surface Sediments of River Yamuna in Delhi, India Puneeta Pandey*, P. S. Khillare, Krishan Kumar School of Environmental Sciences, Jawaharlal Nehru University, New Delhi, India. Email: puneetapandey@gmail.com Received February 4th, 2011; revised April 22nd, 2011; accepted June 3rd, 2011. ABSTRACT The present study reports the concentration levels and distribution patterns of the organochlorine pesticide residues in the surface sediments of river Yamuna in the Indian capital state, Delhi. Analytical measurements were carried out for twenty organochlorine pesticides (OCPs) in the Pre-monsoon, Monsoon and Post-monsoon seasons, at six different sampling locations along the 22 km stretch of the river Yamuna in Delhi. The results revealed contamination of the surface sediments with several persistent organochlorine pesticides. Endrin aldehyde, Endosulfan sulfate and DDT showed the highest percentage composition of OCP at all the sampling sites in all the three seasons. The total or- ganochlorine pesticides level ranged from 157.71 - 307.66 ng/g in Pre-monsoon to 195.86 - 577.74 ng/g in Monsoon and 306.9 - 844.45 ng/g in the Post-monsoon season. This not only demonstrates the pollution of the river with pesticide residues, but also the necessity of a continuous long-term monitoring of the affected environment. Keywords: Persistent Organic Pollutants (POPs), Organochlorine Pesticides (OCPs), Yamuna River, Sediments 1. Introduction and Methods Persistent organic pollutants (POPs) are a major group of hazardous chemicals having anthropogenic origin and three main characteristics: persistence, bioaccumulation and long range transport [1]. In the recent years, there has been a growing interest in these chemicals due to their potential toxicity and adverse impacts on human health [2]. The Stockholm Convention on POPs (2001) is an outcome of this growing concern about the persistent organic pollutants. As per the Stockholm Convention, POPs include nine organochlorine pesticides (OCPs) and three industrial chemicals or by-products. The nine pesti- cides targeted by the Stockholm Convention were pro- duced internationally and used on agricultural crops or for public health vector control. By 1970s, these pesti- cides were either banned or restricted in many countries. Though banned, these chemicals are still being used in some of the developing countries owing to their low cost and versatility in industry, agriculture and public health [3]. In the Indian context, there are currently 179 pesti- cides registered for use in India; 30 others have been banned, while seven are restricted, including DDT. Aldrin, chlordane and heptachlor were banned in Sep- tember, 1996; while DDT is in restricted use since July, 1989. Dieldrin came in restricted use since May, 1990 and was banned completely in July, 2003. Endrin was banned in May, 1990 while HCH in April, 1997. Use of endosulfan and methoxychlor has been permitted while HCB was never registered as a pesticide [4]. One of the important sink and reservoir for persistent pollutants discharged into the environment is the sedi- ment found on river and lake beds [5]. Sediment is a ma- trix of materials which is comprised of detritus, inorganic and organic particles, and is relatively heterogeneous in terms of its physical, chemical and biological character- istics [6]. Though regarded as a sink, the sediments may release back to overlying waters the metals and other pollutants bound on it, as a result of remobilization due to various diagenetic processes [7]. As a result, sedi- ments are now regarded as an important source of many micropollutants that seriously threaten natural ecosys- tems [8]. River Yamuna, a tributary of River Ganga is a major river in the North Indian Plains. Along its entire 1376 km stretch from Yamunotri to Allahabad, its water quality is influenced by three major urban centers, i.e. Delhi,  Assessment of Organochlorine Pesticide Residues in the Surface Sediments of River Yamuna in Delhi, India 512 Mathura-Vrindavan and Agra. Among these three, Delhi’s contribution of pollution load into the river Yamuna is the greatest. It also receives a fair amount of pesticides as runoff from the agricultural fields of Haryana upstream to its entry point in Delhi. A variety of vegetables are grown in Yamuna flood plains in Delhi, where use of OCPs is quite prominent. Besides, inundation of surface sediments along the banks of Yamuna cannot be ruled out in the monsoon season. Owing to the greater environmental significance of OCPs in Indian context and highly polluted status of the river Yamuna, the study envisages having a proper as- sessment of the residual presence of OCPs in Yamuna river sediment. Thus, the objective of the present study was: 1) To determine the concentration levels of organo- chlorine pesticides in surface sediment of the river Ya- muna in Delhi 2) To obtain trends in spatial and temporal variation of organochlorine pesticides concentration. The results obtained may be made use of as a baseline data in developing effective remedial measures to im- prove the water quality status of the river. 2. Materials and Method 2.1. Site Description Delhi, the capital state of India, is situated at latitude of 28°24′17′′ to 28°53′ and the longitude of 76°20′37′′ to 77°20′37′′, with an altitude of 216 meters above mean sea level. For the collection of sediment samples from the river Yamuna, six sampling sites were selected along the river Yamuna in Delhi. Site A (RG), was taken up- stream to the city, three sites B, C and D in the middle segment (NGUS, NGDS and ITO) respectively and two sites E (OK) and F (KK) downstream to the city. Figure 1 represents map of the River Yamuna in Delhi showing the six sampling sites. Sediment samples were collected from these sites for Pre-monsoon (June), Monsoon (Au- gust) and Post-monsoon (October) season and analyzed for 20 organochlorine pesticides. 2.2. Reagents Standard mixture containing twenty-two OCPs (22 com- pounds specified in EPA method 8081B) was purchased from Supelco (Sigma Aldrich, USA). All solvents (ace- tone, hexane, dichloromethane etc.) used for sample processing and analysis, were of HPLC grade. 2.3. Sample Preparation At each sampling site, the samples were collected in trip- licates with the help of a stainless steel auger, transferred into polythene bags and transported to laboratory. After Figure 1. Map of the Yamuna River in Delhi showing sam- pling sites. drying, the samples were mixed thoroughly by the quar- tering method and then sieved through a 2 mm sieve. The sediment samples were extracted by Soxhlet extraction method (USEPA Method 3540 [26,39,34]. Then, the cleanup was carried out by Silica Gel (Silica gel 60, par- ticle size 0.0630 - 0.200 mm, 70 - 230 mesh ASTM pur- chased from Merck KgaA, Darmstadt, Germany) Clean- up Method (USEPA Method 3630C). 2.4. Analysis All the samples were analyzed on Gas Chromatograph (Perkin Elmer Instruments, AutoSystem XL GC), equipped with ECD (Electron Capture Detector) and a Perkin- Elmer wide-bore capillary column (PE-5 column) with the dimensions 30 m × 0.53 mm i.d. × 1.5 μm. 3. Results and Discussion In the present study, Endosulfan I and α-Chlordane have been reported together, since they appeared as joint peak and could not be resolved. For similar reasons, En- dosulfan sulfate + DDT have also been reported together. 3.1. Spatial Variation of Organochlorine Pesticides Concentration In the pre-monsoon period, the total OCPs (Σ OCP) con- centration ranged from 157.71 ng/g at Ramghat to 307.66 ng/g at Najafgarh Upstream (NGUS). The high concen- C opyright © 2011 SciRes. JEP  Assessment of Organochlorine Pesticide Residues in the Surface Sediments of River Yamuna in Delhi, India Copyright © 2011 SciRes. JEP 513 tration of pesticides at RG and NGUS can be attributed to the pollution load added from the neighboring state of Haryana as well as the increased sewage flow in the river. Since the flow decreases downstream, the concentration of ΣOCP decreased which could be due to degradation of OCPs in summer due to high temperature. A very low value at NGDS could be due to microbial action which further accelerated the degradation processes. In the monsoon period, the highest average seasonal concentration was found at KK (577.74 ng/g), while mi- nimum concentration was at NGUS (195.86 ng/g). Dur- ing monsoon season, the major source of organic pollu- tion is industrial wastewater, runoff from agricultural fields in Haryana upstream of Delhi and Yamuna flood- plains, garbage dumps and city streets carrying litter. Since the distribution during monsoon is very heteroge- nous, it can be said that since the flow of river increased during monsoon, the pollution load was carried down- stream to Kalindi Kunj. Further each site also received runoff from local sources, especially the Najafgarh drain, hence a high value was observed at NGDS (due to Na- jafgarh drain), and Okhla (due to Yamuna flood plains). In the post-monsoon period, the total OCPs (Σ OCP) concentration ranged from 306.9 ng/g at NGDS to 844.45 ng/g at RG. During Post-monsoon season, besides contribution from runoff from fields in Haryana, some of the pesticides find their way into the sediments due to leaching [9], as there seems to be a time lag between peak water flow and OCPs reaching the sediment matrix of the river. Further, the degradation may not have been substantial as there was a time difference of two months only between monsoon and post-monsoon sampling, hence such a high value was observed at Ramghat. Simi- larly, a high value at ITO could be due to runoff from agricultural fields in its vicinity, which had not degraded much. The value is low at NGDS, however, the differ- ence between NGUS and NGDS is not much pronounced in post-monsoon, as in pre- monsoon. The concentration of individual OCPs in the pre-monsoon, monsoon and post-monsoon season has been given in Table 1, 2 and 3 respectively. Considering the distribution of OCPs at various sam- pling sites, Endrin aldehyde revealed the highest concen- tration at all the sites except NGDS, wherein Endosulfan sulfate + DDT dominated during pre-monsoon season. In the monsoon season, Endosulfan sulfate + DDT revealed the highest concentration at RG, NGUS, ITO and OK, while heptachlor epoxide revealed the highest concentra- tion at NGDS and KK. Finally, during post-monsoon season, Endosulfan sulfate + DDT showed the highest concentration at NGUS, NGDS, ITO and OK, Endrin aldehyde at RG, and heptachlor epoxide at KK. Thus, Table 1. Spatial variation of OCPs in sediment at different sites of River Yamuna (Pre-monsoon period). OCPs RG NGUS NGDS ITO OK KK α-BHC 12.33 ± 1.52 3.95 ± 0.81 12.42 ± 1.06 7.25 ± 0.79 6.51 ± 0.62 6.1 ± 0.67 β-BHC 7.55 ± 0.86 4.5 ± 0.56 1.07 ± 0.34 1.19 ± 0.26 1.2 ± 0.11 0.31 ± 0.05 γ-BHC 9.64 ± 0.73 0.38 ± 0.23 7.85 ± 0.96 3.74 ± 0.45 0.37 ± 0.09 0.88 ± 0.12 δ-BHC 6.99 ± 0.54 1.65 ± 0.54 7.13 ± 0.85 0.11 ± 0.09 3.22 ± 0.31 0.81 ± 0.14 Hep 6.94 ± 0.41 7.36 ± 0.81 4.7 ± 0.26 1.5 ± 0.18 0.79 ± 0.21 0.83 ± 0.08 Ald 3.42 ± 0.28 14.51 ± 0.64 5.81 ± 0.25 7.51 ± 0.46 6.64 ± 0.54 5.29 ± 0.56 Hepex 2.55 ± 0.56 13.76 ± 0.95 2.09 ± 0.32 8.53 ± 1.04 8.04 ± 0.87 8.6 ± 0.96 γ-Chl 2.28 ± 0.14 15.44 ± 0.58 2.63 ± 0.12 9.22 ± 1.5 5.58 ± 0.81 3.76 ± 0.41 Ends1 + α-Chl 0.11 ± 0.23 8.78 ± 0.74 0.37 ± 0.11 5.08 ± 0.41 4.12 ± 0.52 3.08 ± 0.59 DDE 4.88 ± 0.61 24.58 ± 0.56 8.51 ± 1.05 18.43 ± 0.99 14.17 ± 1.11 9.97 ± 1.01 Dield 5.49 ± 0.39 25.18 ± 2.11 9.91 ± 1.54 18.08 ± 1.14 13.58 ± 1.55 11.36 ± 1.52 End 13.7 ± 1.24 31.48 ± 1.96 16.02 ± 2.15 22.55 ± 2.13 18.78 ± 1.46 17.01 ± 1.15 Ends2 11.34 ± 1.92 24.44 ± 3.14 16.14 ± 1.52 16.62 ± 1.84 14.96 ± 2.14 16.76 ± 2.15 DDD 13.42 ± 2.14 24.42 ± 1.85 17.11 ± 1.68 17.27 ± 1.31 14.84 ± 1.84 20.08 ± 1.64 Endal 21.89 ± 0.98 33.19 ± 1.27 27.28 ± 1.86 25.21 ± 1.55 23.47 ± 2.11 29.67 ± 2.18 Endosu + DDT 21.56 ± 1.45 26.67 ± 1.52 28.56 ± 1.45 24.16 ± 2.13 20.59 ± 1.26 29.14 ± 1.67 Endket 5.9 ± 0.53 20.72 ± 1.19 11.19 ± 1.04 18.83 ± 1.41 15.91 ± 1.06 11.45 ± 1.06 Meth 7.72 ± 0.61 26.65 ± 2.56 11.44 ± 0.45 23.2 ± 1.58 19.34 ± 1.18 11.56 ± 0.98 TOTAL 157.71 307.66 190.23 228.48 192.11 186.66  Assessment of Organochlorine Pesticide Residues in the Surface Sediments of River Yamuna in Delhi, India 514 Table 2. Spatial variation of OCPs in sediment at different sites of River Yamuna (Monsoon period). OCPs RG NGUS NGDS ITO OK KK α-BHC 6.87 ± 1.31 15.34 ± 1.21 14.26 ± 1.21 6.67 ± 0.98 25.49 ± 1.61 18.99 ± 0.82 β-BHC 1.6 ± 0.23 12.64 ± 1.32 19.68 ± 1.62 3.99 ± 0.64 30.27 ± 1.87 23.31 ± 0.93 γ-BHC 5.91 ± 1.1 12.26 ± 1.12 17.05 ± 1.54 4.07 ± 0.71 27.85 ± 1.56 26.28 ± 1.1 δ-BHC 1.04 ± 0.24 8.95 ± 0.95 14.95 ± 1.35 0.39 ± 0.23 20.99 ± 0.89 15.48 ± 0.79 Hep 3.33 ± 0.67 9.88 ± 0.89 14.09 ± 1.26 3.16 ± 0.45 25.23 ± 0.98 15.82 ± 0.81 Ald 1.05 ± 0.21 6.87 ± 0.87 18.39 ± 1.98 3.79 ± 0.56 29.1 ± 1.69 20.98 ± 1.23 Hepex 6.76 ± 0.98 4.15 ± 0.79 78.18 ± 2.14 26.17 ± 1.76 35.56 ± 1.98 72.5 ± 2.63 γ-Chl 6.34 ± 1.1 2.96 ± 0.54 10.95 ± 1.24 1.32 ± 0.43 23.71 ± 0.95 17.73 ± 0.74 Ends1 + α-Chl 1.49 ± 1.23 1.1 ± 0.36 8.58 ± 0.97 2.44 ± 0.67 15.63 ± 0.78 12.42 ± 0.68 DDE 10.17 ± 2.31 3.45 ± 0.62 21.61 ± 1.99 10.69 ± 1.26 29.45 ± 1.72 26.24 ± 1.21 Dield 12.81 ± 2.56 5.93 ± 0.74 23.42 ± 2.1 12.79 ± 1.38 30.71 ± 1.76 27.61 ± 1.32 End 17.43 ± 1.73 12.14 ± 1.26 30.31 ± 2.24 20.34 ± 1.67 33.78 ± 1.82 32.72 ± 1.64 Ends2 17.81 ± 1.62 13.08 ± 1.32 31.44 ± 2.35 21.31 ± 1.78 33.71 ± 1.79 33.13 ± 1.76 DDD 21.57 ± 2.86 16.01 ± 1.52 47.12 ± 2.56 26.89 ± 1.98 42.64 ± 1.94 47.34 ± 1.86 Endal 29.54 ± 2.94 23.52 ± 1.73 44.33 ± 2.48 34.17 ± 2.13 43.16 ± 2.1 49.68 ± 1.92 Endosu + DDT 34.14 ± 3.14 26.67 ± 1.99 78.23 ± 2.87 40.84 ± 2.36 55.01 ± 2.76 71.49 ± 2.43 Endket 17.44 ± 1.64 10.25 ± 0.98 21.89 ± 2.11 21.15 ± 1.59 21.76 ± 0.94 32.12 ± 1.56 Meth 18.69 ± 1.82 10.76 ± 1.1 22.01 ± 2.23 22.93 ± 1.76 22.55 ± 0.98 33.9 ± 1.68 TOTAL 213.99 195.86 551.49 263.11 546.6 577.74 Table 3. Spatial variation of OCPs in sediment at different sites of River Yamuna (Post-monsoon period). OCPs RG NGUS NGDS ITO OK KK α-BHC 5.76 ± 0.45 0.24 ± 0.21 0.33 ± 0.11 14.48 ± 0.78 12.5 ± 0.78 11.98 ± 0.78 β-BHC 10.49 ± 1.32 2.55 ± 0.51 0.53 ± 0.27 17.6 ± 0.89 15.7 ± 0.86 15.51 ± 0.87 γ-BHC 9.99 ± 1.26 3.56 ± 0.64 7.17 ± 1.23 17.24 ± 0.84 19.82 ± 0.96 24.74 ± 1.13 δ-BHC 9.18 ± 1.19 3.29 ± 0.61 2.06 ± 0.58 14.86 ± 0.79 12.44 ± 0.63 11.36 ± 0.76 Hep 18.36 ± 1.67 4.41 ± 0.72 0.88 ± 0.36 19.72 ± 0.98 15.66 ± 0.86 8.56 ± 0.69 Ald 27.87 ± 1.89 6.86 ± 0.84 4.93 ± 0.77 21.91 ± 1.12 14.18 ± 0.87 10.75 ± 0.74 Hepex 50.32 ± 2.32 12.31 ± 1.11 4.86 ± 0.64 23.76 ± 1.32 16.33 ± 0.98 70.59 ± 2.89 γ-Chl 44.23 ± 2.14 9.19 ± 0.98 5.99 ± 0.86 23.33 ± 1.21 10.86 ± 0.59 6.44 ± 0.59 Ends1 + α-Chl 23.54 ± 1.64 7.59 ± 0.87 5.26 ± 0.78 16.22 ± 0.91 8.48 ± 0.49 5.04 ± 0.48 DDE 72.16 ± 2.89 19.81 ± 1.32 17.04 ± 0.89 31.4 ± 1.32 17.69 ± 1.95 15.11 ± 0.85 Dield 81.8 ± 2.96 23.31 ± 1.65 18.91 ± 0.91 33.95 ± 1.43 19.89 ± 1.1 17.89 ± 0.98 End 67.63 ± 2.68 31.6 ± 1.74 26.91 ± 0.98 40.07 ± 1.64 25.78 ± 1.34 24.48 ± 1.25 Ends2 60.51 ± 2.48 32.33 ± 1.86 28.85 ± 1.21 40.17 ± 1.66 26.92 ± 1.53 25.27 ± 1.34 DDD 64.19 ± 2.65 38.54 ± 1.94 35.37 ± 1.35 47.66 ± 1.78 30.74 ± 1.72 32.61 ± 1.65 Endal 90.87 ± 3.15 46.15 ± 2.11 40.02 ± 1.51 51.77 ± 1.87 33.94 ± 1.84 35.96 ± 1.81 Endosu + DDT 86.19 ± 2.99 55.13 ± 2.23 48.19 ± 1.62 57.31 ± 1.96 42.68 ± 1.91 56.77 ± 1.98 Endket 58.58 ± 2.21 34.85 ± 1.78 28.93 ± 0.91 32.93 ± 1.48 25.44 ± 1.34 24.96 ± 1.26 Meth 62.78 ± 2.53 37.28 ± 1.86 30.67 ± 1.1 35.43 ± 1.51 25.63 ± 1.46 25.72 ± 1.29 TOTAL 844.45 369 306.9 539.81 374.68 423.74 C opyright © 2011 SciRes. JEP 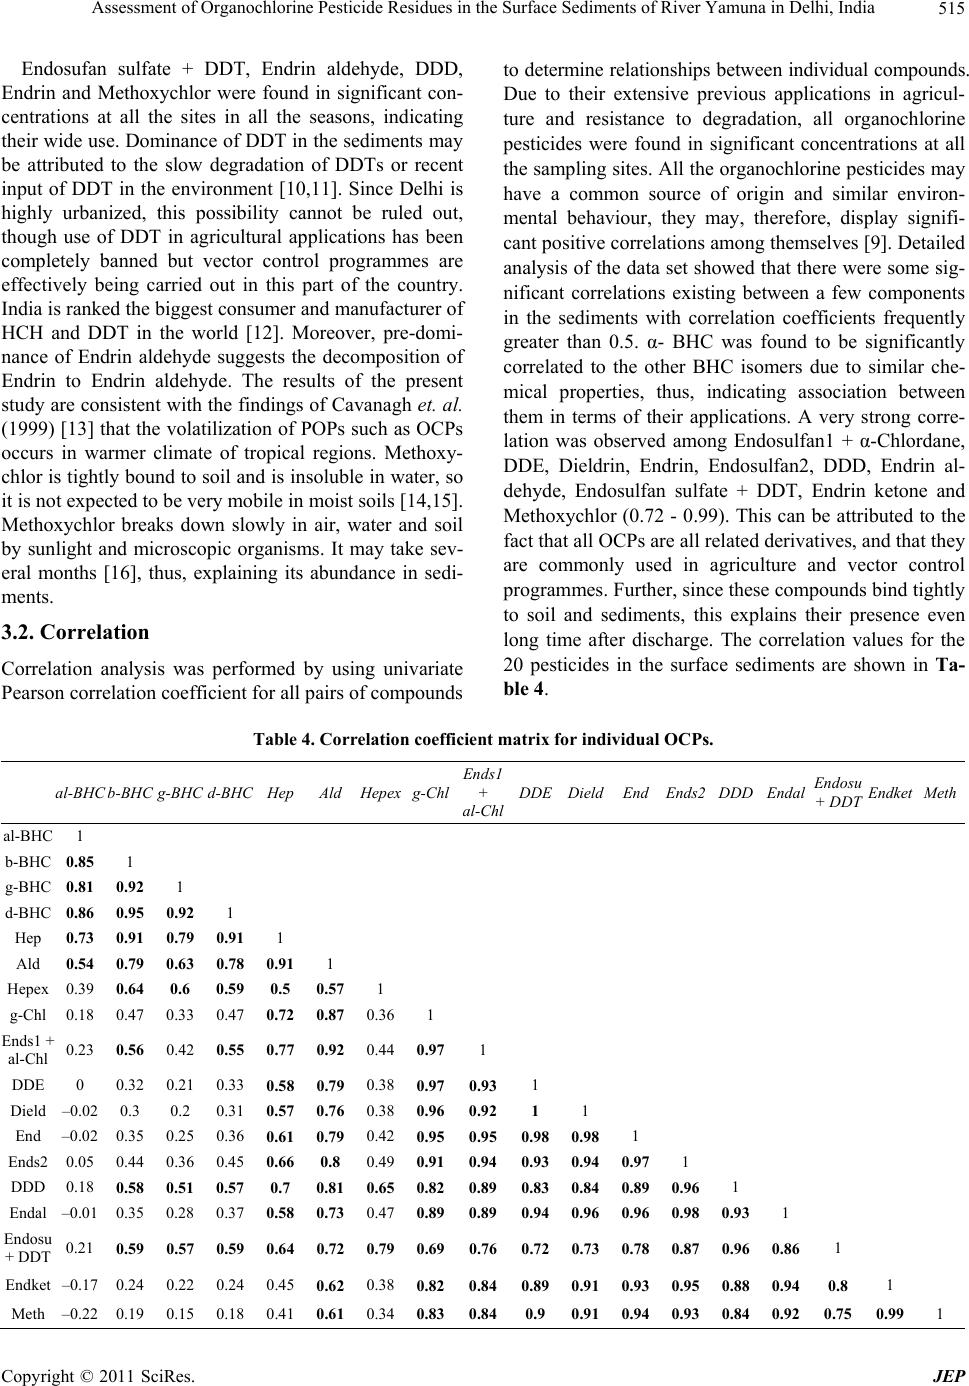 Assessment of Organochlorine Pesticide Residues in the Surface Sediments of River Yamuna in Delhi, India Copyright © 2011 SciRes. JEP 515 Endosufan sulfate + DDT, Endrin aldehyde, DDD, Endrin and Methoxychlor were found in significant con- centrations at all the sites in all the seasons, indicating their wide use. Dominance of DDT in the sediments may be attributed to the slow degradation of DDTs or recent input of DDT in the environment [10,11]. Since Delhi is highly urbanized, this possibility cannot be ruled out, though use of DDT in agricultural applications has been completely banned but vector control programmes are effectively being carried out in this part of the country. India is ranked the biggest consumer and manufacturer of HCH and DDT in the world [12]. Moreover, pre-domi- nance of Endrin aldehyde suggests the decomposition of Endrin to Endrin aldehyde. The results of the present study are consistent with the findings of Cavanagh et. al. (1999) [13] that the volatilization of POPs such as OCPs occurs in warmer climate of tropical regions. Methoxy- chlor is tightly bound to soil and is insoluble in water, so it is not expected to be very mobile in moist soils [14,15]. Methoxychlor breaks down slowly in air, water and soil by sunlight and microscopic organisms. It may take sev- eral months [16], thus, explaining its abundance in sedi- ments. 3.2. Correlation Correlation analysis was performed by using univariate Pearson correlation coefficient for all pairs of compounds to determine relationships between individual compounds. Due to their extensive previous applications in agricul- ture and resistance to degradation, all organochlorine pesticides were found in significant concentrations at all the sampling sites. All the organochlorine pesticides may have a common source of origin and similar environ- mental behaviour, they may, therefore, display signifi- cant positive correlations among themselves [9]. Detailed analysis of the data set showed that there were some sig- nificant correlations existing between a few components in the sediments with correlation coefficients frequently greater than 0.5. α- BHC was found to be significantly correlated to the other BHC isomers due to similar che- mical properties, thus, indicating association between them in terms of their applications. A very strong corre- lation was observed among Endosulfan1 + α-Chlordane, DDE, Dieldrin, Endrin, Endosulfan2, DDD, Endrin al- dehyde, Endosulfan sulfate + DDT, Endrin ketone and Methoxychlor (0.72 - 0.99). This can be attributed to the fact that all OCPs are all related derivatives, and that they are commonly used in agriculture and vector control programmes. Further, since these compounds bind tightly to soil and sediments, this explains their presence even long time after discharge. The correlation values for the 20 pesticides in the surface sediments are shown in Ta- ble 4. Table 4. Correlation coefficient matrix for individual OCPs. al- H b-BHC g-BHC d-BHCHep Ald Hepexg-ChlEnds1 + al-Chl DDEDieldEndEnds2DDD Endal Endosu + DDT Endket Meth al-BHC 1 b-BHC 0.85 1 g-BHC 0.81 0.92 1 d-BHC 0.86 0.95 0.92 1 Hep 0.73 0.91 0.79 0.911 Ald 0.54 0.79 0.63 0.78 0.91 1 Hepex 0.39 0.64 0.6 0.59 0.5 0.57 1 g-Chl 0.18 0.47 0.33 0.47 0.72 0.87 0.361 Ends1 + al-Chl 0.23 0.56 0.42 0.55 0.77 0.92 0.44 0.97 1 DDE 0 0.32 0.21 0.330.58 0.79 0.38 0.97 0.931 Dield –0.02 0.3 0.2 0.310.57 0.76 0.38 0.960.921 1 End –0.02 0.35 0.25 0.360.61 0.79 0.42 0.950.950.98 0.981 Ends2 0.05 0.44 0.36 0.45 0.66 0.8 0.49 0.910.940.93 0.94 0.971 DDD 0.18 0.58 0.51 0.570.7 0.81 0.65 0.820.890.83 0.84 0.89 0.961 Endal –0.01 0.35 0.28 0.370.58 0.73 0.47 0.890.890.940.960.960.980.93 1 Endosu + DDT 0.21 0.59 0.57 0.59 0.64 0.72 0.79 0.690.760.72 0.73 0.78 0.87 0.96 0.86 1 Endket –0.17 0.24 0.22 0.240.45 0.62 0.38 0.820.840.89 0.91 0.93 0.95 0.88 0.94 0.8 1 Meth –0.22 0.19 0.15 0.180.41 0.61 0.34 0.830.840.90.91 0.94 0.93 0.84 0.92 0.75 0.991 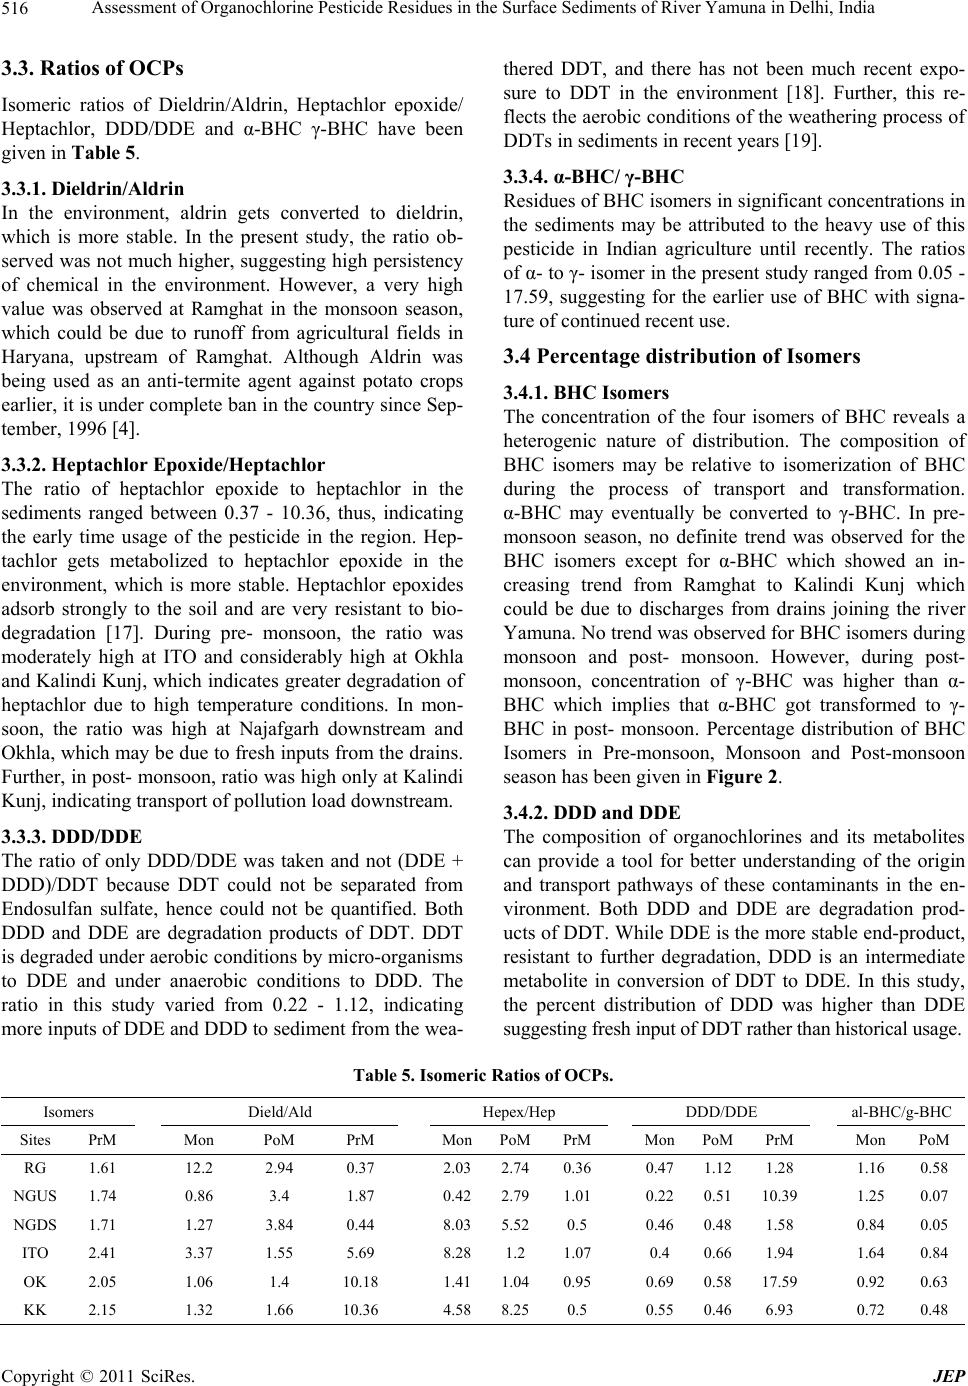 Assessment of Organochlorine Pesticide Residues in the Surface Sediments of River Yamuna in Delhi, India 516 3.3. Ratios of OCPs Isomeric ratios of Dieldrin/Aldrin, Heptachlor epoxide/ Heptachlor, DDD/DDE and α-BHC γ-BHC have been given in Table 5. 3.3.1. Dieldrin/Aldrin In the environment, aldrin gets converted to dieldrin, which is more stable. In the present study, the ratio ob- served was not much higher, suggesting high persistency of chemical in the environment. However, a very high value was observed at Ramghat in the monsoon season, which could be due to runoff from agricultural fields in Haryana, upstream of Ramghat. Although Aldrin was being used as an anti-termite agent against potato crops earlier, it is under complete ban in the country since Sep- tember, 1996 [4]. 3.3.2. Heptachlor Epoxide/Heptachlor The ratio of heptachlor epoxide to heptachlor in the sediments ranged between 0.37 - 10.36, thus, indicating the early time usage of the pesticide in the region. Hep- tachlor gets metabolized to heptachlor epoxide in the environment, which is more stable. Heptachlor epoxides adsorb strongly to the soil and are very resistant to bio- degradation [17]. During pre- monsoon, the ratio was moderately high at ITO and considerably high at Okhla and Kalindi Kunj, which indicates greater degradation of heptachlor due to high temperature conditions. In mon- soon, the ratio was high at Najafgarh downstream and Okhla, which may be due to fresh inputs from the drains. Further, in post- monsoon, ratio was high only at Kalindi Kunj, indicating transport of pollution load downstream. 3.3.3. DDD/DDE The ratio of only DDD/DDE was taken and not (DDE + DDD)/DDT because DDT could not be separated from Endosulfan sulfate, hence could not be quantified. Both DDD and DDE are degradation products of DDT. DDT is degraded under aerobic conditions by micro-organisms to DDE and under anaerobic conditions to DDD. The ratio in this study varied from 0.22 - 1.12, indicating more inputs of DDE and DDD to sediment from the wea- thered DDT, and there has not been much recent expo- sure to DDT in the environment [18]. Further, this re- flects the aerobic conditions of the weathering process of DDTs in sediments in recent years [19]. 3.3.4. α-BHC/ γ-BHC Residues of BHC isomers in significant concentrations in the sediments may be attributed to the heavy use of this pesticide in Indian agriculture until recently. The ratios of α- to γ- isomer in the present study ranged from 0.05 - 17.59, suggesting for the earlier use of BHC with signa- ture of continued recent use. 3.4 Percentage distribution of Isomers 3.4.1. BHC Isomers The concentration of the four isomers of BHC reveals a heterogenic nature of distribution. The composition of BHC isomers may be relative to isomerization of BHC during the process of transport and transformation. α-BHC may eventually be converted to γ-BHC. In pre- monsoon season, no definite trend was observed for the BHC isomers except for α-BHC which showed an in- creasing trend from Ramghat to Kalindi Kunj which could be due to discharges from drains joining the river Yamuna. No trend was observed for BHC isomers during monsoon and post- monsoon. However, during post- monsoon, concentration of γ-BHC was higher than α- BHC which implies that α-BHC got transformed to γ- BHC in post- monsoon. Percentage distribution of BHC Isomers in Pre-monsoon, Monsoon and Post-monsoon season has been given in Figure 2. 3.4.2. DDD and DDE The composition of organochlorines and its metabolites can provide a tool for better understanding of the origin and transport pathways of these contaminants in the en- vironment. Both DDD and DDE are degradation prod- ucts of DDT. While DDE is the more stable end-product, resistant to further degradation, DDD is an intermediate metabolite in conversion of DDT to DDE. In this study, the percent distribution of DDD was higher than DDE suggesting fresh input of DDT rather than historical usage. Table 5. Isomeric Ratios of OCPs. Isomers Dield/Ald Hepex/Hep DDD/DDE al-BHC/g-BHC Sites PrM Mon PoM PrM MonPoMPrM MonPoM PrM Mon PoM RG 1.61 12.2 2.94 0.37 2.032.74 0.36 0.471.12 1.28 1.16 0.58 NGUS 1.74 0.86 3.4 1.87 0.422.79 1.01 0.220.51 10.39 1.25 0.07 NGDS 1.71 1.27 3.84 0.44 8.035.52 0.5 0.460.48 1.58 0.84 0.05 ITO 2.41 3.37 1.55 5.69 8.281.2 1.07 0.4 0.66 1.94 1.64 0.84 OK 2.05 1.06 1.4 10.18 1.411.04 0.95 0.690.58 17.59 0.92 0.63 KK 2.15 1.32 1.66 10.36 4.588.25 0.5 0.550.46 6.93 0.72 0.48 C opyright © 2011 SciRes. JEP 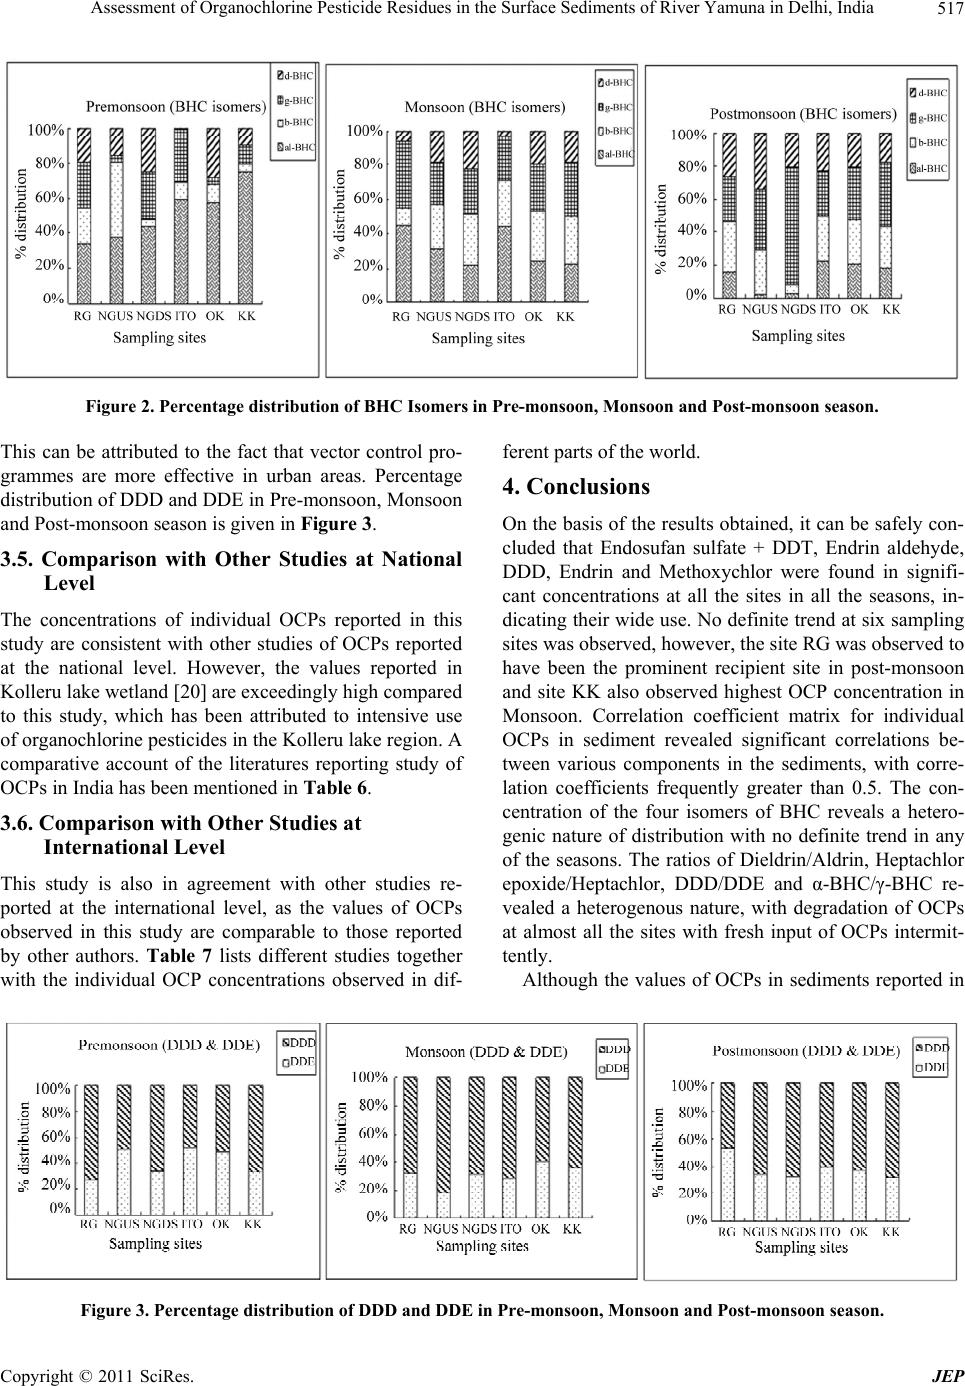 Assessment of Organochlorine Pesticide Residues in the Surface Sediments of River Yamuna in Delhi, India517 Figure 2. Percentage distribution of BHC Isomers in Pre-monsoon, Monsoon and Post-monsoon season. This can be attributed to the fact that vector control pro- grammes are more effective in urban areas. Percentage distribution of DDD and DDE in Pre-monsoon, Monsoon and Post-monsoon season is given in Figure 3. 3.5. Comparison with Other Studies at National Level The concentrations of individual OCPs reported in this study are consistent with other studies of OCPs reported at the national level. However, the values reported in Kolleru lake wetland [20] are exceedingly high compared to this study, which has been attributed to intensive use of organochlorine pesticides in the Kolleru lake region. A comparative account of the literatures reporting study of OCPs in India has been mentioned in Table 6. 3.6. Comparison with Other Studies at International Level This study is also in agreement with other studies re- ported at the international level, as the values of OCPs observed in this study are comparable to those reported by other authors. Table 7 lists different studies together with the individual OCP concentrations observed in dif- ferent parts of the world. 4. Conclusions On the basis of the results obtained, it can be safely con- cluded that Endosufan sulfate + DDT, Endrin aldehyde, DDD, Endrin and Methoxychlor were found in signifi- cant concentrations at all the sites in all the seasons, in- dicating their wide use. No definite trend at six sampling sites was observed, however, the site RG was observed to have been the prominent recipient site in post-monsoon and site KK also observed highest OCP concentration in Monsoon. Correlation coefficient matrix for individual OCPs in sediment revealed significant correlations be- tween various components in the sediments, with corre- lation coefficients frequently greater than 0.5. The con- centration of the four isomers of BHC reveals a hetero- genic nature of distribution with no definite trend in any of the seasons. The ratios of Dieldrin/Aldrin, Heptachlor epoxide/Heptachlor, DDD/DDE and α-BHC/γ-BHC re- vealed a heterogenous nature, with degradation of OCPs at almost all the sites with fresh input of OCPs intermit- tently. Although the values of OCPs in sediments reported in Figure 3. Percentage distribution of DDD and DDE in Pre-monsoon, Monsoon and Post-monsoon season. Copyright © 2011 SciRes. JEP 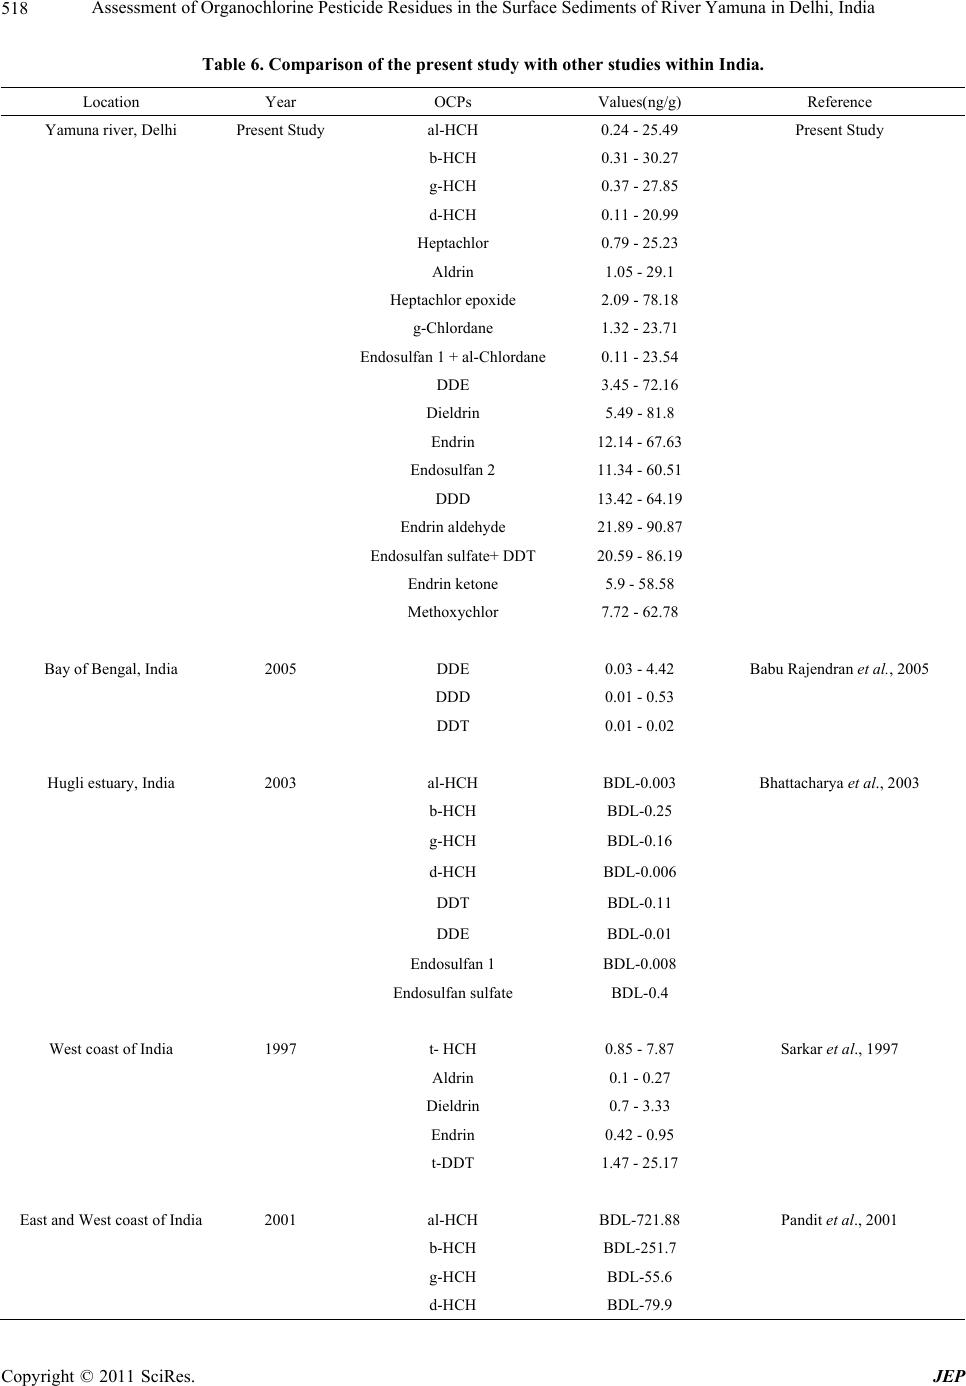 Assessment of Organochlorine Pesticide Residues in the Surface Sediments of River Yamuna in Delhi, India 518 Table 6. Comparison of the present study with other studies within India. Location Year OCPs Values(ng/g) Reference Yamuna river, Delhi Present Study al-HCH 0.24 - 25.49 Present Study b-HCH 0.31 - 30.27 g-HCH 0.37 - 27.85 d-HCH 0.11 - 20.99 Heptachlor 0.79 - 25.23 Aldrin 1.05 - 29.1 Heptachlor epoxide 2.09 - 78.18 g-Chlordane 1.32 - 23.71 Endosulfan 1 + al-Chlordane 0.11 - 23.54 DDE 3.45 - 72.16 Dieldrin 5.49 - 81.8 Endrin 12.14 - 67.63 Endosulfan 2 11.34 - 60.51 DDD 13.42 - 64.19 Endrin aldehyde 21.89 - 90.87 Endosulfan sulfate+ DDT 20.59 - 86.19 Endrin ketone 5.9 - 58.58 Methoxychlor 7.72 - 62.78 Bay of Bengal, India 2005 DDE 0.03 - 4.42 Babu Rajendran et al., 2005 DDD 0.01 - 0.53 DDT 0.01 - 0.02 Hugli estuary, India 2003 al-HCH BDL-0.003 Bhattacharya et al., 2003 b-HCH BDL-0.25 g-HCH BDL-0.16 d-HCH BDL-0.006 DDT BDL-0.11 DDE BDL-0.01 Endosulfan 1 BDL-0.008 Endosulfan sulfate BDL-0.4 West coast of India 1997 t- HCH 0.85 - 7.87 Sarkar et al., 1997 Aldrin 0.1 - 0.27 Dieldrin 0.7 - 3.33 Endrin 0.42 - 0.95 t-DDT 1.47 - 25.17 East and West coast of India 2001 al-HCH BDL-721.88 Pandit et al., 2001 b-HCH BDL-251.7 g-HCH BDL-55.6 d-HCH BDL-79.9 C opyright © 2011 SciRes. JEP  Assessment of Organochlorine Pesticide Residues in the Surface Sediments of River Yamuna in Delhi, India519 DDE BDL-464.55 DDD BDL-17.88 DDT BDL-109.5 Aldrin BDL-3 Endosulfan 1 BDL-1.4 Endosulfan 2 BDL-0.1 Hugli estuary, northeast India 2005 al-HCH 0.05 - 0.26 Guzzella et al.,2005 b-HCH <0.05 - 0.06 g-HCH 0.06 - 0.15 d-HCH <0.05 DDE <0.01 - 0.39 DDD <0.01 - 0.35 DDT 0.12 - 1.29 Dieldrin <0.05 Endrin <0.05 Methoxychlor <0.1 Himalayan Lakes 1997 DDE <0.4 - 10.48 Galassi et al.,1997 DDD <0.4 - 0.63 DDT 0.44 - 5.84 g-HCH 1.17 - 2.89 HCB ND - 1.10 Yamuna river, Delhi, India 1999 t-DDT 17.10 - 236.62 Sethi et al.,1999 t-HCH 2.635 - 36.265 Kolleru lake wetland, India 2006 al-BHC 22.4 - 174.2 μg/g Amaraneni, 2006 g-BHC 44.2 - 234 μg/g Endosulfan 89.6 - 238 μg/g Dieldrin BDL - 19.6 μg/g DDT BDL - 128.6 μg/g Table 7. Comparison of the present study with other studies at the International level. Location Year OCPs Values(ng/g) Reference Yamuna river, Delhi 2006 al-HCH 0.24 - 25.49 Present Study, 2006 b-HCH 0.31 - 30.27 g-HCH 0.37 - 27.85 d-HCH 0.11 - 20.99 Heptachlor 0.79 - 25.23 Aldrin 1.05 - 29.1 Heptachlor epoxide 2.09 - 78.18 g-Chlordane 1.32 - 23.71 Endosulfan 1 + al-Chlordane0.11 - 23.54 DDE 3.45 - 72.16 Dieldrin 5.49 - 81.8 Copyright © 2011 SciRes. JEP  Assessment of Organochlorine Pesticide Residues in the Surface Sediments of River Yamuna in Delhi, India 520 Endrin 12.14 - 67.63 Endosulfan 2 11.34 - 60.51 DDD 13.42 - 64.19 Endrin aldehyde 21.89 - 90.87 Endosulfan sulfate + DDT 20.59 - 86.19 Endrin ketone 5.9 - 58.58 Methoxychlor 7.72 - 62.78 Coastal marine sediment, Singapore2005 al-HCH 0.9 - 9.3 Wurl and Obbard, 2005 b-HCH 0.7 - 11.1 g-HCH <0.7 - 13.4 d-HCH 0.9 - 13.3 DDT <0.5 - 4.2 DDD 1.3 - 4.0 DDE 0.6 - 4.7 al-Chlordane <0.3 - 9.0 g-Chlordane 1.2 - 10 Heptachlor <0.9 - 9.0 Heptachlor epoxide <0.7 - 6.8 Aldrin <0.3 - 1.4 Dieldrin <1.3 - 3.4 Endrin <1.3 - 4.0 Endrin aldehyde <2.0 - 4.2 Endosulfan 1 <0.9 - 2.2 Endosulfan 2 <1.0 - 1.6 Endosulfan sulfate <0.7 - 1.3 Methoxychlor <0.4 - 1.2 River Po sediment, 2002 DDT 0.6 - 3.1 Camusso et al.,2002 DDD 0.4 - 1.8 DDE 0.8 - 11.1 Ebro river, Mediterranean Sea 2006 DDT 1.3 - 7.2 Gomez-Gutierrez et al., 2006 Lindane 0.54 - 5.64 HCB 0.43 - 1.21 Paranoa lake, Brazil 1999 HCH 0.49 - 0.9 Caldas et al., 1999 Heptachlor epoxide 0.14 - 2.0 DDE 0.52 - 12.6 Coastal lagoon watershed, Argentina2001 HCH 57 - 156 Menone et al., 2001 Heptachlor <0.1 - 2 Heptachlor epoxide 581 - 1302 Dieldrin 3.0 - 14 Endrin <0.1 - 17 Endosulfan 1 0.2 - 3.0 Endosulfan 2 <0.2 - 11 Endosulfan sulfate 4.0 - 58 Methoxychlor <0.2 - 127 C opyright © 2011 SciRes. JEP  Assessment of Organochlorine Pesticide Residues in the Surface Sediments of River Yamuna in Delhi, India521 Bay of Ohuira, Mexico 2002 d-HCH 11 - 119 Osuna-Flores and Riva, 2002 DDT BDL-26 DDE 12 - 123 Endosulfan 1 BDL-45 Heptachlor BDL-57 Heptachlor epoxide 20 - 132 Haleji lake, Pakistan 2002 HCB 0.4 - 1.7 Sanpera et al., 2002 DDE 1.4 - 10.3 Stream sediment, Spain 2005 al-HCH 29 - 387 Gonzalez-Lopez et.al.,2005 b-HCH 45 - 392 Farming community, Ghana 2001 HCB 0.9 Ntow, 2001 Lindane 3.2 DDE 0.46 Heptachlor epoxide 0.63 Endosulfan 1 0.19 Endosulfan 2 0.13 Endosulfan sulfate 0.23 Lake Orta sediments, Italy 1997 al-HCH 0.04 - 0.61 Guzzella, 1997 b-HCH 0.07 - 11.03 g-HCH 0.24 - 13.73 DDT 0.14 - 9.02 DDD 0.03 - 58.38 DDE 0.0 - 1.47 Tampa Bay, Florida 2004 al-HCH 0.09 Grabe and Barro, 2004 b-HCH 0.16 g-HCH 0.19 d-HCH 0.23 DDT 0.31 DDD 0.49 DDE 0.81 Chlordane 1.76 Heptachlor 0.78 Heptachlor epoxide 0.04 Aldrin 0.23 Dieldrin 0.33 Endrin 0.18 Endrin aldehyde 0.1 Endosulfan 1 0.53 Endosulfan 2 0.12 Endosulfan sulfate 0.18 Methoxychlor 0.1 US Arctic lakes 1997 al-HCH 0.04 Allen-Gil et al., 1997 g-HCH 0.05 g-Chl ND Copyright © 2011 SciRes. JEP  Assessment of Organochlorine Pesticide Residues in the Surface Sediments of River Yamuna in Delhi, India Copyright © 2011 SciRes. JEP 522 Heptachlor epoxide ND Endosulfan 2 ND DDT 0.12 DDD 0.06 DDE 0.03 Uluabat lake, Turkey 2006 al-HCH 311 - 715 Barlas et al., 2006 b-HCH ND-559 g-HCH ND-405 HCB 158 - 556 Aldrin ND-446 Heptachlor epoxide 108 - 1533 Endosulfan 1 ND DDE ND-1179 Endrin ND-580 Endosulfan 2 ND-248.4 DDT ND-1553 Pearl river estuary 2001 al-HCH ND-1.37 Li et al., 2001 b-HCH ND-1.14 g-HCH ND-0.72 d-HCH 0.43-3.71 DDT 1.27-6.65 DDD ND-10.8 DDE ND-4.09 Hep 0.47 - 1.62 Heptachlor epoxide 0.19 - 4.46 Aldrin ND-0.92 Dieldrin ND-0.19 Endrin ND-0.61 Endrin aldehyde ND-0.17 Endrin ketone 1.65 - 7.86 Endosulfan 1 ND-1.57 Endosulfan 2 ND-1.06 Endosulfan sulfate ND-41.8 Methoxychlor ND-1.49 the study are comparable to those by others in India as well as other parts of the world, they are much higher at some sites compared to the standards established for the sediments. In the present study, at all the sampling sites, the values of Endosulfan II and Methoxychlor were found to be much higher than the standard (1.4 and 1.9 ng/g) [21]. As per CPCB, India [22] the environmental standards for BHC and DDT are 10 μg/L each respec- tively. The use of persistent OCPs have been banned or severely restricted to use only in small number of coun- tries with serious public health problems such as malaria and other parasitic diseases. However, they are still used in many developing countries including India in very large quantities, mainly because of their low cost and effectiveness. It is obvious, therefore, that the question is still a matter of concern for the global society and a call for worldwide attention through international bodies. Thus, in order to have a comprehensive picture of OCP distribution and their seasonal variation in Yamuna river sediments, a detailed study is required. 5. Acknowledgements The authors are grateful to University Grants Commis- sion, New Delhi, for providing the funds in the form of JRF (Junior Research Fellowship) to the corresponding author. They would also like to thank Mrs. Irani Muk- herjee for her valuable inputs during experimentation. The corresponding author would also like to thank Dr.  Assessment of Organochlorine Pesticide Residues in the Surface Sediments of River Yamuna in Delhi, India523 Jamson Masih for his contribution in statistical analysis and interpretation of the data. REFERENCES [1] W. J. Ntow, “Organochlorine Pesticides in Water, Sedi- ment, Crops, and Human fluids in a Farming Community in Ghana,” Archives of Environmental Contamination and Toxicology, Vol. 40, No. 4, 2001, pp. 557-563. doi:10.1007/s002440010210 [2] P. K. Sethi and A. K. Bhattacharya, “Current Trends of Some Organochlorinated Pesticides in Yamuna River Sediments around Delhi,” Environmental Pollution Con- trol Journal, Vol. 2, No. 3, 1999, pp. 40-43. [3] S. Tanabe, H. Iwata and R. Tatsukawa, “Global Con- tamination by Persistent Organochlorines and Their Eco- toxicological Impact on Marine Mammals,” Science of the Total Environment, Vol. 154, 1994, pp. 397-403. doi:10.1016/0048-9697(94)90086-8 [4] UNEP, “Global Report on Regionally Based Assessment of Persistent Toxic Substances,” Geneva, Switzerland, UNEP Chemicals, 2003. [5] R. J. Gibbs, “Mechanisms of Trace Metal Transport In Rivers,” Science, Vol. 180, 1973, pp. 71-72. doi:10.1126/science.180.4081.71 [6] L. Hakanson, “Sediment variability,” In: G. A. Burton Jr, Eds., Sediment Toxicity Assessment, Boca Raton, Lewis Publishers, FL, 1992, pp. 19-36. [7] X. Li, Z. Shen, O. W. H. Wai and Y. Li, “Chemical Parti- tioning of Heavy Metal Contaminants in Sediment of the Pearl River Estuary,” Chemical Speciation and Bioavail- ability, Vol. 12, No. 1, 2000, pp. 17-25. doi:10.3184/095422900782775607 [8] A. Sodergren, “Trends in Water Pollution, Consequences for Ecotoxicology”, In: J. T. Zelikoff, Ed., Ecotoxicology: Responses, Biomarkers and Risk Assessment, an OECD Workshop, SOS Publications, Fair Haven, 1997, pp. 15- 23. [9] K. P. Singh, A. Malik and S. Sinha, “Persistent Or- ganochlorine Pesticide Residues in Soil and Surface Wa- ter of Northern Indo-Gangetic Alluvial Plains,” Environ- mental Monitoring and Assessment, Vol. 125, 2007, pp. 47-155. doi:10.1007/s10661-006-9247-0 [10] T. M. Travers, M. Beretta and M. C. Costa, “Ratio of DDT/DDE in the All Saints Bay, Brazil and its use in en- vironmental management,” Chemosphere, Vol. 38, No. 6, 1999, pp. 1445-1452. doi:10.1016/S0045-6535(98)00546-3 [11] D. Yuan, D. Yang, T. L. Wade and Y. Qian, “Status of Persistent Organic Pollutants in the Sediment from Sev- eral Estuaries in China,” Environmental Pollution, Vol. 114, No. 1, 2001, pp. 101-111. doi:10.1016/S0269-7491(00)00200-1 [12] K. N. Mehrotra, “Status of Insecticide Resistance in In- sect Pests,” In: B. Dhaliwal and B. Singh, Eds., Pesticides — Their Ecological Impact in Developing Countries, New Delhi7 Commonwealth Publishers, 1993, p. 30. [13] J. E. Cavanagh, K. A. Burns, G. J. Brunskill and R. J. Coventry, “Organochlorine Pesticide Residues in Soils and Sediments of the Herbert and Burdekin River Re- gions, North Queensland—Implications for Contamina- tion of the Great Barrier Reef,” Marine Pollution Bulletin, Vol. 39, No. 112, 1999, pp. 367-375. doi:10.1016/S0025-326X(99)00058-2 [14] R. D. Wauchope, T. M. Buttler, A. G. Hornsby, P. W. M. Augustijn Beckers and J. P. Burt, “SCS/ARS/CES Pesti- cide Properties Database for Environmental Decision Making,” Reviews of Environmental Contamination and Toxicology, Vol. 123, 1992, pp. 1-157. [15] H. Kidd and D. R. James, (Eds.), “The Agrochemicals Handbook,” Third Edition, Royal Society of Chemistry Information Services, Cambridge, UK, 1991. [16] ATSDR: U.S. Department of Health and Human Services, Public Health Service Agency for Toxic Substances and Disease Registry, September 2002. [17] L. H. Keith, “Environmental Endocrine Disrupters: A Handbook of Property Data,” Wiley, New York, 1997, p. 621. [18] C. Sanpera, X. Ruiz, G. A. Llorente, L. Jover and R. Ja- been, “Persistent Organochlorine Compounds in Sedi- ment and Biota from the Haleji Lake: A Wildlife Sanctu- ary in South Pakistan,” Bulletin of Environmental Con- tamination and Toxicology, Vol. 68, 2002, pp. 237-244. doi:10.1007/s001280244 [19] X. D. Li, B. X. Mai, G. Zhang, G. Y. Sheng, J. M. Fu, S. M. Pan, O. W. H. Wai and Y. S. Li, “Distribution of Or- ganochlorine Pesticides in a Sediment Profile of the Pearl River Estuary,” Bulletin of Environmental Contamination and Toxicology, Vol. 67, 2001, pp. 871-880. doi:10.1007/s001280203 [20] A. S. Rao, “Distribution of pesticides, PAHs and Heavy Metals in Prawn Ponds near Kolleru Lake Wetland, In- dia,” Environment International, Vol. 32, No. 3, 2006, pp. 294-302. doi:10.1016/j.envint.2005.06.001 [21] CCME, 2002, Canadian Council of Ministers of the En- vironment, 2002, Canadian Environmental Quality Guidelines, Winnipeg Canada. [22] http://www.cpcb.nic.in/standard [23] R. Babu Rajendran, T. Imagawaa, H. Tao and R. Ramesh, “Distribution of PCBs, HCHs and DDTs, and their ecotoxicological implications in Bay of Bengal, India,” Environment International, Vol. 31, No. 4, 2005, pp. 503- 512. doi:10.1016/j.envint.2004.10.009 [24] B. Bhattacharya, S. K. Sarkar and N. Mukherjee, “Or- ganochlorine Pesticide Residues in Sediments of a Tropi- cal Mangrove Estuary, India: Implications for Monitor- ing,” Environment International, Vol. 29, 2003, pp. 587- 592. doi:10.1016/S0160-4120(03)00016-3 [25] A. Sarkar, R. Nagarajan, S. P. Chaphadkar and S. Y. S. Singbal, “Contamination of Organochlorine Pesticides in Sediments from the Arabian Sea along the West Coast of India,” Water Research, Vol. 31, No. 2, 1997, pp. 195- 200. doi:10.1016/S0043-1354(96)00210-2 Copyright © 2011 SciRes. JEP  Assessment of Organochlorine Pesticide Residues in the Surface Sediments of River Yamuna in Delhi, India Copyright © 2011 SciRes. JEP 524 [26] G. G. Pandit, A. M. Mohan Rao, S. K. Jha, T. M. Krish- namoorthy, S. P. Kale, K. Raghu and N. B. K. Murthy, “Monitoring of Organochlorine Pesticide Residues in the Indian Marine Environment,” Chemosphere, Vol. 44, No. 2, 2001, pp. 301-305. doi:10.1016/S0045-6535(00)00179-X [27] L. Guzzella, C. Roscioli, L. Vigano, M. Saha, S. K. Sarkar and A. Bhattacharya, “Evaluation of the Concen- tration of HCH, DDT, HCB, PCB and PAH in the Sedi- ments along the Lower Stretch of Hugli Estuary, West Bengal, Northeast India,” Environment International, Vol. 31, No. 4, 2005, pp. 523-534. doi:10.1016/j.envint.2004.10.014 [28] S. Galassi, S. Valsecchi and G. A. Tartari, “The distribu- tion of PCB’s and Chlorinated Pesticides in two Con- nected Himalayan Lakes,” Water, Air and Soil Pollution, Vol. 99, No. 1-4, 1997, pp. 717-725. doi:10.1007/BF02406911 [29] O. Wurl and J. P. Obbard, “Organochlorine Pesticides, Polychlorinated Biphenyls and Polybrominated Diphenyl Ethers in Singapore’s Coastal Marine Sediments,” Che- mosphere, Vol. 58, No. 11, 2005, pp. 925-933. doi:10.1016/j.chemosphere.2004.09.054 [30] M. Camusso, S. Galassi and D. Vignati, “Assessment of River Po Sediment Quality by Micropollutant Analysis,” Water Research, Vol. 36, No. 10, 2002, pp. 2491-2504. doi:10.1016/S0043-1354(01)00485-7 [31] A. I. Gomez-Gutierrez, E. Jover, L. Bodineau, J. Albaiges and J. M. Bayona, “Organic Contaminant Loads into the Western Mediterranean Sea: Estimate of Ebro River in- puts,” Chemosphere, Vol. 65, No. 2, 2006, pp. 224-236. doi:10.1016/j.chemosphere.2006.02.058 [32] E. D. Caldas, R. Coelho, L. C. K. R. Souza and S. C. Siba, “Organochlorine Pesticides in Water, Sediment, and Fish of Paranoa Lake of Brasilia, Brazil,” Bulletin of En- vironmental Contamination and Toxicology, Vol. 62, No. 2, 1999, pp. 199-206. doi:10.1007/s001289900860 [33] M. L. Menone, J. E. Aizpun de Moreno, V. J. Moreno, A. L. Lanfranchi, T. L. Metcalfe and C. D. Metcalfe, “Or- ganochlorine Pesticides and PCBs in a Southern Atlantic Coastal Lagoon Watershed, Argentina,” Archives of En- vironmental Contamination and Toxicology, Vol. 40, 2001, pp. 355-362. doi:10.1007/s002440010183 [34] I. Osuna-Flores and M. C. Riva, Environmental Con- tamination and Toxicology, Vol. 68, 2002, pp. 532-539. [35] N. Gonzalez-Lopez, R. Rial-Otero, B. Cancho-Grande, J. Simal-Gandara and B. Soto-Gonzalez, “Occurrence of Organochlorine Pesticides in Stream Sediments from an Industrial Area,” Archives of Environmental Contamina- tion and Toxicology, Vol. 48, No. 3, 2005, pp. 296-302. doi:10.1007/s00244-004-0070-8 [36] A. Grabe Stephen, Joseph Barron, “Sediment Contamina- tion, By Habitat, In the Tampa Bay Estuarine System (1993-1999): PAHs, Pesticides and PCBs,” Environ- mental Monitoring and Assessment, Vol. 91, No. 1-3, 2004, pp. 105-144. [37] S. M. Allen-Gil, C. P. Gubala, D. H. Landers, B. K. Lasorsa, , E. A. Crecelius and L. R. Curtis, “Heavy Metal Accumulation in Sediment and Freshwater Fish in U.S. Arctic Lakes,” Environmental Toxicology and Chemistry, Vol. 16, 1997, pp. 733-741. doi:10.1002/etc.5620160418 [38] N. Barlas, I. Very and N. Akbulut, “The Contamination Levels of Organochlorine Pesticides in Water and Sedi- ment Samples in Lake Uluabat, Turkey,” Environmental Monitoring and Assessment, Vol. 118, 2006, pp. 383-391. doi:10.1007/s10661-006-1504-8 [39] L. Guzzella, “PCBs and Organochlorine Pesticides in Lake Orta (Northern Italy) Sediments,” Water, Air and Soil Pollution, Vol. 99, No. 1-4, 1997, pp. 245-254. doi:10.1007/BF02406864
|