Paper Menu >>
Journal Menu >>
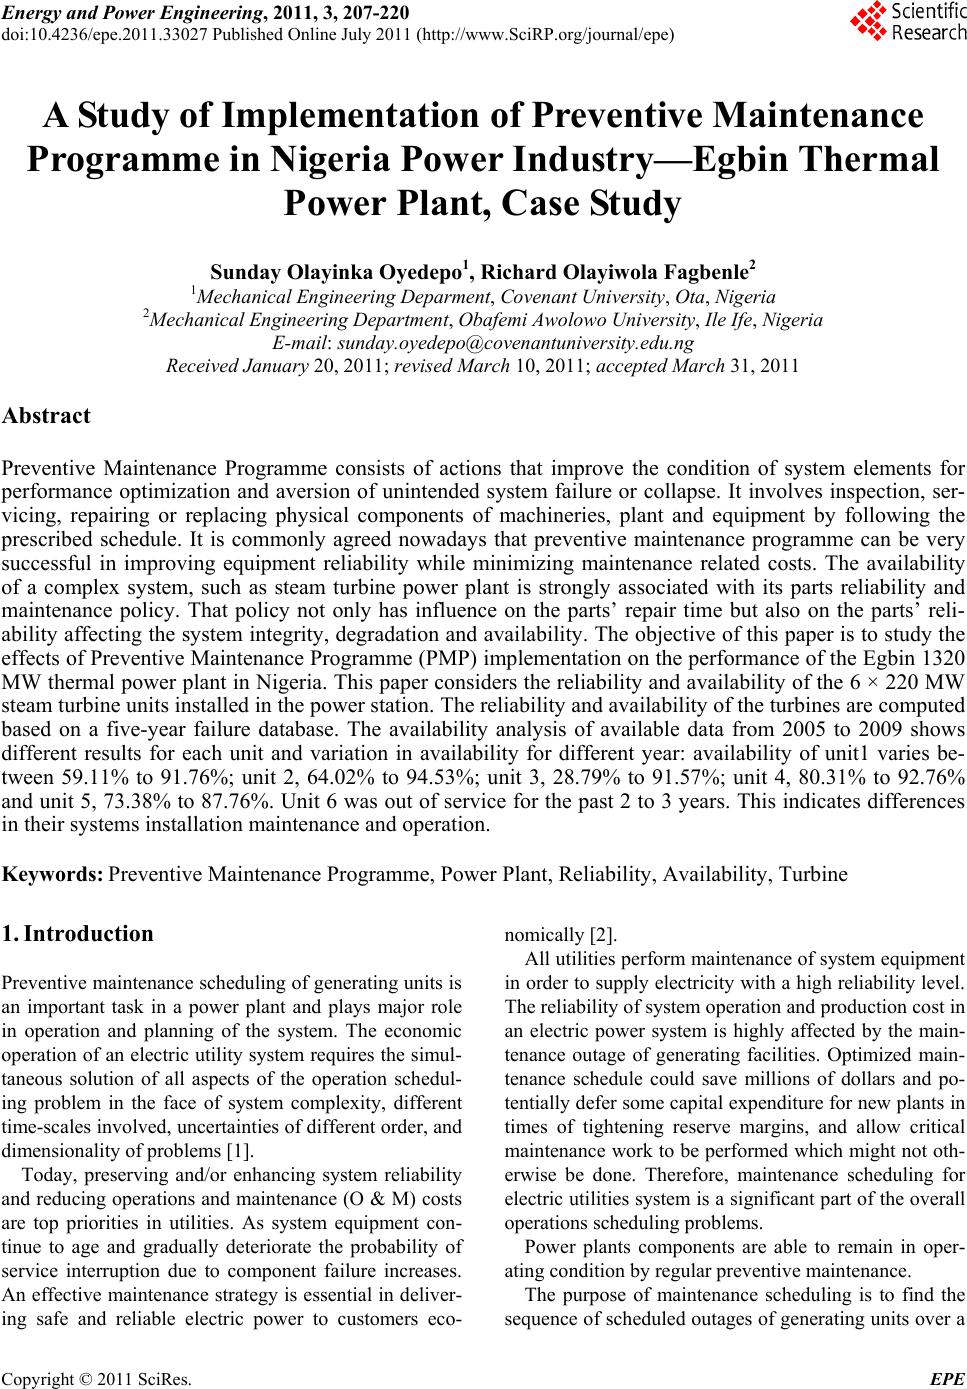 Energy and Power En gi neering, 2011, 3, 207-220 doi:10.4236/epe.2011.33027 Published Online July 2011 (http://www.SciRP.org/journal/epe) Copyright © 2011 SciRes. EPE A Study of Implementation of Preventive Maintenance Programme in Nigeria Power Industry—Egbin Thermal Power Plant, Case St udy Sunday Olayinka Oyedepo1, Richard Olayiwola Fagbenle2 1Mechanical Engineering Deparment, Covenant University, Ota, Nigeria 2Mechanical Engineering Department, Obafemi Awolowo University, Ile Ife, Nigeria E-mail: sunday.oyedepo@covenantuniversity.edu.ng Received January 20, 2011; revised March 10, 2011; accepted March 31, 2011 Abstract Preventive Maintenance Programme consists of actions that improve the condition of system elements for performance optimization and aversion of unintended system failure or collapse. It involves inspection, ser- vicing, repairing or replacing physical components of machineries, plant and equipment by following the prescribed schedule. It is commonly agreed nowadays that preventive maintenance programme can be very successful in improving equipment reliability while minimizing maintenance related costs. The availability of a complex system, such as steam turbine power plant is strongly associated with its parts reliability and maintenance policy. That policy not only has influence on the parts’ repair time but also on the parts’ reli- ability affecting the system integrity, degradation and availability. The objective of this paper is to study the effects of Preventive Maintenance Programme (PMP) implementation on the performance of the Egbin 1320 MW thermal power plant in Nigeria. This paper considers the reliability and availability of the 6 × 220 MW steam turbine units installed in the power station. The reliability and availability of the turbines are computed based on a five-year failure database. The availability analysis of available data from 2005 to 2009 shows different results for each unit and variation in availability for different year: availability of unit1 varies be- tween 59.11% to 91.76%; unit 2, 64.02% to 94.53%; unit 3, 28.79% to 91.57%; unit 4, 80.31% to 92.76% and unit 5, 73.38% to 87.76%. Unit 6 was out of service for the past 2 to 3 years. This indicates differences in their systems installation maintenance and operation. Keywords: Preventive Maintenance Programme, Power Plant, Reliability, Availability, Turbine 1. Introduction Preventive maintenance scheduling of generating units is an important task in a power plant and plays major role in operation and planning of the system. The economic operation of an electric utility system requires the simul- taneous solution of all aspects of the operation schedul- ing problem in the face of system complexity, different time-scales involved, uncertainties of different order, and dimensionality of problems [1]. Today, preserving and/or enhancing system reliability and reducing operations and maintenance (O & M) costs are top priorities in utilities. As system equipment con- tinue to age and gradually deteriorate the probability of service interruption due to component failure increases. An effective maintenance strategy is essential in deliver- ing safe and reliable electric power to customers eco- nomically [2]. All utilities perform maintenance of system equipment in order to supply electricity with a high reliability level. The reliability of system operation and production cost in an electric power system is highly affected by the main- tenance outage of generating facilities. Optimized main- tenance schedule could save millions of dollars and po- tentially defer some capital expenditure for new plants in times of tightening reserve margins, and allow critical maintenance work to be performed which might not oth- erwise be done. Therefore, maintenance scheduling for electric utilities system is a significant part of the overall operations scheduling problems. Power plants components are able to remain in oper- ating condition by regular preventive maintenance. The purpose of maintenance scheduling is to find the sequence of scheduled outages of generating units over a 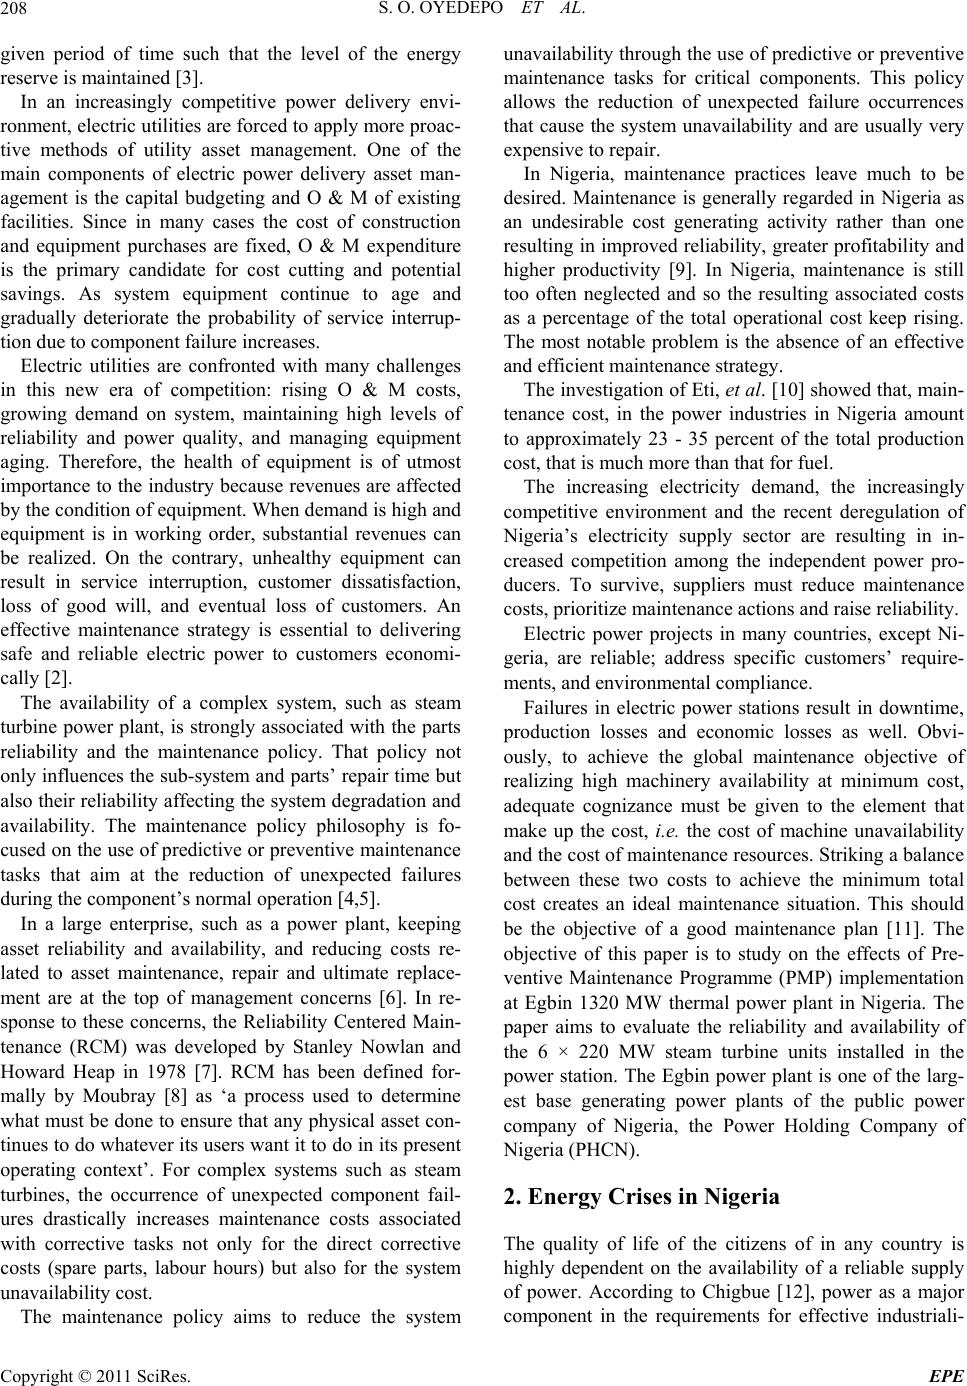 S. O. OYEDEPO ET AL. 208 given period of time such that the level of the energy reserve is maintained [3]. In an increasingly competitive power delivery envi- ronment, electric utilities are forced to apply more proac- tive methods of utility asset management. One of the main components of electric power delivery asset man- agement is the capital budgeting and O & M of existing facilities. Since in many cases the cost of construction and equipment purchases are fixed, O & M expenditure is the primary candidate for cost cutting and potential savings. As system equipment continue to age and gradually deteriorate the probability of service interrup- tion due to component failure increases. Electric utilities are confronted with many challenges in this new era of competition: rising O & M costs, growing demand on system, maintaining high levels of reliability and power quality, and managing equipment aging. Therefore, the health of equipment is of utmost importance to the industry because revenues are affected by the condition of equipment. When demand is high and equipment is in working order, substantial revenues can be realized. On the contrary, unhealthy equipment can result in service interruption, customer dissatisfaction, loss of good will, and eventual loss of customers. An effective maintenance strategy is essential to delivering safe and reliable electric power to customers economi- cally [2]. The availability of a complex system, such as steam turbine power plant, is strongly associated with the parts reliability and the maintenance policy. That policy not only influences the sub-system and parts’ repair time but also their reliability affecting the system degradation and availability. The maintenance policy philosophy is fo- cused on the use of predictive or preventive maintenance tasks that aim at the reduction of unexpected failures during the component’s normal operation [4,5]. In a large enterprise, such as a power plant, keeping asset reliability and availability, and reducing costs re- lated to asset maintenance, repair and ultimate replace- ment are at the top of management concerns [6]. In re- sponse to these concerns, the Reliability Centered Main- tenance (RCM) was developed by Stanley Nowlan and Howard Heap in 1978 [7]. RCM has been defined for- mally by Moubray [8] as ‘a process used to determine what must be done to ensure that any physical asset con- tinues to do whatever its users want it to do in its present operating context’. For complex systems such as steam turbines, the occurrence of unexpected component fail- ures drastically increases maintenance costs associated with corrective tasks not only for the direct corrective costs (spare parts, labour hours) but also for the system unavailability cost. The maintenance policy aims to reduce the system unavailability through the use of predictive or preventive maintenance tasks for critical components. This policy allows the reduction of unexpected failure occurrences that cause the system unavailability and are usually very expensive to repair. In Nigeria, maintenance practices leave much to be desired. Maintenance is generally regarded in Nigeria as an undesirable cost generating activity rather than one resulting in improved reliability, greater profitability and higher productivity [9]. In Nigeria, maintenance is still too often neglected and so the resulting associated costs as a percentage of the total operational cost keep rising. The most notable problem is the absence of an effective and efficient maintenance strategy. The investigation of Eti, et al. [10] showed that, main- tenance cost, in the power industries in Nigeria amount to approximately 23 - 35 percent of the total production cost, that is much more than that for fuel. The increasing electricity demand, the increasingly competitive environment and the recent deregulation of Nigeria’s electricity supply sector are resulting in in- creased competition among the independent power pro- ducers. To survive, suppliers must reduce maintenance costs, prioritize maintenance actions and raise reliability. Electric power projects in many countries, except Ni- geria, are reliable; address specific customers’ require- ments, and environmental compliance. Failures in electric power stations result in downtime, production losses and economic losses as well. Obvi- ously, to achieve the global maintenance objective of realizing high machinery availability at minimum cost, adequate cognizance must be given to the element that make up the cost, i.e. the cost of machine unavailability and the cost of maintenance resources. Striking a balance between these two costs to achieve the minimum total cost creates an ideal maintenance situation. This should be the objective of a good maintenance plan [11]. The objective of this paper is to study on the effects of Pre- ventive Maintenance Programme (PMP) implementation at Egbin 1320 MW thermal power plant in Nigeria. The paper aims to evaluate the reliability and availability of the 6 × 220 MW steam turbine units installed in the power station. The Egbin power plant is one of the larg- est base generating power plants of the public power company of Nigeria, the Power Holding Company of Nigeria (PHCN). 2. Energy Crises in Nigeria The quality of life of the citizens of in any country is highly dependent on the availability of a reliable supply of power. According to Chigbue [12], power as a major component in the requirements for effective industriali- Copyright © 2011 SciRes. EPE 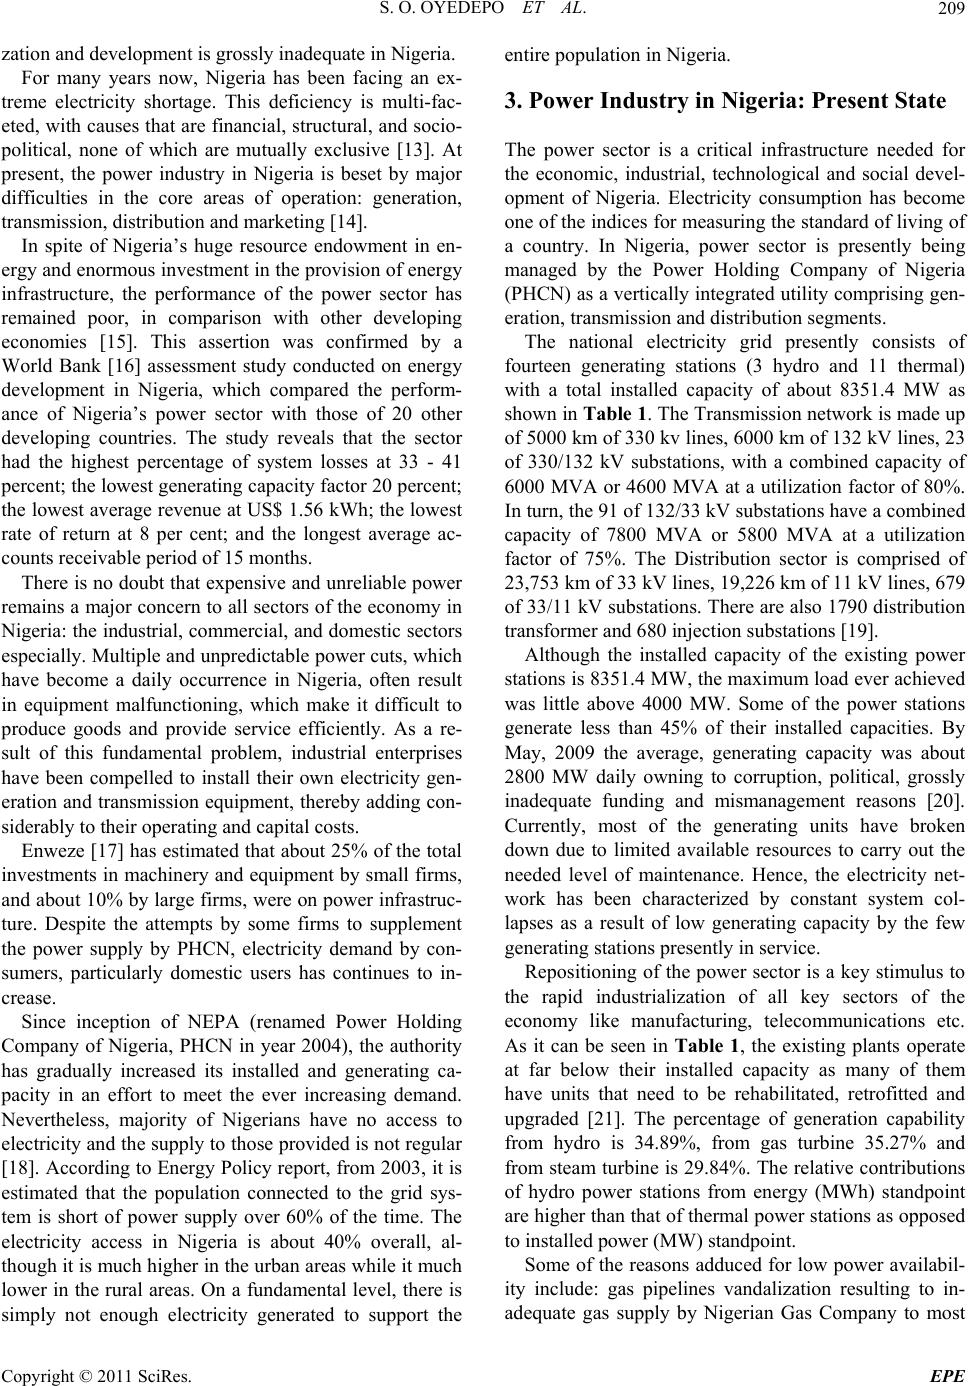 S. O. OYEDEPO ET AL.209 zation and development is grossly inadequate in Nigeria. For many years now, Nigeria has been facing an ex- treme electricity shortage. This deficiency is multi-fac- eted, with causes that are financial, structural, and socio- political, none of which are mutually exclusive [13]. At present, the power industry in Nigeria is beset by major difficulties in the core areas of operation: generation, transmission, distribution and marketing [14]. In spite of Nigeria’s huge resource endowment in en- ergy and enormous investment in the provision of energy infrastructure, the performance of the power sector has remained poor, in comparison with other developing economies [15]. This assertion was confirmed by a World Bank [16] assessment study conducted on energy development in Nigeria, which compared the perform- ance of Nigeria’s power sector with those of 20 other developing countries. The study reveals that the sector had the highest percentage of system losses at 33 - 41 percent; the lowest generating capacity factor 20 percent; the lowest average revenue at US$ 1.56 kWh; the lowest rate of return at 8 per cent; and the longest average ac- counts receivable period of 15 months. There is no doubt that expensive and unreliable power remains a major concern to all sectors of the economy in Nigeria: the industrial, commercial, and domestic sectors especially. Multiple and unpredictable power cuts, which have become a daily occurrence in Nigeria, often result in equipment malfunctioning, which make it difficult to produce goods and provide service efficiently. As a re- sult of this fundamental problem, industrial enterprises have been compelled to install their own electricity gen- eration and transmission equipment, thereby adding con- siderably to their operating and capital costs. Enweze [17] has estimated that about 25% of the total investments in machinery and equipment by small firms, and about 10% by large firms, were on power infrastruc- ture. Despite the attempts by some firms to supplement the power supply by PHCN, electricity demand by con- sumers, particularly domestic users has continues to in- crease. Since inception of NEPA (renamed Power Holding Company of Nigeria, PHCN in year 2004), the authority has gradually increased its installed and generating ca- pacity in an effort to meet the ever increasing demand. Nevertheless, majority of Nigerians have no access to electricity and the supply to those provided is not regular [18]. According to Energy Policy report, from 2003, it is estimated that the population connected to the grid sys- tem is short of power supply over 60% of the time. The electricity access in Nigeria is about 40% overall, al- though it is much higher in the urban areas while it much lower in the rural areas. On a fundamental level, there is simply not enough electricity generated to support the entire population in Nigeria. 3. Power Industry in Nigeria: Present State The power sector is a critical infrastructure needed for the economic, industrial, technological and social devel- opment of Nigeria. Electricity consumption has become one of the indices for measuring the standard of living of a country. In Nigeria, power sector is presently being managed by the Power Holding Company of Nigeria (PHCN) as a vertically integrated utility comprising gen- eration, transmission and distribution segments. The national electricity grid presently consists of fourteen generating stations (3 hydro and 11 thermal) with a total installed capacity of about 8351.4 MW as shown in Table 1. The Transmission network is made up of 5000 km of 330 kv lines, 6000 km of 132 kV lines, 23 of 330/132 kV substations, with a combined capacity of 6000 MVA or 4600 MVA at a utilization factor of 80%. In turn, the 91 of 132/33 kV substations have a combined capacity of 7800 MVA or 5800 MVA at a utilization factor of 75%. The Distribution sector is comprised of 23,753 km of 33 kV lines, 19,226 km of 11 kV lines, 679 of 33/11 kV substations. There are also 1790 distribution transformer and 680 injection substations [19]. Although the installed capacity of the existing power stations is 8351.4 MW, the maximum load ever achieved was little above 4000 MW. Some of the power stations generate less than 45% of their installed capacities. By May, 2009 the average, generating capacity was about 2800 MW daily owning to corruption, political, grossly inadequate funding and mismanagement reasons [20]. Currently, most of the generating units have broken down due to limited available resources to carry out the needed level of maintenance. Hence, the electricity net- work has been characterized by constant system col- lapses as a result of low generating capacity by the few generating stations presently in service. Repositioning of the power sector is a key stimulus to the rapid industrialization of all key sectors of the economy like manufacturing, telecommunications etc. As it can be seen in Table 1, the existing plants operate at far below their installed capacity as many of them have units that need to be rehabilitated, retrofitted and upgraded [21]. The percentage of generation capability from hydro is 34.89%, from gas turbine 35.27% and from steam turbine is 29.84%. The relative contributions of hydro power stations from energy (MWh) standpoint are higher than that of thermal power stations as opposed to installed power (MW) standpoint. Some of the reasons adduced for low power availabil- ity include: gas pipelines vandalization resulting to in- adequate gas supply by Nigrian Gas Company to most e Copyright © 2011 SciRes. EPE  S. O. OYEDEPO ET AL. Copyright © 2011 SciRes. EPE 210 Table 1. Summary of generation capabilities of PHCN power stations as operated in the year 2008 (Jan-Dec). Plant Operator Age (Year) Type Installed Capacity (MW) Average Availability (MW) Availability Factor No of Units installed Current No Available Kainji Jebba Shiroro Egbin AES Ajaokuta Sapele Okpai Afam Delta Geregu Omoku Omotosho Olorunsogo PHCN PHCN PHCN PHCN AES STS PHCN AGIP PHCN PHCN PHCN RS PHCN PHCN 38 to 40 25 22 23 7 NA 26 to 30 3 8 to 45 18 NA 3 1 1 Hydro Hydro Hydro ST GT GT ST/GT GT/ST GT GT GT GT GT GT 760 578.4 600 1320 315 110 1020 480 980 954 414 150 335 335 438.86 529.40 488.82 694.97 233.91 24.88 156.60 394.56 82.12 211.67 305.14 87.27 256.58 271.46 0.58 0.92 0.81 0.53 0.77 0.23 0.15 0.88 0.09 0.24 0.74 0.87 0.77 0.81 8 6 4 6 9 2 10 3 20 18 3 6 8 8 6 4 4 5 9 2 1 3 3 12 3 4 2 2 Total 8351.4 4176.24 0.50 93 45 Source: NCC Oshogbo. thermal power plants, aged plants, outdated equipment (generators, turbines, governors, transformers, and switch gears). In addition to these, the transmission network is radial and overloaded, and suffers from the following constraints [20]: Cannot wheel more than 4000 MW; Has poor voltage profile in most of the network, es- pecially in the North; Inadequate dispatch and control infrastructure; Radial and fragile grid; Frequent system collapses Higher transmission losses of 10% - 15%; Limited national access to electricity of about 40% for households, made up of 81% urban and 18% rural respectively. Some of these constraints might be reduced or re- moved by replacing many of the transformers, strength- ening the transmission and distribution systems and up- grading the switchgear. For the past two decades, the power demand in Nige- ria has been on the increase while available generating capacity remained largely static or even showing a de- creasing long-term trend. The consequence of this was to load shed in order to ensure system stability (maintain equilibrium between available generation and selective demand). The International Energy Institute’s comparative analysis of the per capita consumption of electricity worldwide (Table 2), underscores the stark reality of Nigeria’s power sector. The comparative analysis shows poor state of Nigeria’s power sector, compared with even some of the countries that began as newly independent countries in the 1960s. The challenge now is how reli- able power supply can become accessible to majority of Nigerians at an affordable price. Manufacturers Association of Nigeria (MAN) gave the following Comparative performance indicators shown in Table 3. The data for some Southern Africa Develop- ment Community (SADC) countries such as Botswana and South Africa are comparable to those of USA and France. The performance of the Nigerian power sector on the International Best Practices comparative rating is disgraceful cause for great concern. Perhaps, no other sector feels it as much as the manufacturing/ industrial sector wherein some notable international companies and organizations are on self-generated electricity on 24 hours daily for the 365 days of each year, as confirmed by a 2001 UNIDO. Survey showed that manufacturers generated about 72% of total power required to run their factories on the average. The PHCN feeder reliability is extremely poor, with figures like 120 faults per kilometer per year compared to international best practice of 10 to 20. 4. Maintenance Problems in Nigeria Electric Power Stations Maintenance can be defined as all actions appropriate for retaining an item/equipment in, or restoring it to a given condition. More specifically, maintenance is used to re- pair broken equipments, preserve equipment conditions nd prevent their failure, which ultimately reduces pro- a 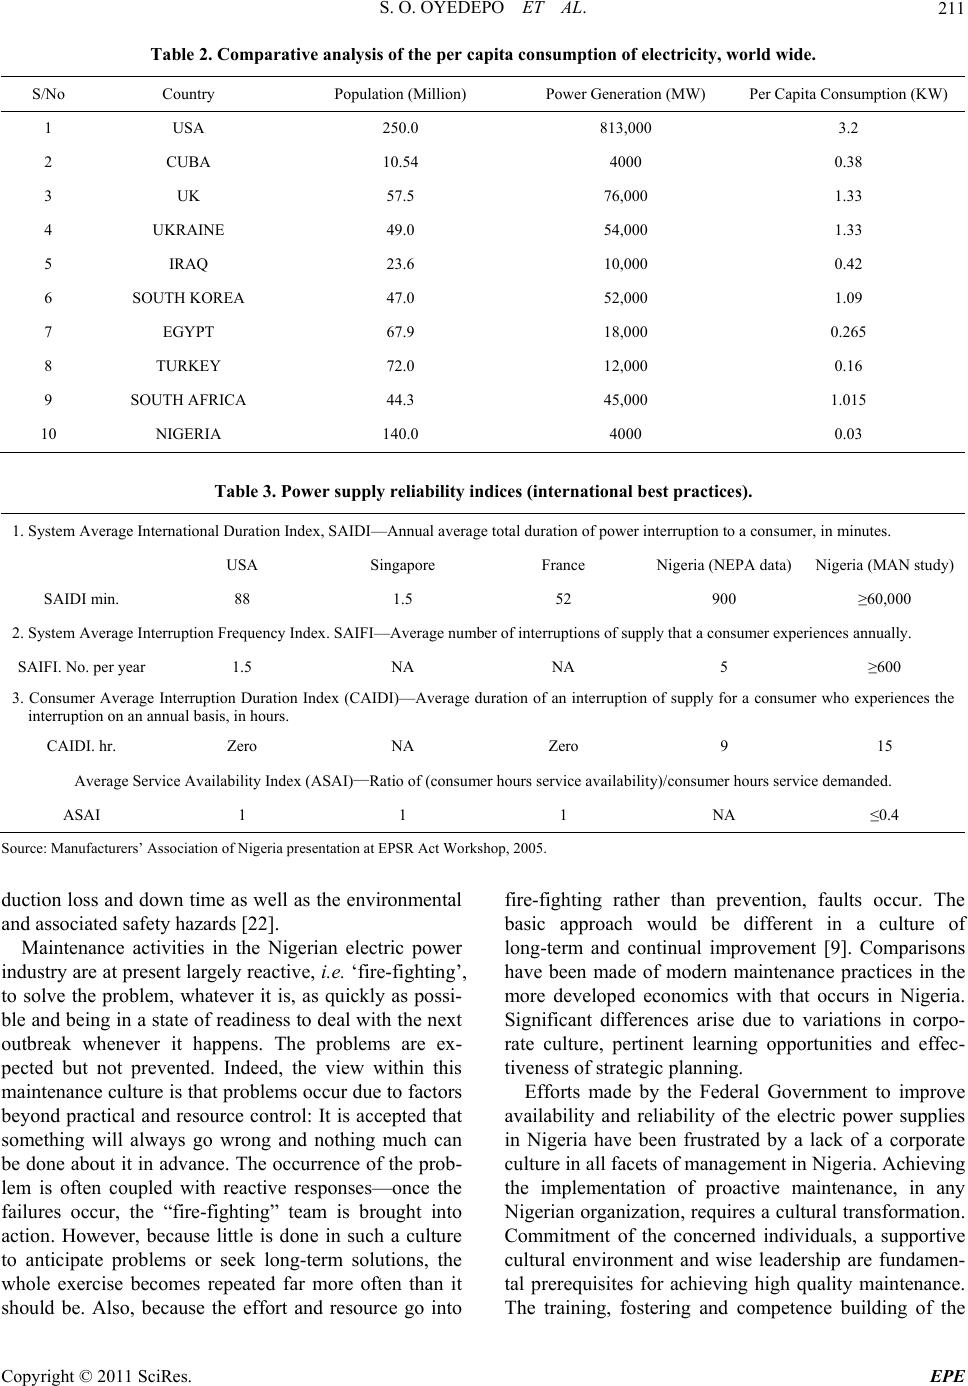 S. O. OYEDEPO ET AL. Copyright © 2011 SciRes. EPE 211 Table 2. Comparative analysis of the per capita consumption of electricity, world wide. S/No Country Population (Million) Power Generation (MW) Per Capita Consumption (KW) 1 USA 250.0 813,000 3.2 2 CUBA 10.54 4000 0.38 3 UK 57.5 76,000 1.33 4 UKRAINE 49.0 54,000 1.33 5 IRAQ 23.6 10,000 0.42 6 SOUTH KOREA 47.0 52,000 1.09 7 EGYPT 67.9 18,000 0.265 8 TURKEY 72.0 12,000 0.16 9 SOUTH AFRICA 44.3 45,000 1.015 10 NIGERIA 140.0 4000 0.03 Table 3. Power supply reliability indices (international best practices). 1. System Average International Duration Index, SAIDI—Annual average total duration of power interruption to a consumer, in minutes. USA Singapore France Nigeria (NEPA data) Nigeria (MAN study) SAIDI min. 88 1.5 52 900 ≥60,000 2. System Average Interruption Frequency Index. SAIFI—Average number of interruptions of supply that a consumer experiences annually. SAIFI. No. per year 1.5 NA NA 5 ≥600 3. Consumer Average Interruption Duration Index (CAIDI)—Average duration of an interruption of supply for a consumer who experiences the interruption on an annual basis, in hours. CAIDI. hr. Zero NA Zero 9 15 Average Service Availability Index (ASAI)—Ratio of (consumer hours service availability)/consumer hours service demanded. ASAI 1 1 1 NA ≤0.4 Source: Manufacturers’ Association of Nigeria presentation at EPSR Act Workshop, 2005. duction loss and down time as well as the environmental and associated safety hazards [22]. Maintenance activities in the Nigerian electric power industry are at present largely reactive, i.e. ‘fire-fighting’, to solve the problem, whatever it is, as quickly as possi- ble and being in a state of readiness to deal with the next outbreak whenever it happens. The problems are ex- pected but not prevented. Indeed, the view within this maintenance culture is that problems occur due to factors beyond practical and resource control: It is accepted that something will always go wrong and nothing much can be done about it in advance. The occurrence of the prob- lem is often coupled with reactive responses—once the failures occur, the “fire-fighting” team is brought into action. However, because little is done in such a culture to anticipate problems or seek long-term solutions, the whole exercise becomes repeated far more often than it should be. Also, because the effort and resource go into fire-fighting rather than prevention, faults occur. The basic approach would be different in a culture of long-term and continual improvement [9]. Comparisons have been made of modern maintenance practices in the more developed economics with that occurs in Nigeria. Significant differences arise due to variations in corpo- rate culture, pertinent learning opportunities and effec- tiveness of strategic planning. Efforts made by the Federal Government to improve availability and reliability of the electric power supplies in Nigeria have been frustrated by a lack of a corporate culture in all facets of management in Nigeria. Achieving the implementation of proactive maintenance, in any Nigerian organization, requires a cultural transformation. Commitment of the concerned individuals, a supportive cultural environment and wise leadership are fundamen- tal prerequisites for achieving high quality maintenance. The training, fostering and competence building of the  S. O. OYEDEPO ET AL. 212 managers themselves are crucial to a successful overall quality maintenance programme. Maintenance management in Nigeria still esteems tough, individualistic, dominating leadership that often fails to perceive threats or opportunities. More effective management would be pivotal to organizing personnel to recognize pertinent opportunities and achieve worthwhile results rather than generate impasses, stagnation, bu- reaucracy and wasteful interpersonal friction. The following maintenance problems are frequently encountered in Nigerian electric power stations: Maintenance is not treated seriously at board level, or even by local management; Maintenance processes lack a business culture (e.g. no business plans, ineffective or superficial budgets and unfocused reports); Maintenance technicians and even team leaders lack adequate management skills; Pre-occupation with introducing advanced mainte- nance methods, while relevant basic maintenance practices are not being implemented. The Nigerian electric power industry still uses traditional maintenance planning to compile maintenance schedules for all equipment and plant. These schedules only rarely reach the shop floor. Hence, maintenance schedule ends up not being implemented. 5. Plant Condition and Maintenance Attitude in Egbin Power Station Egbin power plant is the largest generating plant in Ni- geria and one of the largest in West African Sub-region. The plant is located at the suburb of Lagos State, Ijede area of Ikorodu. The plant was commissioned in 1985 and consists of 6 units of 220 (6 × 220 MW) (Reheat- Regenerative). They are dual fired (gas and heavy oil) system with modern control equipment, single reheat; six stages regenerative feed heating. The overall cost of the plant was US $ 1 billion with an expected life of 25 years. The estimated life was based on the fact that the plant should run mainly on natural gas which does not give the serious boiler slag and ash problem characteristic of coal fuel [23]. Natural gas is supplied to the plant directly from the Nigerian Gas Company (NGC), Lagos operations de- partment, Egbin gas station, which is annexed to the thermal plant. Since Egbin thermal plant is located on the shores of the lagoon cooling water for the plant’s con- densers is pumped from the lagoon into the water treat- ment plant en route to the condensers.The station has been generating power far below installed capacity due to maintenance problems. These problems have affected the availability and reliability of the plant. Figure 1 and Figure 1. Unit by unit energy generation in MWh. Copyright © 2011 SciRes. EPE  S. O. OYEDEPO ET AL. Copyright © 2011 SciRes. EPE 213 Figure 2 show the energy generated and running hours of the plant from 2005 to 2009 respectively. The total energy generated from 2005 to 2009 varies from 3,383,869 to 8,591,905 MWh, while the running hours vary from 29,706.12 to 48,114.18 hrs. The highest total energy generated of 8,591,905 MWh was obtained in 2005, and the highest running hours of the plant also occurred in 2005. There has been a sharp declination in total energy generation and running hours from 2005 to 2009. In order to improve the plant performance and to minimize maintenance problems, there is need for effec- tive maintenance scheduling which is a major determi- nant of the productivity of the workforce. From a recent survey, there is evidence that the power station performs disappointingly compared with world- class operations [24]. There is frequent occurrence of breakdown of critical equipment. Also, overhauling op- eration is not always carrying out as schedule due to de- lay in release of fund. Turning around maintenance (TAM) is not done regularly due to politics. Apart from politics, due to small spare capacity available from gas turbine plant (24 MW) and emergency diesel generator (1.5 MW) which is not enough to be sent out, there is always fear of power outage. This is because during an- nual inspection, the plant has to be shut down for 30 or 40 days. 6. Results Table 4 shows the data on units’ failures per year begin- ning from the year 2005 to 2009 at Egbin thermal power plant. Meanwhile, Table 5 shows the data on units’ out- ages duration for the past five years. The types of faults in the power plant can be categorized into 4 main groups: plant fault, system fault, gas fault and operational fault. Figure 3 shows the total number of failures in hours ac- cording to the 4-main categories of faults from the year 2005 to 2009. Meanwhile, Figure 4 shows the total number of overall time of plant outages in hours for all the functional units. From Figure 1, the most occurring fault is the plant fault. This is followed by gas fault. The highest number of plant fault occurred in the year 2008 (2171.27 hr) and the minimum occurred in the year 2009 (1499.39 hr). In addition, Figure 1 shows that there are relatively small numbers of operational faults within the period considered. From Figure 4, it can be seen that the total outages from 2005 to 2009 are inconsistent, ranging from 3053.81 to 4811.29 hr. This shows that the trends of outages hours are unpredictable from year to year. There are many factors responsible for increasing and decreasing trend in total outages hours. These factors may include: difficulty to perform the maintenance activities, delay in Figure 2. Unit by unit running hours.  S. O. OYEDEPO ET AL. 214 Figure 3. Outages hours per year according to fault classification. Figure 4. Total outages hours per year. gas supply/gas limitation, shutdown due to failure of some critical components (e.g. steam leakages, system surge, system under-frequency, poor vacuum, super heater leakage, boiler tube leakage etc.), delay in release of fund for replacement of parts and repairs and the skills of technicians or operators. Copyright © 2011 SciRes. EPE  S. O. OYEDEPO ET AL.215 Table 4. Number of failures per year at Egbin thermal power plant. Number of Failure Unit 2005 2006 2007 2008 2009 1 46 36 45 41 37 2 44 22 44 32 29 3 41 34 - 13 37 4 24 22 40 44 37 5 32 40 44 47 34 6 N/A N/A N/A N/A N/A Table 5. Units outages duration (hr s) at Eg bin thermal power plant. Outages Duration (hrs) Unit 2005 2006 2007 2008 2009 1 1093.18 722.31 3581.85 1521.06 1645.38 2 770.03 1780.71 1755.26 3151.67 479.17 3 738.60 1497.53 8123.28 6238.07 2344.11 4 634.20 1425.01 1602.97 1725.10 1686.22 5 1072.19 1093.37 2332.21 1457.98 1547.72 6 N/A N/A N/A N/A N/A 6.1. Evaluation of Availability and Reliability of Egbin Power Plant The availability and reliability analysis was based on the available five units as at the time the data was collected. As stated earlier, unit 6 is presently not functional. The application of reliability and maintenance (R & M) prin- ciple in Egbin thermal power station plants/equipment requires that the system/component availability be de- fined in terms of Mean-Time-between-Failures, MTBF and Mean-Time-to-Repair, MTTR. MTBF is related to the duration of outages. By definition, availability (A), failure rate (λ), MTBF and MTTR are computed as: 1Total operating time MTBF N o of failures (1) Total outage time1 MTTR No of failures (2) When these two factors are known for any given sys- tem or component, then the availability (A) is expressed as: MTBF 1Uptime MTBF MTTR1Uptime Downtime A (3) where No of failurs between maintenance Total operating time between maintenance = failure rate i.e. number of failures/unit time τ = duration of outage µ = repair rate = 1 Reliability, R(t) = exp (−t/MTBF) = exp(−λt) (4) w here t = period of failure M aintainability (Mt) = exp (−t/MTTR) = exp (−µt) (5) Utilization efficiency Actual work hours Max. potential hours of operationdelay hours (6) Figures 5 to 10 show the result of availability (A), MTTR and MTBF at Egbin power plant. 6.2. Plant Availability This section deals with analysis of the entire plant avail- ability for the year 2009. Total outages hrs/yr = 4147.02 Number of failures/yr = 174 MTTR = 4147.02/174 = 23.38 hrs MTBF = 4612.98/174 = 26.51 hrs Availability (A) = 26.51/50.31 = 0.527 Unavailability = 1 − A = 1 − 0.527 = 0.473 Capacity factor = 1100/1320 = 0.833 The theoretical energy generation that could be ob- tained from available power (1100 MW) if the plant worked every second of the year non-stop is 1100 × 8760 = 9,636,000 MWh. While the theoretical maximum energy that could be attained from the installed power (1320 MW) if the plant worked every second of the year non-stop is 1320 × 8760 = 11,563,200 MWh. The actual total energy generated in 2009 is 3,383,869 MWh. Generation Utilization index = Actual generation/ Available capacity = 35.11%. Capacity Utilization index = Available capacity/In- stalled capacity = 29.26%. 7. Discussion Analysis of the available data of Egbin thermal power plant for the years 2005 to 2009 has been carried out and the results for MBTF, MTTR and Availability (A) are shown in Figures 6 to 10. The results of this study show that the five units presently functional at the station are not in good condition. This is because, the availability of he units vary from 28.79 to 94.53 percent. t Copyright © 2011 SciRes. EPE  S. O. OYEDEPO ET AL. 216 Figure 5. Variation of unit availability for each year. Figure 6. Unit availability per year. The availability of the plant is very low compare to world class power industry. Figure 5 shows that Unit 3 has the lowest availability (28.79%) in the year 2008 and unit 2 has the highest availability (94.53%) in 2009. Fig- ure 6 shows variation in availability of each unit within the period considered. The availability of unit 1 varies from 0.5911(2007) to 0.9176 (2006), unit 2 varies from 0.6402 (2008) to 0.9453 (2009), unit 3 varies from 0.0 (2007) to 0.9157 (2005), unit 4 varies from 0.8031 (2008) to 0.9276 (2005) and unit 5 varies from 0.7338 (2007) to 0.8776 (2005). This analysis shows that unit 4 has high- est availability within the period considered. The mean C opyright © 2011 SciRes. EPE  S. O. OYEDEPO ET AL.217 Figure 7. Variation of unit MTTR for each year. Figure 8. Unit MTTR per year. time to repair (MTTR) ranges from 16.52 to 479.85 hours. Figures 7 and 8 show that Unit 3 has the highest MTTR in 2008 and unit 2 has the lowest in 2009. This shows that lot of time was spent on unit 3 in 2008 in or- der to put it to operation. From this it can be concluded that there is inverse relationship between the component/ equipment availability and failure rate. Figures 9 and 10 show the unit mean time between failures (MTBF) from 2005 to 2009. Unit 4 has the highest MTBF of 338.58 hrs and 333.41 hrs in 2005 and 2006 respectively; unit 1 has the lowest MTBF of 115.07 hrs in 2007. This shows di- rect relation between MTBF and unit availability. As the unit with highest MTBF has highest availability. In general, considering the whole plant availability with the available data for the year 2009, it was found that the plant availability was 52.7 percent with capacity factor of 0.833. The actual energy generation in 2009 was 3,383,869 MWh, while the estimated theoretical energy generation that could be obtained from available power (1100MW) if the plant worked every second of year non-stop is 9,636,000 MWh. From the available data on the plant, the major factors responsible for this wide different between the actual energy generation and theoretical energy generation in the year 2009 include plant fault which caused 1499.39 outages hours. This comes from shut down due t re-heater leakage, partial o Copyright © 2011 SciRes. EPE  S. O. OYEDEPO ET AL. 218 Figure 9. Variation of unit MTBF for each year. Figure 10. Unit MTBF per year. loss of flame, vacuum decay, super-heater tube leakage etc. In addition to this, other fault is gas fault which caused 1882.7 outages hours. This is as a result of dis- ruption or shortage of gas supply to the plant. Due to this fault, the affected unit has to be shut down until gas sup- ply is restored. These two factors play major role in the availability of thermal power plant. The trend of power availability reflects how effec- tively managed the station in terms of down time, spare parts, availability of funds, pipeline vandalization etc. Copyright © 2011 SciRes. EPE  S. O. OYEDEPO ET AL.219 8. Conclusions The reliability of power plant unit is one of the most im- portant performance parameters which reflect the quality and standards. The great care and effort devoted to in- creasing the reliability and quality of electrical power is an indication of the economic implication for the power industry. This study has investigated the reliability and avail- ability of Egbin power station units in relation to imple- mentation of preventive maintenance programme. The availability analysis shows different result for each unit indicating differences in their system installation, main- tenance and operation. As the availability of each unit varies from 28.79% to 94.53% for the five years data base considered. Also, the availability of the entire plant for the year 2009 was computed as 52.7%, while the generation utilization index is 35.11% and capacity utilization index 29.26%. The availability and reliability of the turbines pre- sented in this study reflect on site behavior, including the effects of changes in auxiliary systems maintenance pol- icy. Identifying the effects of component failure on the system under analysis, based on the failure effects classi- fication, a maintenance policy can be formulated to re- duce their occurrence probabilities. Better aims and specific targets are needed for the Eg- bin power station to improve maintenance management systems and productivity. This should be based on a new maintenance paradigm that will improve maintenance control and PM activities.The managers must formulate wise strategies, make decisions and monitor progress against plans by collecting, retrieving and analyzing data. To reduce downtime and achieve high production ca- pabilities, the aim should be to find ways to increase equipment reliability and extend the equipment’s life through cost effective maintenance. To achieve these, PHCN must move away from the traditional reactive maintenance mode to proactive maintenance and man- agement philosophies. There should be maintenance processes that fully address Total Quality Maintenance (TQM) and Total Productive Maintenance (TPM) oper- ating modes. Such change requires a complete shift to a Total Planned Quality Maintenance (TPQM) approach, which is a maintenance and management philosophy that advocates planning all maintenance (i.e. preventive, pre- dictive and corrective), as well as the control of quality in maintenance operations. 9. References [1] Y. Yare and G. K. Venayagamorthy, “A Differential Evo- lution Approach to Optimal Generator Maintenance Scheduling of the Nigerian Power System,” Power and Energy Society General Meeting—Conversion and De- livery of Electrical Energy in the 21st Century, Pittsburg, 20-24 July 2008, pp. 1-8. doi:10.1109/PES.2008.4596664 [2] G. J Anders, “Probability Concepts in Electric Power Systems,” John Wiley & Sons, Hoboken, 1990. [3] M. K. C. Marwell and S. M. Shahidepour, “Coordination between Long-Term and Short-Term Generation Sched- uling with Network Constraints,” IEEE Transaction of Power System, Vol. 15, No. 3, 2000, pp. 1161-1167. doi:10.1109/59.871749 [4] A. Smith and G. Hinchcliffe, “Reliability Centered Main- tenance: A Gateway to World Class Maintenance,” El- sevier Butterworth-Heinemann, New York, 2004. [5] J. G. C. Femando and F. M. Gilberto, “Availability Analysis of Gas Turbine Used in Power Plant,” Interna- tional Journal of Thermodynamics, Vol. 12, No. 1, 2009, pp. 28-37. [6] M. Eti, S. Ogaji and S. Robert, “Integrating Reliability, Availability, Maintainability and Supportability with Risk Analysis for Improved Generation of Afam Thermal Power Station,” Applied Engineering, Vol. 84, No. 2, 2007, pp. 201-207. doi:10.1016/j.apenergy.2006.05.001 [7] M. Borkowski and P. Hans, “Reliability Centered Main- tenance (RCM) Handbook,” Naval Sea Systems Com- mand, USA, 2007. [8] J. Moubray, “Reliability Centered Maintenance,” Indus- trial Press, Inc., New York, 1997. [9] M. C. Eti, S. O. T. Ogaji and S. D. Probert, “Impact of Corporate Culture on Plant Maintenance in the Nigerian Electric Power Industry,” Applied Energy, Vol. 83, No. 4, 2004, pp. 299-310. doi:10.1016/j.apenergy.2005.03.002 [10] M. C. Eti, S. O. T. Ogaji and S. D. Probert, “Reliability of the Afam Electric Power Generating Station, Nigeria,” Applied Energy, Vol. 77, No. 3, 2004, pp. 304-315. doi:10.1016/S0306-2619(03)00094-1 [11] B. E. Okah-Avah, “The Science of Industrial Machinery and System Maintenance,” Spectrume Books, Ltd., Lagos, 1996. [12] N. I. Chigbue, “Reform of Electric Power Sector: Journey So Far,” A Lecture Delivered at the USA Africa Col- laboration Research Sponsored by the National Science Foundation in Abuja, Nigeria, 2006, p. 3. [13] K. Julia, H. Nick, M. Kyle and R. Allison, “The Energy Crisis of Nigeria: An Overview and Implications for the Future,” University of Chicago (Unpublished paper), Chicago, 2008, pp. 1-28. [14] K. I. Idigbe and S. O. Onohaebi, “Repositioning the Power Industry in Nigeria to Guarantee Reliability in Operation and Services,” Journal of Engineering and Ap- plied Sciences, Vol. 4, No. 2, 2009, pp. 119-125. [15] S. Kola and M. O. David, “Privatization and Trends of Aggregate Consumption of Electricity in Nigeria: An Empirical Analysis,” African Journal of Accounting, Economics, Finance and Banking Research, Vol. 3, No. 3, 2008, pp. 18-27. [16] World Bank, “Nigeria: Issues and Options in the Energy Sector UNDP/World Bank Energy Assessment of Nige- Copyright © 2011 SciRes. EPE  S. O. OYEDEPO ET AL. Copyright © 2011 SciRes. EPE 220 ria,” 1993. [17] C. Enweze, “Restructuring the Nigeria Economy: The Role of Privatization,” Proceedings of CBN Annual Monetary Policy Conference, Abuja, 2000, pp. 37-44. [18] O. I. Okoro and T. C. Maduene, “Solar Energy Invest- ments in a Developing Economy,” Renewable Energy, Vol. 29, No. 9, 2004, pp. 1599-1610. doi:10.1016/j.renene.2003.12.004 [19] R. O. Fagbenle, A. Adenikinju, F. I. Ibitoye, A. O. Yusuf and O. Alayande, “A Draft Final Report on Nigeria’s Electricity Sector,” Abuja, 2006. [20] S. O. Igbinovia and F. O. Odiase, “Electric Energy Pric- ing in a Deregulated Economy: A Case Study of Delta Thermal Power Plant, Delta State, Nigeria,” Journal of Engineering and Applied Sciences, Vol. 4, No. 2, 2009, pp. 145-151. [21] E. E. Imo, “Challenges of Hydropower Development in Nigeria,” Hydrovision, 2008. www.hcipub.com [22] N. DuyQuang and B. Miguel, “Optimization of Preventive Maintenance Scheduling in Processing Plants,” Computer Aid Process Engineering, Vol. 25, 2008, pp. 319-324. [23] E. I. K. Sule and C. M. Anyanwu, “An Appraisal of Elec- tricity Supply in Nigeria and the Privatisation Option,” Research Department Occasional Paper No. 9, 1994. [24] A. O. Adelaja, O. Y. Ogunmola and E. O. Williams, “Performance Evaluation of Egbin Thermal Power Plant,” Nigeria Society of Engineers Technical Transac- tions, Vol. 4, No. 2, 2008, pp. 66-72. |