 Psychology 2011. Vol.2, No.4, 342-354 Copyright © 2011 SciRes. DOI:10.4236/psych.2011.24054 Problem Gambling, Gambling Correlates, and Help-Seeking Attitudes in a Chinese Sample: An Empirical Evaluation Jasmine M. Y. Loo, Tian Po Oei, Namrata Raylu School of Psychology, The University of Queensland; Brisbane, Australia. Email: jasminelmy@help.edu.my Received March 17th, 2011; revised April 19th, 2011; accepted May 21st, 2011. There is an increasing consensus that problem gambling (PG) is a serious social issue among the Chinese, but little is known of the factors associated with PG among the Chinese using validated and improved PG measure- ments. This study examined the patterns of PG and the PG predictive ability of variables such as gam- bling-related cognitions, gambling urge, depression, anxiety, stress, and help-seeking attitudes among Chinese individuals living in Taiwan. The participants consisted of 801 Taiwanese Chinese student and community indi- viduals (Mean age = 25.36 years). The prevalence of PG (Problem Gambling Severity Index; PGSI) and patho- logical gambling (South Oaks Gambling Screen; SOGS) are higher in this Taiwanese Chinese sample as com- pared with past prevalence research. Significant differences were found between PGSI groups (i.e., non-PG, low-risk, moderate-risk, and PG) in socio-demographic variables. Erroneous gambling-related cognitions and overall negative psychological states significantly predicted PG. In addition, interaction effects of gender, me- diation effects, and the predictive ability of help-seeking attitudes were discussed. The findings of this study have important implications in the understanding of PG among the Chinese. Gambling-related cognitions and negative psychological states are important factors that should be addressed in intervention programs. Keywords: Chinese, Gambling, Problem Gambling, Help-Seeking, Cognitions, Psychological States Introduction The earliest documented accounts of gambling were recorded in China where “keno” was first played 3000 years ago to fund the building of the Great Wall (National Policy Toward Gam- bling, 1974). Gambling was very popular in ancient China and throughout Chinese history despite the fact that it was under strict legislative controls and banned in some regions. Despite being illegal in mainland China (except in Macau where casino gambling is legalized) and Taiwan (except outlying Penghu islands), gambling remains popular among the Chinese around the world (i.e., Chinese Diaspora) due to the fact that it is an acceptable form of social activity in the community (Hobson, 1995; Lai, 2006; Raylu & Oei, 2004b). In fact, social gambling is expressed as a form of entertainment, often occurring during festive seasons (e.g., Chinese New Year), birthday gatherings, or wedding celebrations. This activity usually happens with friends, family, or colleagues, and the gambling episode lasts for a limited period of time without loss of control (Clarke, Tse et al., 2006). Nevertheless, social gambling can escalate to se- rious social gambling, problem gambling, and pathological gambling. To date, most researchers have concurred that the term prob- lem gambling (PG) refers to gambling behaviour that is severe enough to create negative outcomes for the problem gambler, immediate family, and social networks (Brooker, Clara, & Cox, 2009; Raylu & Oei, 2002). Similarly, in this study, problem gambling will be used in a broader sense to define the situation where an individual is experiencing gambling problems that causes disruption to the individual’s functioning that may ex- tend to affect family members and social networks (Lesieur & Blume, 1987). The term pathological gambling will be used to define individuals who meet the diagnostic criteria in the Di- agnostic and Statistical Manual, Fourth Edition, Text Revision (DSM-IV-TR; American Psychiatric Association, 2000). For the purpose of this study, gambling problems are conceptual- ized on a latent continuum of duration and severity. When gamblers win or lose, a range of readily perceptible cognitions, emotions, and behaviours are evoked. In turn, they drive a vicious cycle of excessive gambling with detrimental consequences such as financial debt, work and health issues, and strained relationships (Loo, Raylu, & Oei, 2008). These detrimental effects of PG affects both problem gamblers and their significant others (Raylu & Oei, 2002). Furthermore, the availability and legalisation of gambling activities in various countries (e.g., recent legalisation of gambling in Singapore) perpetuates the frequency and severity of gambling-related social issues among the Chinese and has raised concerns among practitioners and governmental authorities (Tan, Yen, & Nayga, 2010). It is also not uncommon to encounter anecdotal media coverage on PG among Chinese individuals with speculations of prostitution and drug-dealing to repay debts, and parental neglect of young children stemming from gambling addiction (Blaszczynski, Huynh, Dumlao, & Farrell, 1998). Moreover, empirical evidence of PG among the Chinese in Australia and Hong Kong do suggest that gambling is a popular recreational activity and prevalence rates are higher in this population in comparison to Western populations (Blaszczynski et al., 1998; Chen et al., 1993; Loo et al., 2008). It has also been argued that there are differences in the de- velopment of PG, perpetuation of gambling problems, and help-seeking attitudes between individuals from the West and Chinese individuals (Loo et al., 2008; Raylu & Oei, 2004a). To  J. M. Y. LOO ET AL. 343 date, much research has been conducted on Western samples and results obtained were commonly used to guide research and interventions among Chinese samples. As the Chinese ethnic group is the largest ethnic group representing 22% of the world’s population (Tseng, Lin, & Yeh, 1995) and as gambling is popular among this group, it is important that we specifically investigate the patterns of PG among the Chinese and highlight the socio-demographic variables and correlates of PG such as gambling-related cognitions, gambling urge, depression, anxi- ety, stress, and help-seeking correlates in order to assist in iden- tification of PG cases for early detection and intervention. In- vestigating correlates of help-seeking attitudes is also an im- portant step in future development of PG intervention that will increase positive help-seeking propensity among Chinese prob- lem gamblers. Different conceptual understanding and theories of PG pro- duces diverse forms of measurement tools; therefore, creating varied empirical findings about the prevalence of PG (McMil- len & Wenzel, 2006). Hence, utilising valid screening tools for Chinese PG is essential in the advancement of our understand- ing of PG among the Chinese. The predecessors of the Cana- dian Problem Gambling Index (CPGI) such as South Oaks Gambling Scale (SOGS) and Diagnostic and Statistical Manual (DSM-IV) have been used widely in gambling prevalence re- search among the Chinese residing in Hong Kong and Macao (Fong & Ozorio, 2005; Wong & So, 2003), and also among studies investigating PG correlates (e.g., Liao, 2008; Oei, Lin, & Raylu, 2008; Oei & Raylu, 2010). These studies used cut scores validated among Western samples, which often overes- timate the rates of pathological gambling among the Chinese (Tang, Wu, Tang, & Yan, 2010). Hence, this study will adopt the Chinese SOGS cut scores proposed by Tang and colleagues (2010) as an attempt to improve the accuracy of estimating pathological gambling in this population. A recent comparison of four gambling measures such as SOGS, CPGI, Gamblers Anonymous-20 (GA-20), and DSM-IV on a sample in Singapore have found CPGI to be the most reli- able and valid in measurement construct (Arthur et al., 2008). As a whole the CPGI consists of 31 items measuring gambling involvement, PG assessment, and PG correlates (Ferris & Wynne, 2001). However, only nine items are scored, which is collectively named the Problem Gambling Severity Index (PGSI) under the CPGI. Although many studies uses the term CPGI synonymously with PGSI; for clarity reasons, PGSI will be used in this study to identify the scored 9-items scale. To date, there is a lack of research that investigates the patterns of relationship between PG and other correlates utilizing the PGSI. In this study, the Chinese validated version of PGSI will be used for the above reasons to measure PG. For the purposes of estimating the prevalence of PG and pathological gambling, SOGS will be used concurrently with PGSI as a comparison. Also, PGSI will be used to examine differences in socio- demographic variables and to investigate the predictive ability of gambling correlates and help-seeking attitudes on PG. Being a relatively new scale (i.e., Chinese cut scores unavailable) and as the PGSI was originally developed to remediate the problem of overestimation in other scales, the original cut scores (Ferris & Wynne, 2001) will be utilised in this study. Considering measurement issues described here, there is a gap in literature using newer PG screening tools on the patterns of PG and important factors concerning PG such as psycho- logical states, socio-demographic variables, gambling-related cognitions, gambling urges, and help-seeking attitudes. Fur- thermore, this study will extend our current knowledge of Chi- nese help-seeking attitudes by exploring the impact of psycho- logical openness, help-seeking propensity, and indifference to stigma on PG among Chinese individuals. The subsequent sec- tions discuss these factors in detail. Past Prevalence Estimates, Types of Gambling, and Gender Differences To date, the estimates of reported gambling participation varied from 26.6% (Lai, 2006; Sin, 1997) to 92% (Clarke et al., 2006) in Chinese samples from Canada and New Zealand re- spectively. However, estimates of PG and pathological gam- bling closely resembled each other. In past research, the esti- mates of PG using SOGS ranged from 2.5% (Fong & Ozorio, 2005; Sin, 1997) to 4.0% (Wong & So, 2003). Meanwhile, using the DSM-IV Gambling-Behaviour Index and SOGS, the estimated percentages of pathological gambling in the pool of empirical studies ranged from 1.78% in a sample of Macao residents (Fong & Ozorio, 2005), 1.8% among Hong Kong residents (Wong & So, 2003), and Canadian residents (Sin, 1997) to 2.9% in an Australian Chinese speaking sample (Blaszczynski et al.1998). Due to the possibility of false posi- tive cases in prevalence studies using either DSM or SOGS, it has been suggested that more research needs to be conducted to clarify prevalence results (Blaszczynski et al., 1998). Hence, both SOGS using Chinese cut scores and PGSI will be meas- ured in this study in an attempt to address the issue of over-estimation. It is important to note also that the underre- porting of problems among Chinese PGs are common issues particularly among males in past research (Blaszczynski et al., 1998) and hence will be investigated in this study by comparing self-rated score and actual scores from screening tools. Studies have reported that males participated more in gam- bling than females and were at higher risk of gambling prob- lems (Blaszczynski et al., 1998; Chen et al., 1993); however, there is a lack of research on the preferred types of gambling according to gender. Hence, the patterns of PG and frequency of participation in various forms of gambling will be further investigated in this study. The moderating effects of gender among gambling-related correlates in predicting PG will also be investigated. In a research among Australian Chinese individu- als, more entertaining forms of gambling such as Lotto, Keno, Powerball, and poker machines at the casino (in that order) were found to be the most common gambling activities (VCGA, 2000). As the country in which a problem gambler resides in influences legislations and the forms of gambling activities available, it is important to examine the popular forms of gam- bling among the Chinese and also between genders in their respective countries. Also, there is a lack of research reporting on the participation frequency according to different types of gambling and the average amount of money spent in each gam- bling type by Chinese individuals in Taiwan, which will be thus investigated in this study. Such information on the popularity of certain gambling activities will prove valuable in making in- formed decisions about policy regulations, channelling of re- sources, and intervention strategies targeting specific at-risk type gamblers.  J. M. Y. LOO ET AL. 344 Socio-Demographic Factors, Psychological States, Gambling-Related Cognitions, and Gambling Urge Research evidences suggest that gambling-related cognitions such as erroneous beliefs, expectancies, illusion of control and perpetuating gambling thoughts play a crucial role in the de- velopment and maintenance of gambling behaviour (Griffiths, 1994; Loo et al., 2008; Oei et al., 2008). The influences of gambling urge have also been considered as an important factor in the development of PG (Raylu & Oei, 2002, 2004; Sharpe, 2002). Although previous studies have discussed the role of urges in the development of cognitions (Niaura, 2000; Skinner & Aubin, 2010; Tiffany, 1999; Tiffany & Conklin, 2000), these mediating effects of gambling-related cognitions have not been empirically investigate in the literature. Hence, the mediating process of gambling-related cognitions by which gambling urges impacts on PG severity (i.e., gambling urges impacts on PG via gambling-related cognitions) will be examined in this study among Chinese individuals living in a traditionally Chi- nese country (i.e., Taiwan). Furthermore, in Western samples, an individual’s gambling severity typically differ with socio-demographic factors such as age, gender, marital status, income, education, and employment status (Ocean & Smith, 1993). However, results are varied across different ethnic groups and countries, and consistent evidences are lacking among Chinese samples as compared with Western samples. This study will further investigate the patterns of socio-demographic factors according to the severity of PG. In the gambling literature, negative psychological states (e.g., depression, anxiety, and stress) have been found to play an important role in the development and maintenance of PG (Loo et al., 2008; Moodie & Finnigan, 2006a; Oei et al., 2008; Raylu & Oei, 2002). Affective disorders often comorbid with PG (Coman, Burrows, & Evans, 1997; El-Guebaly et al., 2006); however, the direction of effects is often unclear, especially among the Chinese as limited research has been conducted in this sample. In Western samples, problem gamblers have con- sistently reported higher rates of affective disorders, particu- larly for depression (Becona, Lorenzo, & Fuentes, 1996; Blaszczynski & McConaghy, 1989; Moodie & Finnigan, 2006a). Similarly, research has postulated the contribution of anxiety and stress in the impairment of decision-making (Miu, Heilman, & Houser, 2008), and the development, maintenance, and relapse of problem gambling (Blaszczynski, McConaghy, & Frankova, 1991; Raylu & Oei, 2004b). This study will ex- amine the predictive ability of psychological states in PG with modifications made in screening tools (described above) in a sample of Chinese residents in Taiwan. Help-Seeking Attitudes It is well-documented that Chinese gamblers have difficulty admitting that PG is an issue that has to be dealt with, and viewing gambling as an avenue of gaining financial wealth despite having financial difficulties (Loo et al., 2008; Papineau, 2001; Scull & Woolcock, 2005). Difficulty in admitting the problem and seeking help are common characteristics among the Chinese, which affects their propensity for help-seeking behaviour and in turn increase their susceptibility to mental health issues (Pagura, Fotti, Katz, & Sareen, 2009). Such be- haviours are seen as a sign of weakness and vulnerability, which produces the feared reality of losing respect in the com- munity (Basu, 1991; GAMECS Project, 1999). Hence, this study will empirically investigate the predictive ability of three aspects of attitudes toward seeking mental health services— psychological openness, help-seeking propensity, and indiffer- ence to stigma, which will contribute to our understanding of the antecedents of help-seeking among Chinese problem gam- blers. Psychological openness explores an individual’s ability in acknowledging psychological problems and willingness to seek professional help for it if deemed necessary, while help-seeking propensity explores the extent of willingness and ability to seek psychological help (Mackenzie, Knox, Gekoski, & Macaulay, 2004). Finally, indifference to stigma represents the degree of concern for the opinions of others when they are found to be experiencing psychological problems. Rationale for This Study One of the main objectives of this study is to provide a de- tailed evaluation of similarities and differences in patterns of PG, pathological gambling, and socio-demographic correlates. This study will also examine the PG predictive ability of gam- bling-related cognitions, gambling urge, negative psychological states, and help-seeking attitudes among Chinese individuals residing in Taiwan. As an attempt to remediate the issue of PG over-estimation in past Chinese studies, modifications in PG screening tools will be made (i.e., Chinese SOGS cut scores and PGSI scale). Patterns of pathological gambling, PG, fre- quency of gambling participation according to types of gam- bling activities, amount spent on gambling, and gender differ- ences will also be detailed in this study. It is hypothesized that gambling-related cognitions, gambling urges, depression, anxi- ety, and stress will be able to predict PG (i.e., higher scores on these correlated will predict higher PGSI score). Furthermore, it is predicted that gambling-related cognitions will mediate the relationship between gambling urges and PG. Based on past research that have consistently found gender differences in PG, it is hypothesized that there will be a moderating effect of gen- der in these gambling correlates, which will be investigated using interaction effects. In help-seeking attitudes, it is hy- pothesized that more positive help-seeking attitudes (i.e., high psychological openness, high help-seeking propensity, and low indifference to stigma) will predict lower PG severity. An ac- curate understanding of the influences of these factors is im- portant in making informed decisions among policy makers and devising early intervention strategies that target high-risk indi- viduals that minimises the detrimental effects of PG. Further- more, a solid understanding of patterns of gambling among the Chinese and the effect of gambling correlates on PG is inter- esting in its own right but, just as important, it is fundamental for future development of effective treatment programs among the Chinese. Method Participants The participants consisted of 801 Chinese participants from Taiwan (i.e., Taiwanese Chinese; 52.38% were males and 47.62% were females). All 801 participants can read and write  J. M. Y. LOO ET AL. 345 in Chinese language (i.e., Mandarin). The mean age was 25.36 years (SD = 10.25) with an age range of 18 to 74 years. In rela- tion to employment status, 69.50% of participants were stu- dents; while 20.10% were employed full-time and 5.10% were employed part-time. The remainder participants were either job hunting (1.70%), under disability pension (2.50%), or retired (1.10%). Most participants have never married (82.7%), while 15.5% are currently married, 1.1% was separated or divorced, 0.4% was widowed, and 0.3% was in a domestic partnership. In relation to education, 57.2% of participants have had some college education, 28% completed a Bachelor’s degree, 12.3% had up to high school education, and 2.5% completed a Post- graduate degree. Most participants were ancestor worshippers (30.2%), while 23.5% were Buddhists, 22.3% had no religion, 18.4% were Taoists, 4.6% were Catholics or Christians, and 1% believed in other religions. The majority of participants earned less than Taiwan Dollar (TWD) 100,000 (73.8%), while 8.1% earned between TWD 100,000 - TWD 300,000; 11.5% earned between TWD 300,000 - TWD 700,000; 4.5% earned between TWD 500,000 - TWD 700,000; and 2.1% earned more than TWD 1,000,000. Measures As part of a larger project, the materials included a demo- graphics form and a set of self-report questionnaires. All meas- ures without existing validated Chinese versions were trans- lated into Chinese from English and back-translated again (i.e., reverse translation) to check for consistency and face validity. A bilingual psychologist and graduate student who underwent both Western and Chinese education completed the translations. The scales were also checked by two bilingual clinical psy- chology PhD candidates who were blind to the study to ensure accuracy of translation. Pilot tests were conducted on 10 uni- versity students to verify the semantic integrity of each item and to ensure ease of understanding. The preceding steps were then repeated for highlighted items after pilot testing. Discrep- ancies between the versions were thoroughly discussed and resolved until a translated version was found to have semantic equivalence with the original English version. The Problem Gambling Severity Index (PGSI; Ferris & Wynne, 2001) The PGSI is a 9-item measure of PG, derived from the 31-item CPGI. Five items of PGSI originated from SOGS, 2 items from DSM-IV, and 2 items were developed for the PGSI. It uses a 4-point rating scale ranging from “0—Nev- er” to “3—Almost always.” Items are totalled and the total of 0 identifies a non-gambler, 1-2 identifies a low-risk gambler, 3-7 identifies a moderate-risk gambler, and 8 or more identifies a problem gambler. The Cronbach’s alpha was good, at 0.84, with a test-retest reliability of 0.78 (Ferris & Wynne, 2001). The PGSI has good criterion-related validity because it matches up fairly well with the DSM-IV and the SOGS, correlating at 0.83 with both measures (Ferris & Wynne, 2001). The Cron- bach’s alpha in a Chinese sample was reported to be 0.77 with good concurrent, predictive, and discriminant validities (Loo, Oei, & Raylu, under review). South Oaks Gambling Screen (SOGS; Lesieur & Blume, 1987) is the most commonly used 20-item self-administered instrument for assessing “pathological gambling,” which was developed based on DSM-III criteria. Cronbach’s alpha was 0.97 and the test-retest reliability was 0.71 (Lesieur & Blume, 1987). This 20-item scale uses yes/no responses and scores ranged from 0 to 20. A score of 0 indicates no pathological gambling, 1-4 indicates at-risk gambling behaviour or possible pathological gambling, and a score of 5 or more indicates pathological gambling (Stinchfield, 2002). In Chinese samples, the Cronbach’s alpha was 0.75 with good construct validity (Blaszczynski et al., 1998). Gambling Frequency, Amount Spent, and Self-Rated PG be- haviour. The gambling frequency questions consisted of four items measuring frequency of gambling and amount of money (TWD) spent per day in (1) gaming machines, (2) table games, (3) animals such as horse racing, and (4) other forms of gam- bling such as bingo, lottery, and sports betting. Frequency re- sponses were measured on a 5-point scale ranging from “1—Never,” “2—monthly or less,” “3—2 to 4 times a month,” “4—2 to 3 times per week,” to “5—4 or more times per week.” Amount of money spent required open-ended responses. The final item asked participants to indicate on a scale whether they consider themselves to be a non-problem gambler or a problem gambler. The Gambling Related Cognitions Scale-Chinese Version (GRCS-C; Oei, Lin, & Raylu, 2007a; Raylu & Oei, 2004b). The GRCS-C is a 23-item scale measuring erroneous gambling cognitions and included items such as “I have some control over predicting my gambling wins.” There are five subscales in the GRCS-C: (1) GE—Gambling expectancies, (2) IC—Illu- sion of control, (3) PC—Predictive control, (4) IS—Inability to stop gambling, and (5) IB—Interpretative bias. The responses were measured on a 7-point Likert scale (1 = strongly disagree to 7 = strongly agree) with higher scores indicating more cog- nitive distortions held by the individual. The GRCS-C reported a Cronbach’s alpha 0.95 and ranged from 0.83 to 0.89 for the five factors (Oei et al., 2007a). The GRCS-C also reported good concurrent, predictive, and discriminant validities. The Gambling Urge Scale-Chinese Version (GUS-C; Oei, Lin, & Raylu, 2007b; Raylu & Oei, 2004). The 6-item ques- tionnaire measured gambling urges, which has been found to be important in the maintenance of PG. The GUS-C included items such as “All I want to do now is to gamble” and “Nothing would be better than having a gamble right now.” Participants responded on a 7-point Likert scale (1 = strongly disagree to 7 = strongly agree) with higher scores indicating a stronger urge to gamble. The Cronbach’s alpha for the Chinese version was reported to be 0.87 and has adequate concurrent, predictive, and criterion validities (Oei et al., 2007b). Depression, Anxiety, and Stress Scale (DASS; Lovibond & Lovibond, 1995). This 21-item scale (rated on a 4-point scale ranging from 0 “did not apply to me at all” to 3 “applied to me very much or most of the time”) assesses symptoms of depres- sion (DASS-D), anxiety (DASS-A), and stress (DASS-S). The scale reported good internal consistency (α = 0.94, 0.87 and 0.91 for the subscales of depression, anxiety and stress respec- tively) (Antony, Bieling, Cox, Enns, & Swinson, 1998). In a Chinese sample, the Cronbach’s alpha for the three subscales were also high (α depression = .85; α anxiety = .87; α stress = .82) and the Chinese version showed good criterion and pre- dictive validities (Oei et al., 2008). Inventory of Attitudes toward Seeking Mental Health Ser- vices (IASMHS; Mackenzie et al., 2004). The IASMHS is a 24-item scale measuring mental health help-seeking behaviour 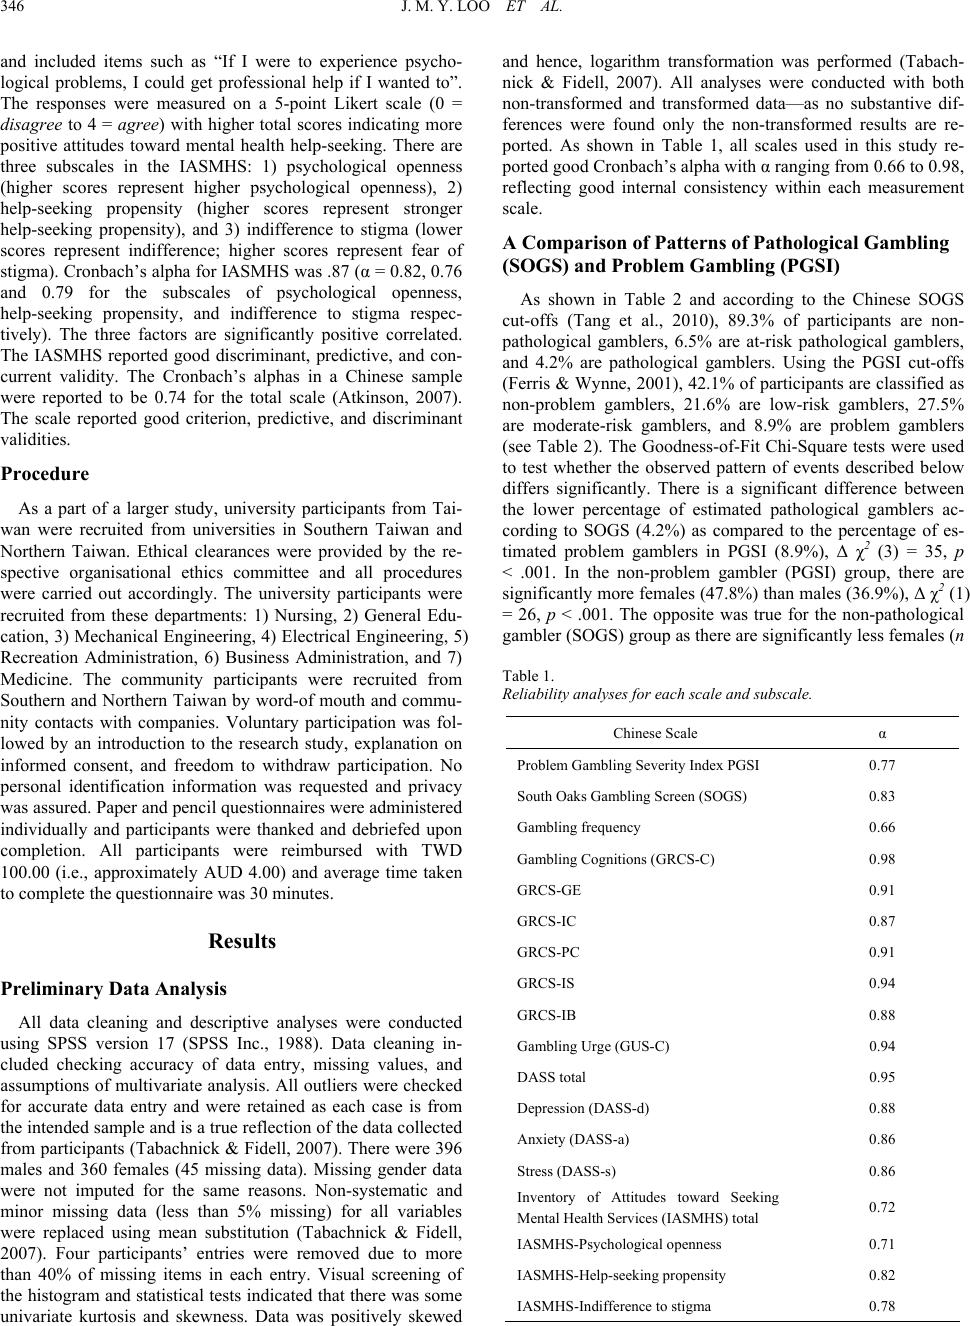 J. M. Y. LOO ET AL. 346 and included items such as “If I were to experience psycho- logical problems, I could get professional help if I wanted to”. The responses were measured on a 5-point Likert scale (0 = disagree to 4 = agree) with higher total scores indicating more positive attitudes toward mental health help-seeking. There are three subscales in the IASMHS: 1) psychological openness (higher scores represent higher psychological openness), 2) help-seeking propensity (higher scores represent stronger help-seeking propensity), and 3) indifference to stigma (lower scores represent indifference; higher scores represent fear of stigma). Cronbach’s alpha for IASMHS was .87 (α = 0.82, 0.76 and 0.79 for the subscales of psychological openness, help-seeking propensity, and indifference to stigma respec- tively). The three factors are significantly positive correlated. The IASMHS reported good discriminant, predictive, and con- current validity. The Cronbach’s alphas in a Chinese sample were reported to be 0.74 for the total scale (Atkinson, 2007). The scale reported good criterion, predictive, and discriminant validities. Procedure As a part of a larger study, university participants from Tai- wan were recruited from universities in Southern Taiwan and Northern Taiwan. Ethical clearances were provided by the re- spective organisational ethics committee and all procedures were carried out accordingly. The university participants were recruited from these departments: 1) Nursing, 2) General Edu- cation, 3) Mechanical Engineering, 4) Electrical Engineering, 5) Recreation Administration, 6) Business Administration, and 7) Medicine. The community participants were recruited from Southern and Northern Taiwan by word-of mouth and commu- nity contacts with companies. Voluntary participation was fol- lowed by an introduction to the research study, explanation on informed consent, and freedom to withdraw participation. No personal identification information was requested and privacy was assured. Paper and pencil questionnaires were administered individually and participants were thanked and debriefed upon completion. All participants were reimbursed with TWD 100.00 (i.e., approximately AUD 4.00) and average time taken to complete the questionnaire was 30 minutes. Results Preliminary Data Analysis All data cleaning and descriptive analyses were conducted using SPSS version 17 (SPSS Inc., 1988). Data cleaning in- cluded checking accuracy of data entry, missing values, and assumptions of multivariate analysis. All outliers were checked for accurate data entry and were retained as each case is from the intended sample and is a true reflection of the data collected from participants (Tabachnick & Fidell, 2007). There were 396 males and 360 females (45 missing data). Missing gender data were not imputed for the same reasons. Non-systematic and minor missing data (less than 5% missing) for all variables were replaced using mean substitution (Tabachnick & Fidell, 2007). Four participants’ entries were removed due to more than 40% of missing items in each entry. Visual screening of the histogram and statistical tests indicated that there was some univariate kurtosis and skewness. Data was positively skewed and hence, logarithm transformation was performed (Tabach- nick & Fidell, 2007). All analyses were conducted with both non-transformed and transformed data—as no substantive dif- ferences were found only the non-transformed results are re- ported. As shown in Table 1, all scales used in this study re- ported good Cronbach’s alpha with α ranging from 0.66 to 0.98, reflecting good internal consistency within each measurement scale. A Comparison of Patt erns of Patho logical Gambling (SOGS) and Problem Gam bling (PGSI) As shown in Table 2 and according to the Chinese SOGS cut-offs (Tang et al., 2010), 89.3% of participants are non- pathological gamblers, 6.5% are at-risk pathological gamblers, and 4.2% are pathological gamblers. Using the PGSI cut-offs (Ferris & Wynne, 2001), 42.1% of participants are classified as non-problem gamblers, 21.6% are low-risk gamblers, 27.5% are moderate-risk gamblers, and 8.9% are problem gamblers (see Table 2). The Goodness-of-Fit Chi-Square tests were used to test whether the observed pattern of events described below differs significantly. There is a significant difference between the lower percentage of estimated pathological gamblers ac- cording to SOGS (4.2%) as compared to the percentage of es- timated problem gamblers in PGSI (8.9%), Δ χ2 (3) = 35, p < .001. In the non-problem gambler (PGSI) group, there are significantly more females (47.8%) than males (36.9%), Δ χ2 (1) = 26, p < .001. The opposite was true for the non-pathological gambler (SOGS) group as there are significantly less females (n Table 1. Reliability analyses for each scale and subscale. Chinese Scale α Problem Gambling Severity Index PGSI 0.77 South Oaks Gambling Screen (SOGS) 0.83 Gambling frequency 0.66 Gambling Cognitions (GRCS-C) 0.98 GRCS-GE 0.91 GRCS-IC 0.87 GRCS-PC 0.91 GRCS-IS 0.94 GRCS-IB 0.88 Gambling Urge (GUS-C) 0.94 DASS total 0.95 Depression (DASS-d) 0.88 Anxiety (DASS-a) 0.86 Stress (DASS-s) 0.86 Inventory of Attitudes toward Seeking Mental Health Services (IASMHS) total 0.72 IASMHS-Psychological openness 0.71 IASMHS-Help-seeking propensity 0.82 IASMHS-Indifference to stigma 0.78 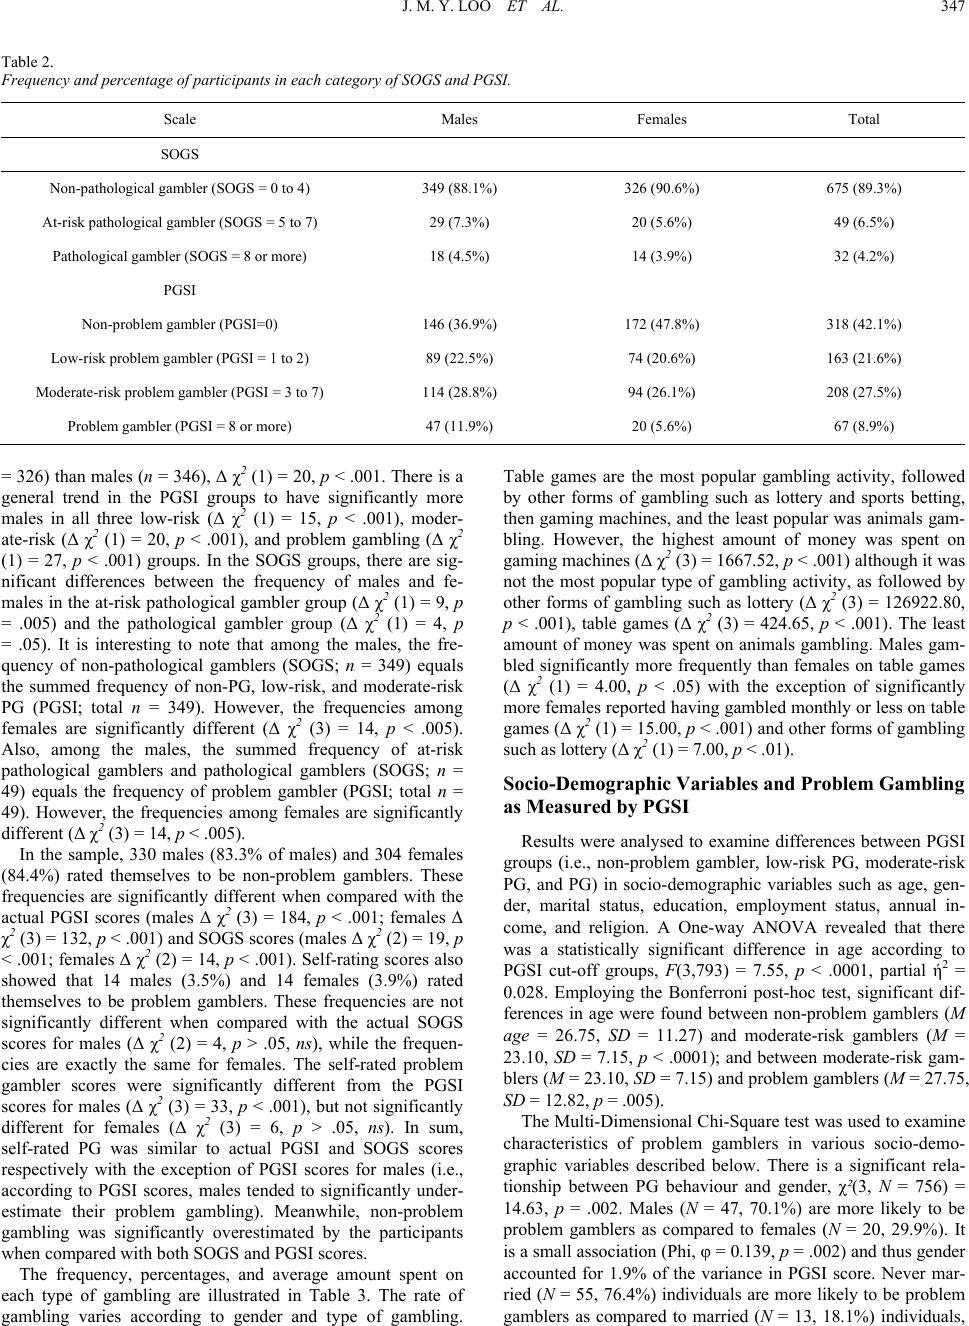 J. M. Y. LOO ET AL. 347 Table 2. Frequency and percentage of participants in each category of SOGS and PGSI. Scale Males Females Total SOGS Non-pathological gambler (SOGS = 0 to 4) 349 (88.1%) 326 (90.6%) 675 (89.3%) At-risk pathological gambler (SOGS = 5 to 7) 29 (7.3%) 20 (5.6%) 49 (6.5%) Pathological gambler (SOGS = 8 or more) 18 (4.5%) 14 (3.9%) 32 (4.2%) PGSI Non-problem gambler (PGSI=0) 146 (36.9%) 172 (47.8%) 318 (42.1%) Low-risk problem gambler (PGSI = 1 to 2) 89 (22.5%) 74 (20.6%) 163 (21.6%) Moderate-risk problem gambler (PGSI = 3 to 7) 114 (28.8%) 94 (26.1%) 208 (27.5%) Problem gambler (PGSI = 8 or more) 47 (11.9%) 20 (5.6%) 67 (8.9%) = 326) than males (n = 346), Δ χ2 (1) = 20, p < .001. There is a general trend in the PGSI groups to have significantly more males in all three low-risk (Δ χ2 (1) = 15, p < .001), moder- ate-risk (Δ χ2 (1) = 20, p < .001), and problem gambling (Δ χ2 (1) = 27, p < .001) groups. In the SOGS groups, there are sig- nificant differences between the frequency of males and fe- males in the at-risk pathological gambler group (Δ χ2 (1) = 9, p = .005) and the pathological gambler group (Δ χ2 (1) = 4, p = .05). It is interesting to note that among the males, the fre- quency of non-pathological gamblers (SOGS; n = 349) equals the summed frequency of non-PG, low-risk, and moderate-risk PG (PGSI; total n = 349). However, the frequencies among females are significantly different (Δ χ2 (3) = 14, p < .005). Also, among the males, the summed frequency of at-risk pathological gamblers and pathological gamblers (SOGS; n = 49) equals the frequency of problem gambler (PGSI; total n = 49). However, the frequencies among females are significantly different (Δ χ2 (3) = 14, p < .005). In the sample, 330 males (83.3% of males) and 304 females (84.4%) rated themselves to be non-problem gamblers. These frequencies are significantly different when compared with the actual PGSI scores (males Δ χ2 (3) = 184, p < .001; females Δ χ2 (3) = 132, p < .001) and SOGS scores (males Δ χ2 (2) = 19, p < .001; females Δ χ2 (2) = 14, p < .001). Self-rating scores also showed that 14 males (3.5%) and 14 females (3.9%) rated themselves to be problem gamblers. These frequencies are not significantly different when compared with the actual SOGS scores for males (Δ χ2 (2) = 4, p > .05, ns), while the frequen- cies are exactly the same for females. The self-rated problem gambler scores were significantly different from the PGSI scores for males (Δ χ2 (3) = 33, p < .001), but not significantly different for females (Δ χ2 (3) = 6, p > .05, ns). In sum, self-rated PG was similar to actual PGSI and SOGS scores respectively with the exception of PGSI scores for males (i.e., according to PGSI scores, males tended to significantly under- estimate their problem gambling). Meanwhile, non-problem gambling was significantly overestimated by the participants when compared with both SOGS and PGSI scores. The frequency, percentages, and average amount spent on each type of gambling are illustrated in Table 3. The rate of gambling varies according to gender and type of gambling. Table games are the most popular gambling activity, followed by other forms of gambling such as lottery and sports betting, then gaming machines, and the least popular was animals gam- bling. However, the highest amount of money was spent on gaming machines (Δ χ2 (3) = 1667.52, p < .001) although it was not the most popular type of gambling activity, as followed by other forms of gambling such as lottery (Δ χ2 (3) = 126922.80, p < .001), table games (Δ χ2 (3) = 424.65, p < .001). The least amount of money was spent on animals gambling. Males gam- bled significantly more frequently than females on table games (Δ χ2 (1) = 4.00, p < .05) with the exception of significantly more females reported having gambled monthly or less on table games (Δ χ2 (1) = 15.00, p < .001) and other forms of gambling such as lottery (Δ χ2 (1) = 7.00, p < .01). Socio-Demographic Variables and Problem Gambling as Measured by PG SI Results were analysed to examine differences between PGSI groups (i.e., non-problem gambler, low-risk PG, moderate-risk PG, and PG) in socio-demographic variables such as age, gen- der, marital status, education, employment status, annual in- come, and religion. A One-way ANOVA revealed that there was a statistically significant difference in age according to PGSI cut-off groups, F(3,793) = 7.55, p < .0001, partial ή2 = 0.028. Employing the Bonferroni post-hoc test, significant dif- ferences in age were found between non-problem gamblers (M age = 26.75, SD = 11.27) and moderate-risk gamblers (M = 23.10, SD = 7.15, p < .0001); and between moderate-risk gam- blers (M = 23.10, SD = 7.15) and problem gamblers (M = 27.75, SD = 12.82, p = .005). The Multi-Dimensional Chi-Square test was used to examine characteristics of problem gamblers in various socio-demo- graphic variables described below. There is a significant rela- tionship between PG behaviour and gender, χ²(3, N = 756) = 14.63, p = .002. Males (N = 47, 70.1%) are more likely to be problem gamblers as compared to females (N = 20, 29.9%). It is a small association (Phi, φ = 0.139, p = .002) and thus gender accounted for 1.9% of the variance in PGSI score. Never mar- ried (N = 55, 76.4%) individuals are more likely to be problem amblers as compared to married (N = 13, 18.1%) individuals, g 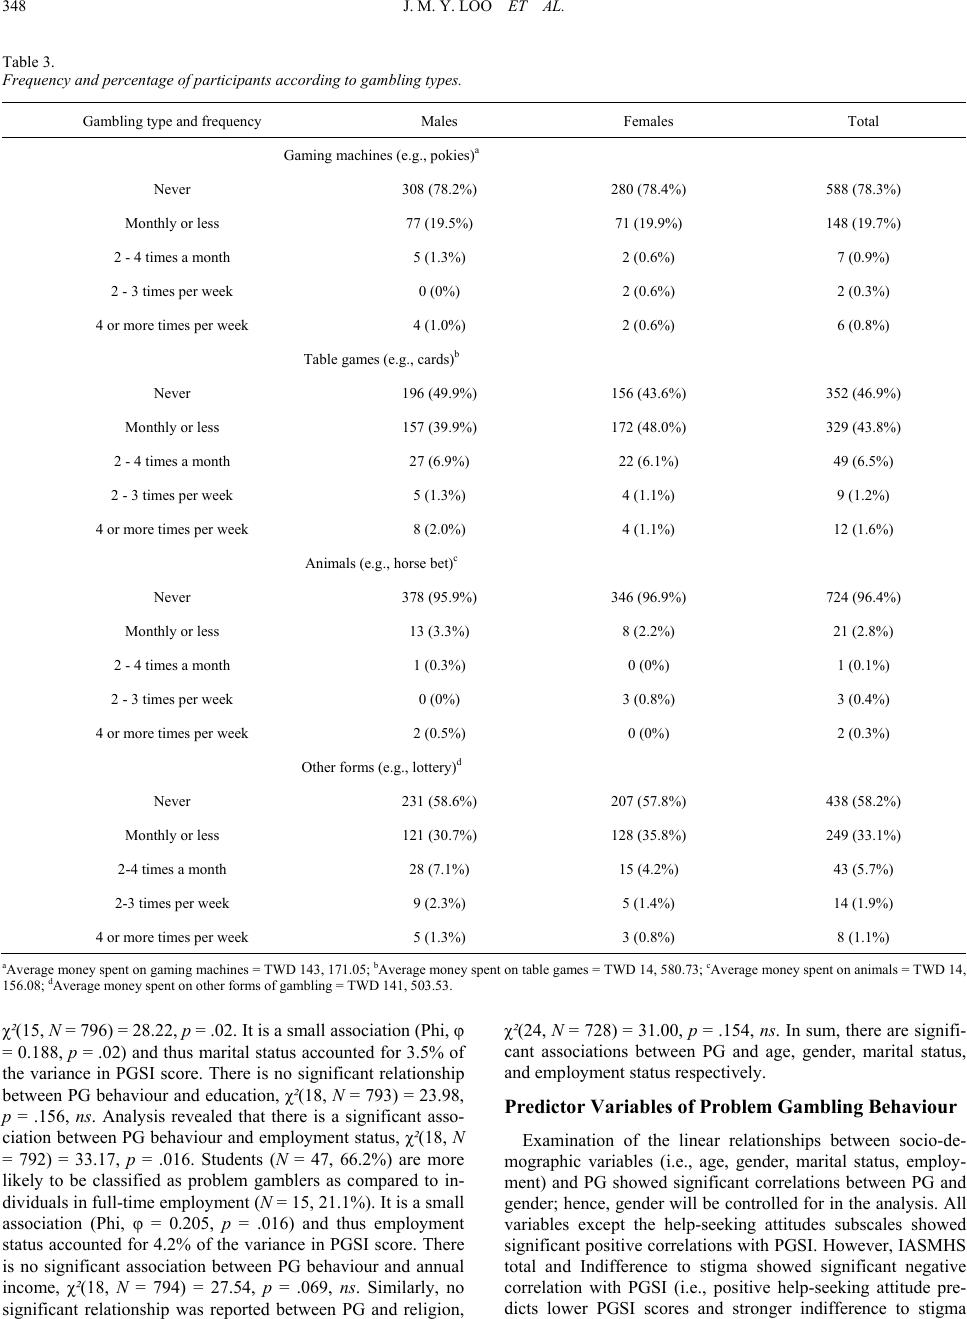 J. M. Y. LOO ET AL. 348 Table 3. Frequency and percentage of participants according to gambling types. Gambling type and frequency Males Females Total Gaming machines (e.g., pokies)a Never 308 (78.2%) 280 (78.4%) 588 (78.3%) Monthly or less 77 (19.5%) 71 (19.9%) 148 (19.7%) 2 - 4 times a month 5 (1.3%) 2 (0.6%) 7 (0.9%) 2 - 3 times per week 0 (0%) 2 (0.6%) 2 (0.3%) 4 or more times per week 4 (1.0%) 2 (0.6%) 6 (0.8%) Table games (e.g., cards)b Never 196 (49.9%) 156 (43.6%) 352 (46.9%) Monthly or less 157 (39.9%) 172 (48.0%) 329 (43.8%) 2 - 4 times a month 27 (6.9%) 22 (6.1%) 49 (6.5%) 2 - 3 times per week 5 (1.3%) 4 (1.1%) 9 (1.2%) 4 or more times per week 8 (2.0%) 4 (1.1%) 12 (1.6%) Animals (e.g., horse bet)c Never 378 (95.9%) 346 (96.9%) 724 (96.4%) Monthly or less 13 (3.3%) 8 (2.2%) 21 (2.8%) 2 - 4 times a month 1 (0.3%) 0 (0%) 1 (0.1%) 2 - 3 times per week 0 (0%) 3 (0.8%) 3 (0.4%) 4 or more times per week 2 (0.5%) 0 (0%) 2 (0.3%) Other forms (e.g., lottery)d Never 231 (58.6%) 207 (57.8%) 438 (58.2%) Monthly or less 121 (30.7%) 128 (35.8%) 249 (33.1%) 2-4 times a month 28 (7.1%) 15 (4.2%) 43 (5.7%) 2-3 times per week 9 (2.3%) 5 (1.4%) 14 (1.9%) 4 or more times per week 5 (1.3%) 3 (0.8%) 8 (1.1%) aAverage money spent on gaming machines = TWD 143, 171.05; bAverage money spent on table games = TWD 14, 580.73; cAverage money spent on animals = TWD 14, 156.08; dAverage money spent on other forms of gambling = TWD 141, 503.53. χ²(15, N = 796) = 28.22, p = .02. It is a small association (Phi, φ = 0.188, p = .02) and thus marital status accounted for 3.5% of the variance in PGSI score. There is no significant relationship between PG behaviour and education, χ²(18, N = 793) = 23.98, p = .156, ns. Analysis revealed that there is a significant asso- ciation between PG behaviour and employment status, χ²(18, N = 792) = 33.17, p = .016. Students (N = 47, 66.2%) are more likely to be classified as problem gamblers as compared to in- dividuals in full-time employment (N = 15, 21.1%). It is a small association (Phi, φ = 0.205, p = .016) and thus employment status accounted for 4.2% of the variance in PGSI score. There is no significant association between PG behaviour and annual income, χ²(18, N = 794) = 27.54, p = .069, ns. Similarly, no significant relationship was reported between PG and religion, χ²(24, N = 728) = 31.00, p = .154, ns. In sum, there are signifi- cant associations between PG and age, gender, marital status, and employment status respectively. Predictor Variables of Problem Gambling Behaviour Examination of the linear relationships between socio-de- mographic variables (i.e., age, gender, marital status, employ- ment) and PG showed significant correlations between PG and gender; hence, gender will be controlled for in the analysis. All variables except the help-seeking attitudes subscales showed significant positive correlations with PGSI. However, IASMHS total and Indifference to stigma showed significant negative correlation with PGSI (i.e., positive help-seeking attitude pre- dicts lower PGSI scores and stronger indifference to stigma 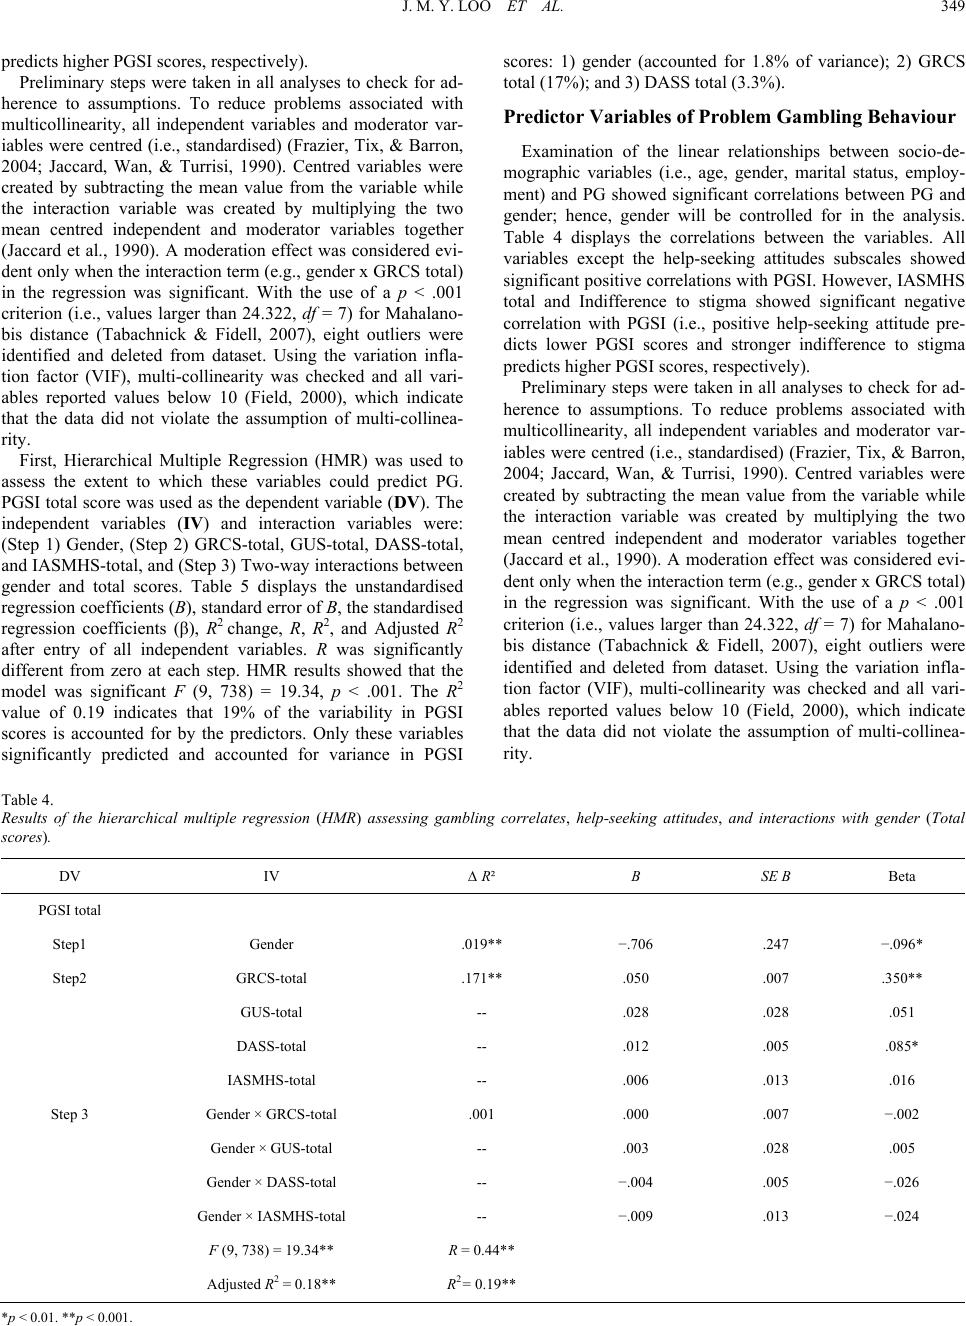 J. M. Y. LOO ET AL. 349 predicts higher PGSI scores, respectively). Preliminary steps were taken in all analyses to check for ad- herence to assumptions. To reduce problems associated with multicollinearity, all independent variables and moderator var- iables were centred (i.e., standardised) (Frazier, Tix, & Barron, 2004; Jaccard, Wan, & Turrisi, 1990). Centred variables were created by subtracting the mean value from the variable while the interaction variable was created by multiplying the two mean centred independent and moderator variables together (Jaccard et al., 1990). A moderation effect was considered evi- dent only when the interaction term (e.g., gender x GRCS total) in the regression was significant. With the use of a p < .001 criterion (i.e., values larger than 24.322, df = 7) for Mahalano- bis distance (Tabachnick & Fidell, 2007), eight outliers were identified and deleted from dataset. Using the variation infla- tion factor (VIF), multi-collinearity was checked and all vari- ables reported values below 10 (Field, 2000), which indicate that the data did not violate the assumption of multi-collinea- rity. First, Hierarchical Multiple Regression (HMR) was used to assess the extent to which these variables could predict PG. PGSI total score was used as the dependent variable (DV). The independent variables (IV) and interaction variables were: (Step 1) Gender, (Step 2) GRCS-total, GUS-total, DASS-total, and IASMHS-total, and (Step 3) Two-way interactions between gender and total scores. Table 5 displays the unstandardised regression coefficients (B), standard error of B, the standardised regression coefficients (β), R2 change, R, R2, and Adjusted R2 after entry of all independent variables. R was significantly different from zero at each step. HMR results showed that the model was significant F (9, 738) = 19.34, p < .001. The R2 value of 0.19 indicates that 19% of the variability in PGSI scores is accounted for by the predictors. Only these variables significantly predicted and accounted for variance in PGSI scores: 1) gender (accounted for 1.8% of variance); 2) GRCS total (17%); and 3) DASS total (3.3%). Predictor Variables of Problem Gambling Behaviour Examination of the linear relationships between socio-de- mographic variables (i.e., age, gender, marital status, employ- ment) and PG showed significant correlations between PG and gender; hence, gender will be controlled for in the analysis. Table 4 displays the correlations between the variables. All variables except the help-seeking attitudes subscales showed significant positive correlations with PGSI. However, IASMHS total and Indifference to stigma showed significant negative correlation with PGSI (i.e., positive help-seeking attitude pre- dicts lower PGSI scores and stronger indifference to stigma predicts higher PGSI scores, respectively). Preliminary steps were taken in all analyses to check for ad- herence to assumptions. To reduce problems associated with multicollinearity, all independent variables and moderator var- iables were centred (i.e., standardised) (Frazier, Tix, & Barron, 2004; Jaccard, Wan, & Turrisi, 1990). Centred variables were created by subtracting the mean value from the variable while the interaction variable was created by multiplying the two mean centred independent and moderator variables together (Jaccard et al., 1990). A moderation effect was considered evi- dent only when the interaction term (e.g., gender x GRCS total) in the regression was significant. With the use of a p < .001 criterion (i.e., values larger than 24.322, df = 7) for Mahalano- bis distance (Tabachnick & Fidell, 2007), eight outliers were identified and deleted from dataset. Using the variation infla- tion factor (VIF), multi-collinearity was checked and all vari- ables reported values below 10 (Field, 2000), which indicate that the data did not violate the assumption of multi-collinea- rity. Table 4. Results of the hierarchical multiple regression (HMR) assessing gambling correlates, help-seeking attitudes, and interactions with gender (Total scores). DV IV ∆ R² B SE B Beta PGSI total Step1 Gender .019** −.706 .247 −.096* Step2 GRCS-total .171** .050 .007 .350** GUS-total -- .028 .028 .051 DASS-total -- .012 .005 .085* IASMHS-total -- .006 .013 .016 Step 3 Gender × GRCS-total .001 .000 .007 −.002 Gender × GUS-total -- .003 .028 .005 Gender × DASS-total -- −.004 .005 −.026 Gender × IASMHS-total -- −.009 .013 −.024 F (9, 738) = 19.34** R = 0.44** Adjusted R2 = 0.18** R2= 0.19** * p < 0.01. **p < 0.001. 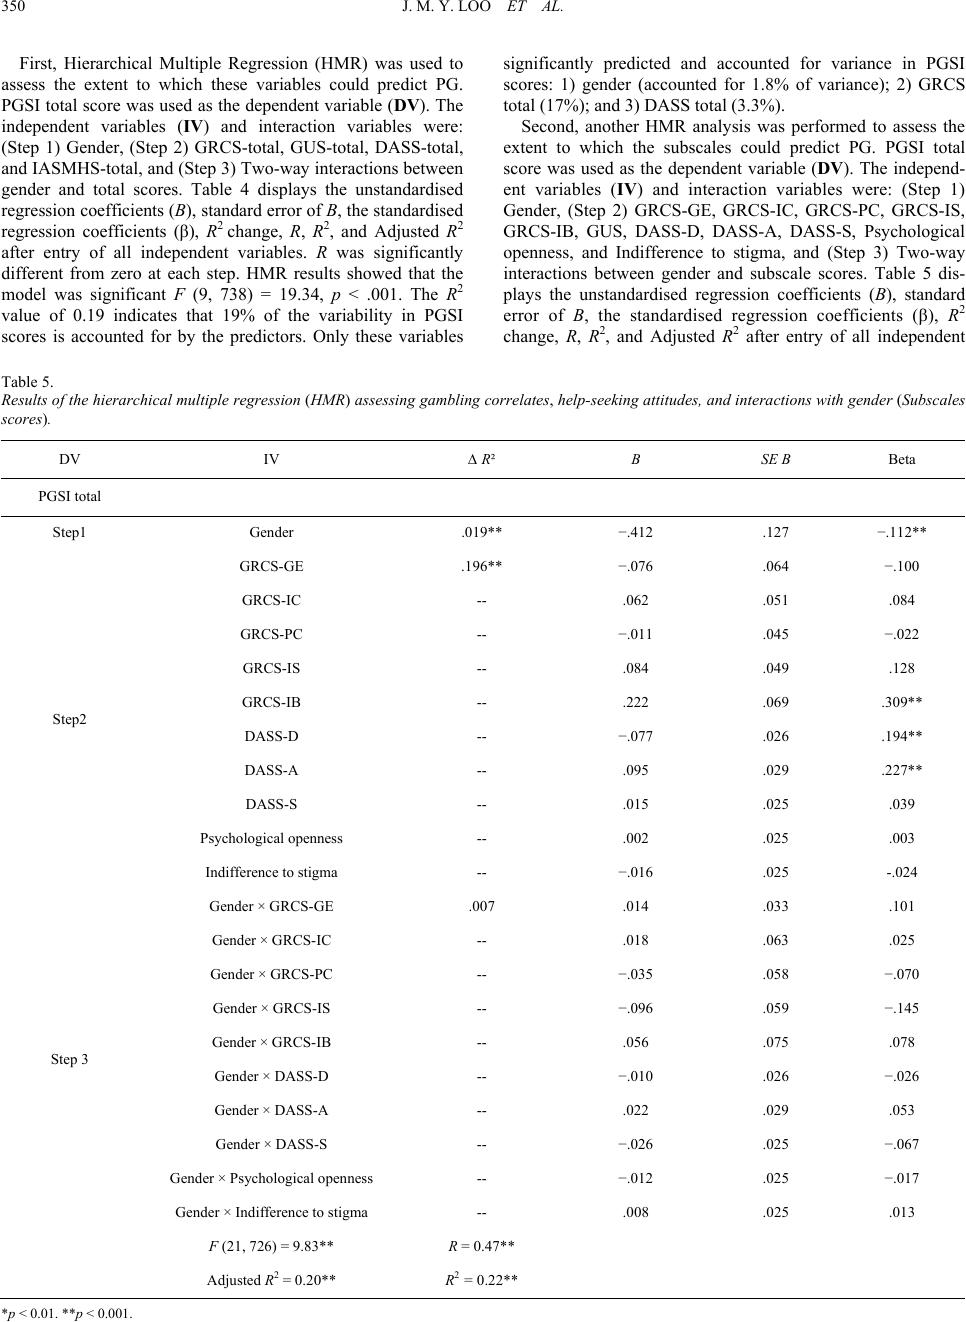 J. M. Y. LOO ET AL. 350 First, Hierarchical Multiple Regression (HMR) was used to assess the extent to which these variables could predict PG. PGSI total score was used as the dependent variable (DV). The independent variables (IV) and interaction variables were: (Step 1) Gender, (Step 2) GRCS-total, GUS-total, DASS-total, and IASMHS-total, and (Step 3) Two-way interactions between gender and total scores. Table 4 displays the unstandardised regression coefficients (B), standard error of B, the standardised regression coefficients (β), R2 change, R, R2, and Adjusted R2 after entry of all independent variables. R was significantly different from zero at each step. HMR results showed that the model was significant F (9, 738) = 19.34, p < .001. The R2 value of 0.19 indicates that 19% of the variability in PGSI scores is accounted for by the predictors. Only these variables significantly predicted and accounted for variance in PGSI scores: 1) gender (accounted for 1.8% of variance); 2) GRCS total (17%); and 3) DASS total (3.3%). Second, another HMR analysis was performed to assess the extent to which the subscales could predict PG. PGSI total score was used as the dependent variable (DV). The independ- ent variables (IV) and interaction variables were: (Step 1) Gender, (Step 2) GRCS-GE, GRCS-IC, GRCS-PC, GRCS-IS, GRCS-IB, GUS, DASS-D, DASS-A, DASS-S, Psychological openness, and Indifference to stigma, and (Step 3) Two-way interactions between gender and subscale scores. Table 5 dis- plays the unstandardised regression coefficients (B), standard error of B, the standardised regression coefficients (β), R2 change, R, R2, and Adjusted R2 after entry of all independent Table 5. Results of the hierarchical multiple regression (HMR) assessing gambling correlates, help-seeking attitudes, and interactions with gender (Subscales scores). DV IV ∆ R² B SE B Beta PGSI total Step1 Gender .019** −.412 .127 −.112** GRCS-GE .196** −.076 .064 −.100 GRCS-IC -- .062 .051 .084 GRCS-PC -- −.011 .045 −.022 GRCS-IS -- .084 .049 .128 GRCS-IB -- .222 .069 .309** DASS-D -- −.077 .026 .194** DASS-A -- .095 .029 .227** DASS-S -- .015 .025 .039 Psychological openness -- .002 .025 .003 Step2 Indifference to stigma -- −.016 .025 -.024 Gender × GRCS-GE .007 .014 .033 .101 Gender × GRCS-IC -- .018 .063 .025 Gender × GRCS-PC -- −.035 .058 −.070 Gender × GRCS-IS -- −.096 .059 −.145 Gender × GRCS-IB -- .056 .075 .078 Gender × DASS-D -- −.010 .026 −.026 Gender × DASS-A -- .022 .029 .053 Gender × DASS-S -- −.026 .025 −.067 Gender × Psychological openness -- −.012 .025 −.017 Step 3 Gender × Indifference to stigma -- .008 .025 .013 F (21, 726) = 9.83** R = 0.47** Adjusted R2 = 0.20** R2 = 0.22** * p < 0.01. **p < 0.001. 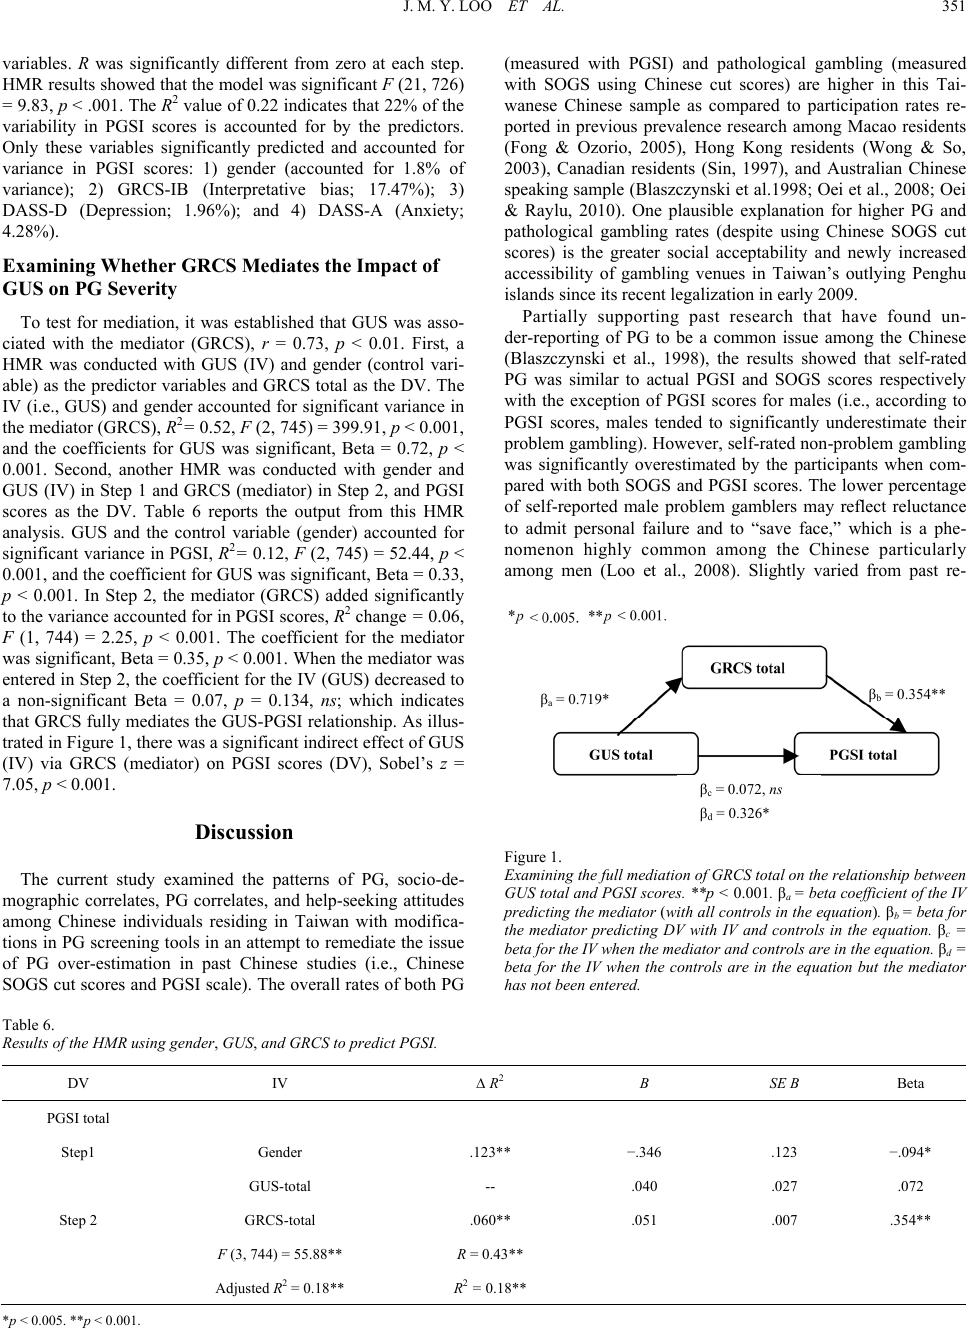 J. M. Y. LOO ET AL. 351 variables. R was significantly different from zero at each step. HMR results showed that the model was significant F (21, 726) = 9.83, p < .001. The R2 value of 0.22 indicates that 22% of the variability in PGSI scores is accounted for by the predictors. Only these variables significantly predicted and accounted for variance in PGSI scores: 1) gender (accounted for 1.8% of variance); 2) GRCS-IB (Interpretative bias; 17.47%); 3) DASS-D (Depression; 1.96%); and 4) DASS-A (Anxiety; 4.28%). Examining W hether GRCS Mediates the Impact of GUS on PG Severity To test for mediation, it was established that GUS was asso- ciated with the mediator (GRCS), r = 0.73, p < 0.01. First, a HMR was conducted with GUS (IV) and gender (control vari- able) as the predictor variables and GRCS total as the DV. The IV (i.e., GUS) and gender accounted for significant variance in the mediator (GRCS), R2= 0.52, F (2, 745) = 399.91, p < 0.001, and the coefficients for GUS was significant, Beta = 0.72, p < 0.001. Second, another HMR was conducted with gender and GUS (IV) in Step 1 and GRCS (mediator) in Step 2, and PGSI scores as the DV. Table 6 reports the output from this HMR analysis. GUS and the control variable (gender) accounted for significant variance in PGSI, R2= 0.12, F (2, 745) = 52.44, p < 0.001, and the coefficient for GUS was significant, Beta = 0.33, p < 0.001. In Step 2, the mediator (GRCS) added significantly to the variance accounted for in PGSI scores, R2 change = 0.06, F (1, 744) = 2.25, p < 0.001. The coefficient for the mediator was significant, Beta = 0.35, p < 0.001. When the mediator was entered in Step 2, the coefficient for the IV (GUS) decreased to a non-significant Beta = 0.07, p = 0.134, ns; which indicates that GRCS fully mediates the GUS-PGSI relationship. As illus- trated in Figure 1, there was a significant indirect effect of GUS (IV) via GRCS (mediator) on PGSI scores (DV), Sobel’s z = 7.05, p < 0.001. Discussion The current study examined the patterns of PG, socio-de- mographic correlates, PG correlates, and help-seeking attitudes among Chinese individuals residing in Taiwan with modifica- tions in PG screening tools in an attempt to remediate the issue of PG over-estimation in past Chinese studies (i.e., Chinese SOGS cut scores and PGSI scale). The overall rates of both PG (measured with PGSI) and pathological gambling (measured with SOGS using Chinese cut scores) are higher in this Tai- wanese Chinese sample as compared to participation rates re- ported in previous prevalence research among Macao residents (Fong & Ozorio, 2005), Hong Kong residents (Wong & So, 2003), Canadian residents (Sin, 1997), and Australian Chinese speaking sample (Blaszczynski et al.1998; Oei et al., 2008; Oei & Raylu, 2010). One plausible explanation for higher PG and pathological gambling rates (despite using Chinese SOGS cut scores) is the greater social acceptability and newly increased accessibility of gambling venues in Taiwan’s outlying Penghu islands since its recent legalization in early 2009. Partially supporting past research that have found un- der-reporting of PG to be a common issue among the Chinese (Blaszczynski et al., 1998), the results showed that self-rated PG was similar to actual PGSI and SOGS scores respectively with the exception of PGSI scores for males (i.e., according to PGSI scores, males tended to significantly underestimate their problem gambling). However, self-rated non-problem gambling was significantly overestimated by the participants when com- pared with both SOGS and PGSI scores. The lower percentage of self-reported male problem gamblers may reflect reluctance to admit personal failure and to “save face,” which is a phe- nomenon highly common among the Chinese particularly among men (Loo et al., 2008). Slightly varied from past re- βa = 0.719* βc = 0.072, ns βd = 0.326* β = 0.354** Figure 1. Examining the full mediation of GRCS total on the relationship between GUS total and PGSI scores. **p < 0.001. βa = beta coefficient of the IV predicting the mediator (with all controls in the equation). βb = beta for the mediator predicting DV with IV and controls in the equation. βc = beta for the IV when the mediator and controls are in the equation. βd = beta for the IV when the controls are in the equation but the mediator has not been entered. Table 6. Results of the HMR using gender, GUS, and GRCS to predict PGSI. DV IV ∆ R2 B SE Β Beta PGSI total Step1 Gender .123** −.346 .123 −.094* GUS-total -- .040 .027 .072 Step 2 GRCS-total .060** .051 .007 .354** F (3, 744) = 55.88** R = 0.43** Adjusted R2 = 0.18** R2 = 0.18** *p < 0.005. **p < 0.001.  J. M. Y. LOO ET AL. 352 search on the choice of gambling activity (VCGA, 2000), table games are the most popular gambling activity among partici- pants in this study, followed by other forms of gambling such as lottery and sports betting, then gaming machines, and the least popular is animals gambling. However, the largest sum of money was spent on gaming machines, as followed by other forms of gambling such as lottery although it was not the most popular type of gambling activity. The least money was spent on animals gambling and table games. Males gambled more frequently than females on all forms of gambling. When comparing participants across PGSI groups (i.e., non-PG, low-risk, moderate-risk, and PG), significant differ- ences were found between PG groups in age, gender, marital status, and employment status respectively. Non-PG and PGs are significantly older than moderate-risk gamblers. These ef- fects, however, are diminished when explored using HMR as the age difference in PG is not a linear association. There are significant gender differences with males reporting significantly higher PGSI score than females, and more females than males are categorised as non-problem gamblers. This finding is con- sistent with previous studies on Chinese communities where males reported higher PG rates as compared to females (Blaszczynski et al., 1998; Chen et al., 1993; Oei et al., 2008; Oei & Raylu, 2010). Never married individuals are more likely to be problem gamblers as compared to married individuals. Students are more likely to be classified as problem gamblers as compared to individuals in full-time employment. However, these findings on marital and employment status should be interpreted with caution as there were generally more never married than married participants, and more students than em- ployed participants in this study. The results showed significant positive relationships between PG and factors such as gambling-related cognitions, gambling urge, depression, anxiety, and stress—all of which provided good support for past research in these areas (Oei et al., 2007a, 2007b; Petry, 2005; Raylu & Oei, 2002; Sharpe, 2002). In other words, problem gamblers exhibited significantly higher levels of erroneous gambling-related cognitions, gambling urge, de- pression, anxiety, and stress respectively, as compared to non-problem gamblers. It was hypothesized that gambling- related cognitions, gambling urges, depression, anxiety, and stress will be able to predict PG (i.e., higher scores on these correlated will predict higher PGSI score). The results indicated that GRCS and DASS total scores significantly predicted PG severity (i.e., PGSI scores) in this Taiwanese Chinese sample. These findings provide support for past research that have found that erroneous gambling-related cognitions (Griffiths, 1994; Moodie & Finnigan, 2006b; Oei et al., 2008) and nega- tive psychological states such as depression, anxiety, and stress (Loo et al., 2008; Moodie & Finnigan, 2006a; Oei et al., 2008) play an important role in the development of PG. The HMR analyses on the subscales revealed that gender (control variable; i.e., being male), interpretative bias (GRCS- IB), depression, and anxiety were significant predictors of PG. The predictive ability of GRCS-IB partially support findings obtained in past research (Oei et al., 2007a; Raylu & Oei, 2004b). As suggested by the scale developers (Oei et al., 2007a; Raylu & Oei, 2004b), it is recommended that the total GRCS score be used instead of the subscales to predict PG. Analyses of the DASS subscales showed that only depression and anxiety significantly predicted PG. This may be due to the high in- ter-correlation between DASS subscales and the overlaps in predictive variance on PG. Also, the participants in this study may not exhibit symptoms of depression, anxiety, and stress levels that are high enough to detect a significant predictive relationship with PG, as compared to participants from a clini- cal population (Oei et al., 2008). Contrary to prediction, non-significant gender interaction ef- fects for all predictor variables entered in the HMR model re- vealed that gender does not moderate the effects of these vari- ables on PG severity. These results partially support past re- search (Blaszczynski et al., 1998; Chen et al., 1993; Ocean & Smith, 1993), as gender acts as a significant predictor of PG but not a significant moderator of the relationships between other predictor variables and PG. In other words, being male or fe- male does not change the relationship between these predictor variables and PG. One possible explanation is that both males and females experience these gambling correlates in similar processes and in turn exhibit PG outcomes independent of their gender. Gambling urge has been considered in past research to in- fluence PG (Raylu & Oei, 2002; Sharpe, 2002). Although there was a significant moderate correlation between GUS total score and PGSI scores in this study, gambling urge did not signifi- cantly predict PG severity. It was a possibility due to cognitive models of addiction (Skinner & Aubin, 2010; Tiffany, 1999; Tiffany & Conklin, 2000) and the strong correlation (more than r = 0.30; Baron & Kenny, 1986) between GRCS and GUS that gambling-related cognitions acts as a mediator of the relation- ship between gambling urge and PG (i.e., GUS predicts PG because GUS predicts GRCS, which predicts PG). Mediation analyses revealed that gambling-related cognitions significantly predicted gambling urge and the path from GUS to PGSI is reduced in absolute size when the mediator is controlled for in the analysis. There is a significant full mediation of gam- bling-related cognitions on the relationship between gambling urge and PG severity. These results suggest that GUS predicts PG because GUS predicts GRCS, which then predicts PG. Significant negative relationships were found between PG and overall help-seeking attitudes and the two subscales— psychological openness and indifference to stigma; however, no significant relationships were found between PG and help- seeking propensity. Results on overall help-seeking attitudes suggest that stronger engagement in help-seeking behaviour is related to lower PG severity as reflected in lower PGSI score. On the flipside, stronger indifference to stigma (i.e., lower score on the indifference to stigma subscale; see Methods sec- tion for details) relates to stronger PG severity (i.e., higher PGSI score). In other words, higher PG severity relates to a stronger indifference to stigma and less positive overall help- seeking attitudes, which links in with the notion that Chinese gamblers find it difficult to seek help for PG issues (Loo et al., 2008; Papineau, 2001; Scull & Woolcock, 2005). Stronger indifference to stigma is related to the Chinese problem gam- blers’ lack of help-seeking propensity. Over time, PG may no longer be viewed as a problem or stigma and considered as a way of life. Hence, with this knowledge, it is important to in- crease awareness among at-risk gamblers of the detrimental PG outcomes on the gambler and significant others. Consequently, as awareness of stigma increases, it is likely that help-seeking 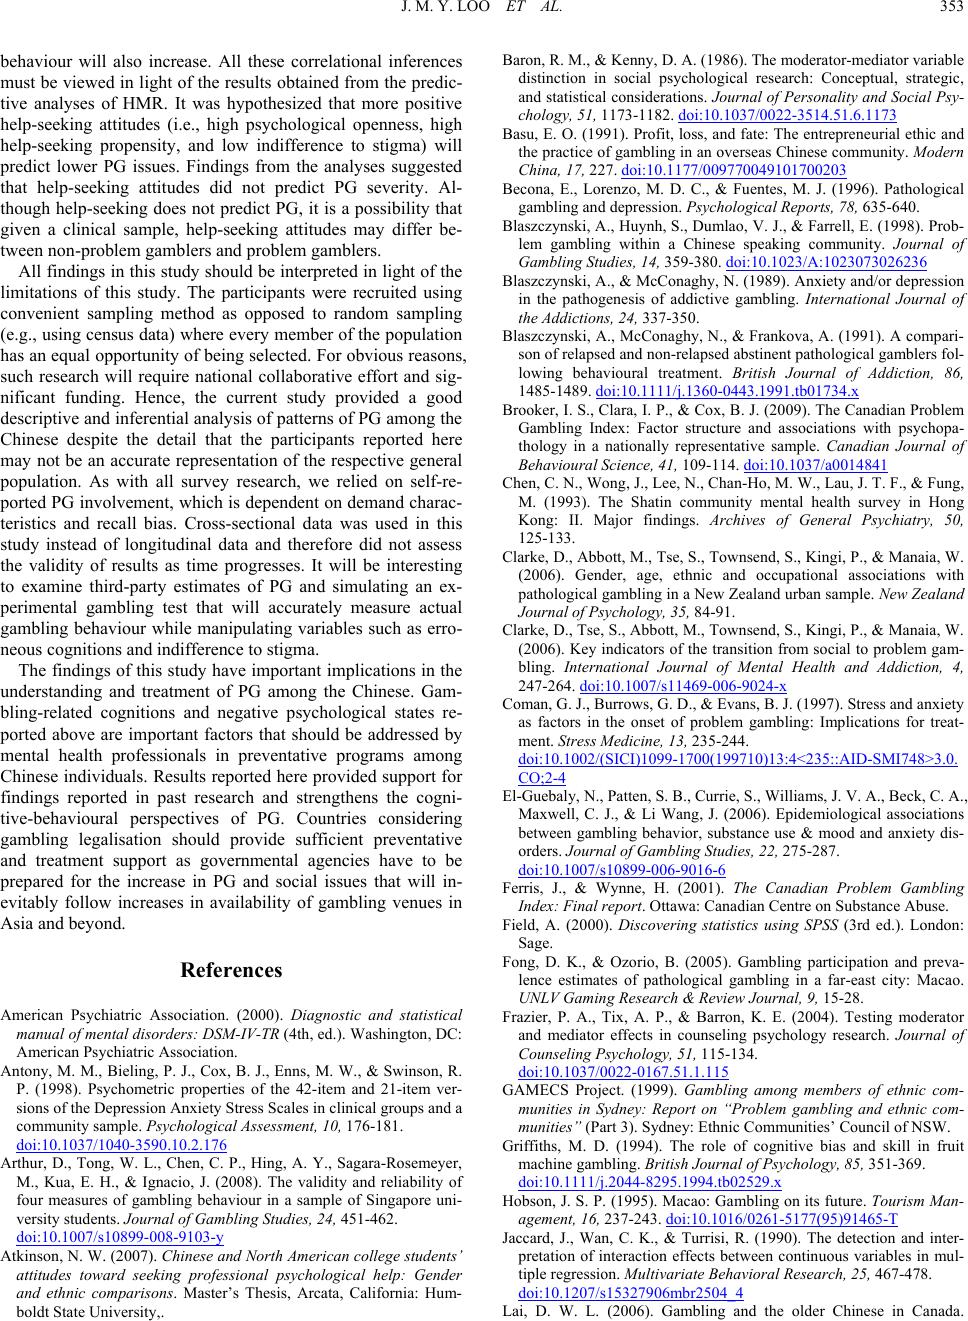 J. M. Y. LOO ET AL. 353 behaviour will also increase. All these correlational inferences must be viewed in light of the results obtained from the predic- tive analyses of HMR. It was hypothesized that more positive help-seeking attitudes (i.e., high psychological openness, high help-seeking propensity, and low indifference to stigma) will predict lower PG issues. Findings from the analyses suggested that help-seeking attitudes did not predict PG severity. Al- though help-seeking does not predict PG, it is a possibility that given a clinical sample, help-seeking attitudes may differ be- tween non-problem gamblers and problem gamblers. All findings in this study should be interpreted in light of the limitations of this study. The participants were recruited using convenient sampling method as opposed to random sampling (e.g., using census data) where every member of the population has an equal opportunity of being selected. For obvious reasons, such research will require national collaborative effort and sig- nificant funding. Hence, the current study provided a good descriptive and inferential analysis of patterns of PG among the Chinese despite the detail that the participants reported here may not be an accurate representation of the respective general population. As with all survey research, we relied on self-re- ported PG involvement, which is dependent on demand charac- teristics and recall bias. Cross-sectional data was used in this study instead of longitudinal data and therefore did not assess the validity of results as time progresses. It will be interesting to examine third-party estimates of PG and simulating an ex- perimental gambling test that will accurately measure actual gambling behaviour while manipulating variables such as erro- neous cognitions and indifference to stigma. The findings of this study have important implications in the understanding and treatment of PG among the Chinese. Gam- bling-related cognitions and negative psychological states re- ported above are important factors that should be addressed by mental health professionals in preventative programs among Chinese individuals. Results reported here provided support for findings reported in past research and strengthens the cogni- tive-behavioural perspectives of PG. Countries considering gambling legalisation should provide sufficient preventative and treatment support as governmental agencies have to be prepared for the increase in PG and social issues that will in- evitably follow increases in availability of gambling venues in Asia and beyond. References American Psychiatric Association. (2000). Diagnostic and statistical manual of mental disorders: DSM-IV-TR (4th, ed.). Washington, DC: American Psychiatric Association. Antony, M. M., Bieling, P. J., Cox, B. J., Enns, M. W., & Swinson, R. P. (1998). Psychometric properties of the 42-item and 21-item ver- sions of the Depression Anxiety Stress Scales in clinical groups and a community sample. Psychological Assessment, 10, 176-181. doi:10.1037/1040-3590.10.2.176 Arthur, D., Tong, W. L., Chen, C. P., Hing, A. Y., Sagara-Rosemeyer, M., Kua, E. H., & Ignacio, J. (2008). The validity and reliability of four measures of gambling behaviour in a sample of Singapore uni- versity students. Journal of Gambling Studies, 24, 451-462. doi:10.1007/s10899-008-9103-y Atkinson, N. W. (2007). Chinese and North American college students’ attitudes toward seeking professional psychological help: Gender and ethnic comparisons. Master’s Thesis, Arcata, California: Hum- boldt State University,. Baron, R. M., & Kenny, D. A. (1986). The moderator-mediator variable distinction in social psychological research: Conceptual, strategic, and statistical considerations. Journal of Personality and Social Psy- chology, 51, 1173-1182. doi:10.1037/0022-3514.51.6.1173 Basu, E. O. (1991). Profit, loss, and fate: The entrepreneurial ethic and the practice of gambling in an overseas Chinese community. Modern China, 17, 227. doi:10.1177/009770049101700203 Becona, E., Lorenzo, M. D. C., & Fuentes, M. J. (1996). Pathological gambling and depression. Psychological Reports, 78, 635-640. Blaszczynski, A., Huynh, S., Dumlao, V. J., & Farrell, E. (1998). Prob- lem gambling within a Chinese speaking community. Journal of Gambling Studies, 14, 359-380. doi:10.1023/A:1023073026236 Blaszczynski, A., & McConaghy, N. (1989). Anxiety and/or depression in the pathogenesis of addictive gambling. International Journal of the Addictions, 24, 337-350. Blaszczynski, A., McConaghy, N., & Frankova, A. (1991). A compari- son of relapsed and non-relapsed abstinent pathological gamblers fol- lowing behavioural treatment. British Journal of Addiction, 86, 1485-1489. doi:10.1111/j.1360-0443.1991.tb01734.x Brooker, I. S., Clara, I. P., & Cox, B. J. (2009). The Canadian Problem Gambling Index: Factor structure and associations with psychopa- thology in a nationally representative sample. Canadian Journal of Behavioural Science, 41, 109-114. doi:10.1037/a0014841 Chen, C. N., Wong, J., Lee, N., Chan-Ho, M. W., Lau, J. T. F., & Fung, M. (1993). The Shatin community mental health survey in Hong Kong: II. Major findings. Archives of General Psychiatry, 50, 125-133. Clarke, D., Abbott, M., Tse, S., Townsend, S., Kingi, P., & Manaia, W. (2006). Gender, age, ethnic and occupational associations with pathological gambling in a New Zealand urban sample. New Zealand Journal of Psychology, 35, 84-91. Clarke, D., Tse, S., Abbott, M., Townsend, S., Kingi, P., & Manaia, W. (2006). Key indicators of the transition from social to problem gam- bling. International Journal of Mental Health and Addiction, 4, 247-264. doi:10.1007/s11469-006-9024-x Coman, G. J., Burrows, G. D., & Evans, B. J. (1997). Stress and anxiety as factors in the onset of problem gambling: Implications for treat- ment. Stress Medicine, 13, 235-244. doi:10.1002/(SICI)1099-1700(199710)13:4<235::AID-SMI748>3.0. CO;2-4 El-Guebaly, N., Patten, S. B., Currie, S., Williams, J. V. A., Beck, C. A., Maxwell, C. J., & Li Wang, J. (2006). Epidemiological associations between gambling behavior, substance use & mood and anxiety dis- orders. Journal of Gambling Studies, 22, 275-287. doi:10.1007/s10899-006-9016-6 Ferris, J., & Wynne, H. (2001). The Canadian Problem Gambling Index: Final report. Ottawa: Canadian Centre on Substance Abuse. Field, A. (2000). Discovering statistics using SPSS (3rd ed.). London: Sage. Fong, D. K., & Ozorio, B. (2005). Gambling participation and preva- lence estimates of pathological gambling in a far-east city: Macao. UNLV Gaming Research & Review Journal, 9, 15-28. Frazier, P. A., Tix, A. P., & Barron, K. E. (2004). Testing moderator and mediator effects in counseling psychology research. Journal of Counseling Psychology, 51, 115-134. doi:10.1037/0022-0167.51.1.115 GAMECS Project. (1999). Gambling among members of ethnic com- munities in Sydney: Report on “Problem gambling and ethnic com- munities” (Part 3). Sydney: Ethnic Communities’ Council of NSW. Griffiths, M. D. (1994). The role of cognitive bias and skill in fruit machine gambling. British Journal of Psychology, 85, 351-369. doi:10.1111/j.2044-8295.1994.tb02529.x Hobson, J. S. P. (1995). Macao: Gambling on its future. Tourism Man- agement, 16, 237-243. doi:10.1016/0261-5177(95)91465-T Jaccard, J., Wan, C. K., & Turrisi, R. (1990). The detection and inter- pretation of interaction effects between continuous variables in mul- tiple regression. Multivariate Behavioral Research, 25, 467-478. doi:10.1207/s15327906mbr2504_4 Lai, D. W. L. (2006). Gambling and the older Chinese in Canada.  J. M. Y. LOO ET AL. 354 Journal of Gambling Studies, 22, 121-141. doi:10.1007/s10899-005-9006-0 Lesieur, H. R., & Blume, S. B. (1987). The South Oaks Gambling Screen (SOGS): A new instrument for the identification of patho- logical gamblers. American Journal of Psychiatry, 144, 1184-1188. Liao, M. S. (2008). Intimate partner violence within the Chinese com- munity in San Francisco: Problem gambling as a risk factor. Journal of Family Violence, 23, 671-678. doi:10.1007/s10896-008-9190-7 Loo, J. M. Y., Oei, T. P. S., & Raylu, N. (under review). Psychometric evaluation of the Problem Gambling Severity Index (PGSI-C). Jour- nal of Gambling Studies. Loo, J. M. Y., Raylu, N., & Oei, T. P. S. (2008). Gambling among the Chinese: A comprehensive review. Clinical Psychology Review, 28, 1152-1166. doi:10.1016/j.cpr.2008.04.001 Lovibond, P. F., & Lovibond, S. H. (1995). The structure of negative emotional states: Comparison of the Depression Anxiety Stress Scales (DASS) with the beck depression and anxiety inventories. Behaviour Research and Therapy, 33, 335-343. doi:10.1016/0005-7967(94)00075-U Mackenzie, C. S., Knox, V. J., Gekoski, W. L., & Macaulay, H. L. (2004). An adaptation and extension of the attitudes toward seeking professional psychological help scale. Journal of Applied Social Psy- chology, 34, 2410-2435. doi:10.1111/j.1559-1816.2004.tb01984.x McMillen, J., & Wenzel, M. (2006). Measuring problem gambling: Assessment of three prevalence screens. International Gambling Studies, 6, 147-174. doi:10.1080/14459790600927845 Miu, A. C., Heilman, R. M., & Houser, D. (2008). Anxiety impairs decision-making: Psychophysiological evidence from an Iowa Gam- bling Task. Biological Psychology, 77, 353-358. doi:10.1016/j.biopsycho.2007.11.010 Moodie, C., & Finnigan, F. (2006a). Association of pathological gam- bling with depression in Scotland. Psychological Reports, 99, 407-417. doi:10.2466/pr0.99.2.407-417 Moodie, C., & Finnigan, F. (2006b). Prevalence and correlates of youth gambling in Scotland. Addiction Research & Theory, 14, 365-385. doi:10.1080/16066350500498015 National Policy Toward Gambling. (1974). Gambling in perspective: A review of the written history of gambling and an assessment of its ef- fect on modern American society. Washington, DC: National Tech- nical Information Service. Niaura, R. (2000). Cognitive social learning and related perspectives on drug craving. Addiction, 95, 155-163. doi:10.1046/j.1360-0443.95.8s2.4.x Ocean, G., & Smith, G. J. (1993). Social reward, conflict, and com- mitment: A theoretical model of gambling behavior. Journal of Gambling Studies, 9, 321-339. doi:10.1007/BF01014625 Oei, T. P. S., Lin, J., & Raylu, N. (2007a). Validation of the Chinese version of the Gambling Related Cognitions Scale (GRCS-C). Jour- nal of Gambling Studies, 23, 309-322. doi:10.1007/s10899-006-9040-6 Oei, T. P. S., Lin, J., & Raylu, N. (2007b). Validation of the Chinese version of the Gambling Urges Scale (GUS-C). International Gam- bling Studies, 7, 101-111. doi:10.1080/14459790601157970 Oei, T. P. S., Lin, J., & Raylu, N. (2008). The relationship between gambling cognitions, psychological states, and gambling: A cross-cultural study of Chinese and Caucasians in Australia. Journal of Cross-Cultural Psychology, 39, 147-161. doi:10.1177/0022022107312587 Oei, T. P. S., & Raylu, N. (2010). Gambling behaviours and motiva- tions: A cross-cultural study of Chinese and Caucasians in Australia. International Journal of Social Psychiatry, 56, 23-34. doi:10.1177/0020764008095692 Pagura, J., Fotti, S., Katz, L. Y., & Sareen, J. (2009). Help seeking and perceived need for mental health care among individuals in Canada with suicidal behaviors. Psychiatric Services, 60, 943-949. doi:10.1176/appi.ps.60.7.943 Papineau, E. (2001). Pathological gambling in the Chinese community, an anthropological viewpoint. Loisir & Societe-Society and Leisure, 24, 557-582. Petry, N. M. (2005). Pathological gambling: Etiology, comorbidity, and treatment. Washington, DC: American Psychological Associa- tion. doi:10.1037/10894-000 Raylu, N., & Oei, T. P. S. (2002). Pathological gambling: A compre- hensive review. Clinical Psychology Review, 22, 1009-1061. doi:10.1016/S0272-7358(02)00101-0 Raylu, N., & Oei, T. P. S. (2004). The Gambling Urge Scale: Devel- opment, confirmatory factor validation, and psychometric properties. Psychology of Addictive Behaviors, 18, 100-105. doi:10.1037/0893-164X.18.2.100 Raylu, N., & Oei, T. P. S. (2004a). Role of culture in gambling and problem gambling. Clinical Psychology Review, 23, 1087-1114. doi:10.1016/j.cpr.2003.09.005 Raylu, N., & Oei, T. P. S. (2004b). The Gambling Related Cognitions Scale (GRCS): Development, confirmatory factor validation and psy- chometric properties. Addiction, 99, 757-769. doi:10.1111/j.1360-0443.2004.00753.x Scull, S., & Woolcock, G. (2005). Problem gambling in non-English speaking background communities in Queensland, Australia: A qualitative exploration. International Gambling Studies, 5, 29-44. doi:10.1080/14459790500097939 Sharpe, L. (2002). A reformulated cognitive-behavioral model of prob- lem gambling: A biopsychosocial perspective. Clinical Psychology Review, 22, 1-25. doi:10.1016/S0272-7358(00)00087-8 Sin, R. (1997). Gambling and problem gambling among the Chinese in Quebec: An exploratory study. Quebec: Chinese Family Service of Greater Montreal. Skinner, M. D., & Aubin, H.-J. (2010). Craving’s place in addiction theory: Contributions of the major models. Neuroscience and Biobe- havioral Reviews, 34, 606-623. doi:10.1016/j.neubiorev.2009.11.024 Stinchfield, R. (2002). Reliability, validity, and classification accuracy of the South Oaks Gambling Screen (SOGS). Addictive Behaviors, 27, 1-19. doi:10.1016/S0306-4603(00)00158-1 Tabachnick, B. G., & Fidell, L. S. (2007). Using multivariate statistics (5th ed.). Boston, MA: Pearson. Tan, A. K. G., Yen, S. T., & Nayga, R. M. Jr. (2010). Socio-demo- graphic determinants of gambling participation and expenditures: Evidence from Malaysia. International Journal of Consumer Studies, 34, 316-325. doi:10.1111/j.1470-6431.2009.00856.x Tang, C. S., Wu, A. M. S., Tang, J. Y. C., & Yan, E. C. W. (2010). Reliability, validity, and cut scores of the South Oaks Gambling Screen (SOGS) for Chinese. Journal of Gambling Studies, 26, 145-158. doi:10.1007/s10899-009-9147-7 Tiffany, S. T. (1999). Cognitive concepts of craving. Alcohol Research & Health, 23, 215-224. Tiffany, S. T., & Conklin, C. A. (2000). A cognitive processing model of alcohol craving and compulsive alcohol use. Addiction, 95, 145-153. doi:10.1046/j.1360-0443.95.8s2.3.x Tseng, W. S., Lin, T. Y., & Yeh, E. K. (1995). Chinese societies and mental health. Hong Kong: Oxford University Press. Victorian Casino and Gaming Authority. (2000). The impact of gaming on specific cultural groups report. Melbourne, Victoria. Wong, I. L. K., & So, E. M. T. (2003). Prevalence estimates of problem and pathological gambling in Hong Kong. American Journal of Psy- chiatry, 160, 1353-1354. doi:10.1176/appi.ajp.160.7.1353
|