Paper Menu >>
Journal Menu >>
 Modern Economy, 2011, 2, 427-437 doi:10.4236/me.2011.23048 Published Online July 2011 (http://www.SciRP.org/journal/me) Copyright © 2011 SciRes. ME Sustainable Development and Socio-Economic Duality Using Fuzzy System-A Case Study of Iran Jalil Khodaparast Shirazi1*, Mehrzad Ebrahimi1, Mazda Moatari2 1Department of Economics & Management, Shiraz Branch, Islamic Azad University, Shiraz, Iran 2Sciences and Research Branch, Islamic Azad University, Fars, Iran E-mail: *Jks@iaushiraz.net Received December 20, 2010; revised March 16, 2011; accepted M a rch 28, 2011 Abstract Homogeneous development and decreasing of inequalities is a logical link between local and national pro- gram in macro level. Recognizing inequalities in the process of sustainable development play the major role for programmers. In this study, regarding the complicated qualification and qualitative of socio-economic indices, Iran provinces were ranked by fuzzy system during 2001-2006. In addition, duality in the concept of gap and differences among provinces were determined using the selected indices. Results showed that al- though country’s provinces became more homogeneous from the viewpoint of some of sustainable develop- ment indices, the distance among several provinces is still high and there is no clear relation among prov- inces during this study. This study shows that one development program cannot be effective for all areas of a country with socio-economic duality. Keywords: Sustainable Development, Duality, Economic Index, Health Index, Social Index, Fuzzy System 1. Introduction Reaching development is a relative affair, but attempt to reach this development is definite. How to reach the economic development is a key question for economists and programmers. After World War II, in all countries, developmental strategies and various economic growth models were propounded. To meet the development, resources were destroyed and environmental pollutions were increased. It is in a way that the most important characteristics of development are its potentiality and frequency. To keep the potentiality of development sources; sus- tainability should b e guaranteed. This is only possible by coordinating socio-economic and environment. Holding United Nation’s development conference in 1972 in Sweden which was about environment and keeping its equilibrium was a subject for supporters of environment to try to make economic growth undesirable and confront developed and developing countries. However, it was a rescuer for developing countries but in a symposium, in 1991, the concept of sustainable development investi- gated, and it was emphasized that sustainable develop- ment does not necessarily protect the environment, but it is a new concept of economic growth ; a growth which is accompanied by justice and availability of facilities to all people and all the generations without the destruction of limited natural sources of the world. A special definition of sustainable development was presented in the Johannesburg Summit in 2002. The de- finition is not in its tradition al concept, but known as any process which results in changing human’s thoughts preparing them to promote social responsibility [1]. However, how it is possible to increase social responsi- bility of humans and make a continuous relation among these three sides of triangle: society, economic, and en- vironment. In fact, durable relation between economy of society and environment is a big challenge. The problem is more serious in developing countries such as Iran regarding un-uniform social and economical characteristics among areas. This study attempts to help effective programming by highlighting the dualities am on g provinces by using some of social-economic in- dices. In the next step, suggestions for efficient planning have been provided. 2. Sustainable Development Indices Most of social and economic indices directly or indi- rectly influence each other such as the relationship be- 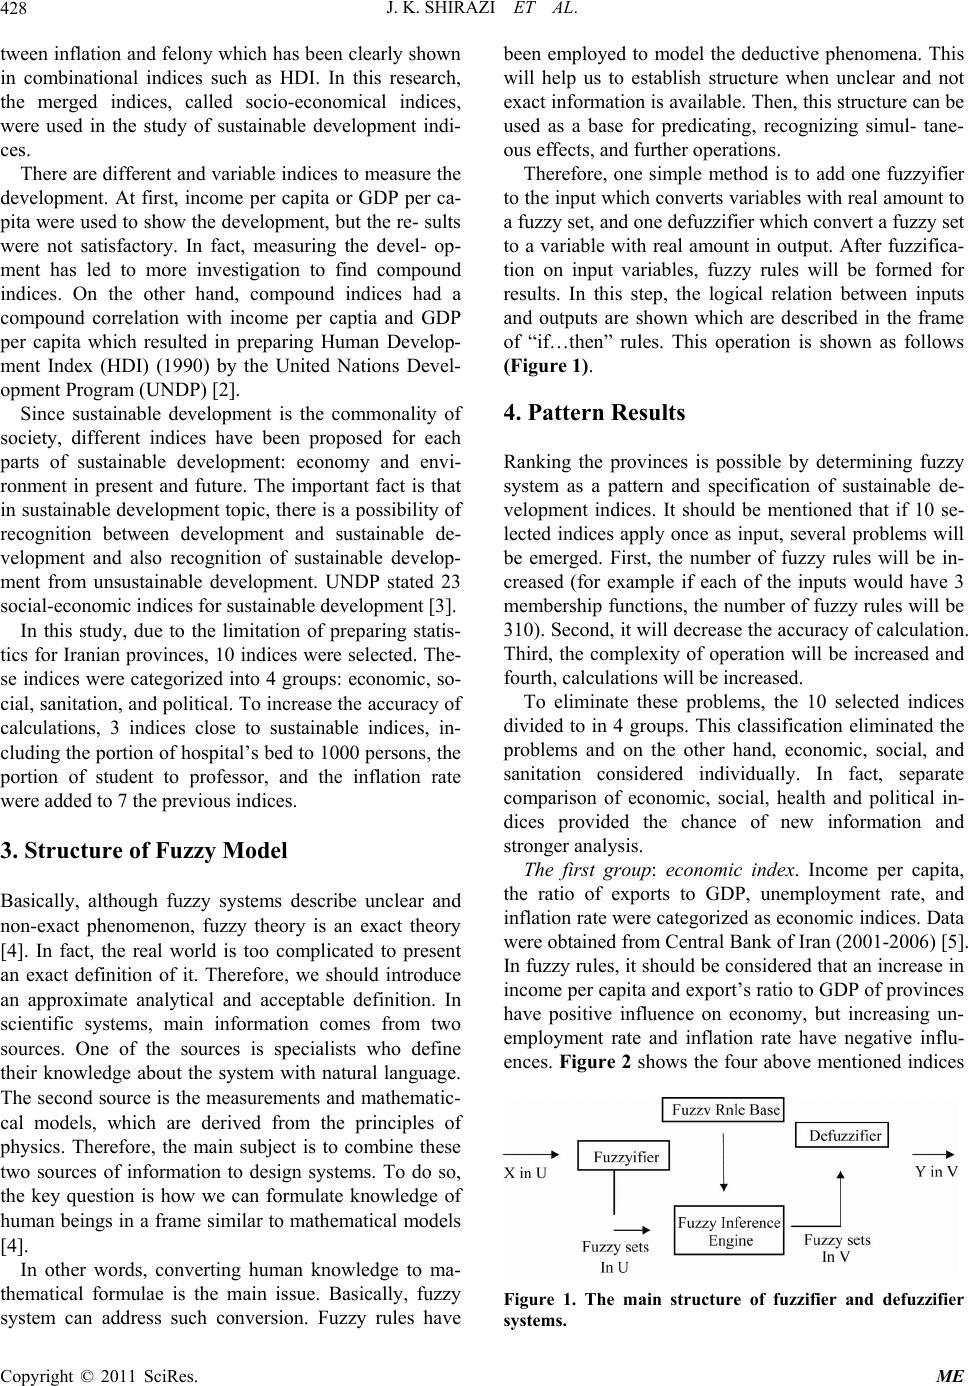 J. K. SHIRAZI ET AL. 428 tween inflation and felon y which has been clearly shown in combinational indices such as HDI. In this research, the merged indices, called socio-economical indices, were used in the study of sustainable development indi- ces. There are different and variable indices to measure the development. At first, income per capita or GDP per ca- pita were used to show the development, but th e re- sults were not satisfactory. In fact, measuring the devel- op- ment has led to more investigation to find compound indices. On the other hand, compound indices had a compound correlation with income per captia and GDP per capita which resulted in preparing Human Develop- ment Index (HDI) (1990) by the United Nations Devel- opment Program (UNDP) [2]. Since sustainable development is the commonality of society, different indices have been proposed for each parts of sustainable development: economy and envi- ronment in present and future. The important fact is that in sustainable develop ment topic, there is a possibility of recognition between development and sustainable de- velopment and also recognition of sustainable develop- ment from unsustainable development. UNDP stated 23 social-economic indices for sustainable deve lopment [3]. In this study, due to the limitation of preparing statis- tics for Iranian provinces, 10 indices were selected. The- se indices were categorized into 4 groups: economic, so- cial, sanitation, and political. To increase the accuracy of calculations, 3 indices close to sustainable indices, in- cluding the portion of hospital’s bed to 1000 persons, the portion of student to professor, and the inflation rate were added to 7 the previous indices. 3. Structure of Fuzzy Model Basically, although fuzzy systems describe unclear and non-exact phenomenon, fuzzy theory is an exact theory [4]. In fact, the real world is too complicated to present an exact definition of it. Therefore, we should introduce an approximate analytical and acceptable definition. In scientific systems, main information comes from two sources. One of the sources is specialists who define their knowledge about the system with natural language. The second source is the measurements and mathematic- cal models, which are derived from the principles of physics. Therefore, the main subject is to combine these two sources of information to design systems. To do so, the key question is how we can formulate knowledge of human beings in a frame similar to mathematical models [4]. In other words, converting human knowledge to ma- thematical formulae is the main issue. Basically, fuzzy system can address such conversion. Fuzzy rules have been employed to model the deductive phenomena. This will help us to establish structure when unclear and not exact information is available. Then, this structure can be used as a base for predicating, recognizing simul- tane- ous effects, and further operations. Therefore, one simple method is to add one fuzzyifier to the input which converts variables with real amount to a fuzzy set, and one defuzzifier which convert a fuzzy set to a variable with real amount in output. After fuzzifica- tion on input variables, fuzzy rules will be formed for results. In this step, the logical relation between inputs and outputs are shown which are described in the frame of “if…then” rules. This operation is shown as follows (Figure 1). 4. Pattern Results Ranking the provinces is possible by determining fuzzy system as a pattern and specification of sustainable de- velopment indices. It should be mentioned that if 10 se- lected indices apply once as input, several problems will be emerged. First, the number of fuzzy rules will be in- creased (for example if each of the inputs would have 3 membership functions, the number of fuzzy rules will be 310). Second, it will decrease the accuracy of calculation. Third, the complexity of operation will be increased and fourth, calculations will be increased. To eliminate these problems, the 10 selected indices divided to in 4 groups. This classification eliminated the problems and on the other hand, economic, social, and sanitation considered individually. In fact, separate comparison of economic, social, health and political in- dices provided the chance of new information and stronger analysis. The first group: economic index. Income per capita, the ratio of exports to GDP, unemployment rate, and inflation rate were categorized as economic indices. Data were obtained from Centra l Ban k of Ir an (200 1-2 006) [5]. In fuzzy rules, it should be consid ered that an increase in income per capita and export’s ratio to GDP of provinces have positive influence on economy, but increasing un- employment rate and inflation rate have negative influ- ences. Figure 2 shows the four above mentioned indices Figure 1. The main structure of fuzzifier and defuzzifier systems. Copyright © 2011 SciRes. ME 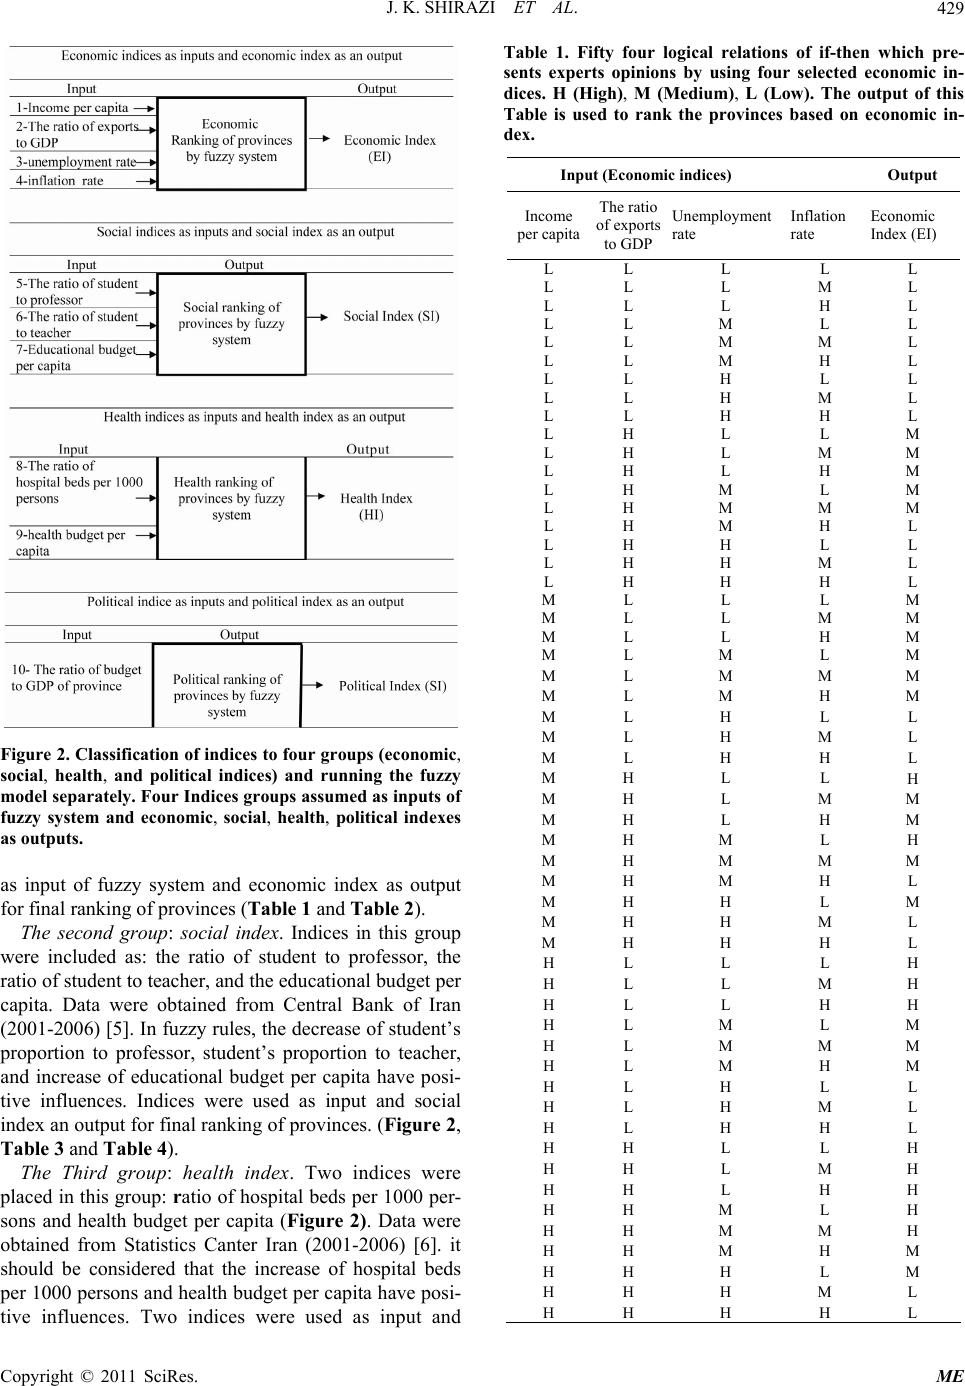 J. K. SHIRAZI ET AL.429 Figure 2. Classification of indices to four groups (economic s input of fuzzy system and economic index as output up w ealth index. Two indices were pl Input (Economic indices) Output , social, health, and political indices) and running the fuzzy model separately. Four Indices groups assumed as inputs of fuzzy system and economic, social, health, political indexes as outputs. a for final ranking o f provinces (Table 1 and Table 2). The second group: social index. Indices in this gro ere included as: the ratio of student to professor, the ratio of student to teache r, and the edu cation al budget per capita. Data were obtained from Central Bank of Iran (2001-2006) [5]. In fu zzy rules, the decrease of student’s proportion to professor, student’s proportion to teacher, and increase of educational budget per capita have posi- tive influences. Indices were used as input and social index an ou tput for f inal ra nking of pr ovinces. ( Figure 2, Table 3 and Ta ble 4). The Third group: h aced in this group: ratio of hospital beds per 1000 per- sons and health budget per capita (Figure 2). Data were obtained from Statistics Canter Iran (2001-2006) [6]. it should be considered that the increase of hospital beds per 1000 persons and health budget per capita have posi- tive influences. Two indices were used as input and Table 1. Fifty four logical relations of if-then which pre- sents experts opinions by using four selected economic in- dices. H (High), M (Medium), L (Low). The output of this Table is used to rank the provinces based on economic in- dex. Income Unemployment Inflation Economic per capita The ratio of exports to GDPrate rate Index (EI) L L L LL L L L M L L L L H L L L M L L L L M M L L L M H L L L H L L L L H M L L L H H L L H L L M L H L M M L H L H M L H M L M L H M M M L H M H L L H H L L L H H M L L H H H L M L L L M M L L M M M L L H M M L M L M M L M M M M L M H M M L H L L M L H M L M L H H L M H L L H M H L M M M H L H M M H M L H M H M M M M H M H L M H H L M M H H M L M H H H L H L L L H H L L M H H L L H H H L M L M H L M M M H L M H M H L H L L H L H M L H L H H L H H L L H H H L M H H H L H H H H M L H H H M M H H H M H M H H H L M H H H M L H H H H L Copyright © 2011 SciRes. ME 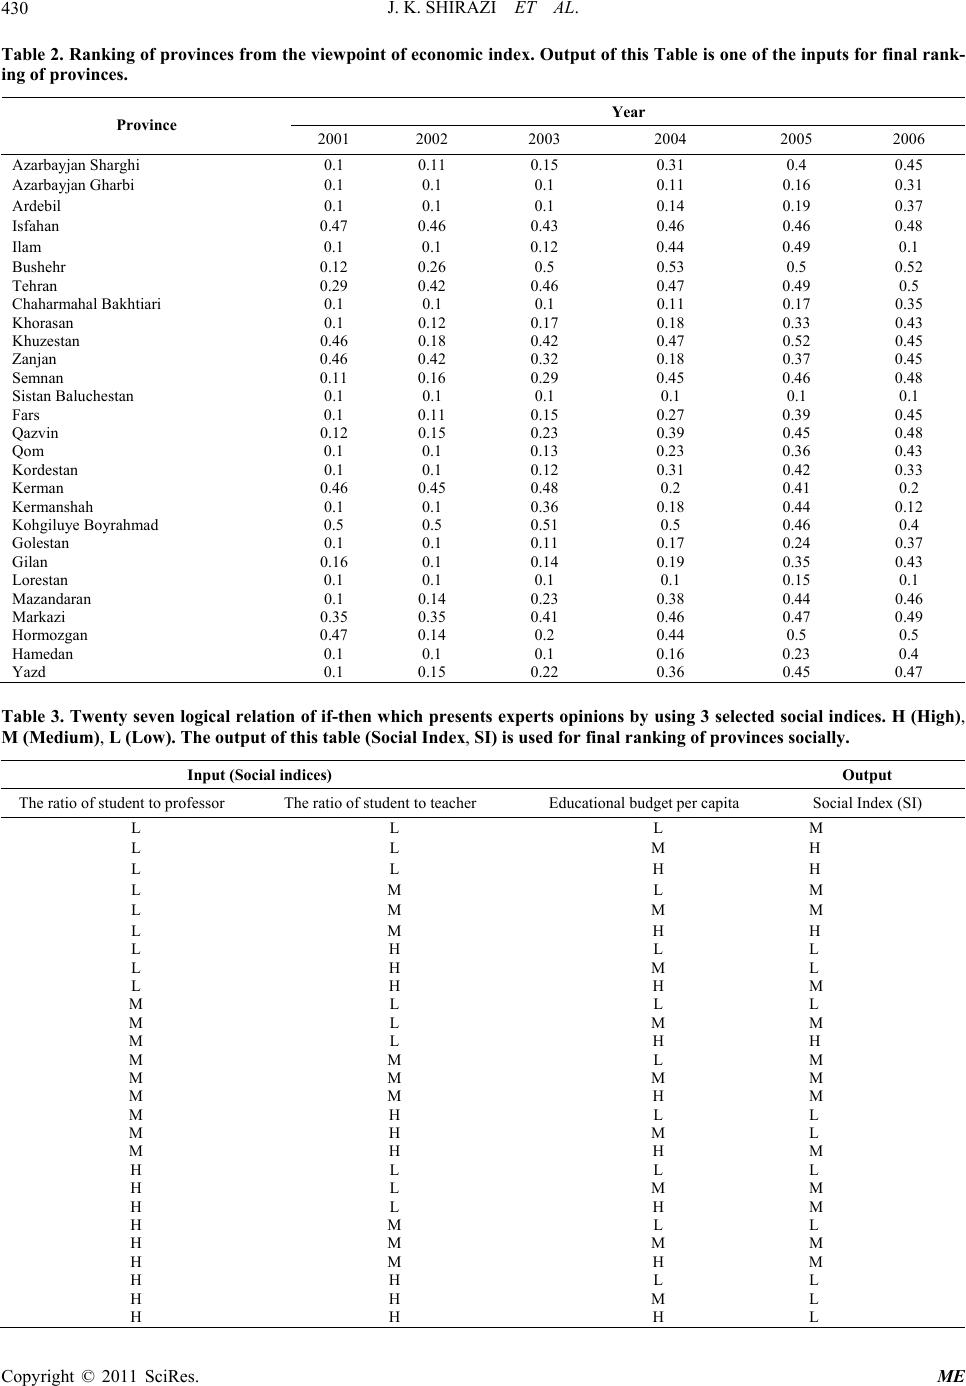 J. K. SHIRAZI ET AL. Copyright © 2011 SciRes. ME 430 Table 2. Ranking of provinces from the viewpoint oonomic index. Output of this Table is one of the inputs for final rank- Year f ec ing of provinces. Province 2001 2002 2003 2004 2005 2006 Azarbayjan Shar ghi 0.1 0.11 0.15 0.31 0.4 0.45 Azarbayjan Gharbi 0.1 0.1 0.1 0.11 0.16 0.31 Ardebil 0.1 0.1 0.1 0.14 0.19 0.37 Isfahan 0.47 0.46 0.43 0.46 0.46 0.48 Ilam 0.1 0.1 0.12 0.44 0.49 0.1 Bushehr ahal Bakhtiari luchestan in stan hah yrahmad n an an 0.12 0.26 0.5 0.53 0.5 0.52 Tehran 0.29 0.42 0.46 0.47 0.49 0.5 Chaharm0.1 0.1 0.1 0.11 0.17 0.35 Khorasan 0.1 0.12 0.17 0.18 0.33 0.43 Khuzestan0.46 0.18 0.42 0.47 0.52 0.45 Zanjan 0.46 0.42 0.32 0.18 0.37 0.45 Semnan 0.11 0.16 0.29 0.45 0.46 0.48 Sistan Ba0.1 0.1 0.1 0.1 0.1 0.1 Fars 0.1 0.11 0.15 0.27 0.39 0.45 Qazv0.12 0.15 0.23 0.39 0.45 0.48 Qom 0.1 0.1 0.13 0.23 0.36 0.43 Korde0.1 0.1 0.12 0.31 0.42 0.33 Kerman 0.46 0.45 0.48 0.2 0.41 0.2 Kermans0.1 0.1 0.36 0.18 0.44 0.12 Kohgiluye Bo0.5 0.5 0.51 0.5 0.46 0.4 Golestan 0.1 0.1 0.11 0.17 0.24 0.37 Gilan 0.16 0.1 0.14 0.19 0.35 0.43 Loresta0.1 0.1 0.1 0.1 0.15 0.1 Mazandar0.1 0.14 0.23 0.38 0.44 0.46 Markazi 0.35 0.35 0.41 0.46 0.47 0.49 Hormozg0.47 0.14 0.2 0.44 0.5 0.5 Hamedan 0.1 0.1 0.1 0.16 0.23 0.4 Yazd 0.1 0.15 0.22 0.36 0.45 0.47 Table 3. Twenty seven logical relation of if-then which presents experts opinions by using 3 selected social indices. H (High), Input (Social indices) Output M (Medium), L (Low). The output of this table (Social Index, SI) is used for final ranking of provinces socially. The ratio of student to pro of student to teacher Educational budget per capita Social Index (SI) fessor The ratio L L L M L L M H L L H H L M L M L M M M L M H H L H L L L H M L L H H M M L L L M L M M M L H H M M L M M M M M M M H M M H L L M H M L M H H M H L L L H L M M H L H M H M L L H M M M H M H M H H L L H H M L H H H L 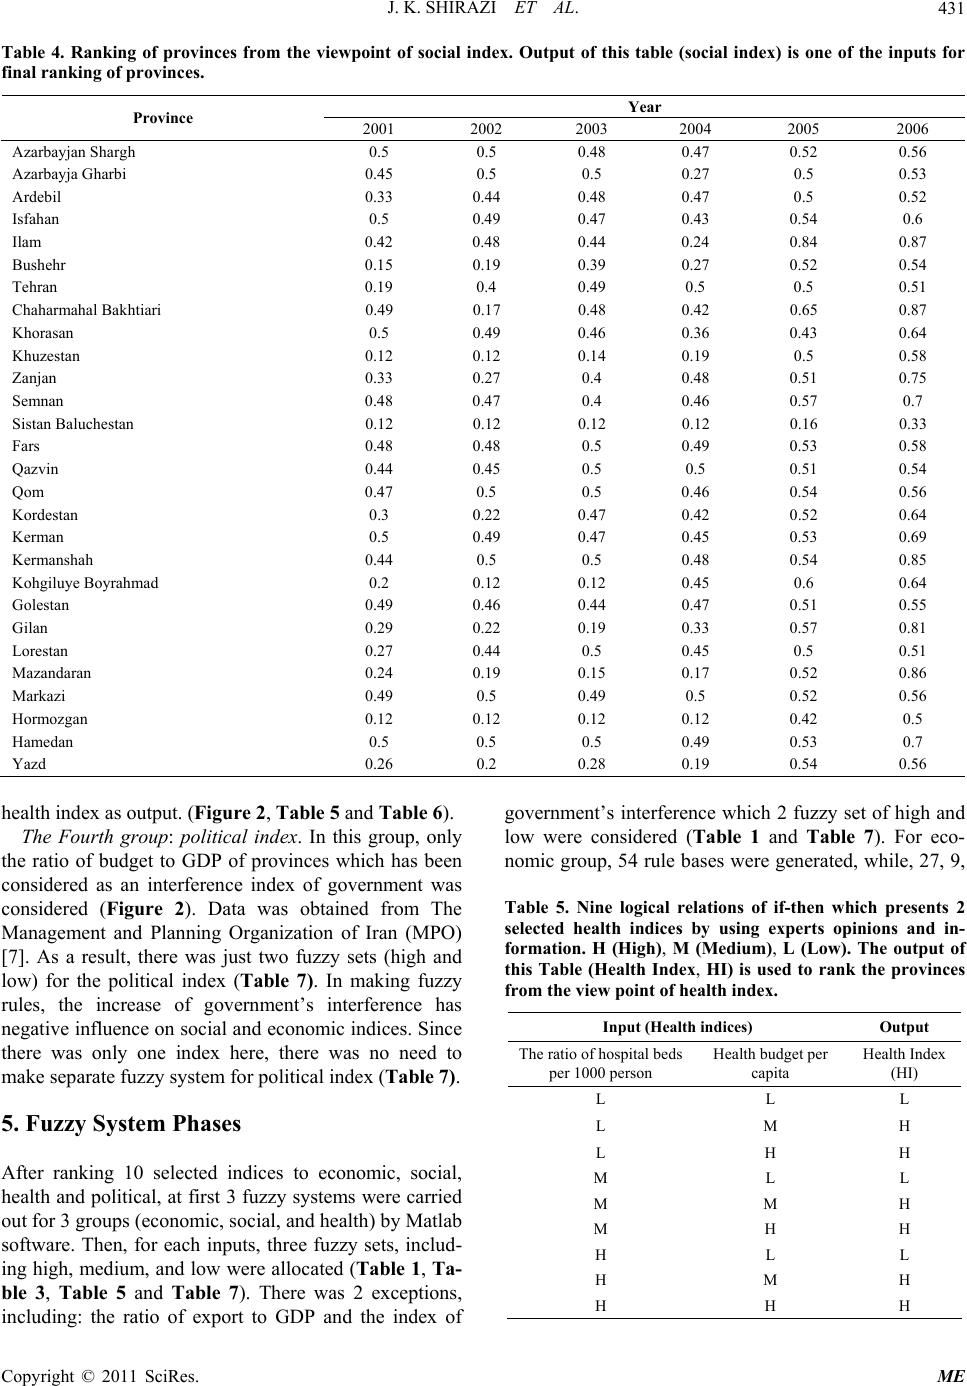 J. K. SHIRAZI ET AL.431 Table 4. Ranking of provinces from the viewpoint of social index. Output of this table (social index) is of the inputs for Year one final ranking of provinces. Province 2001 2002 2003 2004 2005 2006 Azarbayjan Shargh 0.5 0. 5 0.48 0.47 0.52 0.56 Azarbayja Gharbi 0.45 0.5 0.5 0.27 0.5 0.53 Ardebil 0.33 0.44 0.48 0.47 0.5 0.52 Isfahan 0.5 0.49 0.47 0.43 0.54 0.6 Ilam 0.42 0.48 0.44 0.24 0.84 0.87 Bushehr ahal Bakhtiari luchestan in stan hah yrahmad n an an 0.15 0.19 0.39 0.27 0.52 0.54 Tehran 0.19 0.4 0.49 0.5 0.5 0.51 Chaharm0.49 0.17 0.48 0.42 0.65 0.87 Khorasan 0.5 0.49 0.46 0.36 0.43 0.64 Khuzestan0.12 0.12 0.14 0.19 0.5 0.58 Zanjan 0.33 0.27 0.4 0.48 0.51 0.75 Semnan 0.48 0.47 0.4 0.46 0.57 0.7 Sistan Ba0.12 0.12 0.12 0.12 0.16 0.33 Fars 0.48 0.48 0.5 0.49 0.53 0.58 Qazv0.44 0.45 0.5 0.5 0.51 0.54 Qom 0.47 0.5 0.5 0.46 0.54 0.56 Korde0.3 0.22 0.47 0.42 0.52 0.64 Kerman 0.5 0.49 0.47 0.45 0.53 0.69 Kermans0.44 0.5 0.5 0.48 0.54 0.85 Kohgiluye Bo0.2 0.12 0.12 0.45 0.6 0.64 Golestan 0.49 0.46 0.44 0.47 0.51 0.55 Gilan 0.29 0.22 0.19 0.33 0.57 0.81 Loresta0.27 0.44 0.5 0.45 0.5 0.51 Mazandar0.24 0.19 0.15 0.17 0.52 0.86 Markazi 0.49 0.5 0.49 0.5 0.52 0.56 Hormozg0.12 0.12 0.12 0.12 0.42 0.5 Hamedan 0.5 0.5 0.5 0.49 0.53 0.7 Yazd 0.26 0.2 0.28 0.19 0.54 0.56 ealth index as output. (Figure 2, Table 5 and Table 6). th After ranking 10 selected indices to economic, social, government’s interference which 2 fuzzy set of high and selected health indices by ug experts opinions and in- hThe Fourth group: political index. In this group, only e ratio of budget to GDP of provinces which has been considered as an interference index of government was considered (Figure 2). Data was obtained from The Management and Planning Organization of Iran (MPO) [7]. As a result, there was just two fuzzy sets (high and low) for the political index (Table 7). In making fuzzy rules, the increase of government’s interference has negative influence on social and economic indices. Since there was only one index here, there was no need to make separate fuzzy system for political index (Table 7). 5. Fuzzy System Phases health and political, at first 3 fuzzy systems were carried out for 3 groups (economic, social, and health) by Matlab software. Then, for each inputs, three fuzzy sets, includ- ing high, medium, and low were allocated (Table 1, Ta- ble 3, Table 5 and Table 7). There was 2 exceptions, including: the ratio of export to GDP and the index of low were considered (Table 1 and Table 7). For eco- nomic group, 54 rule bases were generated, while, 27, 9, Table 5. Nine logical relations of if-then which presents 2 sin formation. H (High), M (Medium), L (Low). The output of this Table (Health Index, HI) is used to rank the provinces from the view point of health index. Input (Health indices) Output The ratio of hospital beds per 100Health budget per pita Health Index 0 person ca(HI) L L L L M H L H H M L L M M H M H H H L L H M H H H H Copyright © 2011 SciRes. ME  J. K. SHIRAZI ET AL. 432 Table 6. Ranking of provinces frpoint of health inde Output of this Table is one of tnputs for finanking Year om the viewx. he il ra of provinces. Province 2001 2002 2003 2004 2005 2006 Azarbayjan Sharghi 0.26 0.26 0.26 0.26 0.26 0.26 Azarbayjan Gharbi 0.26 0.26 0.26 0.26 0.27 0.27 Ardebil 0.74 0.74 0.74 0.74 0.26 0.26 Isfahan 0.34 0.36 0.37 0.39 0.26 0.29 Ilam 0.74 0.74 0.74 0.74 0.74 0.74 Bushehr ahal Bakhtiari luchestan in stan hah yrahmad n an an 0.74 0.74 0.74 0.74 0.74 0.74 Tehran 0.33 0.33 0.34 0.34 0.26 0.26 Chaharm0.74 0.74 0.74 0.74 0.72 0.74 Khorasan 0.74 0.74 0.74 0.74 0.28 0.72 Khuzestan0.26 0.26 0.26 0.26 0.26 0.28 Zanjan 0.74 0.74 0.74 0.74 0.26 0.26 Semnan 0.74 0.74 0.74 0.74 0.26 0.38 Sistan Ba0.74 0.74 0.74 0.74 0.26 0.73 Fars 0.68 0.7 0.71 0.72 0.26 0.59 Qazv0.7 0.71 0.71 0.72 0.26 0.34 Qom 0.36 0.37 0.39 0.4 0.57 0.74 Korde0.74 0.74 0.74 0.74 0.74 0.39 Kerman 0.72 0.72 0.72 0.73 0.74 0.74 Kermans0.26 0.26 0.26 0.26 0.74 0.74 Kohgiluye Bo0.74 0.74 0.74 0.74 0.74 0.74 Golestan 0.74 0.74 0.74 0.74 0.26 0.73 Gilan 0.66 0.68 0.7 0.71 0.26 0.66 Loresta0.74 0.74 0.74 0.74 0.26 0.66 Mazandar0.26 0.26 0.26 0.26 0.27 0.67 Markazi 0.66 0.68 0.69 0.71 0.72 0.64 Hormozg0.74 0.74 0.74 0.74 0.71 0.69 Hamedan 0.74 0.74 0.74 0.74 0.27 0.63 Yazd 0.74 0.74 0.74 0.74 0.65 0.74 wo logical relations of if-then ofratio of udget to province’s GDP. H (High) L (Low). Its two out- Output Table 7. T b the , puts were used as a political index and as an input for final ranking of provinces. Input The ratio of budget to province’s GDP Index (PI) Political L L H H n 2 rule bases were obtained for and po- and Table 7). adsocial health, litical groups respectively (Table 1, Table 3, Table 5, and Table 7). Their outputs made economic, social, health, and political indices (Table 1, Table 3, Table 5, The obtained results were employed as inputs of the second phase fuzzy system for the last ranking of prov- inces which totally produced 36 rule bases (Table 8). In the next phase, the generated output was a number be tween zero and one, providing a practical quantity to compare provinces. The fuzzy system made 3 outputs for economic group, 2 outputs for social group, 2 for health, and 2 for political g roup which are summarized in Table 9. The result of these outputs were 36 cases indi- cating 36 relation of “if…then” between inputs and out- puts of system. These rules were obtained by opinions and experiences of experts (Table 9). By using MAT- LAB software and entering information from 2001 to Copyright © 2011 SciRes. ME 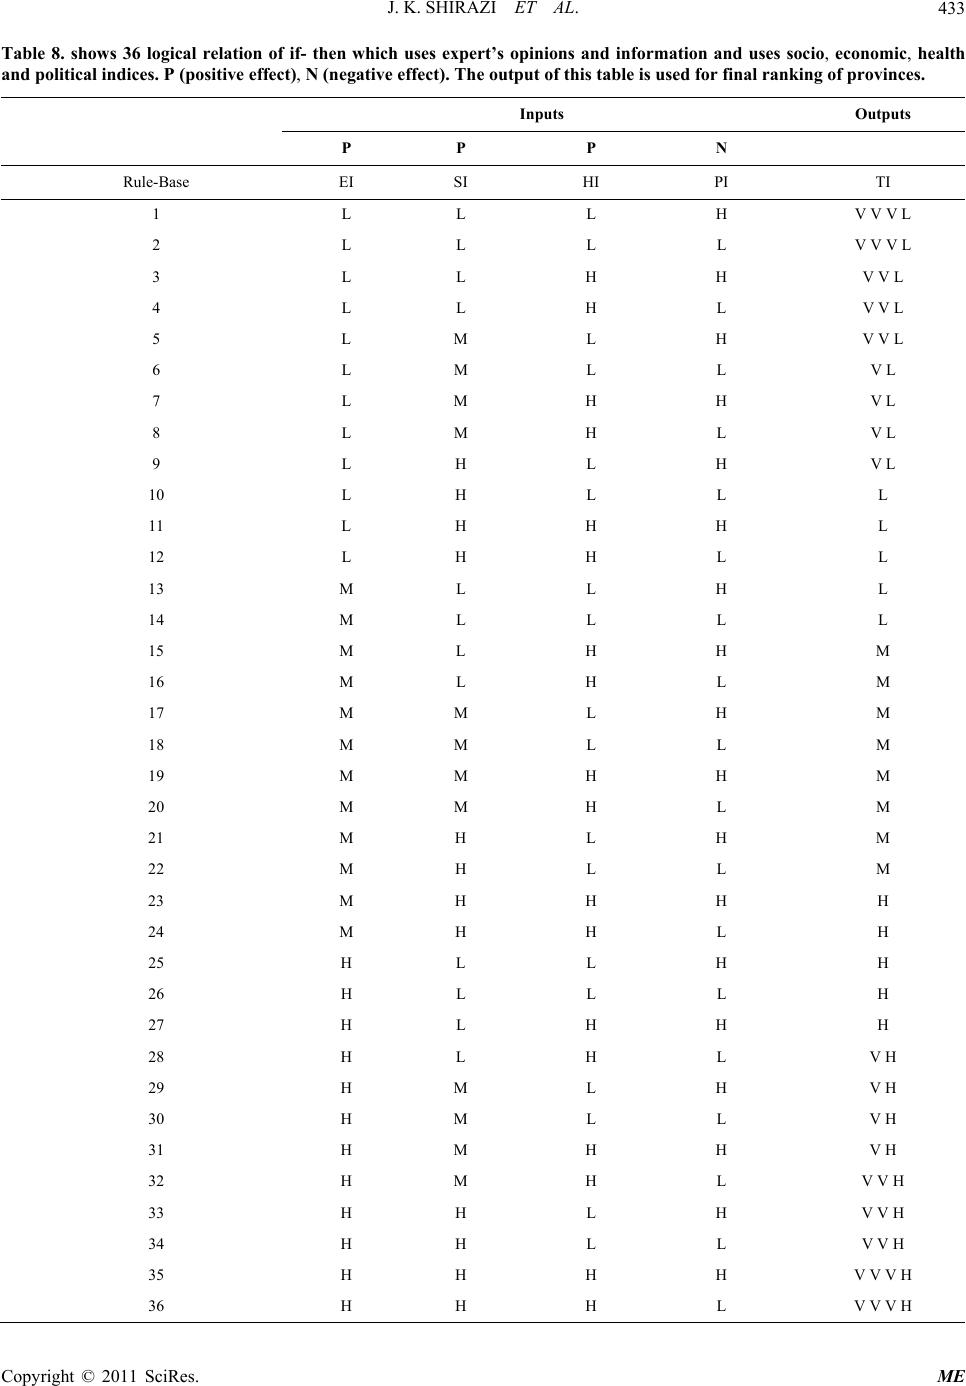 J. K. SHIRAZI ET AL.433 rt’sTable 8. shows 36 logical relation of if- then which uses expe opinions and information and uses socio, economic, health and political indices. P (positive effect), N (negative effect). The output of this table is used for final ranking of provinces. Inputs Outputs P P P N Rule-Base EI SI HI PI TI 1 V V V L L L L H 2 L L L L V L V V V V V V 3 L L H H V V L 4 L L H L V V L 5 L M L H V V L 6 L M L L V L 7 L M H H V L 8 L M H L V L 9 L H L H V L 10 L H L L L 11 L H H H L 12 L H H L L 13 M L L H L 14 M L L L L 15 M L H H M 16 M L H L M 17 M M L H M 18 M M L L M 19 M M H H M 20 M M H L M 21 M H L H M 22 M H L L M 23 M H H H H 24 M H H L H 25 H L L H H 26 H L L L H 27 H L H H H 28 H L H L H 29 H M L H H 30 H M L L V H 31 H M H H V H 32 H M H L V H 33 H H L H V H 34 H H L L V V H 35 H H H H V V V H 36 H H H L V V V H Copyright © 2011 SciRes. ME 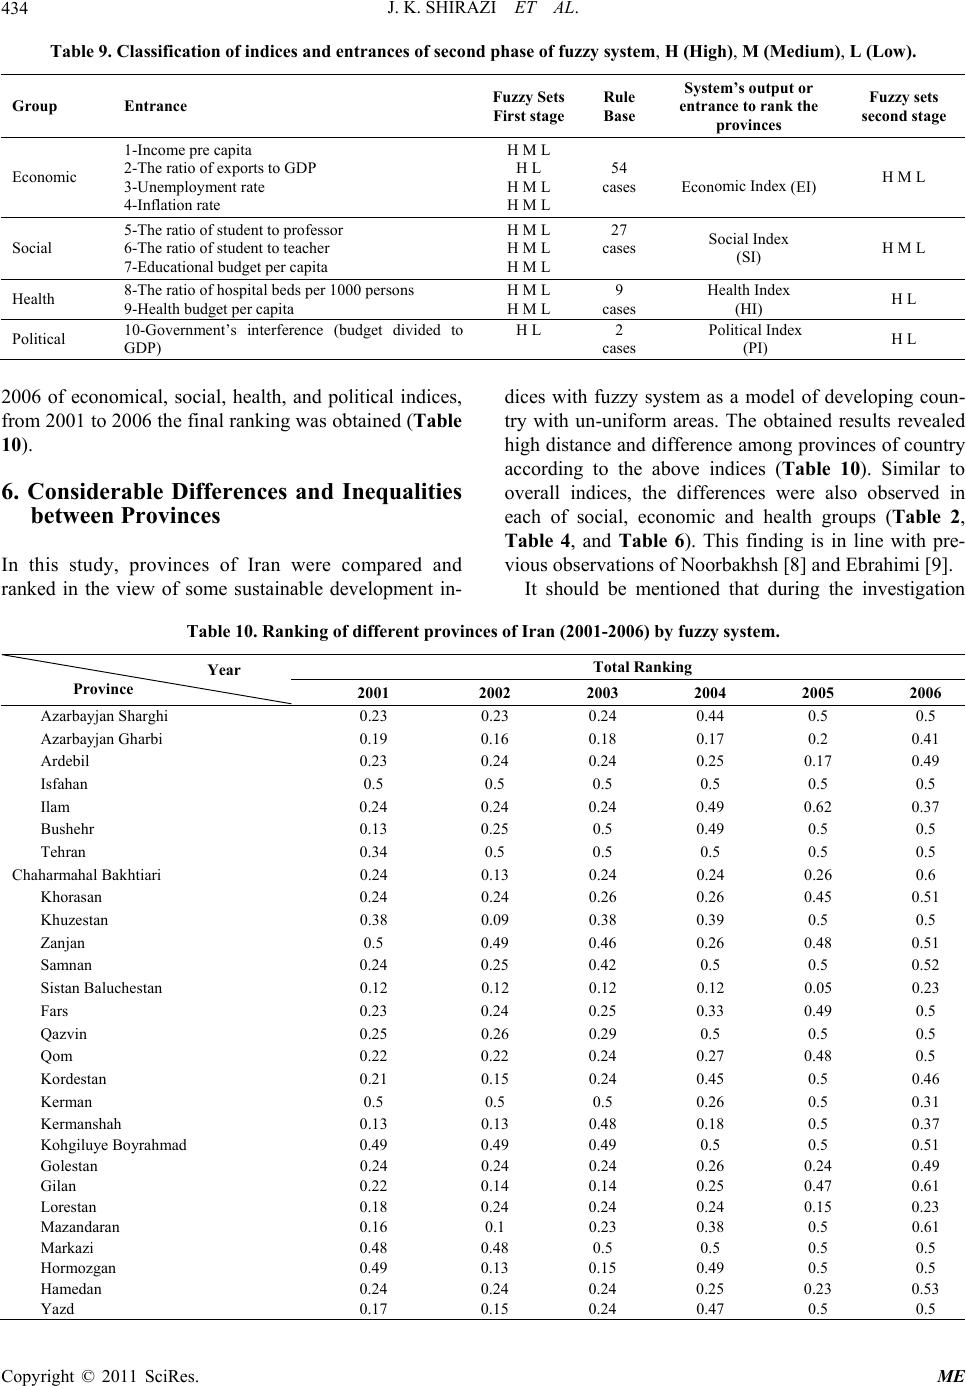 J. K. SHIRAZI ET AL. 434 Table 9. Clascation of indices and ances of sed phase of fuzystem, H (Hi M (Medium), Grou Fuzzy Sets Systeutput or ets ge sifientrconzy sgh),L (Low). p Entrance First stage Base entrance to rank the provinces second sta Rule m’s oFuzzy s Economic 1-Income pre capita of exports to GDP 3-Unemployment rate Econ(EI) 2-The ratio 4-Inflation rate H M L H L H M L H M L 54 cases omic Index H M L Social 5-The ratio of student to professor teacher dget per capita H 6-The ratio of student to 7-Educational bu M L H M L H M L 27 cases Social Index (SI) H M L Health 8-The ratio of hospital beds per 1000 persons 9-Health budget per capita H M L H M L 9 cases Health Index (HI) H L Political budget divided to cases Political Index H L 10-Government’s interference ( GDP) H L 2 (PI) 2006 of econo om 2001 to 2e final ranking was obtained (Table etween Provinces ranainable development in- dwith fstem f developioun- try with un-rm areas. Ttained results revealed es mical, social, health, and political indices, 006 thfr 10). 6. Considerable Differences and Inequalities b In this study, provinces of Iran were compared and ked in the view of some sust ices u sy unifo zzyas a model ong c he ob high distance and difference among provinces of country according to the above indices (Table 10). Similar to overall indices, the differences were also observed in each of social, economic and health groups (Table 2, Table 4, and Table 6). This finding is in line with pre- vious observations of Noorbakhsh [8] and Ebrahimi [9]. It should be mentioned that during the investigation of Iran (2001-2006) by fuzzy system. Table 10. Ranking of different provinc Total Ranking Year Province 2001 2002 2003 2004 2005 2006 Azarbayjan Shar ghi 0.23 0.23 0.0.44 0.5 0.5 24 Azarbi 0.19 0.16 17 0.2 0.41 Ardebil Chahal Bakhtiari an hestan stan nshah rahmad an i n bayjan Ghar0.18 0. 0.23 0.24 0.24 0.25 0.17 0.49 Isfahan 0.5 0.5 0.5 0.5 0.5 0.5 Ilam 0.24 0.24 0.24 0.49 0.62 0.37 Bushehr 0.13 0.25 0.5 0.49 0.5 0.5 Tehran 0.34 0.5 0.5 0.5 0.5 0.5 harma0.24 0.13 0.24 0.24 0.26 0.6 Khorasan0.24 0.24 0.26 0.26 0.45 0.51 Khuzest0.38 0.09 0.38 0.39 0.5 0.5 Zanjan 0.5 0.49 0.46 0.26 0.48 0.51 Samnan 0.24 0.25 0.42 0.5 0.5 0.52 Sistan Baluc0.12 0.12 0.12 0.12 0.05 0.23 Fars 0.23 0.24 0.25 0.33 0.49 0.5 Qazvin 0.25 0.26 0.29 0.5 0.5 0.5 Qom 0.22 0.22 0.24 0.27 0.48 0.5 Korde0.21 0.15 0.24 0.45 0.5 0.46 Kerman 0.5 0.5 0.5 0.26 0.5 0.31 Kerma0.13 0.13 0.48 0.18 0.5 0.37 Kohgiluye Boy0.49 0.4 9 0.49 0.5 0.5 0.51 Golestan 0.24 0.24 0.24 0.26 0.24 0.49 Gilan 0.22 0.14 0.14 0.25 0.47 0.61 Lorestan 0.18 0.24 0.24 0.24 0.15 0.23 Mazandar0.16 0.1 0.23 0.38 0.5 0.61 Markaz0.48 0.48 0.5 0.5 0.5 0.5 Hormozga0.49 0.13 0.15 0.49 0.5 0.5 Hamedan 0.24 0.24 0.24 0.25 0.23 0.53 Yazd 0.17 0.15 0.24 0.47 0.5 0.5 Copyright © 2011 SciRes. ME  J. K. SHIRAZI ET AL.435 es are Table 11. Duality among provinces, by using absolute value of average deviation, in a way that whenever duality increases, (in negative or positive side) provinc at the beginning of the table and whenever duality decre ase s, provinces are at the end of the table. Copyright © 2011 SciRes. ME 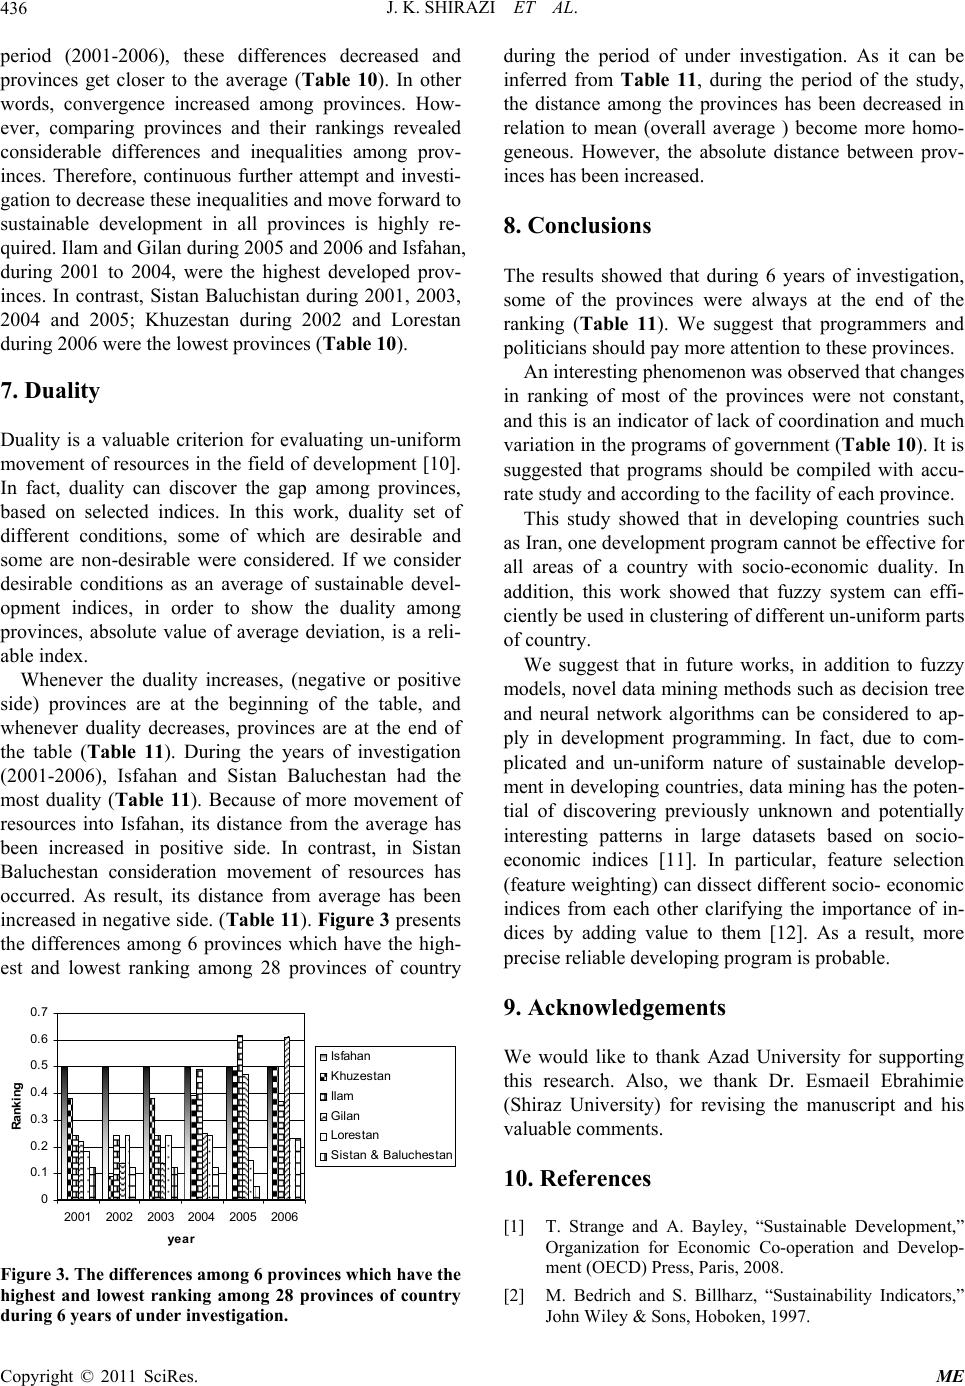 J. K. SHIRAZI ET AL. Copyright © 2011 SciRes. ME 436 perio2001-2006), these differences decreased and provinces get closer to the average (Table 10). In other words, convergence increased among provinces. How- ever,paring provinces and their rankings revealed considerable differences and inequalities among prov- inceserefore, continuous further attempt and investi- gatio decrease these ineq ualities and move forward to sustae development in all provinces is highly re- quiream and Gilan during 2005 and 2006 and Isfah an, durin001 to 2004, were the highest developed prov- inces contrast, Sistan Baluchistan during 2001, 2003, 2004d 2005; Khuzestan during 2002 and Lorestan durin06 were the lowest provinces (Table 10). 7. Duality Duality is a valuable criterion for evaluating un-uniform movnt of resources in the field of development [10]. In fay can discover the gap among provinces, base selected indices. In this work, duality set of diffe conditions, some of which are desirable and someon-desirable were considered. If we consider desirnditions as an average of sustainable devel- opmices, in order to show the duality among provsolute value of average deviation, is a reli- able We duality increases, (negative or positive side)ces are at the beginning of the table, and whenuality decreases, provinces are at the end of the t1). During the years of investigation (200), Isfahan and Sistan Baluchestan had the mosty (Table 11). Because of more movement of resources into Isfahan, its distance from the average has beensed in positive side. In contrast, in Sistan Baluderation movement of resources has occus result, its distance from average has been incre negative side. (Tab le 11 ). Figure 3 presents the dces among 6 provinces which have the high- est aest ranking among 28 provinces of country d ( com . Th n to inabl d. Il g 2 . In an g 20 eme ct, dualit d on rent are n able co ent ind inces, ab index. henever th provin ever d able (Table 1 1-2006 dualit increa chestan consi rred. A ased in ifferen nd low 0 1 2 3 4 5 6 7 2001 0. 0. 0. 0. 0. 0. 0. 2002 20032004 2005 2006 year Ran k ing Isfah an K h uzestan Il am Gilan Lorestan Sistan & Baluchestan Figu e differences among 6 provinces which have the ranking among 28 provinces of country urinof under investigation. during the period of under investigation. As it can be inferred from Table 11, during the period of the study, the distance among the provinces has been decreased in relation to mean (overall average ) become more homo- geneous. However, the absolute distance between prov- inces has been increased. 8. Conclusions The results showed that during 6 years of investigation, some of the provinces were always at the end of the ranking (Table 11). We suggest that programmers and politicians should pay more attention to these provinces. An interesting phenomenon was observed that changes in ranking of most of the provinces were not constant, and this is an indicator of lack of coordination and much variation in the programs of government (Table 10). It is suggested that programs should be compiled with accu- rate study and according to the facility of each province. This study showed that in developing countries such as Iran, one development program cannot be effective for all areas of a country with socio-economic duality. In addition, this work showed that fuzzy system can effi- ciently be used in clustering of different un-uniform parts of country. We suggest that in future works, in addition to fuzzy models, novel data mining methods such as decision tree and neural network algorithms can be considered to ap- ply in development programming. In fact, due to com- plicated and un-uniform nature of sustainable develop- ment in developing countries, data mining has the poten- tial of discovering previously unknown and potentially interesting patterns in large datasets based on socio- economic indices [11]. In particular, feature selection (feature weighting) can dissect different socio- economic indices from each other clarifying the importance of in- dices by adding value to them [12]. As a result, more precise reliable developing program is probable. 9. Acknowledgements We would like to thank Azad University for supporting this research. Also, we thank Dr. Esmaeil Ebrahimie (Shiraz University) for revising the manuscript and his valuable comments. 10. References [1] T. Strange and A. Bayley, “Sustainable Development,” Organization for Economic Co-operation and Develop- ment (OECD) Press, Paris, 2008. [2] M. Bedrich and S. Billharz, “Sustainability Indica John Wiley & Sons, Hoboken, 1997. re 3. Th g 6 ye highest and lowest ars tors,” d  J. K. SHIRAZI ET AL. Copyright © 2011 SciRes. ME 437 [3] L.-X. Wang, “A Course in Fuzzy Systems and Control,” Prentice Hall, Upper Saddle River, 1996. [4] H. J. Zimmermann, “Fuzzy Set Theory,” Kluwer Aca- demic Publishers, Norwell, 1996. [5] Central Bank of Iran, “The Index of the Good’s Price and Consumption Services in Urban Areas of Iran, 2001- 2006,” 2011. http://tsd.cbi.ir/ [6] Statistical Centre of Iran, 2011 . http://amar.sci.org.ir/ [7] The Management and Planning Organization of Iran (MPO), 2011. http://www.spac.ir/ [8] F. Noorbakhsh, “Human Development and Regional Disparities in Iran: A Policy Model,” Journal of Interna- tional Development, Vol. 14, No. 7, October 2002, pp. 927-949. doi:10.1002/jid.914 [9] M. Ebrahimi, M of Iranian. Noonejad and M. Ebrahimi, “ A Study ’s Free Zones Throughput; Success or Failure in Achieving Proposed Goal?” Journal of Applied Sciences, Vol. 8, No. 8, 2008, pp. 1576-1580. doi:10.3923/jas.2008.1576.1580 [10] M. Andreassen and F. Gertsen, “A Case Study of an Or- ganisation Development of Duality,” International Jour- nal of Technology Management, Vol. 42, No. 1-2, 2008, pp. 51-68. doi:10.1504/IJTM.2008.018060 Ebrahimie, “Sequence-Based Predic- Thermostability through Bioinformatics Algorithms,” Current Bioinformatics, Vol. 5, No. 3, 2010, [11] M. Ebrahimi and E. tion of Enzyme pp. 195-203. doi:10.2174/157489310792006693 [12] E. Bijanzadeh, Y. Emam and E. Ebrahimie, “Determining the Most Important Features Contributing to Wheat Grain Yield Using Supervised Feature Selection Model,” Aus- tralian Journal of Crop Science, Vol. 4, No. 6, 2010, pp. 402-407. |