 American Journal of Molecular Biology, 2011, 1, 70-78 doi:10.4236/ajmb.2011.12009 Published Online July 2011 (http://www.SciRP.org/journal/ajmb/ AJMB ). Published Online July 2011 in SciRes. http://www.scirp.org/journal/AJMB N–nitrosodiethylamine cytochrome P450 induction and cytotoxicity evaluation in primary cultures of rat hepatocytes Claudia Alessandra Fortes Aiub1,2, Gabriele Gadermaier3, Fátima Ferreira3, Israel Felzenszwalb4, Peter Eckl1, Luis Felipe Ribeiro Pinto2 1Department of Cell Biology, Division of Genetics, Salzburg University, Salzburg, Austria; 2Department of Biochemistry, Rio de Janeiro State University, Rio de Janeiro, Brazil; 3Department of Molecular Biology, Salzburg University, Salzburg, Austria; 4Department of Biophysics and Biometry, Rio de Janeiro State University, Rio de Janeiro, Brazil. E-mail: aiub@hotmail.com Received 28 March 2011; revised 27 May 2011; accepted 18 June 2011. ABSTRACT The primary routes of potential human exposure to N-nitrosodiethylamine (NDEA) are ingestion, inhala- tion, and dermal contact. Air, diet and smoking con- tribute to potential huma n exposure at levels of a few µg of NDEA/day. Potential exposure depends on the ability of the nitrosamines to migrate from the prod- uct into the body. The first step in the metabolic deg- radation of NDEA by cytochrome oxidase (CYPs) enzymes is the introduction of a hydroxyl group and in human esophage and liver CYP2A3 and CYP2E1 participate on this metabolism. Measuring cytotoxic- ity in female rat primary hepatocytes cultures, were used to understand the CYP induction and metaboli- zation correlated with low NDEA concentrations. We observed that NDEA at different concentrations in the absence of CYPs inducers, was able to induce CYP2B1, CYP2B2, CYP2E1, CYP3A1 and CYP4A3. A positive NDEA synergistic effect on the levels of mRNA, was observed in the presence of pyrazole (300 µM) for CYP2B1 and CYP2B2 and for pregne- nolone 16-α carbonitrile (0.15 µM) for CYP2E1. Negative NDEA synergistic effects were observed for ethanol (0.3%) for CYP3A1, pyrazol (300 µM) for CYP2A1 and CYP2E1, and phenobarbital (1 mM) for CYP2A1. These facts are extremally important once that these metabolites can be directly related to the primary DNA lesions. We consider that studies to elucidate the biological factors that determine the shape of the dose-response curve are crucial for low- dose extrapol ations of risk. Keywords: N-Nitrosodiethylamine; Cytochrome P450; Cytotoxicity; Primary Culture; Hepatocyte; Real-Time PCR. 1. INTRODUCTION Cytochrome oxidase (CYPs) form a superfamily of haem- thiolate proteins present in prokaryotes and throughout the eukaryotes. CYPs act as mono-oxygenases, with functions ranging from the synthesis and degradation of endogenous steroid hormones, vitamins and fatty acid derivatives (“endobiotics”) to the metabolism of foreign compounds such as drugs, environmental pollutants, and carcinogens (“xenobiotics”) [1]. The majority of the CYP isoforms are found in the liver, however other ex- tra-hepatic sites include the center nervous system, gas- trointestinal tract, kidney, lungs, and adrenal glands [2]. CYP gene expression is regulated by several factors, as gender, microsomal enzyme inducers, age, diet, and hormones. Differences in the amounts and intrinsic ca- pacities of CYP forms to metabolize a particular drug or chemical may influence profoundly drug-drug interac- tions, drug or carcinogen activation and detoxification contributing to the development of cancer, Parkinson’s disease, and adrenal hyperplasia [3]. N-nitrosodiethylamine (NDEA) is activated by cyto- chrome P450 enzymes, resulting in ethylation of N and O atoms of most bases from DNA. The N7, and O6 po- sitions of guanine are preferable ethylated, and a lower level of ethylation is also observed at the O4 position of thymine [4]. O6-ethylguanine and O4-ethylthymine, if not repaired, will lead to mutation and tumour formation in superior animals [5]. NDEA is able to produce tu- mours in many species of animals and in a variety of organs, requiring metabolic activation through P450- catalyzed α-hydroxylation, generating unstable metabo- lites that will alkylate the DNA at the site of activation, in order to induce tumors [6]. Till the present, there is no evidence that NDEA is a CYP inducer or if CYP’s in-  C. A. F. Aiub et al. / American Journal of Molecular Biology 1 (2011) 70-78 71 duction can increase or decrease others previously in- duced CYPs. The presence of NDEA in foodstuffs has been a sub- ject of several reviews [7-11]. Druckrey and Preussmann (1962) postulated that NDEA formation could arise in tobacco smoke via the interaction of nitrogen oxides and tobacco amines [12]. Additionaly, mechanisms for the in vivo formation of NDEA may involve chemical and en- zymatic nitrosation especially dependent on the presence of both nitrate and nitroreductases [13-16]. In Wistar rats, a commonly used experimental model for oesophageal carcinogenesis, NDEA induces tumours at low doses. When higher doses are given for a shorter period, tumours originate mainly in the liver [5]. Rea- sons for such interorgan differences are currently un- known but it has been hypothesized that this could be due to different enzymes being responsible for the me- tabolic activation of NDEA [17,18]. The differences in the amounts and intrinsic capacities of CYP forms to metabolize a particular chemical may influence: drug-drug interactions, drug or carcinogen activation and detoxification. This knowledge has con- tributed to an increase in the scientific literature on CYP-dependent drug metabolism. Predicting the ability of a drug, like NDEA, to modulate CYP expression at an early stage may permit the identification of alternative noninducing chemical structures. For the pharmaceutical industry the potential induction of various CYPs by drugs candidates, is important once they can lead to tox- icity or reduce drug-drug interactions efficacy. During the last few years, there has been a great in- terest in developing rapid and simple tests to identify the effects of exposure to environmental agents that can in- duce DNA damage. Therefore, in the present study using primary female rat hepatocytes we 1) Analyzed the ef- fects of six microsomal enzyme inducers on CYPs ex- pression, and 2) Investigated NDEA participation on CYPs mRNA regulation. The data will provide essential information to whether classes of microsomal enzyme affect rat CYPs mRNA levels at low NDEA doses sug- gesting potential roles of specific ligand-activated tran- scription factor pathways. 2. MATERIAL AND METHODS 2.1. Animal Model This study was conducted in compliance NRC (National Research Council and the “Guide for the Care and Use of Laboratory Animals”. Female albine Fischer 344 rats (F-344/DuCrl) from Charles River Laboratories (Ger- many) between 6 - 8 weeks old were used for the ex- periments. Light/dark regime was 12/12 h, and standart pelleted rat feed and drinking water were supplied ad libitum. 2.2. Hepatocyte Isolation and Culture Hepatocytes were prepared according to the two-step collagenase perfusion method [19] with modifications [20]. Fischer 344 female rats were anesthetized with sodium pentobarbital (200 mg/kg) and following hepatic portal vein cannulation, livers were perfused with 200 mL of solution A (NaCl 142 mM, KCl 6.7 mM, HEPES 10 mM) pH 7.4, during 12 - 15 min at 15 mL/min. Liv- ers were subsequently perfused with 200 mL of solution C (9:1 of solution A and CaCl2 5.7mM), pH 7.4, con- taining 0.5 mg/mL collagenase (Collagenase Sigma IV, 125 CDU/mg, CAS 9001-12-1) for 20 min at 10 mL/min. Perfused livers were excised and dispersed in 50 mL of solution A and shaken in a closed, sterile container at 37˚C for 10 min. Hepatocyte preparation was filtered through 180 µm nylon filter and centrifuged at 500 rpm, for 10 min, at 4˚C. The wash was repeated and the cells resuspended in MEM eagle Ca++ 1.8 mM (Gibco), sup- plemented with NaHCO3 (26.2 mM), pyruvate 1mM, aspartic acid 0.2 mM and L-serine 0.2 mM. Hepatocytes were counted by hemacytometry, and (2 - 5) × 105 cells/mL were added to 60 mm, and (2 - 5) × 106 cells/mL were added to 90 mm collagen-coated dishes. Hepatocytes were allowed to attach for 2 hours. Viability, measured by Trypan blue staining, was approximately 85% - 90% and only preparations with viabilities greater than 80% were used in experiments. After attachment, the medium was removed and replaced with fresh MEM eagle Ca2+ 1.8 mM (Gibco). 2.3. Incubation of Cells To investigate the effects of drugs on CYP induction, primary rat hepatocytes were incubated after the first medium changed, for 14 - 16 h with the CYP inducers drug. Ethanol (ETOH), Pyrazole (PYR), and Phenobar- bital (PB) were prepared in NaCl 0.9% solution and added directly to cultures to give a final concentration of 0.3%, 300 µM and 1 mM. 3-Methylcholanthrene (3-MC), Streptozotocin (STR) and Pregnenolone 16- carboni- trile (PNC) were dissolved in ethanol 30% and added to culture medium to give a final concentration of 2 µM, 25 µM and 0.15 µM, respectively. After 14 - 16 h in the presence or in the absence (W/O group) of CYP inducers, rat hepatocytes were incubated during 3 h, at NDEA final concentrations ranging from 0.21 µg/mL to 105 µg/mL. All experiments were per- formed in triplicate, using five isogenic animals. 2.4. Cytotoxicity The studies were performed in triplicate as described by Eckl and Riegler (1987) with some modifications [20]. For determination of the number of apoptotic and ne- C opyright © 2011 SciRes. AJMB  C. A. F. Aiub et al. / American Journal of Molecular Biology 1 (2011) 70-78 72 crotic cells, MEM Eagle 0.4 mM was replaced by cold fixative methanol-glacial acetic acid (3:1) for 15 min on the petri dishes, rinsed with distilled water for 2 min and air dried. The fixed cells were stained with DAPI (0.2 pg/ml) dissolved in McIlvaine buffer (Citric acid 0.1M, Na2HPO4 0.2M, pH 7.0) for 40 min, washed with McIl- vaine buffer for 2 min, briefly rinsed with distilled water and mounted in glycerol. 1000 cells/petri dish (3000 cells per animal/group concentration) were analyzed under the fluorescence microscope (Reichert Univar). The cell death processes are presented as the percentage of cells in 3000 total cells per animal/group concentra- tion) analized. Apoptotic cells were characterized by the occurrence of nuclear condensation, DNA fragmentation, and perinuclear apoptotic bodies, using a fluorescence microscopy (×100 or higher). Necroses were character- ized by clumping, increased vacuolation and swelling on the cell membrane. 2.5. RNA Isolation Total RNA was isolated with TRIzol (Invitrogen, Ger- many) and treated with DNase I (0.5 Units) (Invitrogen), according to the manufacturer’s instructions, and disol- ved in DEPC water. The concentration of the isolated total RNA was spectrophotometricaly determined at A260nm and diluted in DEPC water at 2 µg/µL. Aliquots of RNA were analyzed by agarose/formadehyde gel electrophoresis to check RNA integrity and stored at –20˚C until further use. Development of primers for quantitative Real Time PCR Coding sequences for the genes listed in Tab le 1, were obtained from GenBank (http://www.ncbi.nml.nih. gov/GenBank). Target regions within the coding se- quences were determined through nucleotide sequence alignment comparisons of target within multiple member gene families using Vector NTI (Informax, Inc., Be- thesda, MD). A subfamily-specific region for each CYP was selected as the site of hybridization for either the 5’ or 3’ CYP PCR primer, and then complementary PCR oligos were screened on the basis of 1) Similar melting temperatures, 2) Similar oligo length and, 3) The produ- tion of a PCR amplicon with greater than 50% GC con- tent. All primers were submitted to the National Center for Biotechnological Information for nucleotide com- parison using the basic logarithmic alignment search tool (BLASTn) to ensure specificity. 2.6. cDNA Synthesis First-strand cDNA synthesis was performed on the re- maining DNase-treated total RNA which was reverse- transcribed using Oligo primers (0.3 ng/µL) and Super- scriptTM III bulk mix (Invitrogen), according to the manufacter’s instructions. In addition, duplicate no tem- plate control samples were run in identitical conditions. Table 1. Primer sequences used for Real-Time Quantitative RT-PCR. Gene/locationTm ˚CPrimerSequence Amplicon bp 67.5F AGTCCCTGCCCTT TGTACACACCGC 18S RNA (V01270) 69.5R ACCATC- CAATCGGTAG- TAGCGACGGG 152 68.1F TCAATCCTCACTG GCCAC- TATGCTGGACA CYP2A1 (J04187) 69.5R CAGAGGGACAC- CAAGAGCAT- GACGCTC 90 68 F CAGCCAGGTGTTT GAGTTCTTCTCTG GG CYP2B1 (AJ320166) 66.4R CCCTGTGCTTCTCC ACAATATGGCCA 122 66.1F ACATGTGAACA- GAGATTTCAT- GAGTACA- CATCTCAT CYP2B2 (J00720) 68.3R TGTAGACATAG- CACTGAGAC- CATATACA- GAGTCCAT 148 66.8F CTCCTCGTCATATC CATCTGGAAGAA- GATCT CYP2E1 (J02627) 63.7R TGGTGAAA- GACTTGGGGA- TATCCTTCAA 127 CYP3A1 63.9F GTTTATGGAAATTC GATGTGGAGTGCC AT 153 (M10161) 64.4R CCCGCCGGTTTGT GAAGACAGAAA 2.7. Real Time qRT-PCR Analysis Quantitative RT-PCR reactions were performed using the reagent mix and protocol contained in the BioRad iCycler iQ Real-Time Detection System (BioRad). Re- actions were run in duplicate, in a volume of 10 µL, containing 5 µL of the cDNA diluted 1:20 in DEPC wa- ter, 4.4 µL of the iQ SYBR Green Supermix and 0.6 µL of the primers mix (forward and reverse primers) at a 3 pmol/µL. The cycle was programmed to 95˚C, 3 min; 40 × (95˚C 1 min, 65˚C 1 min and 72˚C 1 min); 95˚C 1 min; 55˚C 1 min. For the melting curve analysis, it was used a gradient from 55˚C to 95˚C. Real-time PCR data were collected and analyzed on a Rotor-Gene 3000 (Corbett Research). The products were checked by aga- rose gel electrophoresis and by sequencing. The endpoint used in the real-time PCR quantification, CT value, is defined as the PCR cycle number that crosses an arbitrarily placed signal threshold. Average CT values from duplicate PCR reactions were normal- ized to average CT values for housekeeping gene from C opyright © 2011 SciRes. AJMB  C. A. F. Aiub et al. / American Journal of Molecular Biology 1 (2011) 70-78 73 Tabl e 2. NDEA cytotoxicity followed administration of classi- cal CYP inducers ETOH (0.3%), PYR (300 µM) and PB (1 mM). Inducer Assay condi- tions % Survival % Necrosis % Apoptosis NaCl 0.9% 98.7 ± 0.3 1.1 ± 0.4 0.2 ± 0.1 0.21 µg/mL 98.2 ± 0.4 1.6 ± 0.3 0.2 ± 0.1 2.1 µg/mL 97.4 ± 0.5*2.4 ± 0.5* 0.2 ± 0.1 21 µg/mL 97.2 ± 0.7*2.4 ± 0.6* 0.4 ± 0.2 W/O 105 µg/mL 97.2 ± 1.0 2.5 ± 1.0 0.4 ± 0.1* NaCl 0.9% 98.1 ± 0.6 1.4 ± 0.4 0.6 ±0.2 0.21 µg/mL 97.7 ± 0.6 1.6 ± 0.4 0.7 ± 0.1† 2.1 µg/mL 97.5 ± 0.6 1.5 ± 0.3 1.0 ± 0.3† 21 µg/mL 96.6 ± 1.4 2.5 ± 0.7 1.2 ± 0.4† ETOH 105 µg/mL 95.7 ± 1.1 2.6 ± 0.8 1.7 ± 0.2*†† NaCl 0.9% 98.7 ± 0.5 0.9 ± 0.1 0.4 ± 0.4 0.21 µg/mL 98.1 ± 0.2 1.2 ± 0.2 0.8 ± 0.0†† 2.1 µg/mL 97.0 ± 0.7 2.1 ± 0.4 0.9 ± 0.3† 21 µg/mL 95.1 ± 1.0*3.0 ± 0.2** 2.0 ± 0.8† PYR 105 µg/mL 95.9 ± 0.4*3.0 ± 0.1** 1.1 ± 0.2† NaCl 0.9% 98.0 ± 0.2 1.3 ± 0.1 0.8 ± 0.1†† 0.21 µg/mL 97.9 ± 0.5 1.5 ± 0.3 0.7 ± 0.2† PB 2.1 µg/mL 93.8 ± 0.3**†† 4.8 ± 0.5*† 1.4 ± 0.2†† 21 µg/mL 93.4 ± 0.4**†† 4.7 ± 0.0**† 2.0 ± 0.4*†† 105 µg/mL 92.9 ± 0.4**† 3.6 ± 0.3* 3.6 ± 0.1**†† Mean ± SEM of 3 female Fischer 344 rat livers. Were analysed 3000 cells per animal/group concentration. Statistical analysis, in order to compare the NDEA cytotoxic effect related with the control (NaCl 0.9%) shown signifi- cant differences (*p < 0.05 and **p < 0.01) into the same inducer group. Comparative statistical analysis were made between W/O group and the CYP inducers group (†p < 0.05 and ††p < 0.01) at same NDEA concentra- tion. the same cDNA preparations (Δ CT). The ratio of ex- pression of each CYP gene induced vs. expression of each CYP gene spontaneously induced was calculated as ΔΔCT. The fold induction of each CYP gene is calcu- lated as 2–(ΔΔCT) as recommended by Perkin-Elmer. Val- ues were reported as an average of triplicate analyses. The amount of each gene target in different groups was normalized to an endogenous control (18S ribo- somal mRNA). 3. RESULTS The incubation of the hepatocytes with either each in- ducer or with different concentrations of NDEA alone did not result in cell viability lower than 90%, as shown in Tables 2 and 3. However, a discrete cytotoxicity was observed when PB, STR and PNC were incubated with hepatocytes in the presence of NDEA at 2.1 - 105 µg/mL, 21 µg/mL, and 0.21 µg/mL, respectively. Most of the cytotoxicity was a result of the increase of the necroses rate. ETOH, PYR and PB increased the rate of apoptoses compared to the control group either with or without different con- centrations of NDEA (Tables 2 and 3). The effect of different classical CYP inducers and of different concentrations of NDEA, either alone or to- gether, on the expression of CYP mRNAs in rat hepato- cytes is shown in Figures 1-5. Figure 1 shows that STR Table 3. NDEA cytotoxicity followed administration of classi- cal CYP inducers ETOH (0.3%), 3-MC (2 µM), STR (25 µM) and PNC (0.15 µM) Inducer Assay condi- tions % Survival % Necrosis % Apoptosis NaCl 0.9%98.1 ± 0.6 1.4 ± 0.4 0.6 ± 0.2 0.21 µg/mL97.7 ± 0.6 1.6 ± 0.4 0.7 ± 0.1 2.1 µg/mL97.5 ± 0.6 1.5 ± 0.3 1.0 ± 0.3 21 µg/mL 96.6 ± 1.4 2.5 ± 0.7 1.2 ± 0.4 ETH 105 µg/mL95.7 ± 1.1 2.6 ± 0.8 1.7 ± 0.2* NaCl 0.9%95.4 ± 0.5 3.8 ± 0.6† 0.9 ± 0.1† 0.21 µg/mL93.6 ± 0.7 5.7 ± 0.9† 0.7 ± 0.2† 2.1 µg/mL95.6 ± 0.3 3.3 ± 0.2† 1.2 ± 0.0* 21 µg/mL 95.9 ± 0.1 2.8 ± 0.3 1.4 ± 0.1* 3-MC 105 µg/mL95.9 ± 0.6 3.1 ± 0.6 1.1 ± 0.0 NaCl 0.9%98.8 ± 0.4 0.9 ± 0.2 0.3 ± 0.2 0.21 µg/mL98.2 ± 0.0 1.1 ± 0.1 0.8 ± 0.1 2.1 µg/mL97.1 ± 0.6 2.1 ± 0.4 0.8 ± 0.2 21 µg/mL 93.7 ± 0.9*† 3.9 ± 1.0 2.5 ± 0.1** STR 105 µg/mL96.2 ± 0.0** 2.8 ± 0.1** 1.0 ± 0.1* NaCl 0.9%95.0 ± 0.1 4.3 ± 0.2† 0.8 ± 0.1† 0.21 µg/mL92.9 ± 0.3* 6.5 ± 0.2*†† 0.6 ± 0.1†† PNC 2.1 µg/mL95.2 ± 0.8 3.7 ± 0.9 1.1 ± 0.1 21 µg/mL 95.8 ± 0.1 3.0 ± 0.1* 1.3 ± 0.0** 105 µg/mL95.7 ± 0.5 3.1 ± 0.7 1.2 ± 0.2 Mean ± SEM of 3 female Fischer 344 rat livers. Were analysed 3000 cells per animal/group concentration.Statistical analysis, in order to compare the NDEA cytotoxic effect related with the control (NaCl 0.9%) shown signifi- cant differences (*p < 0.05 and **p < 0.01) into the same inducer group. Comparative statistical analysis were made between ETH group and the CYP inducers group (†p < 0.05 and ††p < 0.01) at same NDEA concentra- tion. Figure 1. Data has been reported as fold induction of the house keeping gene (18S), for mRNA levels of CYP2A1, under different NDEA concentrations and CYP inducers, measured by real-time RT-PCR.* represents the significant difference (p < 0.05) between the NDEA treatment and the control NaCl 0.9%, with the same inducer treatment. Ψ represents the significant difference (p < 0.05) at same NDEA concentration (or solvent) between the inducer con- trol group (W/0 for ETOH, PYR and PB treatment, and ETOH for 3-MC, STR and PNC treatment) and the inducer. and PNC caused an induction (7- and 5-fold, respec- tively) of CYP2A1 expression, when compared to the solvent treated hepatocytes (W/o group with NaCl 0.9%). NDEA produced a statistically significant decrease of the CYP2A1 induction produced by STR (NDEA con- C opyright © 2011 SciRes. AJMB 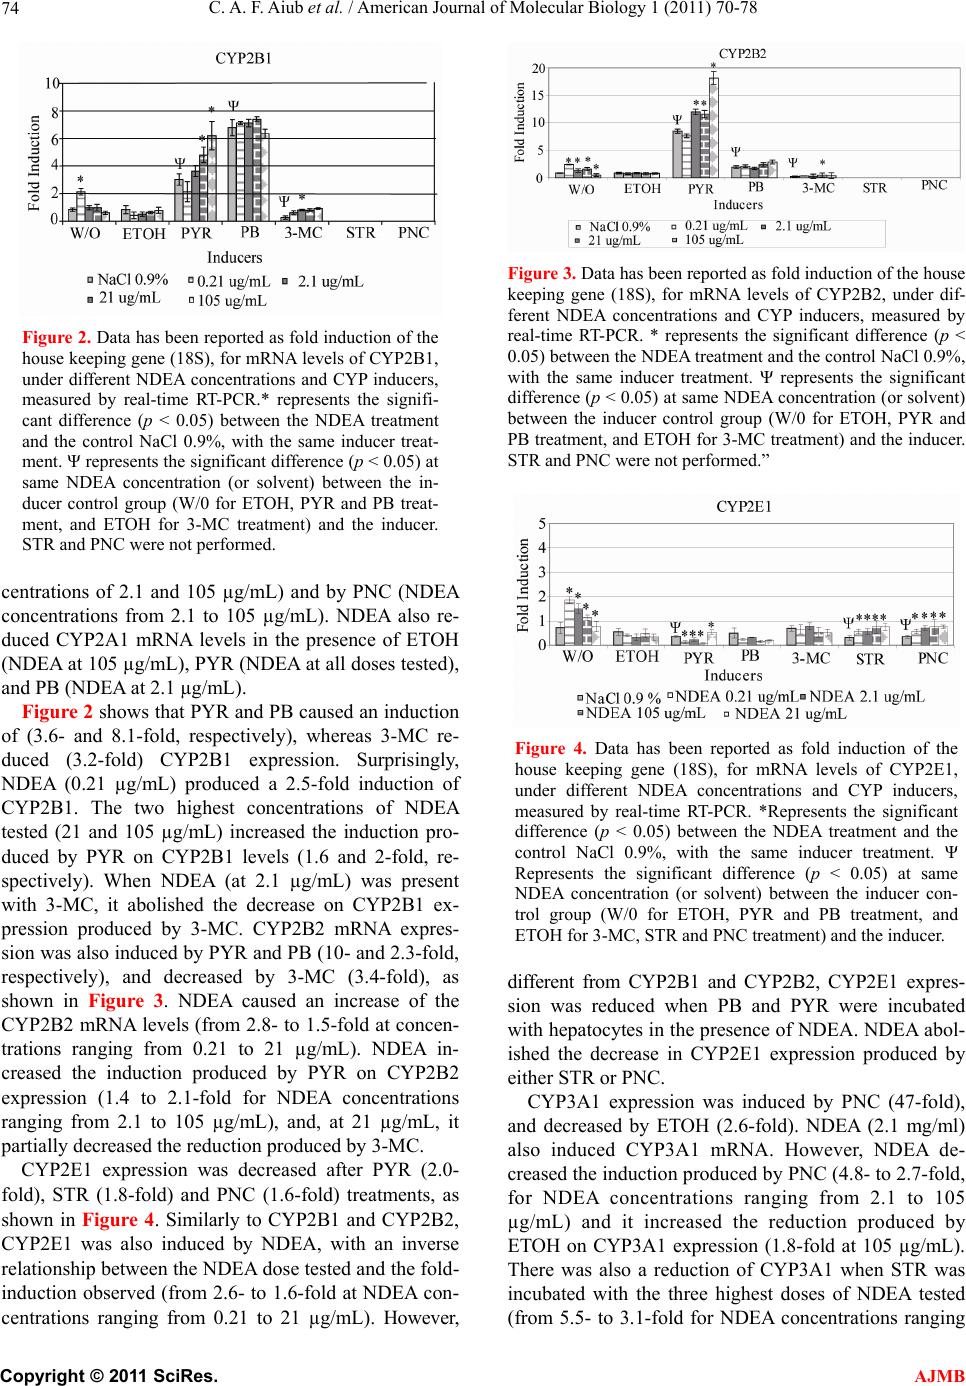 C. A. F. Aiub et al. / American Journal of Molecular Biology 1 (2011) 70-78 74 Figure 2. Data has been reported as fold induction of the house keeping gene (18S), for mRNA levels of CYP2B1, under different NDEA concentrations and CYP inducers, measured by real-time RT-PCR.* represents the signifi- cant difference (p < 0.05) between the NDEA treatment and the control NaCl 0.9%, with the same inducer treat- ment. Ψ represents the significant difference (p < 0.05) at same NDEA concentration (or solvent) between the in- ducer control group (W/0 for ETOH, PYR and PB treat- ment, and ETOH for 3-MC treatment) and the inducer. STR and PNC were not performed. centrations of 2.1 and 105 µg/mL) and by PNC (NDEA concentrations from 2.1 to 105 µg/mL). NDEA also re- duced CYP2A1 mRNA levels in the presence of ETOH (NDEA at 105 µg/mL), PYR (NDEA at all doses tested), and PB (NDEA at 2.1 µg/mL). Figure 2 shows that PYR and PB caused an induction of (3.6- and 8.1-fold, respectively), whereas 3-MC re- duced (3.2-fold) CYP2B1 expression. Surprisingly, NDEA (0.21 µg/mL) produced a 2.5-fold induction of CYP2B1. The two highest concentrations of NDEA tested (21 and 105 µg/mL) increased the induction pro- duced by PYR on CYP2B1 levels (1.6 and 2-fold, re- spectively). When NDEA (at 2.1 µg/mL) was present with 3-MC, it abolished the decrease on CYP2B1 ex- pression produced by 3-MC. CYP2B2 mRNA expres- sion was also induced by PYR and PB (10- and 2.3-fold, respectively), and decreased by 3-MC (3.4-fold), as shown in Figure 3. NDEA caused an increase of the CYP2B2 mRNA levels (from 2.8- to 1.5-fold at concen- trations ranging from 0.21 to 21 µg/mL). NDEA in- creased the induction produced by PYR on CYP2B2 expression (1.4 to 2.1-fold for NDEA concentrations ranging from 2.1 to 105 µg/mL), and, at 21 µg/mL, it partially decreased the reduction produced by 3-MC. CYP2E1 expression was decreased after PYR (2.0- fold), STR (1.8-fold) and PNC (1.6-fold) treatments, as shown in Figure 4. Similarly to CYP2B1 and CYP2B2, CYP2E1 was also induced by NDEA, with an inverse relationship between the NDEA dose tested and the fold- induction observed (from 2.6- to 1.6-fold at NDEA con- centrations ranging from 0.21 to 21 µg/mL). However, Figure 3. Data has been reported as fold induction of the house keeping gene (18S), for mRNA levels of CYP2B2, under dif- ferent NDEA concentrations and CYP inducers, measured by real-time RT-PCR. * represents the significant difference (p < 0.05) between the NDEA treatment and the control NaCl 0.9%, with the same inducer treatment. Ψ represents the significant difference (p < 0.05) at same NDEA concentration (or solvent) between the inducer control group (W/0 for ETOH, PYR and PB treatment, and ETOH for 3-MC treatment) and the inducer. STR and PNC were not performed.” Figure 4. Data has been reported as fold induction of the house keeping gene (18S), for mRNA levels of CYP2E1, under different NDEA concentrations and CYP inducers, measured by real-time RT-PCR. *Represents the significant difference (p < 0.05) between the NDEA treatment and the control NaCl 0.9%, with the same inducer treatment. Ψ Represents the significant difference (p < 0.05) at same NDEA concentration (or solvent) between the inducer con- trol group (W/0 for ETOH, PYR and PB treatment, and ETOH for 3-MC, STR and PNC treatment) and the inducer. different from CYP2B1 and CYP2B2, CYP2E1 expres- sion was reduced when PB and PYR were incubated with hepatocytes in the presence of NDEA. NDEA abol- ished the decrease in CYP2E1 expression produced by either STR or PNC. CYP3A1 expression was induced by PNC (47-fold), and decreased by ETOH (2.6-fold). NDEA (2.1 mg/ml) also induced CYP3A1 mRNA. However, NDEA de- creased the induction produced by PNC (4.8- to 2.7-fold, for NDEA concentrations ranging from 2.1 to 105 µg/mL) and it increased the reduction produced by ETOH on CYP3A1 expression (1.8-fold at 105 µg/mL). There was also a reduction of CYP3A1 when STR was incubated with the three highest doses of NDEA tested (from 5.5- to 3.1-fold for NDEA concentrations ranging C opyright © 2011 SciRes. AJMB 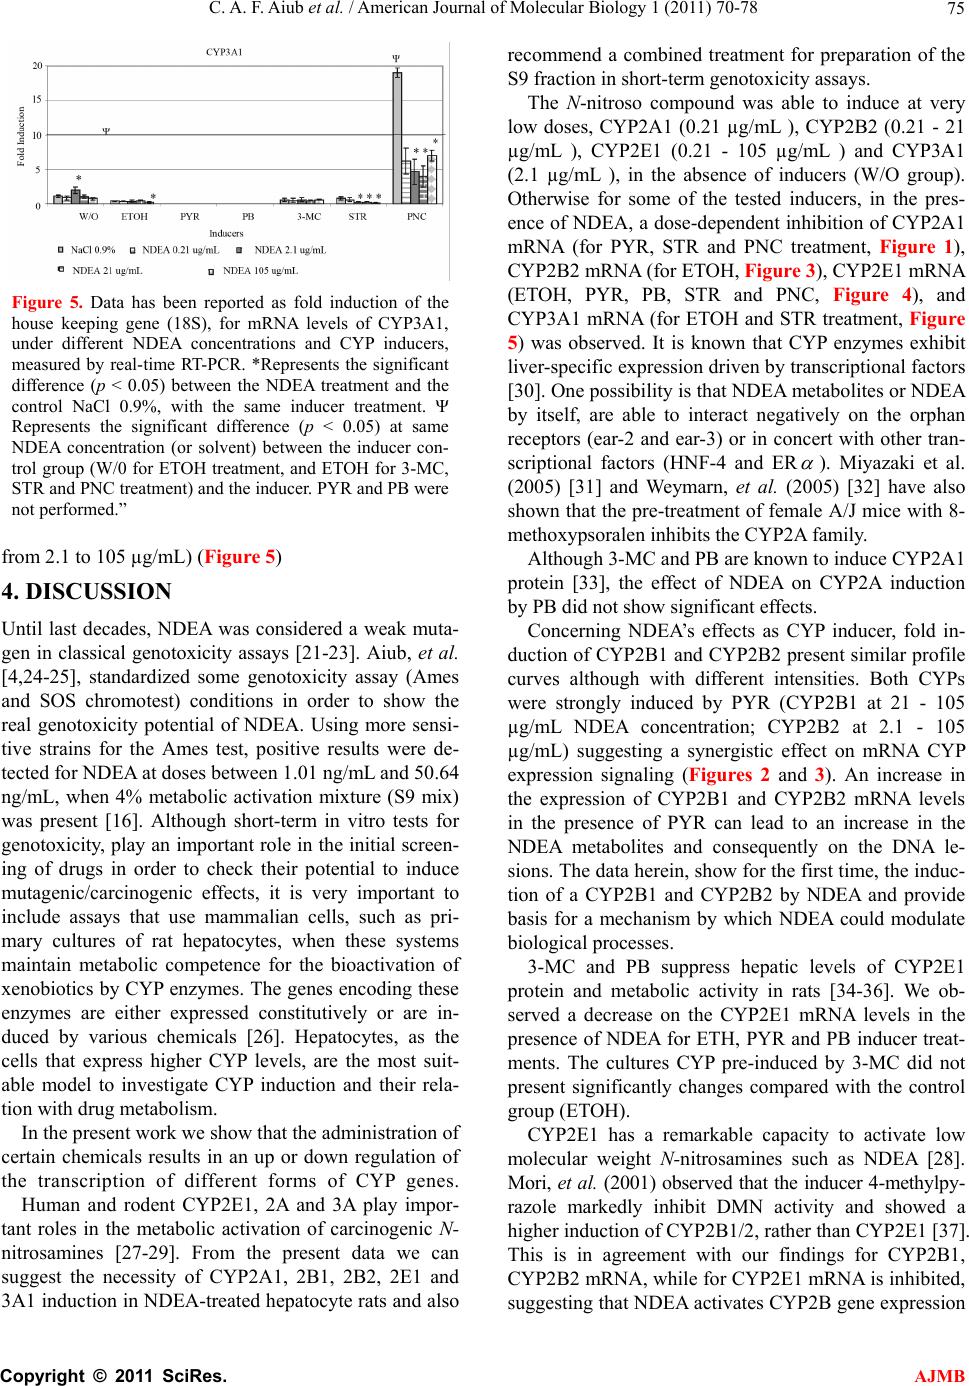 C. A. F. Aiub et al. / American Journal of Molecular Biology 1 (2011) 70-78 75 Figure 5. Data has been reported as fold induction of the from 2.1 to 105 µg/mL) (Figure 5) EA was considered a weak muta- w that the administration of ce ta ce at very lo house keeping gene (18S), for mRNA levels of CYP3A1, under different NDEA concentrations and CYP inducers, measured by real-time RT-PCR. *Represents the significant difference (p < 0.05) between the NDEA treatment and the control NaCl 0.9%, with the same inducer treatment. Ψ Represents the significant difference (p < 0.05) at same NDEA concentration (or solvent) between the inducer con- trol group (W/0 for ETOH treatment, and ETOH for 3-MC, STR and PNC treatment) and the inducer. PYR and PB were not performed.” 4. DISCUSSION Until last decades, ND gen in classical genotoxicity assays [21-23]. Aiub, et al. [4,24-25], standardized some genotoxicity assay (Ames and SOS chromotest) conditions in order to show the real genotoxicity potential of NDEA. Using more sensi- tive strains for the Ames test, positive results were de- tected for NDEA at doses between 1.01 ng/mL and 50.64 ng/mL, when 4% metabolic activation mixture (S9 mix) was present [16]. Although short-term in vitro tests for genotoxicity, play an important role in the initial screen- ing of drugs in order to check their potential to induce mutagenic/carcinogenic effects, it is very important to include assays that use mammalian cells, such as pri- mary cultures of rat hepatocytes, when these systems maintain metabolic competence for the bioactivation of xenobiotics by CYP enzymes. The genes encoding these enzymes are either expressed constitutively or are in- duced by various chemicals [26]. Hepatocytes, as the cells that express higher CYP levels, are the most suit- able model to investigate CYP induction and their rela- tion with drug metabolism. In the present work we sho rtain chemicals results in an up or down regulation of the transcription of different forms of CYP genes. Human and rodent CYP2E1, 2A and 3A play impor- nt roles in the metabolic activation of carcinogenic N- nitrosamines [27-29]. From the present data we can suggest the necessity of CYP2A1, 2B1, 2B2, 2E1 and 3A1 induction in NDEA-treated hepatocyte rats and also recommend a combined treatment for preparation of the S9 fraction in short-term genotoxicity assays. The N-nitroso compound was able to indu w doses, CYP2A1 (0.21 µg/mL ), CYP2B2 (0.21 - 21 µg/mL ), CYP2E1 (0.21 - 105 µg/mL ) and CYP3A1 (2.1 µg/mL ), in the absence of inducers (W/O group). Otherwise for some of the tested inducers, in the pres- ence of NDEA, a dose-dependent inhibition of CYP2A1 mRNA (for PYR, STR and PNC treatment, Figure 1), CYP2B2 mRNA (for ETOH, Figure 3), CYP2E1 mRNA (ETOH, PYR, PB, STR and PNC, Figure 4), and CYP3A1 mRNA (for ETOH and STR treatment, Figure 5) was observed. It is known that CYP enzymes exhibit liver-specific expression driven by transcriptional factors [30]. One possibility is that NDEA metabolites or NDEA by itself, are able to interact negatively on the orphan receptors (ear-2 and ear-3) or in concert with other tran- scriptional factors (HNF-4 and ER ). Miyazaki et al. (2005) [31] and Weymarn, et al. (205) [32] have also shown that the pre-treatment of female A/J mice with 8- methoxypsoralen inhibits the CYP2A family. Although 3-MC and PB are known to induce 0 CYP2A1 pr nducer, fold in- du ress hepatic levels of CYP2E1 pr arkable capacity to activate low m otein [33], the effect of NDEA on CYP2A induction by PB did not show significant effects. Concerning NDEA’s effects as CYP i ction of CYP2B1 and CYP2B2 present similar profile curves although with different intensities. Both CYPs were strongly induced by PYR (CYP2B1 at 21 - 105 µg/mL NDEA concentration; CYP2B2 at 2.1 - 105 µg/mL) suggesting a synergistic effect on mRNA CYP expression signaling (Figures 2 and 3). An increase in the expression of CYP2B1 and CYP2B2 mRNA levels in the presence of PYR can lead to an increase in the NDEA metabolites and consequently on the DNA le- sions. The data herein, show for the first time, the induc- tion of a CYP2B1 and CYP2B2 by NDEA and provide basis for a mechanism by which NDEA could modulate biological processes. 3-MC and PB supp otein and metabolic activity in rats [34-36]. We ob- served a decrease on the CYP2E1 mRNA levels in the presence of NDEA for ETH, PYR and PB inducer treat- ments. The cultures CYP pre-induced by 3-MC did not present significantly changes compared with the control group (ETOH). CYP2E1 has a rem olecular weight N-nitrosamines such as NDEA [28]. Mori, et al. (2001) observed that the inducer 4-methylpy- razole markedly inhibit DMN activity and showed a higher induction of CYP2B1/2, rather than CYP2E1 [37]. This is in agreement with our findings for CYP2B1, CYP2B2 mRNA, while for CYP2E1 mRNA is inhibited, suggesting that NDEA activates CYP2B gene expression C opyright © 2011 SciRes. AJMB 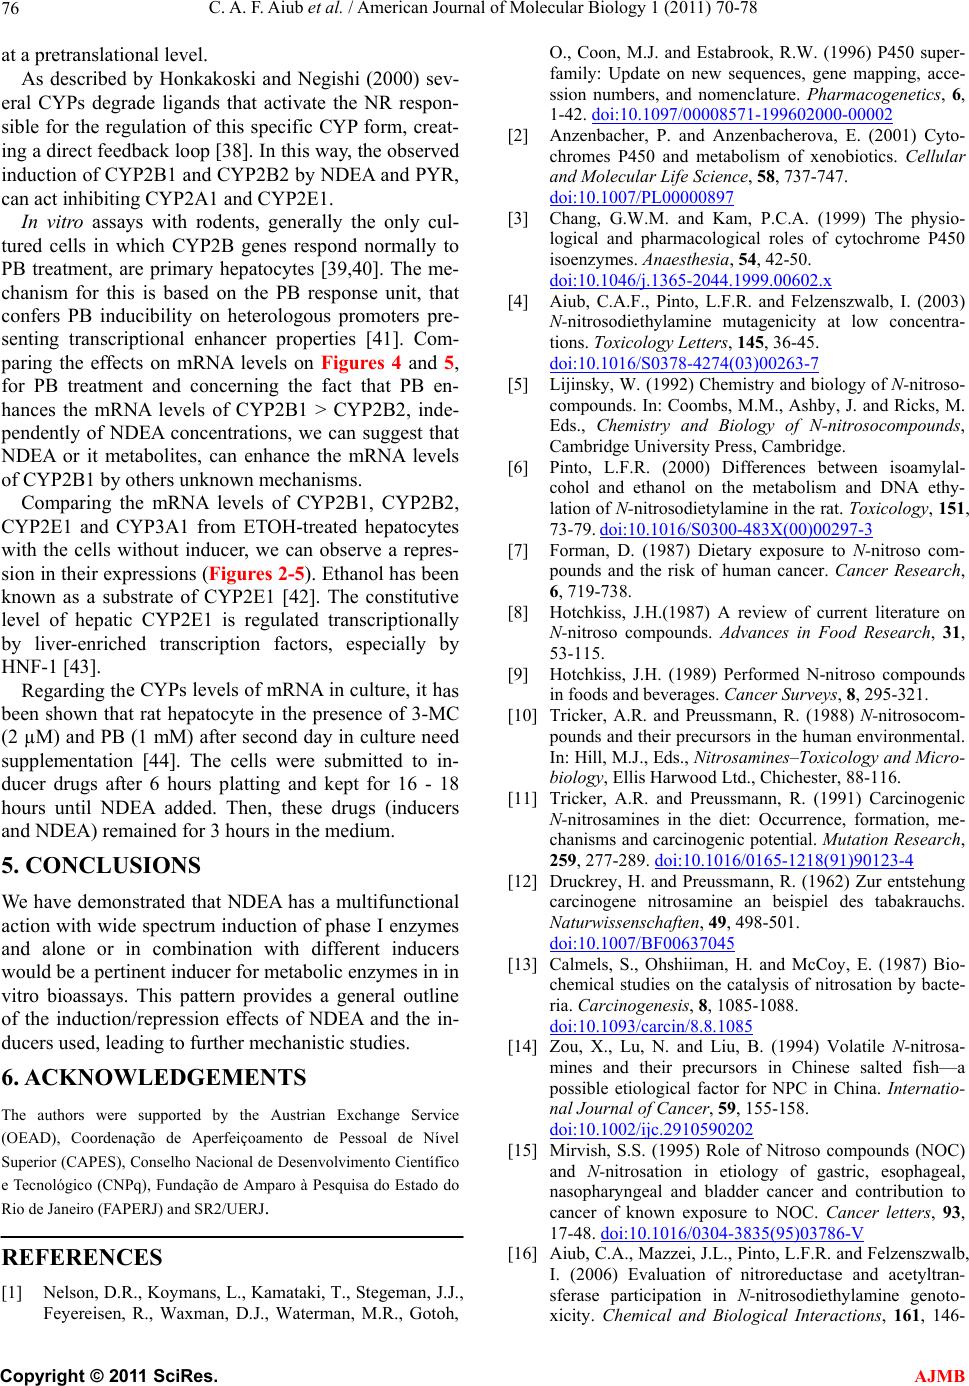 C. A. F. Aiub et al. / American Journal of Molecular Biology 1 (2011) 70-78 76 at a pretranslational level. As described by Honkakoski and Negishi (2000) sev- er the only cul- tu CYP2B C e CYPs levels of mRNA in culture, it h be has a multifunction xchange Service mans, L., Kamataki, T., Stegeman, J.J., al CYPs degrade ligands that activate the NR respon- sible for the regulation of this specific CYP form, creat- ing a direct feedback loop [38]. In this way, the observed induction of CYP2B1 and CYP2B2 by NDEA and PYR, can act inhibiting CYP2A1 and CYP2E1. In vitro assays with rodents, generally red cells in which CYP2B genes respond normally to PB treatment, are primary hepatocytes [39,40]. The me- chanism for this is based on the PB response unit, that confers PB inducibility on heterologous promoters pre- senting transcriptional enhancer properties [41]. Com- paring the effects on mRNA levels on Figures 4 and 5, for PB treatment and concerning the fact that PB en- hances the mRNA levels of CYP2B1 > CYP2B2, inde- pendently of NDEA concentrations, we can suggest that NDEA or it metabolites, can enhance the mRNA levels of CYP2B1 by others unknown mechanisms. Comparing the mRNA levels of CYP2B1, 2, YP2E1 and CYP3A1 from ETOH-treated hepatocytes with the cells without inducer, we can observe a repres- sion in their expressions (Figures 2-5). Ethanol has been known as a substrate of CYP2E1 [42]. The constitutive level of hepatic CYP2E1 is regulated transcriptionally by liver-enriched transcription factors, especially by HNF-1 [43]. Regarding thas en shown that rat hepatocyte in the presence of 3-MC (2 µM) and PB (1 mM) after second day in culture need supplementation [44]. The cells were submitted to in- ducer drugs after 6 hours platting and kept for 16 - 18 hours until NDEA added. Then, these drugs (inducers and NDEA) remained for 3 hours in the medium. 5. CONCLUSIONS We have demonstrated that NDEAal action with wide spectrum induction of phase I enzymes and alone or in combination with different inducers would be a pertinent inducer for metabolic enzymes in in vitro bioassays. This pattern provides a general outline of the induction/repression effects of NDEA and the in- ducers used, leading to further mechanistic studies. 6. ACKNOWLEDGEMENTS The authors were supported by the Austrian E (OEAD), Coordenação de Aperfeiçoamento de Pessoal de Nível Superior (CAPES), Conselho Nacional de Desenvolvimento Científico e Tecnológico (CNPq), Fundação de Amparo à Pesquisa do Estado do Rio de Janeiro (FAPERJ) and SR2/UERJ. REFERENCES [1] Nelson, D.R., Koy Feyereisen, R., Waxman, D.J., Waterman, M.R., Gotoh, O., Coon, M.J. and Estabrook, R.W. (1996) P450 super- family: Update on new sequences, gene mapping, acce- ssion numbers, and nomenclature. Pharmacogenetics, 6, 1-42. doi:10.1097/00008571-199602000-00002 [2] Anzenbacher, P. and Anzenbacherova, E. (2001) Cyto- chromes P450 and metabolism of xenobiotics. Cellular and Molecular Life Science, 58, 737-747. doi:10.1007/PL00000897 [3] Chang, G.W.M. and Kam, P.C.A. (1999) The physio- x logical and pharmacological roles of cytochrome P450 isoenzymes. Anaesthesia, 54, 42-50. doi:10.1046/j.1365-2044.1999.00602. zwalb, I. (2003) [4] Aiub, C.A.F., Pinto, L.F.R. and Felzens N-nitrosodiethylamine mutagenicity at low concentra- tions. Toxicology Letters, 145, 36-45. doi:10.1016/S0378-4274(03)00263-7 [5] Lijinsky, W. (1992) Chemistry and biology of N-nitroso- en isoamylal- compounds. In: Coombs, M.M., Ashby, J. and Ricks, M. Eds., Chemistry and Biology of N-nitrosocompounds, Cambridge University Press, Cambridge. [6] Pinto, L.F.R. (2000) Differences betwe cohol and ethanol on the metabolism and DNA ethy- lation of N-nitrosodietylamine in the rat. Toxicology, 151, 73-79. doi:10.1016/S0300-483X(00)00297-3 [7] Forman, D. (1987) Dietary exposure to N-nitroso com- .(1987) A review of current literature on s, J.H. (1989) Performed N-nitroso compounds om- ogenic pounds and the risk of human cancer. Cancer Research, 6, 719-738. [8] Hotchkiss, J.H N-nitroso compounds. Advances in Food Research, 31, 53-115. [9] Hotchkis in foods and beverages. Cancer Surveys, 8, 295-321. [10] Tricker, A.R. and Preussmann, R. (1988) N-nitrosoc pounds and their precursors in the human environmental. In: Hill, M.J., Eds., Nitrosamines–Toxicology and Micro- biology, Ellis Harwood Ltd., Chichester, 88-116. [11] Tricker, A.R. and Preussmann, R. (1991) Carcin N-nitrosamines in the diet: Occurrence, formation, me- chanisms and carcinogenic potential. Mutation Research, 259, 277-289. doi:10.1016/0165-1218(91)90123-4 [12] Druckrey, H. and Preussmann, R. (1962) Zur entstehung carcinogene nitrosamine an beispiel des tabakrauchs. Naturwissenschaften, 49, 498-501. doi:10.1007/BF00637045 [13] Calmels, S., Ohshiiman, H. and McCoy, E. (1987) Bio- chemical studies on the catalysis of nitrosation by bacte- ria. Carcinogenesis, 8, 1085-1088. doi:10.1093/carcin/8.8.1085 [14] Zou, X., Lu, N. and Liu, B. (1994) Volatile N-nitrosa- mines and their precursors in Chinese salted fish—a possible etiological factor for NPC in China. Internatio- nal Journal of Cancer, 59, 155-158. doi:10.1002/ijc.2910590202 [15] Mirvish, S.S. (1995) Role of Nitroso compounds (NOC) and N-nitrosation in etiology of gastric, esophageal, nasopharyngeal and bladder cancer and contribution to cancer of known exposure to NOC. Cancer letters, 93, 17-48. doi:10.1016/0304-3835(95)03786-V [16] Aiub, C.A., Mazzei, J.L., Pinto, L.F.R. and Felzenszwalb, I. (2006) Evaluation of nitroreductase and acetyltran- sferase participation in N-nitrosodiethylamine genoto- xicity. Chemical and Biological Interactions, 161, 146- C opyright © 2011 SciRes. AJMB 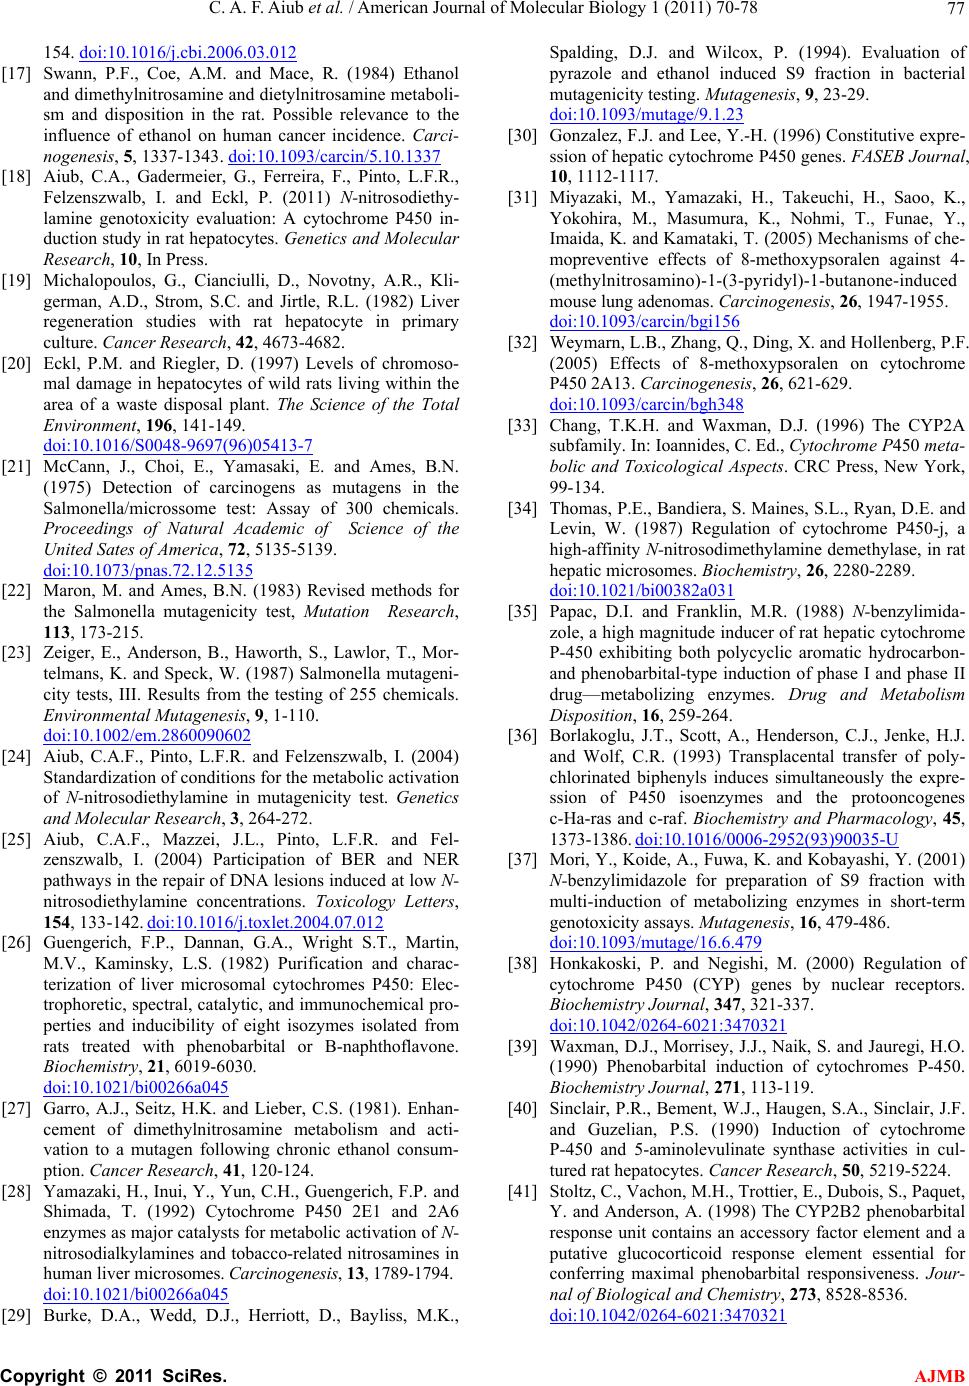 C. A. F. Aiub et al. / American Journal of Molecular Biology 1 (2011) 70-78 77 154. doi:10.1016/j.cbi.2006.03.012 [17] Swann, P.F., Coe, A.M. and Mace, R. (1984) Ethanol and dimethylnitrosamine and dietylnitrosamine metaboli- sm and disposition in the rat. Possible relevance to the influence of ethanol on human cancer incidence. Carci- nogenesis, 5, 1337-1343. doi:10.1093/carcin/5.10.1337 [18] Aiub, C.A., Gadermeier, G., Ferreira, F., Pinto, L.F.R., nciulli, D., Novotny, A.R., Kli- of chromoso- 5413-7 Felzenszwalb, I. and Eckl, P. (2011) N-nitrosodiethy- lamine genotoxicity evaluation: A cytochrome P450 in- duction study in rat hepatocytes. Genetics and Molecular Research, 10, In Press. [19] Michalopoulos, G., Cia german, A.D., Strom, S.C. and Jirtle, R.L. (1982) Liver regeneration studies with rat hepatocyte in primary culture. Cancer Research, 42, 4673-4682. [20] Eckl, P.M. and Riegler, D. (1997) Levels mal damage in hepatocytes of wild rats living within the area of a waste disposal plant. The Science of the Total Environment, 196, 141-149. doi:10.1016/S0048-9697(96)0 . and Ames, B.N. [21] McCann, J., Choi, E., Yamasaki, E (1975) Detection of carcinogens as mutagens in the Salmonella/microssome test: Assay of 300 chemicals. Proceedings of Natural Academic of Science of the United Sates of America, 72, 5135-5139. doi:10.1073/pnas.72.12.5135 [22] Maron, M. and Ames, B.N. (1983) Revised methods for erson, B., Haworth, S., Lawlor, T., Mor- the Salmonella mutagenicity test, Mutation Research, 113, 173-215. [23] Zeiger, E., And telmans, K. and Speck, W. (1987) Salmonella mutageni- city tests, III. Results from the testing of 255 chemicals. Environmental Mutagenesis, 9, 1-110. doi:10.1002/em.2860090602 [24] Aiub, C.A.F., Pinto, L.F.R. and Felzenszwalb, I. (2004) L.F.R. and Fel- Standardization of conditions for the metabolic activation of N-nitrosodiethylamine in mutagenicity test. Genetics and Molecular Research, 3, 264-272. [25] Aiub, C.A.F., Mazzei, J.L., Pinto, zenszwalb, I. (2004) Participation of BER and NER pathways in the repair of DNA lesions induced at low N- nitrosodiethylamine concentrations. Toxicology Letters, 154, 133-142. doi:10.1016/j.toxlet.2004.07.012 [26] Guengerich, F.P., Dannan, G.A., Wright S.T., Martin, M.V., Kaminsky, L.S. (1982) Purification and charac- terization of liver microsomal cytochromes P450: Elec- trophoretic, spectral, catalytic, and immunochemical pro- perties and inducibility of eight isozymes isolated from rats treated with phenobarbital or B-naphthoflavone. Biochemistry, 21, 6019-6030. doi:10.1021/bi00266a045 [27] Garro, A.J., Seitz, H.K. and Lieber, C.S. (1981). Enhan- engerich, F.P. and cement of dimethylnitrosamine metabolism and acti- vation to a mutagen following chronic ethanol consum- ption. Cancer Research, 41, 120-124. [28] Yamazaki, H., Inui, Y., Yun, C.H., Gu Shimada, T. (1992) Cytochrome P450 2E1 and 2A6 enzymes as major catalysts for metabolic activation of N- nitrosodialkylamines and tobacco-related nitrosamines in human liver microsomes. Carcinogenesis, 13, 1789-1794. doi:10.1021/bi00266a045 [29] Burke, D.A., Wedd, D.J., Spalding, D.J. and Wilcox, P. (1994). Evaluation of pyrazole and ethanol induced S9 fraction in bacterial mutagenicity testing. Mutagenesis, 9, 23-29. doi:10.1093/mutage/9.1.23 [30] Gonzalez, F.J. and Lee, Y.-H. (1996) Constitutive expre- azaki, H., Takeuchi, H., Saoo, K., ssion of hepatic cytochrome P450 genes. FASEB Journal, 10, 1112-1117. [31] Miyazaki, M., Yam Yokohira, M., Masumura, K., Nohmi, T., Funae, Y., Imaida, K. and Kamataki, T. (2005) Mechanisms of che- mopreventive effects of 8-methoxypsoralen against 4- (methylnitrosamino)-1-(3-pyridyl)-1-butanone-induced mouse lung adenomas. Carcinogenesis, 26, 1947-1955. doi:10.1093/carcin/bgi156 [32] Weymarn, L.B., Zhang, Q., Ding, X. and Hollenberg, P.F. (2005) Effects of 8-methoxypsoralen on cytochrome P450 2A13. Carcinogenesis, 26, 621-629. doi:10.1093/carcin/bgh348 [33] Chang, T.K.H. and Waxman, D.J. (1996) The CYP2A .E., Bandiera, S. Maines, S.L., Ryan, D.E. and subfamily. In: Ioannides, C. Ed., Cytochrome P450 meta- bolic and Toxicological Aspects. CRC Press, New York, 99-134. [34] Thomas, P Levin, W. (1987) Regulation of cytochrome P450-j, a high-affinity N-nitrosodimethylamine demethylase, in rat hepatic microsomes. Biochemistry, 26, 2280-2289. doi:10.1021/bi00382a031 [35] Papac, D.I. and Franklin, M.R. (1988) N-benzylimida- ., Henderson, C.J., Jenke, H.J. zole, a high magnitude inducer of rat hepatic cytochrome P-450 exhibiting both polycyclic aromatic hydrocarbon- and phenobarbital-type induction of phase I and phase II drug—metabolizing enzymes. Drug and Metabolism Disposition, 16, 259-264. [36] Borlakoglu, J.T., Scott, A and Wolf, C.R. (1993) Transplacental transfer of poly- chlorinated biphenyls induces simultaneously the expre- ssion of P450 isoenzymes and the protooncogenes c-Ha-ras and c-raf. Biochemistry and Pharmacology, 45, 1373-1386. doi:10.1016/0006-2952(93)90035-U [37] Mori, Y., Koide, A., Fuwa, K. and Kobayashi, Y. (2001) N-benzylimidazole for preparation of S9 fraction with multi-induction of metabolizing enzymes in short-term genotoxicity assays. Mutagenesis, 16, 479-486. doi:10.1093/mutage/16.6.479 [38] Honkakoski, P. and Negishi, M. (2000) Regulation of cytochrome P450 (CYP) genes by nuclear receptors. Biochemistry Journal, 347, 321-337. doi:10.1042/0264-6021:3470321 [39] Waxman, D.J., Morrisey, J.J., Naik, S. and Jauregi, H.O. S.A., Sinclair, J.F. , (1990) Phenobarbital induction of cytochromes P-450. Biochemistry Journal, 271, 113-119. [40] Sinclair, P.R., Bement, W.J., Haugen, and Guzelian, P.S. (1990) Induction of cytochrome P-450 and 5-aminolevulinate synthase activities in cul- tured rat hepatocytes. Cancer Research, 50, 5219-5224. [41] Stoltz, C., Vachon, M.H., Trottier, E., Dubois, S., Paquet Y. and Anderson, A. (1998) The CYP2B2 phenobarbital response unit contains an accessory factor element and a putative glucocorticoid response element essential for conferring maximal phenobarbital responsiveness. Jour- nal of Biological and Chemistry, 273, 8528-8536. doi:10.1042/0264-6021:3470321 Herriott, D., Bayliss, M.K., C opyright © 2011 SciRes. AJMB  C. A. F. Aiub et al. / American Journal of Molecular Biology 1 (2011) 70-78 Copyright © 2011 SciRes. 78 i, H. and Yoo, J.S.H. AJMB [42] Yang, C.S., Patten, C.J., Ishizak (1991) Induction, purification and characterisation of cytochrome P450IIE. Methods in Enzymology, 206, 595- 603. doi:10.1016/0076-6879(91)06129-Q [43] Ueno, T. and Gonzalez, F.J. (1990) Transcriptional okuno, Y., Tompkins, R.G., 53337654control of the rat hepatic CYP2E1 gene. Molecullar and Cell Biology, 10, 4495-4505. [44] Washizu, J., Berthiaume, F., M Toner, M. and Yarmush, M.L. (2001) Long-term mainte- nance of cytochrome P450 activities by rat hepatocyte/ 3T3 cell co-culture in heparinized human plasma. Tissue Engenhary, 7, 691-703. doi:10.1089/1076327017
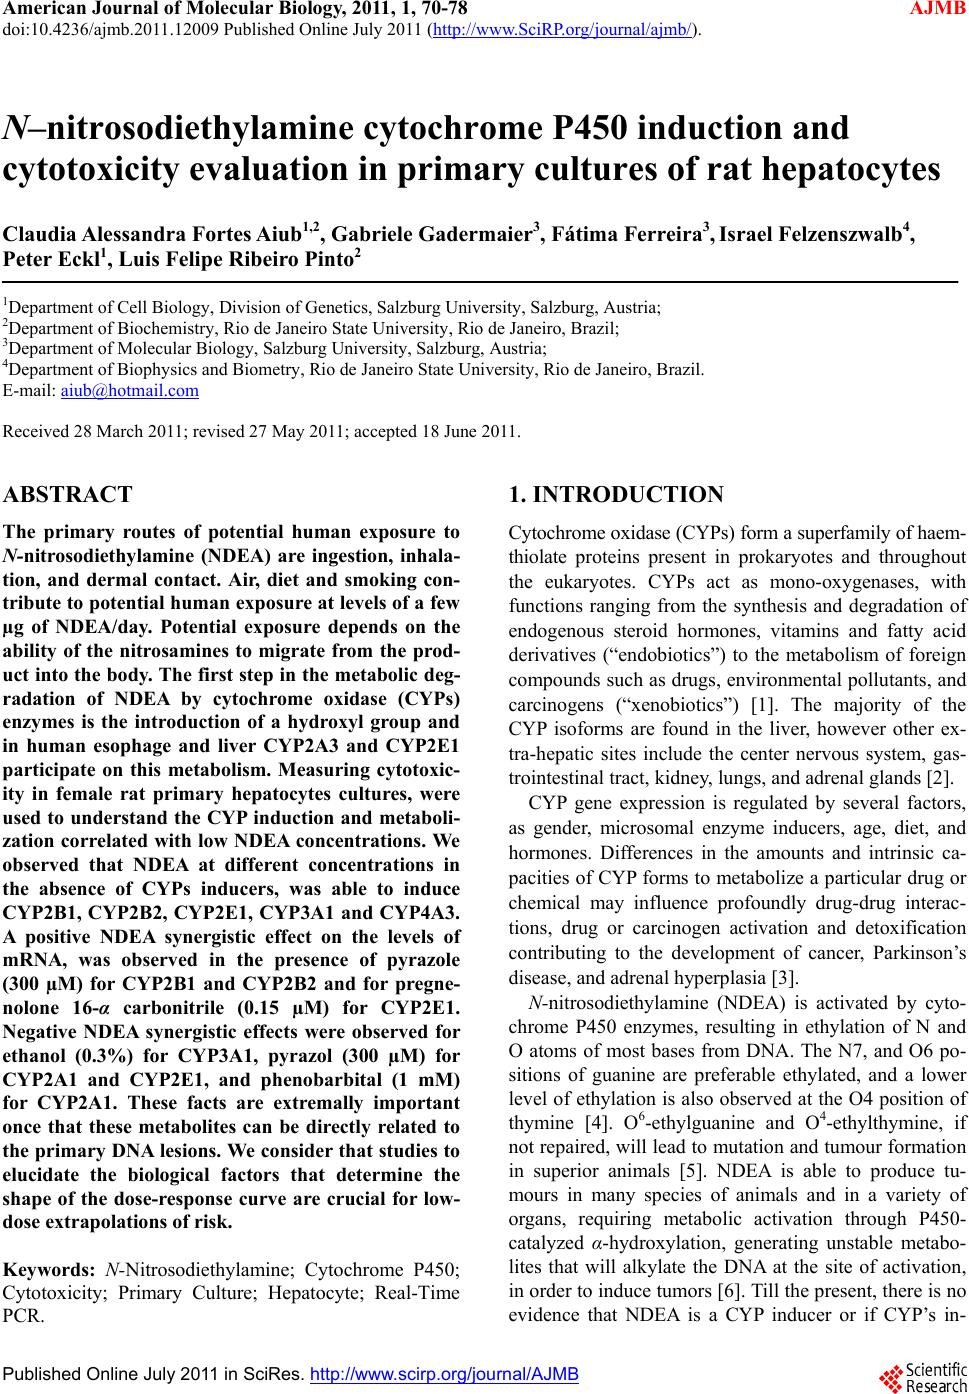
|