Paper Menu >>
Journal Menu >>
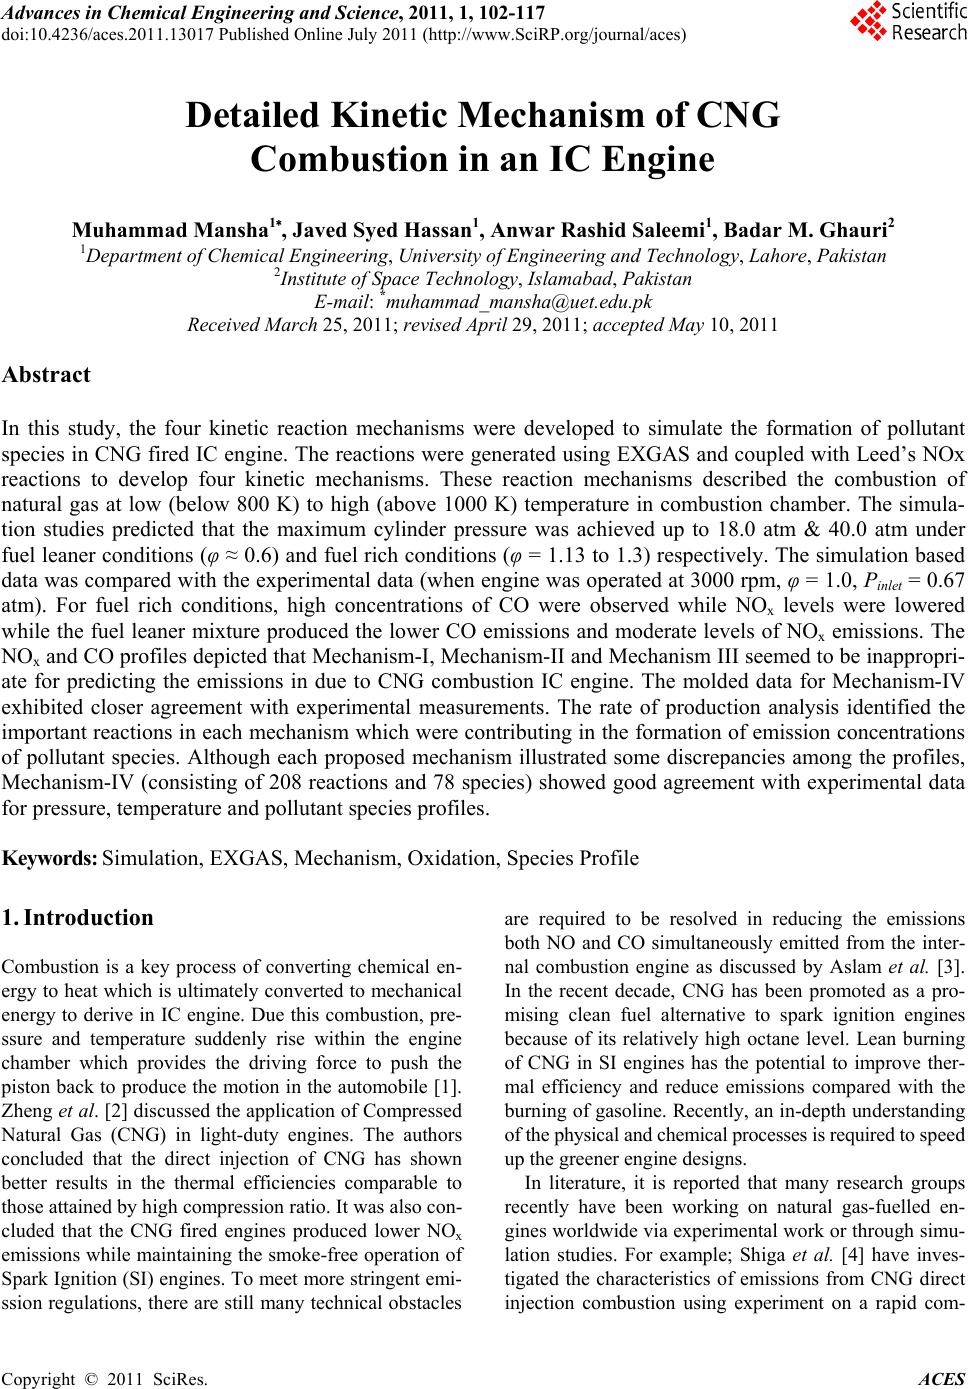 Advances in Chemical Engineering and Science, 2011, 1, 102-117 doi:10.4236/aces.2011.13017 Published Online July 2011 (http://www.SciRP.org/journal/aces) Copyright © 2011 SciRes. ACES Detailed Kinetic Mechanism of CNG Combustion in an IC Engine Muhammad Mansha1*, Javed Syed Hassan1, Anwar Rashid Saleemi1, Badar M. Ghauri2 1Department of Chemical Engineering, University of Engineering and Technology, Lahore, Pakistan 2Institute of Space Technology, Islamabad, Pakistan E-mail: *muhammad_mansha@uet.edu.pk Received March 25, 2011; revised April 29, 2011; accepted May 10, 2011 Abstract In this study, the four kinetic reaction mechanisms were developed to simulate the formation of pollutant species in CNG fired IC engine. The reactions were generated using EXGAS and coupled with Leed’s NOx reactions to develop four kinetic mechanisms. These reaction mechanisms described the combustion of natural gas at low (below 800 K) to high (above 1000 K) temperature in combustion chamber. The simula- tion studies predicted that the maximum cylinder pressure was achieved up to 18.0 atm & 40.0 atm under fuel leaner conditions (φ ≈ 0.6) and fuel rich conditions (φ = 1.13 to 1.3) respectively. The simulation based data was compared with the experimental data (when engine was operated at 3000 rpm, φ = 1.0, Pinlet = 0.67 atm). For fuel rich conditions, high concentrations of CO were observed while NOx levels were lowered while the fuel leaner mixture produced the lower CO emissions and moderate levels of NOx emissions. The NOx and CO profiles depicted that Mechanism-I, Mechanism-II and Mechanism III seemed to be inappropri- ate for predicting the emissions in due to CNG combustion IC engine. The molded data for Mechanism-IV exhibited closer agreement with experimental measurements. The rate of production analysis identified the important reactions in each mechanism which were contributing in the formation of emission concentrations of pollutant species. Although each proposed mechanism illustrated some discrepancies among the profiles, Mechanism-IV (consisting of 208 reactions and 78 species) showed good agreement with experimental data for pressure, temperature and pollutant species profiles. Keywords: Simulation, EXGAS, Mechanism, Oxidation, Species Profile 1. Introduction Combustion is a key process of converting chemical en- ergy to heat which is ultimately converted to mechanical energy to derive in IC engine. Due this combustion, pre- ssure and temperature suddenly rise within the engine chamber which provides the driving force to push the piston back to produce the motion in the automobile [1]. Zheng et al. [2] discussed the application of Compressed Natural Gas (CNG) in light-duty engines. The authors concluded that the direct injection of CNG has shown better results in the thermal efficiencies comparable to those attained by high compression ratio. It was also con- cluded that the CNG fired engines produced lower NOx emissions while maintaining the smoke-free operation of Spark Ignition (SI) engines. To meet more stringent emi- ssion regulations, there are still many technical obstacles are required to be resolved in reducing the emissions both NO and CO simultaneously emitted from the inter- nal combustion engine as discussed by Aslam et al. [3]. In the recent decade, CNG has been promoted as a pro- mising clean fuel alternative to spark ignition engines because of its relatively high octane level. Lean burning of CNG in SI engines has the potential to improve ther- mal efficiency and reduce emissions compared with the burning of gasoline. Recently, an in-depth understanding of the physical and chemical processes is required to speed up the greener engine designs. In literature, it is reported that many research groups recently have been working on natural gas-fuelled en- gines worldwide via experimental work or through simu- lation studies. For example; Shiga et al. [4] have inves- tigated the characteristics of emissions from CNG direct injection combustion using experiment on a rapid com-  M. MANSHA ET AL. Copyright © 2011 SciRes. ACES 103 pression-machine. In study cited at [5], Computational Fluid Dynamics (CFD) codes have been utilized to study the fuel combustion. Kusaka et al. [6] have investigated the dual fuel engine for both diesel and natural gas en- gine. Ando et al. [7] has carried out the computational analysis of combustion with self-ignited natural gas en- gine. Zheng et al. [2] have studied combustion process and fluid flow in a compression ignition natural gas en- gine with separated chamber using the CFD code. These CFD based studies required the reaction mechanisms to study the turbulence, flame development, flame propaga- tion etc in combustion of various fuels using Fluent, ANSYS etc. In the literature, several detailed mecha- nisms [8-13] and reduced mechanisms [14-20] for meth- ane (CH4) combustion exist. The reported studies dis- cussed the reaction mechanisms of single component hydrocarbon fuels such as methane, butane, octane, hy- drogen etc. [21-26]. Mansha et al. has implemented the oxidation mecha- nisms of methane in IC engine and predicted the com- bustion temperature and pressure in the combustion chamber of the IC engine [27]. In this study, authors suc- cessfully predicted the emission profiles of CO using the GRI 3.0 mechanism and concluded that the kinetic me- chanisms can be implemented in IC engine to simulation combustion process. In another study, the authors devel- oped the kinetic mechanisms of CNG and simulation based investigation of CNG combustion was carried out [28]. CNG is multi-component (mixture of CH4, C2H6, C3H8, C4H10, N2, CO2) fuel and the combustion mechanism of this mixture is needed to develop for the understanding the formation of various products gases especially pol- lutants (CO, NO. NO2, NH3 etc.). In present study, reaction mechanisms (models) of CNG combustion in IC engine have been developed to predict the emission profiles of pollutants including Carbon monoxide (CO) and Oxides of Nitrogen (as NO and NO2). The model based results were validated through experimental measurements of the in-cylinder measurements of pressure, temperature and pollutant spe- cies on the dedicated experimental setup developed for this study. 2. Experimental (Material and Methods) 2.1. Development of Kinetic Reaction Mechanisms of Natural Gas Combustion In this study, four kinetic reaction mechanisms were generated using EXGAS (an automatic mechanism gen- eration tool). The EXGAS has three types of input (reac- tants, kinetic data and thermo-chemical data) to generate the reaction mechanisms of natural gas combustion. The reacting mixture species (as input to the EXGAS) have special one dimensional (1D) notation [29]. The software has built-in-notations for methane, ethane species as base species. These 1D notation were linked by the computer to an internal representation, which allows species reac- tants and products) to be stored in a unique format by using a canonicity algorithm. Further details of mecha- nism generation of EXGAS exist in User’s Guide of the EXGAS [23]. The mechanisms generated were com- posed of a) C0-C1-C2 reaction base b) primary reaction mechanism in which the species in the initial gas mixture are taken as the reactants and c) secondary mechanism which contain reactions of inputs are the molecular products of the primary mechanism. The types of con- sidered in each of each of the four kinetic reaction me- chanisms are given in Tabl e 1 . The types of primary mo- lecules formed during the combustion of low hydrocar- bons include Monohydroperoxides (OOH), Dihydroper- oxydes (OOH)2, Allylic molecules YH, Ethers (O), Ke- tones (CO), aldehydes (CHO) etc are given in Table 2. Each of the four EXGAS generated reaction mechanisms were coupled with Leeds NOx Mechanism 2.0 (http://www.chem.leeds.ac.uk/Combustion/nox.htm). Mechanism-I is a comprehensive reaction mechanism containing reactions feasible at range of temperature con- ditions (below 800 K and above 1000 K). This mecha- nism is composed of 935 elementary reactions and 185 species. Mechanism-II is a high temperature (above 1000 K) reaction mechanism and consists of 124 species and 792 elementary reactions. This mechanism com- posed of that type of reaction feasibly at high tempera- ture during the combustion of natural gas. Mechanism- III is a low tmperature (below 800 K) reaction mecha- nism and consists of 152 species and 864 elementary reaction. Mechanism-IV is developed by the simplifica- tion of Mechanism-I by the chemical lumping technique. By this technique, the reaction steps with similar reac- tants and products have been eliminated. This reaction model is consisting of only 72 species and 208 elemen- tary reactions. The proposed reaction mechanisms were used to simulate the combustion of natural gas under various temperature conditions and to predict the emis- sions. 2.2. Simulation of Natural Gas (as CNG) Combustion Using Kinetic Reaction Mechanisms in IC Engine The combustion of CNG in IC engine was simulated using CHEMKIN 4.1.1 simulation package. It is a pow- erful set of software tools used to study reacting flows, such as those found in combustion, catalysis, chemical 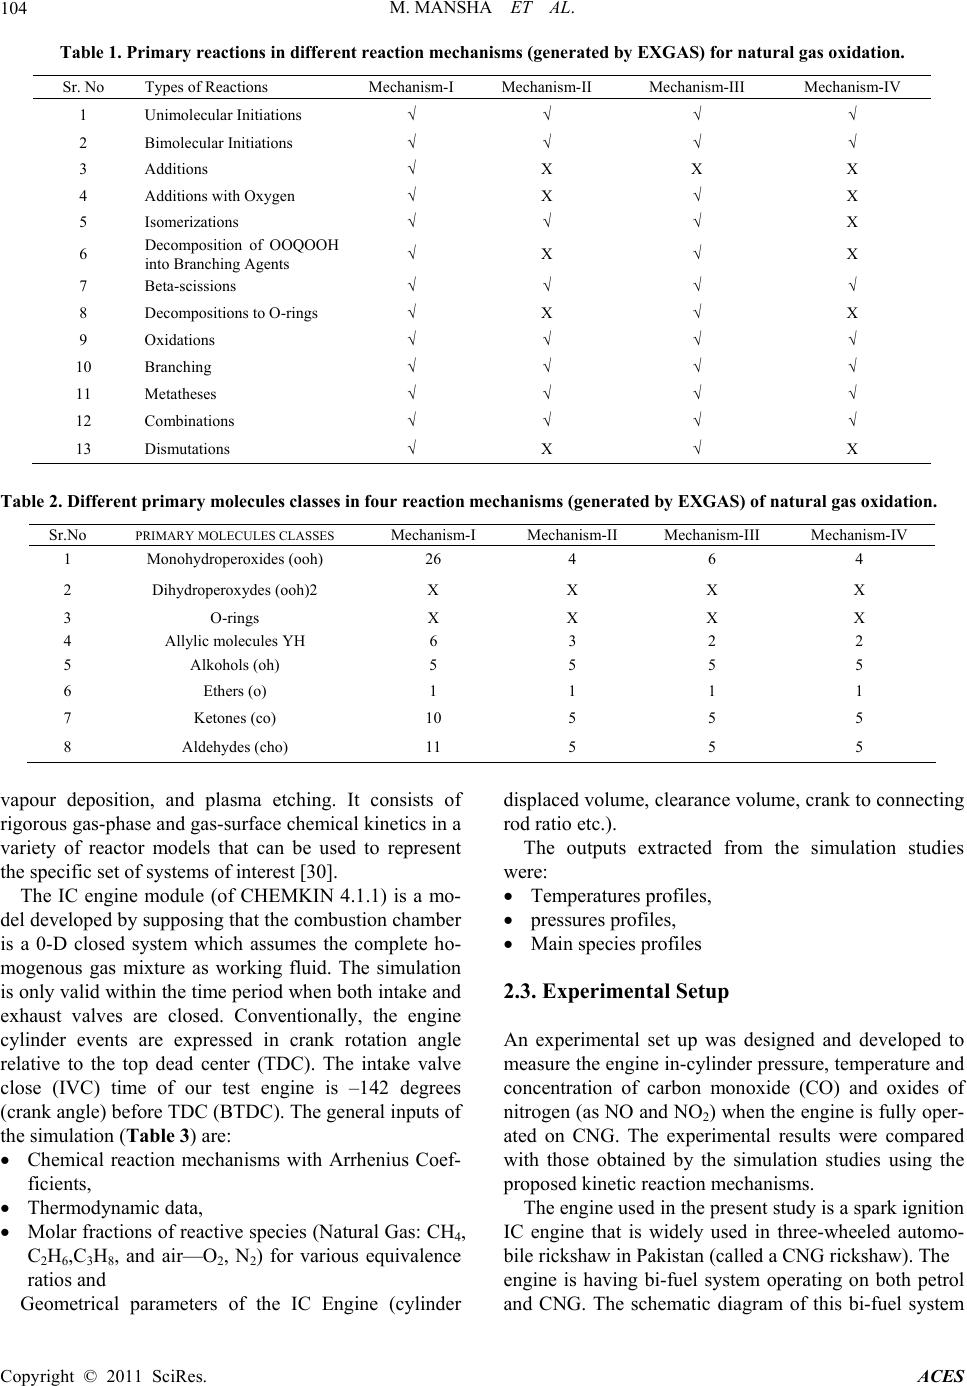 M. MANSHA ET AL. Copyright © 2011 SciRes. ACES 104 Table 1. Primary reactions in different reaction mechanisms (generated by EXGAS) for natural gas oxidation. Sr. No Types of Reactions Mechanism-I Mechanism-II Mechanism-III Mechanism-IV 1 Unimolecular Initiations √ √ √ √ 2 Bimolecular Initiations √ √ √ √ 3 Additions √ X X X 4 Additions with Oxygen √ X √ X 5 Isomerizations √ √ √ X 6 Decomposition of OOQOOH into Branching Agents √ X √ X 7 Beta-scissions √ √ √ √ 8 Decompositions to O-rings √ X √ X 9 Oxidations √ √ √ √ 10 Branching √ √ √ √ 11 Metatheses √ √ √ √ 12 Combinations √ √ √ √ 13 Dismutations √ X √ X Table 2. Different primary molecules classes in four reaction mechanisms (generated by EXGAS) of natural gas oxidation. Sr.No PRIMARY MOLECULES CLASSES Mechanism-I Mechanism-II Mechanism-III Mechanism-IV 1 Monohydroperoxides (ooh) 26 4 6 4 2 Dihydroperoxydes (ooh)2 X X X X 3 O-rings X X X X 4 Allylic molecules YH 6 3 2 2 5 Alkohols (oh) 5 5 5 5 6 Ethers (o) 1 1 1 1 7 Ketones (co) 10 5 5 5 8 Aldehydes (cho) 11 5 5 5 vapour deposition, and plasma etching. It consists of rigorous gas-phase and gas-surface chemical kinetics in a variety of reactor models that can be used to represent the specific set of systems of interest [30]. The IC engine module (of CHEMKIN 4.1.1) is a mo- del developed by supposing that the combustion chamber is a 0-D closed system which assumes the complete ho- mogenous gas mixture as working fluid. The simulation is only valid within the time period when both intake and exhaust valves are closed. Conventionally, the engine cylinder events are expressed in crank rotation angle relative to the top dead center (TDC). The intake valve close (IVC) time of our test engine is –142 degrees (crank angle) before TDC (BTDC). The general inputs of the simulation (Table 3) are: Chemical reaction mechanisms with Arrhenius Coef- ficients, Thermodynamic data, Molar fractions of reactive species (Natural Gas: CH4, C2H6,C3H8, and air—O2, N2) for various equivalence ratios and Geometrical parameters of the IC Engine (cylinder displaced volume, clearance volume, crank to connecting rod ratio etc.). The outputs extracted from the simulation studies were: Temperatures profiles, pressures profiles, Main species profiles 2.3. Experimental Setup An experimental set up was designed and developed to measure the engine in-cylinder pressure, temperature and concentration of carbon monoxide (CO) and oxides of nitrogen (as NO and NO2) when the engine is fully oper- ated on CNG. The experimental results were compared with those obtained by the simulation studies using the proposed kinetic reaction mechanisms. The engine used in the present study is a spark ignition IC engine that is widely used in three-wheeled automo- bile rickshaw in Pakistan (called a CNG rickshaw). The engine is having bi-fuel system operating on both petrol and CNG. The schematic diagram of this bi-fuel system  M. MANSHA ET AL. Copyright © 2011 SciRes. ACES 105 Table 3. Typical engine geometrical input parameters and initial gas (feed) mixture composition. Sr. No Engine Geometrical Input Parameters Initial Gas Mixture (CNG Composition), Mole Fraction Parameter (unit) Value Component Mole Fraction 1 Cylinder Volume (cm3) 63 Methane (CH4) 0.8903 2 Displaced Volume (cm3) 56.52 Ethane (C2H6) 0.0105 3 Clearance Volume (cm3) 6.48 Propane (C3H8) 0.027 4 Cylinder Diameters (cm) 14.67 Butane (C4H10) 0.0017 Nitrogen (N2) 0.072 5 Crank to Connecting Rod Ratio 1.632 Carbon Dioxide (CO2) 0.026 is shown in Figure 1 and lab view is shown in Figure 2. The other details of this experimental setup and speci- fications of engine are given in Tables 4 and 5. The in-cylinder pressure and temperature were meas- ured using a special spark plug with a built-in pressure sensor and thermocouple. The spark plug used in this study is a diode laser based electric spark plug and has a fast transient pressure transducer (Kistler, Model 603B1). This sensor was combined with a charge amplifier (Ki- stler, Model 5010. A high precision angle displacement sensor with a one degree resolution was added to the crankshaft. The data acquisition for the pressure sensor was triggered by the crank angle sensor such that a pres- sure measurement was taken every crank angle degree. During the pressure measurements, substantial variation was observed in consecutive operating cycles (One en- gine cycle consist of 4-strokes and completed in 0.0077 sec and swap 720˚ crank rotation angle). The in-cylinder CO and NOx (as NO plus NO2) were determined through fast sampling valve. On the exhaust side, an emission analyzer (Test 350 XL) was used to determine the com- position of the gases. The data was acquired at 100 Hz through a 12 bit data acquisition system. Eight channels of data collected are the time histories of the trigger sig- nal (used as time reference) and cylinder pressure. Data for all individual tests are normalized based on the initial time reference signal. The data collection is performed with a personal computer equipped with an AJD board (Data Translation, Model DT2837). 3. Results and Discussion An IC engine performance was characterized by meas- uring the profiles of in-cylinder pressure and temperature variations during engine cycle. The formation of carbon monoxide (CO) and oxides of nitrogen (as NO, NO2) was studied. The measured data of cylinder temperature, pressure and pollutants emission profiles (for CO, NO, NO2) were compared with the simulation (modeled) outcomes. Dur- ing the measurements, significant variations in the se- lected parameters were observed within the combustion chamber. This comparison provided the baseline infor- mation for the selection of an appropriate kinetic model (mechanism) of oxidation of natural gas (as CNG) in IC engine. 3.1. The In-Cylinder Pressure and Temperature The recorded pressure data was plotted versus crank an- gle (the time of complete cycle duration which four- stroke was converted to crank angle position with simu- lation model (Chemkin 4.1.1). This variation in meas- urements is plotted for the results obtained when engine operating conditions were under stoichiometric (φ = 1.0) conditions and at 3000 rpm. In Figure 3, each plot showed the similar pattern of variations of chamber pres- sure for each cycle while the major variations were ob- served for peak pressures during the combustion process occurring from –20˚ to 0˚ crank angle. The plot has not smooth variation in the each profile (both model based and experimental based data) which indicate the occur- rence of unpredicted reactions and sudden release of en- ergy as discussed in reference cited at [1]. The average measured cylinder pressure varied from 0.61 atm to 32.62 atm for six (06) consecutive engine cycles. Under fuel-lean conditions (φ ≈ 0.6), the maximum cylinder pressure was reached up to 18.0 atm. Similarly, for fuel-rich conditions, a maximum pressure of about 40.0 atm was achieved for equivalence ratio of φ = 1.13 and 1.3. Unexpectedly, there was lower maximum cylinder pressure (≈38 atm) was observed at φ ≈ 1.4. This high cylinder pressure indicates the degree of completion of the combustion which depicts the maximum release of the energy from the fuel contents during com- bustion. Similarly, the low pressure indicates the in-com- plete combustion which means that net heat of reaction released is low [1]. The cylinder pressure is studied by a number of researchers [31-35] and obtained the pressure profiles as shown in Figure 3. For example, Ridha et al. [31] in the study of three chemical kinetic mechanisms of methane combustion obtained the similar pressure pro- files under stoichiometric conditions. Li Cao et al. [30] simulated the engine flow using the turbulence model  M. MANSHA ET AL. Copyright © 2011 SciRes. ACES 106 Figure 1. Schematic diagram of experime ntal setup. Figure 2. Lab view of experimental setup. and correlated the engine pressure variation with the heat released during the engine cycle. Ibrahim et al. [33] in- vestigated the cylinder pressure for various engine speeds and obtained the pressure profiles experimentally for  M. MANSHA ET AL. Copyright © 2011 SciRes. ACES 107 Table 4. Experimental setup components. No Component No Component 1 Petrol Tank 7 CNG Solenoid Valve 2 Petrol Solenoid 8 GAS (CNG, Methane, Fuel B) Storage Tank 3 Petrol Flow Meter 9 Spark Timing Advancer 4 CNG Mixer 10 Spark Plug 5 Carburetor 11 Fuel Selector switch 6 CNG Pressure Regulator Table 5. Specification tested engine used in 4-stoke automobile rickshaws. Parameter Typical Value Engine Capacity 200 CC Compression Ratio 10.51 Bore, mm 33.5 Stroke, mm 35.5 Cylinder Volume (cm3) 63 Displaced Volume (cm3) 56.52 Clearance Volume (cm3) 6.48 Cylinder Diameters (cm) 14.67 Crank to Connecting rod ratio 1.632 Carburetor 2-barreldown-draft Specification of CNG carburetion system Regulator LANDI RENZO TN1-B-SIC Mixer Remote extractor Spark advancer STAP 51 Crank Rotation Angle Crank Rotation Angle Figure 3. Pressure profiles for four proposed kinetic models (simulation with IC modules of Chemkin 4.1.1 and experimental cylinder pressure data.  M. MANSHA ET AL. Copyright © 2011 SciRes. ACES 108 CNG fuel in IC engine. It clear from Figure 3 that the curves for proposed ki- netic Mechanism-I and Mechanism-IV shows similar behavior throughout the cycle but the profile of Mecha- nism-IV are much closer agreement with the experimental data plot. Although, the both the experimental and simu- lation profiles for Mechanism-IV do not follow the nor- mal trend but the Mechanism-IV predicted the closer trend with the experimental trend. On the basis of pres- sure profiles (both simulation data and experimental data) for Mechanism-IV, it can be conclude that Mechanism-IV is an appropriate mechanism of CNG combustion in IC engine as shown experimental setup (Figure 1). Figure 4 shows the variation of average cylinder tem- perature measured for six successive engine cycles (each cycle consists of 4-strokes). Mechanism-I over predict the chamber temperature (up to about 5000 K) during the combustion of reacting mixture (CNG-Air) while Me- chanism-II and Mechanism-III indicate the early start of the combustion which do not coincide with the experi- mental data. According to Figure 4, the experimental data showed the good agreement with simulation results were obtained using Mechanism-IV. The average peaks cylinder tem- perature reached up to 4000 K while the engine was op- erating at 3000 rpm, φ = 1.0, Pinilet = 0.67 atm for Mecha- nism-IV. The initial temperature rises (up to 1600 K) due to the compression stroke from –100˚ to –20˚ of crank angle position and after this there is substantial increase in the temperature which is due to start of combustion process (occurring between –20˚ and 2˚). When expan- sion stroke starts, then fall of temperature was observed and it continued with higher gradient for exhaust stroke. The effect of fuel/air equivalence ratio on the cylinder temperature has been investigated in the engine operating at 3000 rpm, Pinilet = 0.67 atm. The plots in Figure 5 shows that a smooth trend of variation in cylinder tem- perature was observed for fuel rich conditions for equivalence ratios of φ = 1.1, 1.3 and 1.4. The maximum peak temperature (about 4100 K) was observed when the engine was achieved equivalence ra- tio of 1.3. The peak temperatures and pressure observed in the combustion cylinder are given in Table 6 along with mean values and St. Dev. in the data for various equivalence ratios. 3.2. Investigation of Formation of Pollutant Species The formation of two criteria gaseous pollutants (CO and NOx) were studied in present research work. A fast re- sponse NO detector, based on the chemiluminescence Figure 4. Cylinder temperature of predicted for four mechanisms and average of six (06) consecutive operating cycles of en- gine operating at 300 rpm, φ = 1.0, Pinilet = 0.67 atm.  M. MANSHA ET AL. Copyright © 2011 SciRes. ACES 109 Figure 5. Measured cylinder temperatures at various equivalence ratios of CNG fired IC Engine operating at 3000 rpm, Pinilet = 0.67 atm. Table 6. Peak cylinder temperature and pressure at various equivalence ratios. Temperature, (K) Pressure , (atm) Equivalence Ratio (φ) Peak Mean St. Dev Peak Mean St. Dev 0.6 3976.07 3587.14 676.14 31.06 8.27 8.75 1.0 3994.09 3613.25 597.88 28.37 7.55 7.97 1.13 4053.30 3753.77 656.50 30.30 8.06 8.52 1.3 4102.4 3808.46 686.05 33.76 8.45 8.94 1.4 4100.56 3783.11 711.84 32.87 8.68 9.27  M. MANSHA ET AL. Copyright © 2011 SciRes. ACES 110 (CLD) method has been used to measure continuous, real-time levels of NO in the cylinder. The NOx concen- trations data (as calculated as mole fraction of sum of NO and NO2 data) is plotted versus crank angle position as shown in Figure 6. The data was collected when en- gine was operated at 3000 rpm under stoichiometric con- ditions (when φ = 1.0). The fluctuations in the NOx levels in the combustion chamber were observed after combustion process during expansion and exhaust phases. The NOx profile showed that maximum NOx concentrations were produced when engine was fired by the CNG. The increase or decrease of the concentrations of NOx after combustion indicates occurring of the reactions during the expansion of the burned gas mixture but reactions consuming NOx mole- cules are seems to dominant the producer reactions. During the exhaust phase, the constant levels indicate the freezing of the NOx chemistry at the low temperature [1]. It can be concluded that higher NOx levels were observed at higher temperatures in the combustion chamber. The curves of Figures 6 and 7 illustrated that lower emis- sions were observed under lean mixture conditions (φ < 1.0). The shapes of these curves showed the complexities emission controls. When engine operation becomes sta- ble (usually when fuel flow increased and combustible mixture become fuel-rich), high concentrations of CO were observed while NOx levels were lowered. During the measurements, it was also observed that when engine was operated under load condition, leaner mixture pro- duced lower CO emissions and moderate levels of NOx emissions. Figures 7 and 8 also indicate that highest concentra- tion of NOx were near the stoichiometric conditions and then become lower while CO level shows increasing trend. Maximum variation in the concentrations of these pollutants (NO and NO2) is clearly shown in Figures 7 and 8. There are two major sources of nitrogen to in fuel Figure 6. Measured NOx concentrations (in-cylinder) for three fuel (3000 rev/min, φ = 1.0 and Pinlet = 0.67 atm). 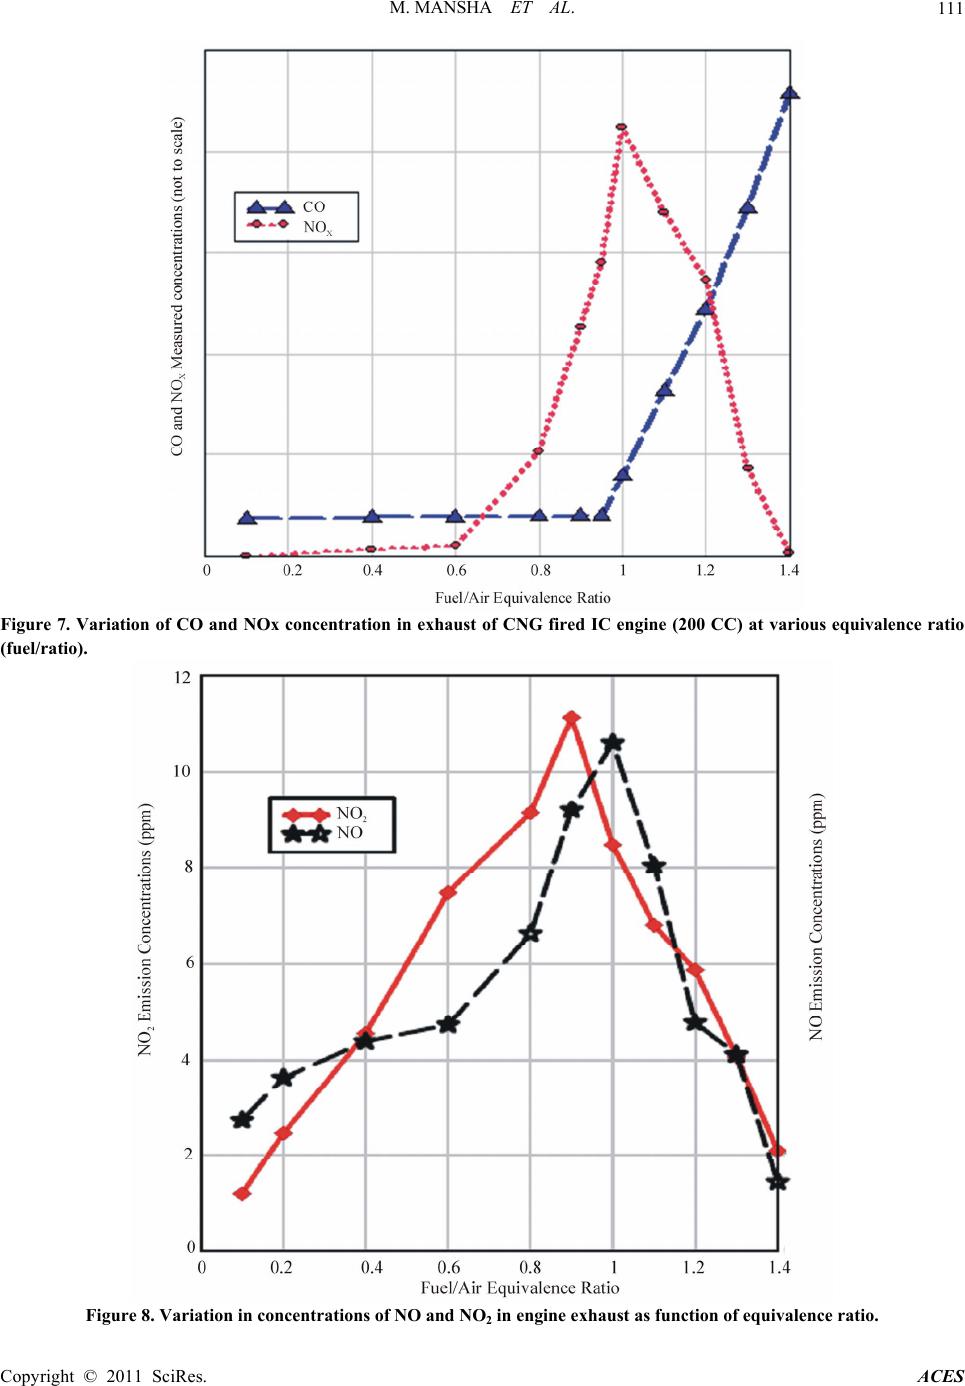 M. MANSHA ET AL. Copyright © 2011 SciRes. ACES 111 Figure 7. Variation of CO and NOx concentration in exhaust of CNG fired IC engine (200 CC) at various equivalence ratio (fuel/ratio). Figure 8. Variation in concentrations of NO and NO2 in engine exhaust as function of equivalence ratio.  M. MANSHA ET AL. Copyright © 2011 SciRes. ACES 112 mixture (fuel nitrogen and air nitrogen) in pre-mixed combustion of CNG in IC engine. Studies [1] revealed that the fuel nitrogen is source of NO via different mechanisms. Figure 9 shows the comparison of results of experi- mental data of in-cylinder NOx data of IC engine fired with CNG operating at 3000 rpm and equivalence ratio of ≈ 1.0 and simulation data of NOx (as mole fraction) obtained for four kinetic mechanisms using IC engine module of Chemkin 4.1.1. During combustion lower hydrocarbons, lower mo- lecular weight nitrogen-containing compounds such as ammonia (NH3), hydrogen cyanide (HCN) and cyanide (CN) are formed [1,29]. Simulation of CNG combustion in IC engine (Chemkin 4.1.1) predicts the existence and formation of these precursor compounds on NO forma- tion. Rate of Production (ROP) analysis of each of mecha- nism was carried out to know which type of reaction contribute the NOx formation at typical 3000 K under stoichiomteric conditions (φ = 1.0) at moderate speed of 3000 rpm. ROP analysis shows the how much a particu- lar reaction contributes in production or consumption of a specie/product. Table 7 shows the important plausible reactions involved in NOx formation due to CNG com- bustion in IC engine and normalized rate of production coefficients. The positive (+ve) value of Normalized ROP coefficient indicate the production or forward rate is dominant while negative (-ve) value means the con- sumption or backward rate of reaction is dominate. In Table 7 , it is clear that NO2 is converted to NO via reaction; NO2+M<=>NO+O+M where M is the third body molecular specie or radical (which may be OH). Figure 8 shows the emission data NO and NO2 from the tested engine data measured at various equivalence ratios. These figures indicate that the NOx formation is greatly affected by Fuel/Air Equivalence Ratios. During the ex- periments, it was observed that as equivalence ratio is increased, the oxygen concentrations were lowered and in parallel burned gas temperature decreased. When mixture was leaned, increasing oxygen concentrations offset the lowered gas temperature and NO emissions get peak concentrations nearly at φ ≈ 0.97 while highest con- centrations reached at φ ≈ 0.85. The NOx concentrations showed different character both under fuel lean and fuel rich conditions. Based upon both simulations results and experimental data, it can be concludes that; Figure 9. Comparison of NOx profiles (with modeled data and experimental data). 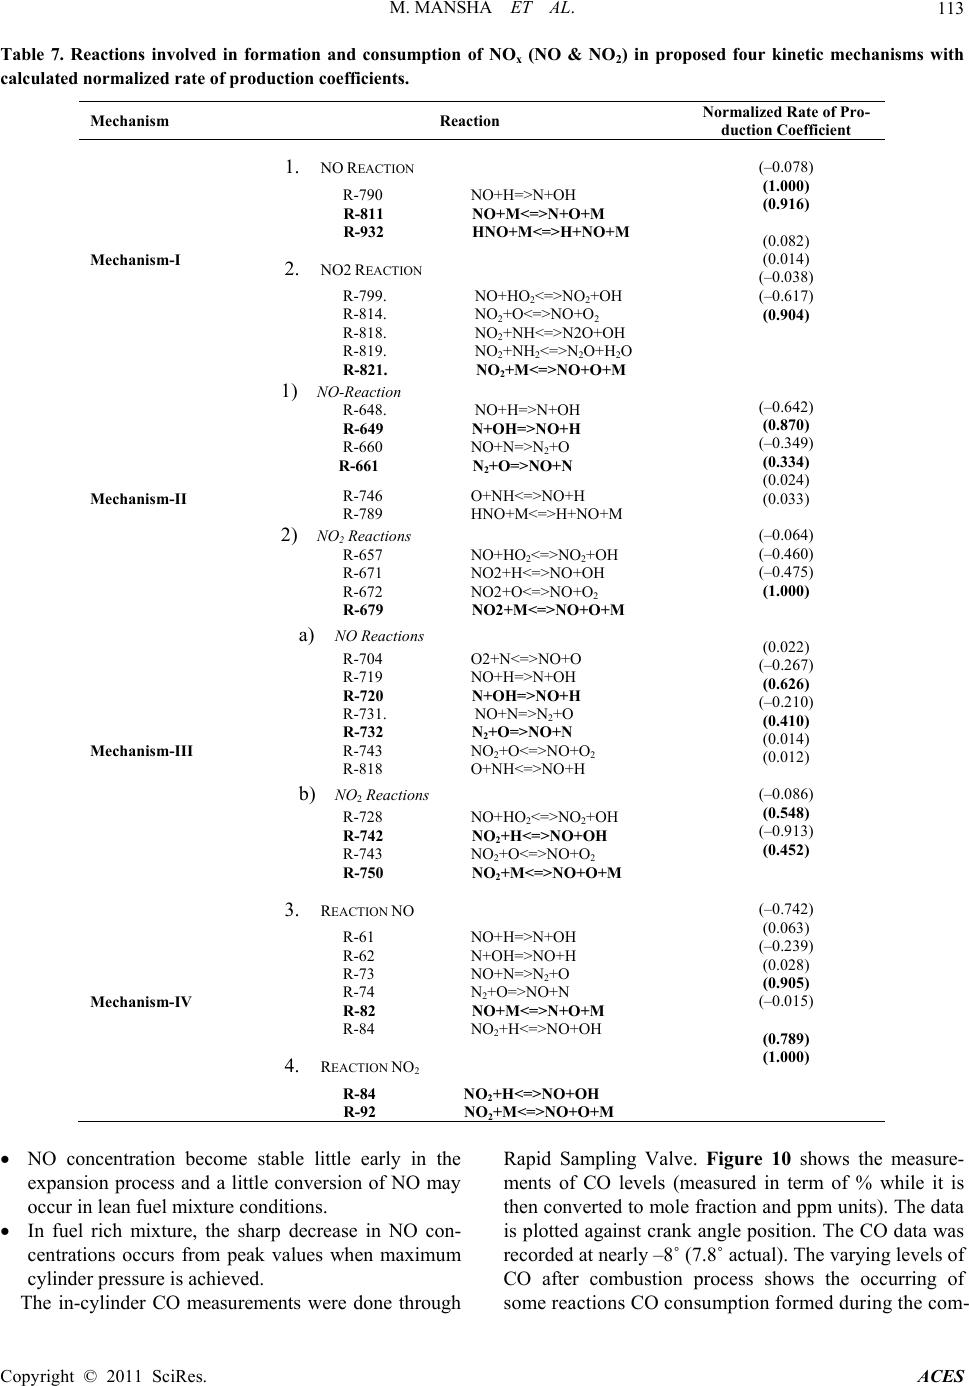 M. MANSHA ET AL. Copyright © 2011 SciRes. ACES 113 Table 7. Reactions involved in formation and consumption of NOx (NO & NO2) in proposed four kinetic mechanisms with calculated normalized rate of production coefficients. Mechanism Reaction Normalized Rate of Pro- duction Coefficient Mechanism-I 1. NO REACTION R-790 NO+H=>N+OH R-811 NO+M<=>N+O+M R-932 HNO+M<=>H+NO+M 2. NO2 REACTION R-799. NO+HO2<=>NO2+OH R-814. NO2+O<=>NO+O2 R-818. NO2+NH<=>N2O+OH R-819. NO2+NH2<=>N2O+H2O R-821. NO2+M<=>NO+O+M (–0.078) (1.000) (0.916) (0.082) (0.014) (–0.038) (–0.617) (0.904) Mechanism-II 1) NO-Reaction R-648. NO+H=>N+OH R-649 N+OH=>NO+H R-660 NO+N=>N2+O R-661 N2+O=>NO+N R-746 O+NH<=>NO+H R-789 HNO+M<=>H+NO+M 2) NO2 Reactions R-657 NO+HO2<=>NO2+OH R-671 NO2+H<=>NO+OH R-672 NO2+O<=>NO+O2 R-679 NO2+M<=>NO+O+M (–0.642) (0.870) (–0.349) (0.334) (0.024) (0.033) (–0.064) (–0.460) (–0.475) (1.000) Mechanism-III a) NO Reactions R-704 O2+N<=>NO+O R-719 NO+H=>N+OH R-720 N+OH=>NO+H R-731. NO+N=>N2+O R-732 N2+O=>NO+N R-743 NO2+O<=>NO+O2 R-818 O+NH<=>NO+H b) NO2 Reactions R-728 NO+HO2<=>NO2+OH R-742 NO2+H<=>NO+OH R-743 NO2+O<=>NO+O2 R-750 NO2+M<=>NO+O+M (0.022) (–0.267) (0.626) (–0.210) (0.410) (0.014) (0.012) (–0.086) (0.548) (–0.913) (0.452) Mechanism-IV 3. REACTION NO R-61 NO+H=>N+OH R-62 N+OH=>NO+H R-73 NO+N=>N 2+O R-74 N 2+O=>NO+N R-82 NO+M<=>N+O+M R-84 NO 2+H<=>NO+OH 4. REACTION NO2 R-84 NO2+H<=>NO+OH R-92 NO2+M<=>NO+O+M (–0.742) (0.063) (–0.239) (0.028) (0.905) (–0.015) (0.789) (1.000) NO concentration become stable little early in the expansion process and a little conversion of NO may occur in lean fuel mixture conditions. In fuel rich mixture, the sharp decrease in NO con- centrations occurs from peak values when maximum cylinder pressure is achieved. The in-cylinder CO measurements were done through Rapid Sampling Valve. Figure 10 shows the measure- ments of CO levels (measured in term of % while it is then converted to mole fraction and ppm units). The data is plotted against crank angle position. The CO data was recorded at nearly –8˚ (7.8˚ actual). The varying levels of CO after combustion process shows the occurring of some reactions CO consumption formed during the com- 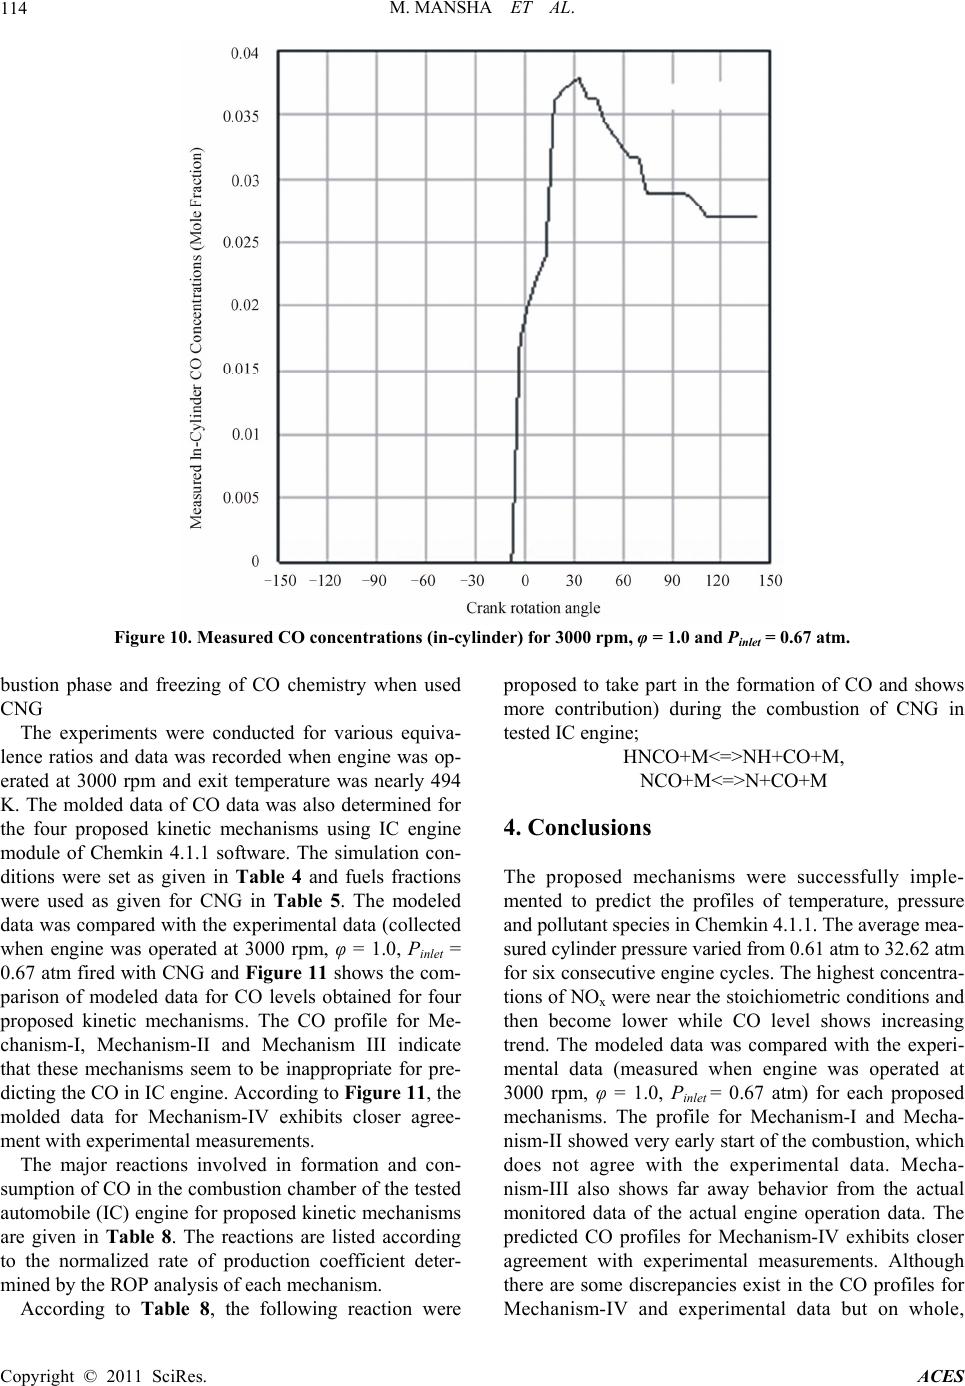 M. MANSHA ET AL. Copyright © 2011 SciRes. ACES 114 Figure 10. Measured CO concentrations (in-cylinder) for 3000 rpm, φ = 1.0 and Pinlet = 0.67 atm. bustion phase and freezing of CO chemistry when used CNG The experiments were conducted for various equiva- lence ratios and data was recorded when engine was op- erated at 3000 rpm and exit temperature was nearly 494 K. The molded data of CO data was also determined for the four proposed kinetic mechanisms using IC engine module of Chemkin 4.1.1 software. The simulation con- ditions were set as given in Table 4 and fuels fractions were used as given for CNG in Table 5. The modeled data was compared with the experimental data (collected when engine was operated at 3000 rpm, φ = 1.0, Pinlet = 0.67 atm fired with CNG and Figure 11 shows the com- parison of modeled data for CO levels obtained for four proposed kinetic mechanisms. The CO profile for Me- chanism-I, Mechanism-II and Mechanism III indicate that these mechanisms seem to be inappropriate for pre- dicting the CO in IC engine. According to Figure 11, the molded data for Mechanism-IV exhibits closer agree- ment with experimental measurements. The major reactions involved in formation and con- sumption of CO in the combustion chamber of the tested automobile (IC) engine for proposed kinetic mechanisms are given in Table 8. The reactions are listed according to the normalized rate of production coefficient deter- mined by the ROP analysis of each mechanism. According to Table 8, the following reaction were proposed to take part in the formation of CO and shows more contribution) during the combustion of CNG in tested IC engine; HNCO+M<=>NH+CO+M, NCO+M<=>N+CO+M 4. Conclusions The proposed mechanisms were successfully imple- mented to predict the profiles of temperature, pressure and pollutant species in Chemkin 4.1.1. The average mea- sured cylinder pressure varied from 0.61 atm to 32.62 atm for six consecutive engine cycles. The highest concentra- tions of NOx were near the stoichiometric conditions and then become lower while CO level shows increasing trend. The modeled data was compared with the experi- mental data (measured when engine was operated at 3000 rpm, φ = 1.0, Pinlet = 0.67 atm) for each proposed mechanisms. The profile for Mechanism-I and Mecha- nism-II showed very early start of the combustion, which does not agree with the experimental data. Mecha- nism-III also shows far away behavior from the actual monitored data of the actual engine operation data. The predicted CO profiles for Mechanism-IV exhibits closer agreement with experimental measurements. Although there are some discrepancies exist in the CO profiles for Mechanism-IV and experimental data but on whole, 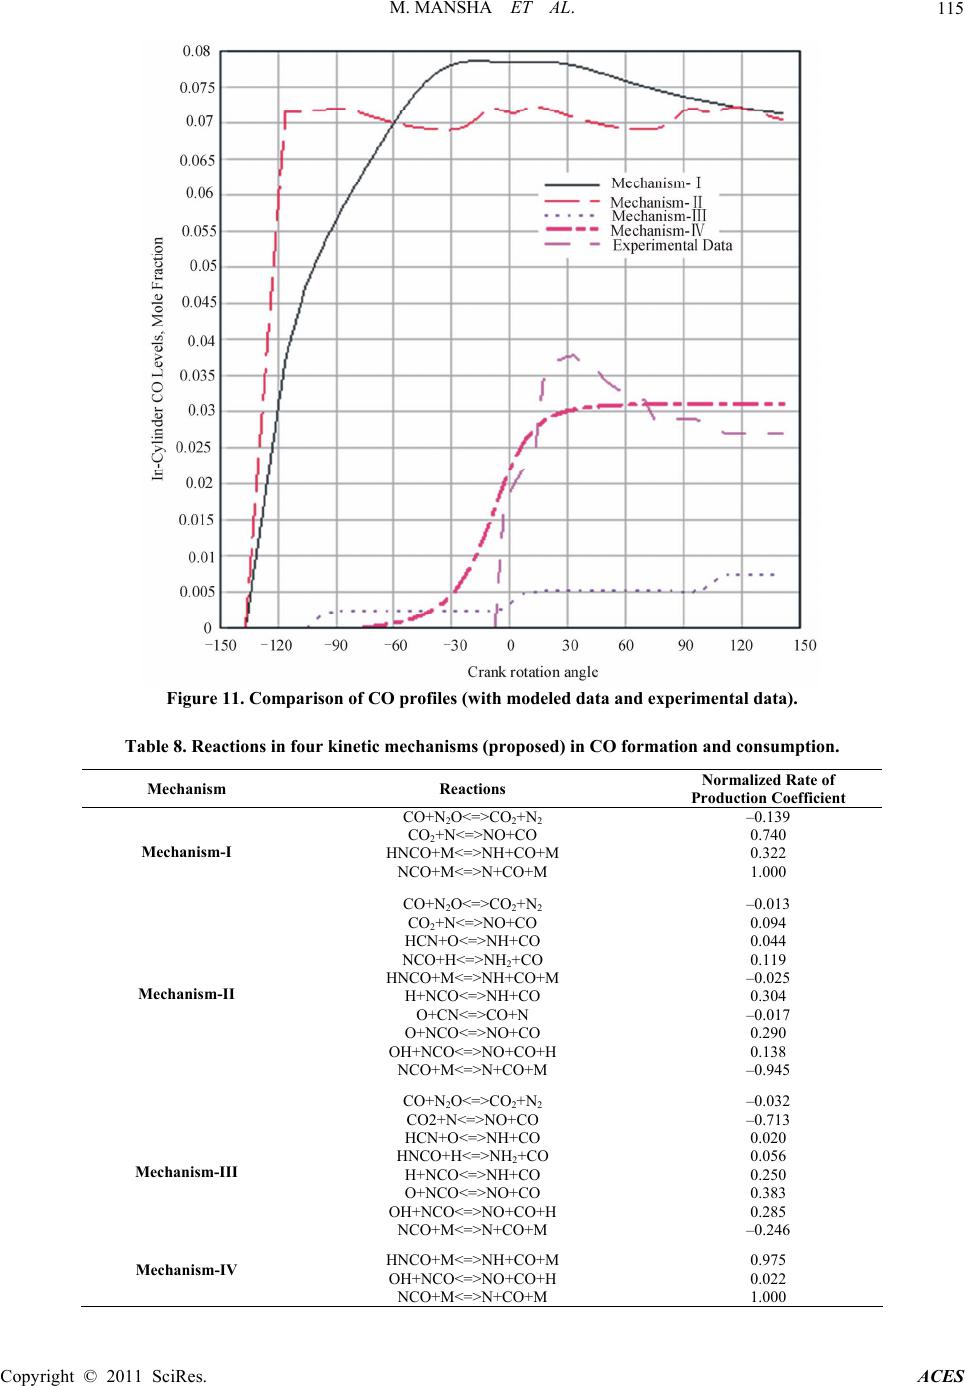 M. MANSHA ET AL. Copyright © 2011 SciRes. ACES 115 Figure 11. Comparison of CO profiles (with modeled data and expe rime ntal data). Table 8. Reactions in four kinetic mec hanisms (proposed) in CO for mation and consumption. Mechanism Reactions Normalized Rate of Production Coefficient Mechanism-I CO+N2O<=>CO2+N2 CO2+N<=>NO+CO HNCO+M<=>NH+CO+M NCO+M<=>N+CO+M –0.139 0.740 0.322 1.000 Mechanism-II CO+N2O<=>CO2+N2 CO2+N<=>NO+CO HCN+O<=>NH+CO NCO+H<=>NH2+CO HNCO+M<=>NH+CO+M H+NCO<=>NH+CO O+CN<=>CO+N O+NCO<=>NO+CO OH+NCO<=>NO+CO+H NCO+M<=>N+CO+M –0.013 0.094 0.044 0.119 –0.025 0.304 –0.017 0.290 0.138 –0.945 Mechanism-III CO+N2O<=>CO2+N2 CO2+N<=>NO+CO HCN+O<=>NH+CO HNCO+H<=>NH2+CO H+NCO<=>NH+CO O+NCO<=>NO+CO OH+NCO<=>NO+CO+H NCO+M<=>N+CO+M –0.032 –0.713 0.020 0.056 0.250 0.383 0.285 –0.246 Mechanism-IV HNCO+M<=>NH+CO+M OH+NCO<=>NO+CO+H NCO+M<=>N+CO+M 0.975 0.022 1.000  M. MANSHA ET AL. Copyright © 2011 SciRes. ACES 116 we can conclude the Mechanism-IV is representative scheme of reactions predicting the combustion in CNG fired IC engine. 5. Acknowledgements Authors are thankful to Mrs Warth, NANCR, France for providing copy of EXGAS software free of cost. Authors appreciate the technical support of Mr. Ahmad Din of Rafae Engineering for development of experimental setup. We also extend our gratitude to the Higher Educa- tion Commission of Pakistan for sponsoring this research work. 6. References [1] J. B. Heywood, “Internal Combustion Engines Funda- mentals,” McGraw-Hill, Science/Engineering/Math, New York, 1988. [2] Q. P. Zheng, H. M. Zhang and D. F. Zhang, “A Compu- tational Study of Combustion in Compression Ignition Natural Gas Engine with Separated Chamber,” Fuel, Vol. 84, No. 12-13, 2005, pp. 1515-1523. [3] M. U. Aslam, H. H. Masjuki, M. A. Kalam, H. Abdesse- lam, T. M. I. Mahlia and M. A. Amalina, “An Experi- mental Investigation of Cng as an Alternative Fuel for a Retrofitted Gasoline Vehicle,” Fuel, Vol. 85, No. 5-6, 2006, pp. 717-724. [4] S. Shiga, S. Ozone, H. T. C. Machacon, T. Karasawa, H. Nakamura, T. Ueda, N. Jingu, Z. Huang, M. Tsue and M. Kono, “A Study of the Combustion and Emission Char- acteristics of Compressed-Natural-Gas Direct-Injection Stratified Combustion Using a Rapid-Compression-Ma- chine,” Combustion and Flame, Vol. 129, No. 1-2, 2002, pp. 1-10. [5] D. Zhang and S. H. Frankel, “A Numerical Study of Natu- ral Gas Combustion in a Lean Burn Engine,” Fuel, Vol. 77, No. 12, 1998, pp. 1339-1347. [6] J. Kusaka, T. Okamoto, Y. Daisho, R. Kihara and T. Saito, “Combustion and Exhaust Gas Emission Characteristics of a Diesel Engine Dual-Fueled with Natural Gas,” JSAE Re- view, Vol. 21, No. 4, 2000, pp. 489-496. [7] T. Ando, Y. Isobe, D. Sunohara, Y. Daisho and J. Kusaka, “Homogeneous Charge Compression Ignition and Com- bustion Characteristics of Natural Gas Mixtures: The Visu- alization and Analysis of Combustion,” JSAE Review, Vol. 24, No. 1, 2003, pp. 33-40. [8] C. K. Westbrook, “Applying Chemical Kinetics to Natural Gas Combustion Problems,” Report No. PB-86-168770/ XAB, Lawrence Livermore National Laboratory, Liver- more, 1985. [9] P. Glarborg, J. A. Miller and R. J. Kee, “Kinetic Model- ling and Sensitivity Analysis of Nitrogen Oxide Forma- tion in Well Stirred Reactors,” Combustion and Flame, Vol. 65, No. 2, 1986, pp. 177-202. [10] J. A. Miller and C. T. Bow man, “Mechanism and Mod- eling of Nitrogen Chemistry in Combustion,” Progress in Energy and Combustion Sciences, Vol. 15, No. 4, 1989, pp. 287-338. [11] A. A. Konnov, “Detailed Reaction Mechanism for Small Hydrocarbons Combustion,” Release 0.5, 2000. http://homepages.vub.ac.be/~akonnov/ [12] K. J. Hughes, T. Tur´anyi, A. R. Clague and M. J. Pilling, “Development and Testing of a Comprehensive Chemical Mechanism for the Oxidation of Methane,” International Journal of Chemical Kinetics, Vol. 33, No. 9, 2001, pp. 513-538. [13] G. P. Smith, et al., Grimesh 3.0, http://www.me.berkeley.edu/gri_mech [14] C. K. Westbrook and F. L. Dryer, “Simplified Reaction Mechanisms for the Oxidation of Hydrocarbon Fuels in Flames,” Combustion Sciences and Technologies, Vol. 27, No. 1-2, 1981, pp. 31-43. [15] J. Duterque, B. Roland and T. Helene, “Study of Quasi- Global Schemes for Hydrocarbon Combustion,” Combus- tion Science and Technology, Vol. 26, No. 1-2, 1981, pp. 1-15. [16] N. N. Peters, “Numerical and Asymptotic Analysis of Sys- tematically Reduced Reaction Schemes for Hydrocarbon Flames: Numerical Simulation of Combustion Phenom- ena,” In: R. Glowinski, B. Larrouturou and R. Temam, Eds., Lecture Notes in Physics, Proceedings of the Sympo- sium Held at INRIA Sophia-Antipolis, France, Vol. 241, 21-24 May 1985, pp. 90-109. [17] D. J. Hautmann, F. L. Dryer, K. P. Schug and I. Glass- man, “A Multiple-Step Overall Kinetic Mechanism for the Oxidation of Hydrocarbons,” Combustion Sciences and Technologies, Vol. 25, No. 5-6, 1981, pp. 219-235. [18] W. P. Jones and R. P. Lindstedt, “Global Reaction Schemes for Hydrocarbon Combustion, Global Reaction Schemes for Hydrocarbon Combustion,” Combustion and Flame, Vol. 73, No. 3, 1988, pp. 233-249. [19] R. B. Edelman and O. F. Fortune, “A Quasi-Global Che- mical Kinetic Model for the Finite Rate Combustion of Hydrocarbon Fuels with Application to Turbulent Burn- ing and Mixing in Hypersonic Engines and Nozzles,” American Institute of Aeronautics and Astronautics, 1969, pp. 69-86. [20] R. B. Edelman and P. T. Harsha, “Laminar and turbulent Gas Dynamics in Combustors—Current Status,” Pro- gress in Energy and Combustion Sciences, Vol. 4, No. 1, 1978, pp. 1-62. [21] C. Muller, V. Michel, G. Scacchi and G M. J. Cˆome, “THERGAS: A Computer Program for the Evaluation of Thermochemical Data of Molecules and Free Radicals In the Gas Phase,” Journal de Chemie Physique, Vol. 92, No. 5, 1995, pp. 1154-1178. [22] P. A. Glaude, F. Batttin-Leclerc, R. Fournet, V. Warth and G. M. Come, “Construction and Simplification of a Model for the Oxidation of Alkanes,” Combustion and Flame, Vol. 122, No. 4, 2000, pp. 451-462. [23] B. F. Leclerc, R. Bounaceur, G. M. Cˆome, R. Fournet, P. A. Glaude, G. Scacchi and V. Warth, “EXGAS User’s  M. MANSHA ET AL. Copyright © 2011 SciRes. ACES 117 Guide,” Nancy, France, 2004. [24] G. M. Cˆome, V. Warth, P. A. Glaude, R. Fournet, F. Bat- tin-Leclerc and G. Scacchi, “Computer Aided Design of Gas-Phase Oxidation Mechanisms: Application to the Mo- delling of Normal Heptane and Iso-Octane Oxidation,” Proceedings of the 26th International Symposium on Com- bustion, the Combustion Institute, Pittsburgh, 1996, p. 755. [25] P. A. Glaude, V. Warth, R. Fournet, F. Battin-Leclerc, G. M. Cˆome and G. Scacchi, Bull Soc Chim Belg, Vol. 106, No. 6, 1997, p. 343. [26] P. A. Glaude, V. Warth, R. Fournet, F. Battin-Leclerc, G. Scacchi and G. M. Cˆome, “Modeling of the Oxidation of n-octane and n-decane Using an Automatic Generation Of Mechanisms,” International Journal of Chemical Ki- netics, Vol. 30, No. 12, 1998, pp. 949-959. doi:10.1002/(SICI)1097-4601(1998)30:12<949::AID-KI N10>3.0.CO;2-G [27] M. Mansha, A. R. Saleemi and M. Badar Ghauri, “Ki- netic Models of Natural Gas Combustion in an Internal Combustion Engine,” Journal of Natural Gas Chemistry, Vol. 19, No. 1, 2010, pp. 6-14. [28] M. Mansha, A. R. Saleemi, M. Ghauri Badar and N. Ramzan, “Development and Testing of a Detailed Kinetics Mechanism of Natural Gas Combustion in IC Engine,” Journal of Natural Gas Chemistry, Vol. 19, No. 2, 2010, pp. 97-106. doi:10.1016/S1003-9953(09)60039-6 [29] Reaction Design, Theory Manual, Chemkin 4.1.1 Soft- ware, (2004). [30] F. EI-Mahallawy and S. EI-Din Habik, “Fundamentals and Technology of Combustion,” Elsevier Science Ltd, UK, 2002. [31] R. Ennetta, M. Hamdi and R. Said, “Comparison of Dif- ferent Chemical Kinetic Mechanisms of Methane Com- bustion in an Internal Combustion Engine Configuration, Thermal Science, Vol. 12, No. 1, 2008, pp. 43-51. doi:10.2298/TSCI0801043E [32] L. Cao, H. Zhao and X. Jiang, “Analysis of Controlled Auto-Ignition/HCCI Combustion in a Direct Injection Gasoline Engine with Single and Split Fuel Injections,” Combustion Science and Technology, Vol. 180, No. 1, 2008, pp. 176-205. [33] N. M. I. N.Ibrahim, R. A. Bakar, A. R. Ismail and I. Ali, “Analysis of Engine Speed Effect on Temperature and Pressure of Engine Based on Experiment and Computa- tional Simulation,” Journal of Applied Sciences Research, Vol. 4, No. 1, 2008, pp. 76-83. [34] Y. Bakhshan and S. Abdullah, “Study of CNG Combus- tion under Internal Combustion Engine Conditions, Part II Using Multi dimensional Modeling,” Algerian Journal of Applied Fluid Mechanics, Vol. 1, No. 1, 2008, pp. 10-18. [35] S. Abdullah, W. H. Kurniawan and A. Shamsudeen, “Numerical Analysis of the Combustion Process in a Compressed Natural Gas Direct Injection Engine,” Alge- rian Journal of Applied Fluid Mechanics, Vol. 1, No. 2, 2008, pp. 65-86. |