Paper Menu >>
Journal Menu >>
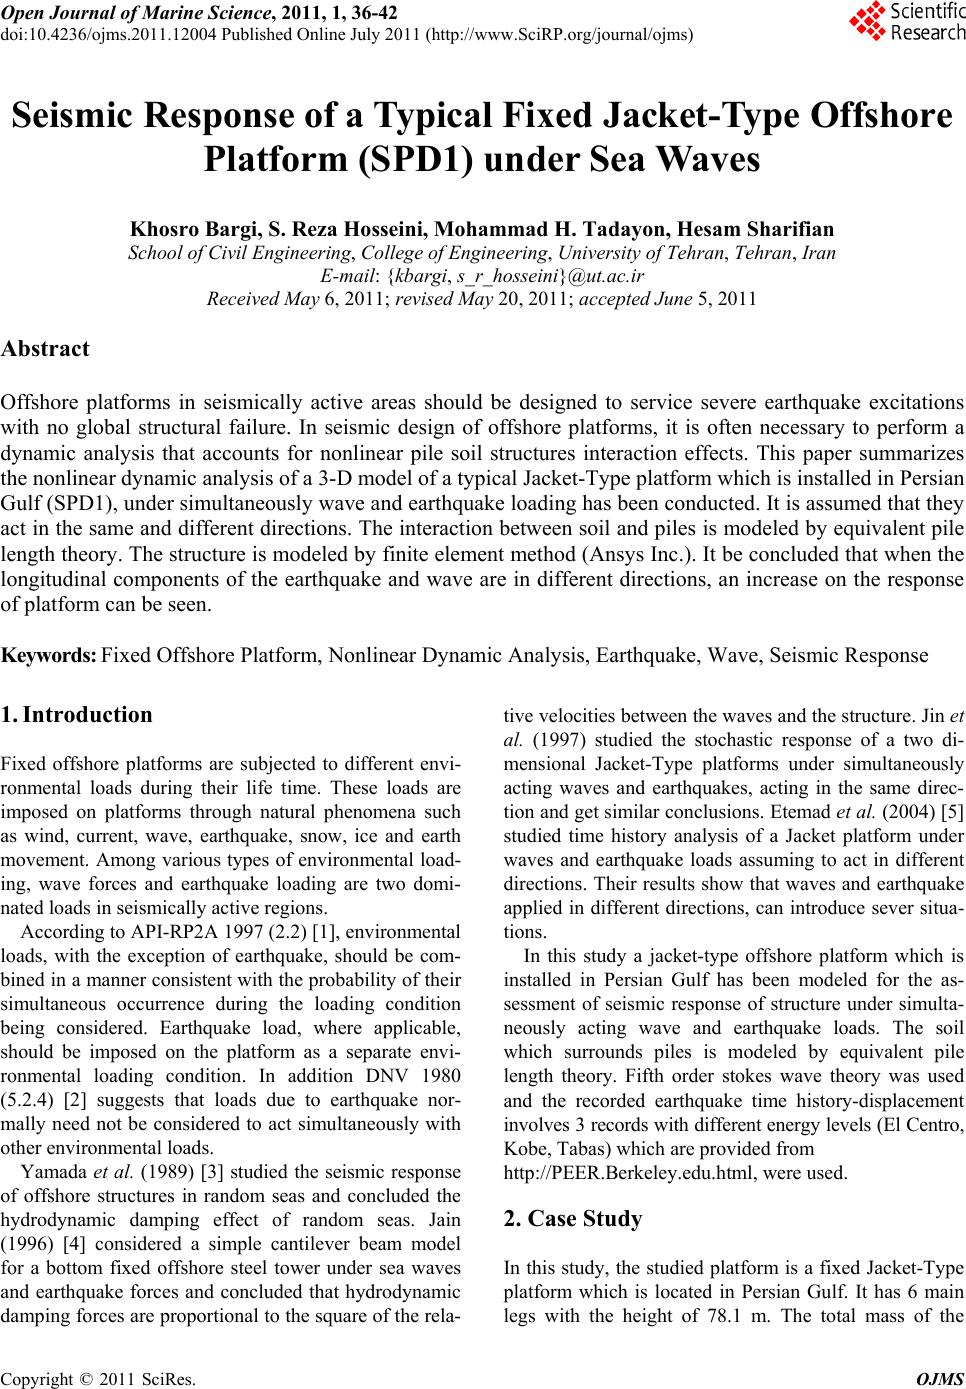 Open Journal of Marine Science, 2011, 1, 36-42 doi:10.4236/ojms.2011.12004 Published Online July 2011 (http://www.SciRP.org/journal/ojms) Copyright © 2011 SciRes. OJMS Seismic Response of a Typical Fixed Jacket-Type Offshore Platform (SPD1) under Sea Waves Khosro Bargi, S. Reza Hosseini, Mohammad H. Tadayon, Hesam Sharifian School of Civil Engineering, College of Engineeri n g, University of Tehran, Tehran, Iran E-mail: {kbargi, s_r_hosseini}@ut.ac.ir Received May 6, 2011; revised May 20, 2011; accepted June 5, 2011 Abstract Offshore platforms in seismically active areas should be designed to service severe earthquake excitations with no global structural failure. In seismic design of offshore platforms, it is often necessary to perform a dynamic analysis that accounts for nonlinear pile soil structures interaction effects. This paper summarizes the nonlinear dynamic analysis of a 3-D model of a typical Jacket-Type platform which is installed in Persian Gulf (SPD1), under simultaneously wave and earthquake loading has been conducted. It is assumed that they act in the same and different directions. The interaction between soil and piles is modeled by equivalent pile length theory. The structure is modeled by finite element method (Ansys Inc.). It be concluded that when the longitudinal components of the earthquake and wave are in different directions, an increase on the response of platform can be seen. Keywords: Fixed Offshore Platform, Nonlinear Dynamic Analysis, Earthquake, Wave, Seismic Response 1. Introduction Fixed offshore platforms are subjected to different envi- ronmental loads during their life time. These loads are imposed on platforms through natural phenomena such as wind, current, wave, earthquake, snow, ice and earth movement. Among various types of environmental load- ing, wave forces and earthquake loading are two domi- nated loads in seismically active regions. According to API-RP2A 1997 (2.2) [1], environmental loads, with the exception of earthquake, should be com- bined in a manner consistent with the probability of their simultaneous occurrence during the loading condition being considered. Earthquake load, where applicable, should be imposed on the platform as a separate envi- ronmental loading condition. In addition DNV 1980 (5.2.4) [2] suggests that loads due to earthquake nor- mally need not be considered to act simultaneously with other environmental loads. Yamada et al. (1989) [3] studied the seismic response of offshore structures in random seas and concluded the hydrodynamic damping effect of random seas. Jain (1996) [4] considered a simple cantilever beam model for a bottom fixed offshore steel tower under sea waves and earthquake forces and concluded that hydrodynamic damping forces are proportional to the square of the rela- tive velocities between the waves and the structure. Jin et al. (1997) studied the stochastic response of a two di- mensional Jacket-Type platforms under simultaneously acting waves and earthquakes, acting in the same direc- tion and get similar conclusions. Etemad et al. (2004) [5] studied time history analysis of a Jacket platform under waves and earthquake loads assuming to act in different directions. Their results show that waves and earthquake applied in different directions, can introduce sever situa- tions. In this study a jacket-type offshore platform which is installed in Persian Gulf has been modeled for the as- sessment of seismic response of structure under simulta- neously acting wave and earthquake loads. The soil which surrounds piles is modeled by equivalent pile length theory. Fifth order stokes wave theory was used and the recorded earthquake time history-displacement involves 3 records with different energy levels (El Centro, Kobe, Tabas) which are provided from http://PEER.Berkeley.edu.html, were used. 2. Case Study In this study, the studied platform is a fixed Jacket-Type platform which is located in Persian Gulf. It has 6 main legs with the height of 78.1 m. The total mass of the 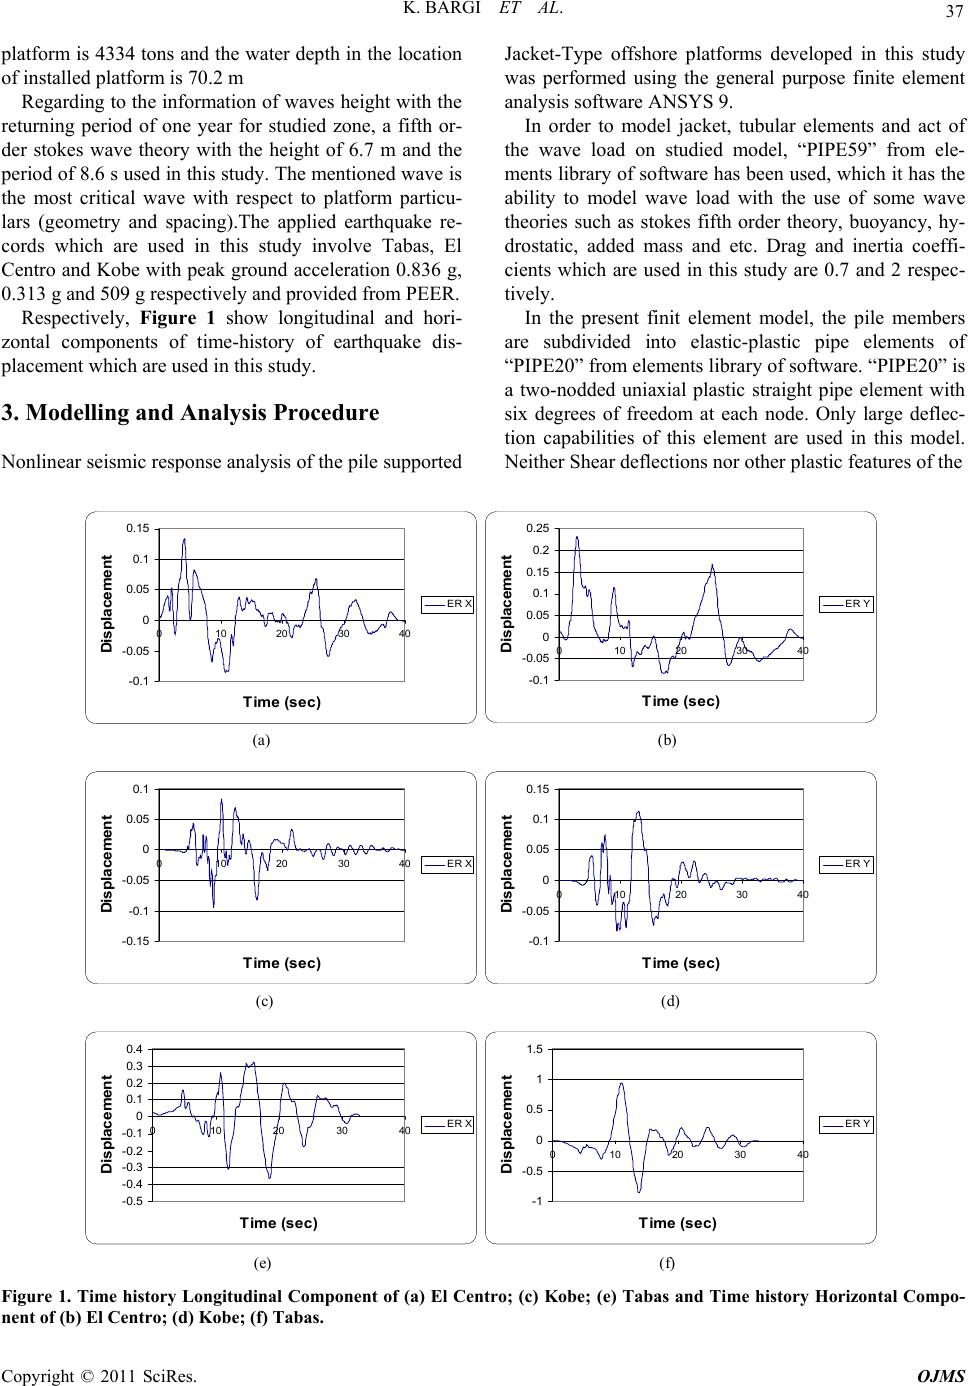 K. BARGI ET AL. 37 platform is 4334 tons and the water depth in the location of installed platform is 70.2 m Regarding to the information of waves height with the returning period of one year for studied zone, a fifth or- der stokes wave theory with the height of 6.7 m and the period of 8.6 s used in this study. The mentioned wave is the most critical wave with respect to platform particu- lars (geometry and spacing).The applied earthquake re- cords which are used in this study involve Tabas, El Centro and Kobe with peak ground acceleration 0.836 g, 0.313 g and 509 g respectively and provided from PEER. Respectively, Figure 1 show longitudinal and hori- zontal components of time-history of earthquake dis- placement which are used in this study. 3. Modelling and Analysis Procedure Nonlinear seismic response analysis of the pile supported Jacket-Type offshore platforms developed in this study was performed using the general purpose finite element analysis software ANSYS 9. In order to model jacket, tubular elements and act of the wave load on studied model, “PIPE59” from ele- ments library of software has been used, which it has the ability to model wave load with the use of some wave theories such as stokes fifth order theory, buoyancy, hy- drostatic, added mass and etc. Drag and inertia coeffi- cients which are used in this study are 0.7 and 2 respec- tively. In the present finit element model, the pile members are subdivided into elastic-plastic pipe elements of “PIPE20” from elements library of software. “PIPE20” is a two-nodded uniaxial plastic straight pipe element with six degrees of freedom at each node. Only large deflec- tion capabilities of this element are used in this model. Neither Shear deflections nor other plastic features of the -1 -0.5 0 0.5 1 1.5 0 10203040 Time (sec) Displacement ER Y -0.5 -0.4 -0.3 -0.2 -0.1 0 0.1 0.2 0.3 0.4 0 10203040 Time (sec ) Displacement ER X -0.1 -0.05 0 0.05 0.1 0.15 0 10203040 Time (sec) Displacement ER Y -0.15 -0.1 -0.05 0 0.05 0.1 010203040 Time (sec ) Displacement ER X -0.1 -0.05 0 0.05 0.1 0.15 0.2 0.25 0 10203040 Time (sec) Displa ce men t ER Y -0.1 -0.05 0 0.05 0.1 0.15 010203040 Time (sec ) Displacement ER X (a) (b) (c) (d) (e) (f) Figure 1. Time history Longitudinal Component of (a) El Centro; (c) Kobe; (e) Tabas and Time history Horizontal Compo- nent of (b) El Centro; (d) Kobe; (f) Tabas. Copyright © 2011 SciRes. OJMS 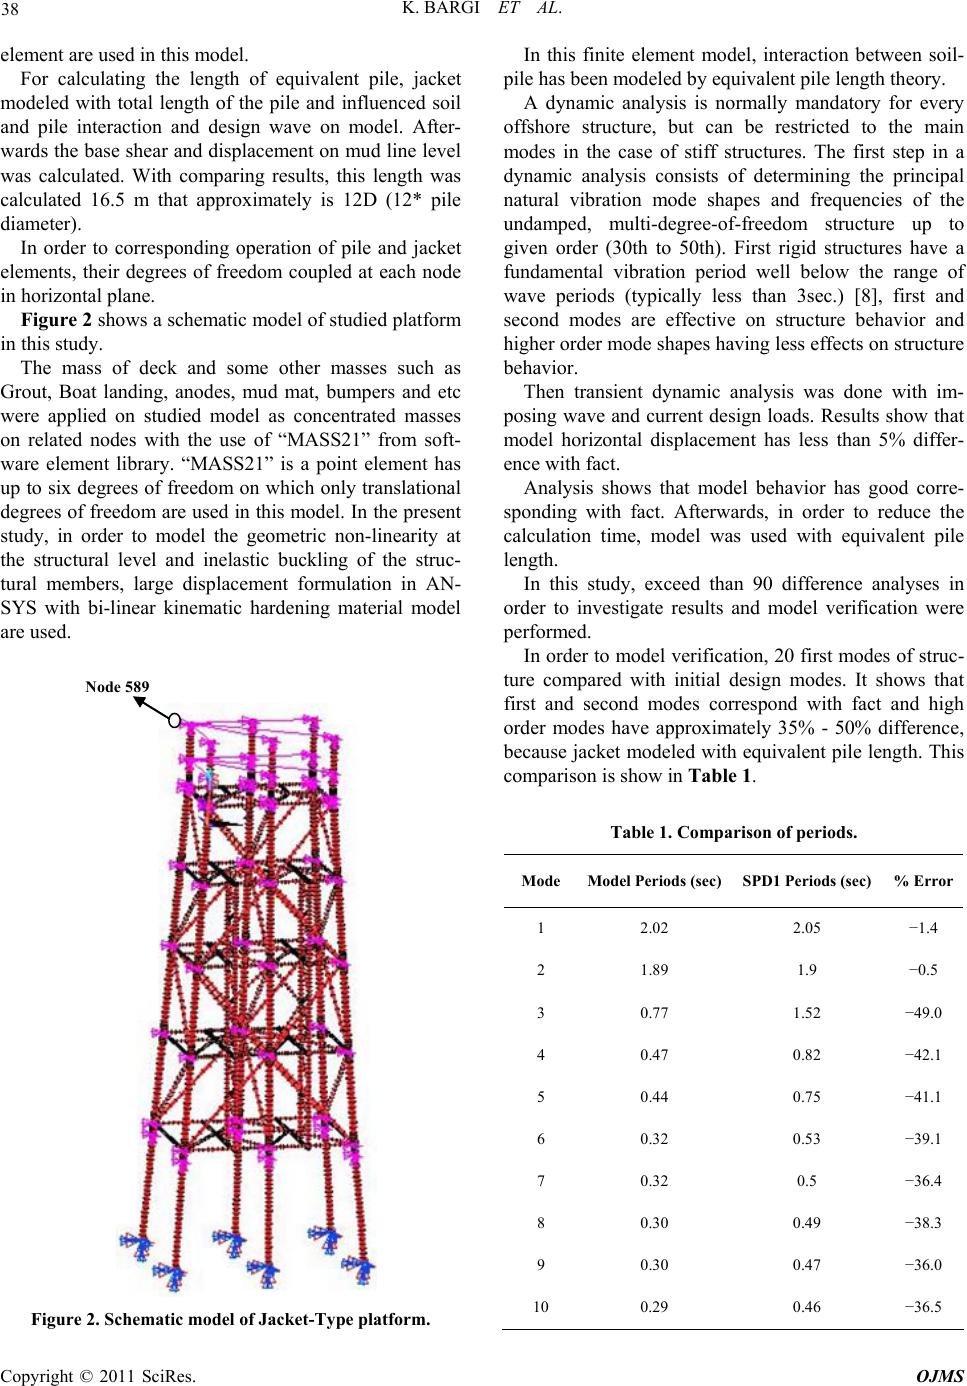 K. BARGI ET AL. Copyright © 2011 SciRes. OJMS 38 element are used in this model. For calculating the length of equivalent pile, jacket modeled with total length of the pile and influenced soil and pile interaction and design wave on model. After- wards the base shear and displacement on mud line level was calculated. With comparing results, this length was calculated 16.5 m that approximately is 12D (12* pile diameter). In order to corresponding operation of pile and jacket elements, their degrees of freedom coupled at each node in horizontal plane. Figure 2 shows a schematic model of studied platform in this study. The mass of deck and some other masses such as Grout, Boat landing, anodes, mud mat, bumpers and etc were applied on studied model as concentrated masses on related nodes with the use of “MASS21” from soft- ware element library. “MASS21” is a point element has up to six degrees of freedom on which only translational degrees of freedom are used in this model. In the present study, in order to model the geometric non-linearity at the structural level and inelastic buckling of the struc- tural members, large displacement formulation in AN- SYS with bi-linear kinematic hardening material model are used. Node 589 Figure 2. Schematic model of Jacket-Type platform. In this finite element model, interaction between soil- pile has been modeled by equivalent pile length theory. A dynamic analysis is normally mandatory for every offshore structure, but can be restricted to the main modes in the case of stiff structures. The first step in a dynamic analysis consists of determining the principal natural vibration mode shapes and frequencies of the undamped, multi-degree-of-freedom structure up to given order (30th to 50th). First rigid structures have a fundamental vibration period well below the range of wave periods (typically less than 3sec.) [8], first and second modes are effective on structure behavior and higher order mode shapes having less effects on structure behavior. Then transient dynamic analysis was done with im- posing wave and current design loads. Results show that model horizontal displacement has less than 5% differ- ence with fact. Analysis shows that model behavior has good corre- sponding with fact. Afterwards, in order to reduce the calculation time, model was used with equivalent pile length. In this study, exceed than 90 difference analyses in order to investigate results and model verification were performed. In order to model verification, 20 first modes of struc- ture compared with initial design modes. It shows that first and second modes correspond with fact and high order modes have approximately 35% - 50% difference, because jacket modeled with equivalent pile length. This comparison is show in Table 1. Table 1. Comparison of periods. Mode Model Periods (sec)SPD1 Periods (sec)% Error 1 2.02 2.05 −1.4 2 1.89 1.9 −0.5 3 0.77 1.52 −49.0 4 0.47 0.82 −42.1 5 0.44 0.75 −41.1 6 0.32 0.53 −39.1 7 0.32 0.5 −36.4 8 0.30 0.49 −38.3 9 0.30 0.47 −36.0 10 0.29 0.46 −36.5  K. BARGI ET AL. 39 4. Seismic Response Analysis of Studied Platform Subjected to Earthquake and Wave Loads Wave and earthquake phenomena occur at stochastic direction. Studied structure is symmetric around Y direc- tion, therefore according to Figure 3, for analysis, four directions for earthquake and wave loads imposed on structure are selected. In order to evaluate the response of studied platform under earthquake and wave loads, simultaneously four studies regarding to wave and earthquake directions have been performed. In the first study, only earthquake load analysis was performed at four directions (Figure 3). Regarding to the random features of sea waves, since it is possible that the direction of wave and earthquake loads to be different, in the second analysis, earthquake longitudinal component fixed at zero direction simultaneously acts with wave load at four directions. For tertiary analysis, wave load component fixed at zero direction simultaneously acts with earthquake longitudinal component at four direc- tions. For all conditions, both earthquake longitudinal and horizontal components were used. Finally, analysis for 100 years wave was performed at four directions. The results are shown as displacement-time history at node 589 (one of the deck’s nodes) as shown in Figure 2. Figure 4 show the comparison between displacements under earthquake load (blue line) and the combination of earthquake and wave loads (pink line) and 100 years wave (yellow line) in X and Y directions respectively for each analyses critical condition. 90 º X Y Earthquake X Direction 45 º −45 º 0 º X Y Wave Direction 90 º 45 º −45 º 0 º Figure 3. Wave and earthquake imposed directions. -0.2 -0.15 -0.1 -0.05 0 0.05 0.1 0.15 0.2 0 1020304050 Ti m e (s ec) Displacement (m ) ER-45 WA0 ER-45 WA90 -0.2 -0.15 -0.1 -0.05 0 0.05 0.1 0.15 0.2 0 1020304050 Ti m e (s ec) Displacement (m ) ER45 WA0 ER45 WA0 El Centro-X El Centro-Y -0.5 -0.4 -0.3 -0.2 -0.1 0 0.1 0.2 0.3 0.4 0.5 0 10203040 Tim e ( s ec) Displacement ( m ) ER45 W A0 E R45 WA90 -0.5 -0.4 -0.3 -0.2 -0.1 0 0.1 0.2 0.3 0 10203040 Ti m e (s ec) Displacement (m ) ER0 WA0 ER0 WA0 Tabas-X Tabas-Y (a) (b) (c) (d) Copyright © 2011 SciRes. OJMS 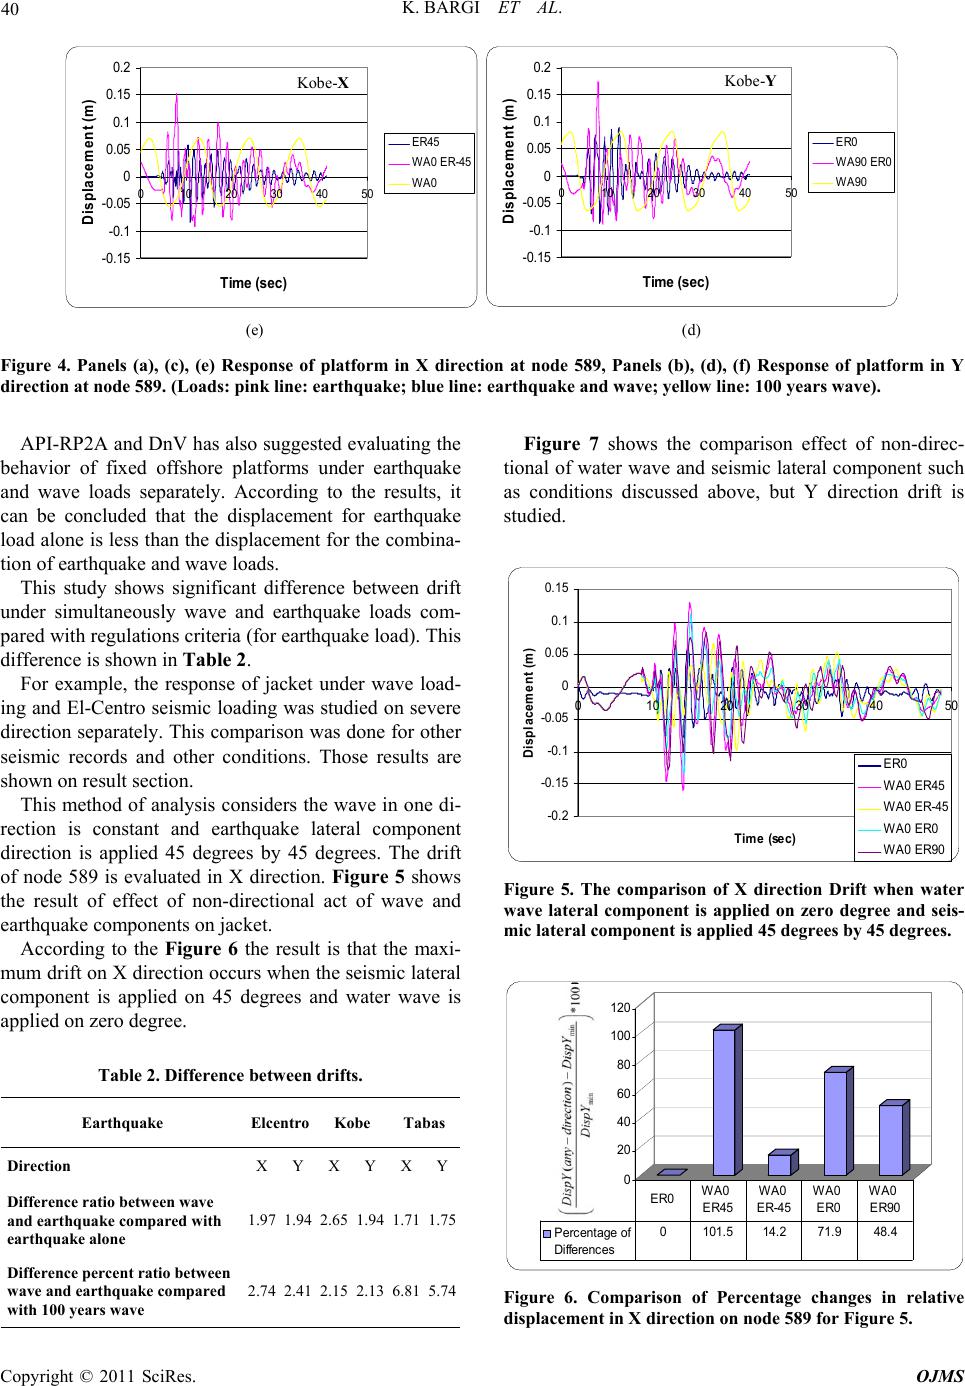 40 K. BARGI ET AL. -0.15 -0.1 -0.05 0 0.05 0.1 0.15 0.2 0 1020304050 Tim e (sec) Displacement (m) ER0 WA 90 ER0 WA90 -0.15 -0.1 -0.05 0 0.05 0.1 0.15 0.2 0 1020304050 Tim e ( sec) Displacement (m) ER45 WA0 ER-45 WA0 Kobe-X Kobe-Y (e) (d) Figure 4. Panels (a), (c), (e) Response of platform in X direction at node 589, Panels (b), (d), (f) Response of platform in Y direction at node 589. (Loads: pink line: earthquake; blue line: earthquake and wave; yellow line: 100 years wave). API-RP2A and DnV has also suggested evaluating the behavior of fixed offshore platforms under earthquake and wave loads separately. According to the results, it can be concluded that the displacement for earthquake load alone is less than the displacement for the combina- tion of earthquake and wave loads. This study shows significant difference between drift under simultaneously wave and earthquake loads com- pared with regulations criteria (for earthquake load). This difference is shown in Table 2. For example, the response of jacket under wave load- ing and El-Centro seismic loading was studied on severe direction separately. This comparison was done for other seismic records and other conditions. Those results are shown on result section. This method of analysis considers the wave in one di- rection is constant and earthquake lateral component direction is applied 45 degrees by 45 degrees. The drift of node 589 is evaluated in X direction. Figure 5 shows the result of effect of non-directional act of wave and earthquake components on jacket. According to the Figure 6 the result is that the maxi- mum drift on X direction occurs when the seismic lateral component is applied on 45 degrees and water wave is applied on zero degree. Table 2. Difference betw een drifts. TabasKobe Elcentro Earthquake YXY X Y X Direction 1.751.711.942.65 1.94 1.97 Difference ratio between wave and earthquake compared with earthquake alone 5.746.812.132.15 2.41 2.74 Difference percent ratio between wave and earthquake compared with 100 years wa v e Figure 7 shows the comparison effect of non-direc- tional of water wave and seismic lateral component such as conditions discussed above, but Y direction drift is studied. -0.2 -0.1 5 -0.1 -0.0 5 0 0.05 0.1 0.15 0 10203040 Tim e (sec) Disp lacemen t (m ) 50 ER0 WA 0 E R45 WA0 ER-45 WA0 ER0 WA 0 E R90 Figure 5. The comparison of X direction Drift when water wave lateral component is applied on zero degree and seis- mic lateral comp onent is applied 45 degrees by 45 degrees. 0 20 40 60 80 100 120 P ercentage of Differences 0101.5 14.271.948.4 ER0 WA0 ER45WA0 ER-45 WA0 ER0 WA0 ER90 Figure 6. Comparison of Percentage changes in relative displacement in X direction on node 589 for Figure 5. Copyright © 2011 SciRes. OJMS  K. BARGI ET AL. 41 According to Figure 8 the result is that the maximum drift on Y direction occurs when the seismic lateral component is applied on –45 degrees and water wave is applied on zero degree. Figure 9 shows the comparison of non-directional ef- fect of water wave and seismic lateral component applied -0. 1 -0. 05 0 0.05 0.1 0.15 0.2 0.25 0.3 0 10203040 Time (sec) Displace ment (m) 50 ER0 W A 0 ER45 WA0 ER-45 WA0 ER0 W A 0 ER90 Figure 7. The comparison of Y direction Drift when the water wave lateral component is applied on zero degree and seismic lateral component is applied 45 degrees by 45 de- grees. 0 20 40 60 80 100 120 P ercentage of Differenc es 15.80107.4 44.563.3 ER0 WA0 ER45 WA0 ER-45 WA0 ER0 WA0 ER90 Figure 8. Comparison of Percentage changes in relative displacement in Y direction on node 589 for Figure 7. -0.1 5 -0. 1 -0.0 5 0 0.05 0.1 0.15 0 102030405 Time (sec) Displacement (m) 0 W A45 ER0 WA0 ER0 W A-45 E R0 W A90 ER0 ER0 Figure 9. Comparison of drifts on X direction when seismic lateral is applied on zero degree and water wave direction changes 45 degrees by 45 degrees. simultaneously on jacket. In this case the direction of seismic lateral component is constant on zero degree and water wave direction changes 45 degrees by 45 degrees. Drifts are compared in X direction for node 589. Figure 10 shows that maximum drift on X direction when the seismic lateral component is applied in zero degree and water wave is applied in 45 degrees. The same comparison for drift in Y direction for node 589 is given below. Figure 12 shows that maximum drift on Y direction when the seismic lateral component is applied in zero degree and water wave is applied in 45 degrees. 5. Conclusions The nonlinear dynamic behavior of Jacket-type platform under simultaneously acting of wave and earthquake loads was studied in this paper. The following results are obtained. At first, the earthquake loads were applied alone at four different directions (Figure 3). Then wave and lon- gitudinal component of earthquake were applied simul taneously in the same and different four directions (Fig- ure 3). 0 10 20 30 40 50 60 70 80 P ercen t age of Differences 064.2 74.271.9 73.5 ER0 WA90 ER0 WA-45 ER0 WA0 ER0 WA45 ER0 Figure 10. Comparison of Percentage changes in relative displacement in X direction on node 589 for Figure 9. -0.1 -0.05 0 0.05 0.1 0.15 0.2 0.25 0 102030405 Time (sec) Displacement (m) 0 WA45 ER0 WA0 ER0 WA-45 ER0 WA90 ER0 ER0 Figure 11. Comparison of drifts on Y direction when seis- mic lateral is applied on zero degree and water wave direc- tion changes 45 degrees by 45 degrees. Copyright © 2011 SciRes. OJMS  K. BARGI ET AL. Copyright © 2011 SciRes. OJMS 42 0 5 10 15 20 25 30 35 40 P erc entage of Differenc es 035.9 23.824.8 38.6 ER0WA90 ER0 WA-45 ER0 WA0 ER0 WA45 ER0 Figure 12. Comparison of Percentage changes in relative displacement in Y direction on node 589 for Figure 11. The results comparison shows that the maximum dis- placement response of platform under combination of two loads (earthquake and wave loads) are more than maximum displacement response of earthquake load alone. 6. References [1] API Recommended Practice 2A-WSD, “Recommended Practice for Planning, Designing and Constructing Fixed Offshore Platform-Working Stress Design,” 20th Edition, Official Publication, US, 1996. [2] Det Norske Veritas (DNV) “Result for the Design, Con- struction and Inspection of Offshore Structures,” Oslo, 1977. (Reprint with correction 1981). http://www.dnv.com [3] A. K. Jain, “Dynamics of Offshore Structures under Sea Waves and Earthquake Forces,” American Society of Mechanical Engineers, Offshore Technology, Vol. 1, 1996, pp. 191-198. [4] D. Y. Jin and T. Matsui, “Stichastic Response Analysis of Jacket-Type Ocean Platforms under Simultaneously Act- ing Waves and Earthquakes,” American Society of Me- chanical Engineers, Safety and Reliability, Vol. 2, 1997, pp. 297-302. [5] “P0144: Earthquake and Station Details,” 1978. http://peer.berkeley.edu/svbin/Detail?id=P014 [6] “P0006: Earthquake and Station Details,” 1940. http://peer.berkeley.edu/svbin/Detail?id=P0006 [7] “P1046: Earthquake and Station Details,” 1995. http://peer.berkeley.edu/svbin/Detail?id=P1046 [8] ESDEP WG 15A, “Lecture 15A.1: Offshore Structure: General Introduction,” University of Ljubljana, Ljubljana, 2003. |