 American Journal of Anal yt ical Chemistry, 2011, 2, 332-343 doi:10.4236/ajac.2011.23042 Published Online July 2011 (http://www.scirp.org/journal/ajac) Copyright © 2011 SciRes. AJAC Determination of Fenofibrate and the Degradation Product Using Simultaneous UV-Derivative Spectrometric Method and HPLC Fathy M. M. Salama1, Mohamed W. I. Nassar1, Mohie M. K. Sharaf El-Din2, Khalid A. M. Attia1, Mohamed Yousri Kaddah3* 1Department of Analytical Chemistry, College of Pharmacy, Al-Azhar University, Cairo, Egypt 2Department of Analytical Chemistry, College of Pharmacy, Mansoura University, Mansoura, Egypt 3Department of Pharmaceutical Chemistry, College of Pharmacy, King Khalid University, Abha, Saudi Arabia E-mail: mmkaddah19732004@yahoo.com Received November 25, 2010; revised March 30, 2011; accepted May 16, 2011 Abstract Two new selective, precise, and accurate methods were developed for the determination of fenofibrate in the presence of its basic degradation product. In the first method fenofibrate was determined using an algorithm bivariate calibration derivative method, in which an optimum pair of wavelengths was chosen for the deter- mination of different binary mixtures. In the second method (HPLC), separation was achieved on RESTEK Pinnacle II phenyl column (5 µm, 250 × 4.6 mm) and Pinnacle II phenyl (5 µm, 10 × 4 mm) guard cartridge using a mobile phase consisting of methanol –0.1% phosphoric acid (60:40, v/v) at a flow rate 2 mL·min–1, and the column oven temperature was set at 50˚C. The UV detector was time programmed at 302 nm and 289 nm for the internal standard (I.S.) and fenofibrate, respectively. The proposed methods were successfully applied for the determination of fenofibrate and its degradation product in the laboratory-prepared mixture and in pharmaceutical formulation. The assay results obtained using the bivariate method were statistically compared to those of the HPLC method and good agreement was observed. Keywords: Fenofibrate, Stability, Degradation Product, UV Derivative Spectrometric Method, HPLC 1. Introduction Fenofibrate, 1-methylethyl 2-[4-(4-chlorobenzoyl) phe- noxy]-2-methylpropanoate, is used as antihyperlipidemic drug [1]. Fenofibrate activates lipoprotein lipase, which reduces triglycerides and increases HDL cholesterol. It exerts a variable but generally modest LDL cholesterol- lowering effect [2]. Different methods for analysis of fenofibrate have been reviewed. Fenofibrate was assayed in British Phar- macopeia (BP) by a liquid chromatography method [1]. However, several chromatographic methods have been Fenofibrate reported for the determination of fenofibrate, in pharma- ceutical formulations and or in biological fluids, includ- ing HPLC [3-11], stability indicating HPLC method for simultaneous determination of fenofibrate with other drugs from their combination products [12,13], LC-MS [14-17], and capillary electrophoresis [18,19]. In addition, there are other methods reported for the determination of fenofibrate, including voltammetry, polarography [20,21], and derivative spectrophotometry [22]. To the best of our knowledge, none of the reported procedures describe stability-indicating method for the determination of fenofibrate using an algorithm bivariate calibration derivative method. For HPLC method; the most considerable difference of the proposed method in comparison to the reported stability indicating HPLC methods [21,22], is the addition of I.S, which reduces the expected analytical errors and improve the accuracy, precision, and robustness. The present work aims to develop simple, selective, 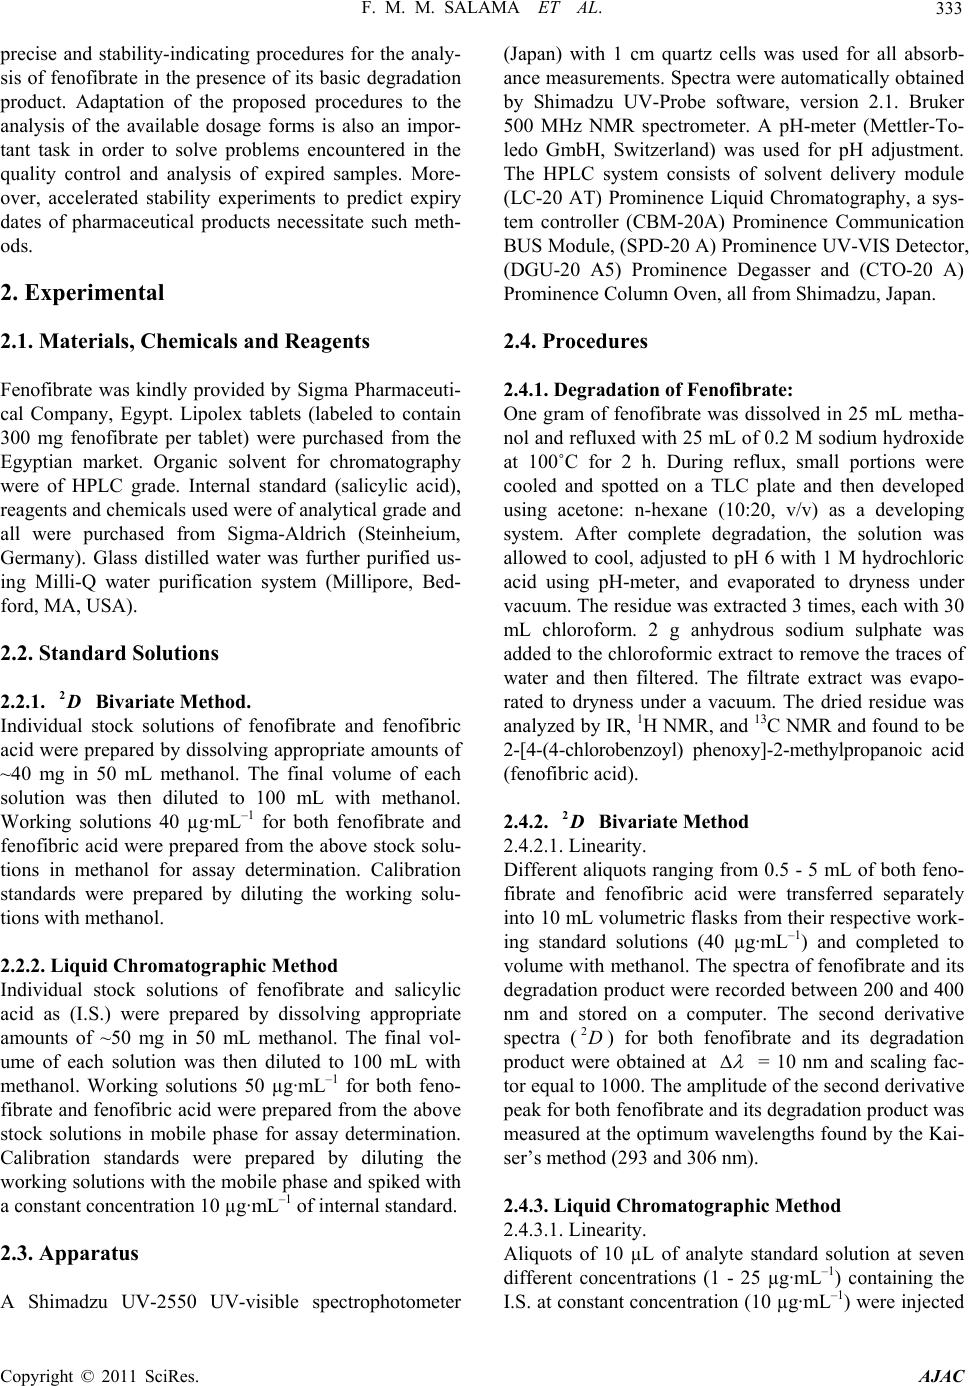 F. M. M. SALAMA ET AL. 333 2D precise and stability-indicating procedures for the analy- sis of fenofibrate in the presence of its basic degradation product. Adaptation of the proposed procedures to the analysis of the available dosage forms is also an impor- tant task in order to solve problems encountered in the quality control and analysis of expired samples. More- over, accelerated stability experiments to predict expiry dates of pharmaceutical products necessitate such meth- ods. 2. Experimental 2.1. Materials, Chemicals and Reagents Fenofibrate was kindly provided by Sigma Pharmaceuti- cal Company, Egypt. Lipolex tablets (labeled to contain 300 mg fenofibrate per tablet) were purchased from the Egyptian market. Organic solvent for chromatography were of HPLC grade. Internal standard (salicylic acid), reagents and chemicals used were of analytical grade and all were purchased from Sigma-Aldrich (Steinheium, Germany). Glass distilled water was further purified us- ing Milli-Q water purification system (Millipore, Bed- ford, MA, USA). 2.2. Standard Solutions 2.2.1. Bivariate Method. Individual stock solutions of fenofibrate and fenofibric acid were prepared by dissolving appropriate amounts of ~40 mg in 50 mL methanol. The final volume of each solution was then diluted to 100 mL with methanol. Working solutions 40 µg·mL–1 for both fenofibrate and fenofibric acid were prepared from the above stock solu- tions in methanol for assay determination. Calibration standards were prepared by diluting the working solu- tions with methanol. 2.2.2. Liquid Chromatographic Method Individual stock solutions of fenofibrate and salicylic acid as (I.S.) were prepared by dissolving appropriate amounts of ~50 mg in 50 mL methanol. The final vol- ume of each solution was then diluted to 100 mL with methanol. Working solutions 50 µg·mL–1 for both feno- fibrate and fenofibric acid were prepared from the above stock solutions in mobile phase for assay determination. Calibration standards were prepared by diluting the working solutions with the mobile phase and spiked with a constant concentration 10 µg·mL–1 of internal standard. 2.3. Apparatus A Shimadzu UV-2550 UV-visible spectrophotometer (Japan) with 1 cm quartz cells was used for all absorb- ance measurements. Spectra were automatically obtained by Shimadzu UV-Probe software, version 2.1. Bruker 500 MHz NMR spectrometer. A pH-meter (Mettler-To- ledo GmbH, Switzerland) was used for pH adjustment. The HPLC system consists of solvent delivery module (LC-20 AT) Prominence Liquid Chromatography, a sys- tem controller (CBM-20A) Prominence Communication BUS Module, (SPD-20 A) Prominence UV-VIS Detector, (DGU-20 A5) Prominence Degasser and (CTO-20 A) Prominence Column Oven, all from Shimadzu, Japan. 2.4. Procedures 2.4.1. Degradation of Fenofibrate: One gram of fenofibrate was dissolved in 25 mL metha- nol and refluxed with 25 mL of 0.2 M sodium hydroxide at 100˚C for 2 h. During reflux, small portions were cooled and spotted on a TLC plate and then developed using acetone: n-hexane (10:20, v/v) as a developing system. After complete degradation, the solution was allowed to cool, adjusted to pH 6 with 1 M hydrochloric acid using pH-meter, and evaporated to dryness under vacuum. The residue was extracted 3 times, each with 30 mL chloroform. 2 g anhydrous sodium sulphate was added to the chloroformic extract to remove the traces of water and then filtered. The filtrate extract was evapo- rated to dryness under a vacuum. The dried residue was analyzed by IR, 1H NMR, and 13C NMR and found to be 2-[4-(4-chlorobenzoyl) phenoxy]-2-methylpropanoic acid (fenofibric acid). 2.4.2. Bivariate Method 2D 2.4.2.1. Linearity. Different aliquots ranging from 0.5 - 5 mL of both feno- fibrate and fenofibric acid were transferred separately into 10 mL volumetric flasks from their respective work- ing standard solutions (40 µg·mL–1) and completed to volume with methanol. The spectra of fenofibrate and its degradation product were recorded between 200 and 400 nm and stored on a computer. The second derivative spectra () for both fenofibrate and its degradation product were obtained at 2D = 10 nm and scaling fac- tor equal to 1000. The amplitude of the second derivative peak for both fenofibrate and its degradation product was measured at the optimum wavelengths found by the Kai- ser’s method (293 and 306 nm). 2.4.3. Liquid Chromatographic Method 2.4.3.1. Linearity. Aliquots of 10 µL of analyte standard solution at seven different concentrations (1 - 25 µg·mL–1) containing the I.S. at constant concentration (10 µg·mL–1) were injected Copyright © 2011 SciRes. AJAC  F. M. M. SALAMA ET AL. 334 into the HPLC system. The procedure was carried out in triplicate for each concentration. The analyte/I.S. peak area ratios obtained (dimensionless numbers) were plot- ted against the corresponding concentration of the ana- lyte (expressed as µg·mL–1). The detector was time pro- grammed to be set at 302 nm for 3 minutes from the be- ginning of the run time for detection of I.S. then ex- changed to 289 nm for detection of fenofibrate. Chro- matographic separation was achieved using RESTEK Pinnacle II phenyl column (5 µm, 250 × 4.6 mm) and Pinnacle II phenyl (5 µm, 10 × 4 mm) guard cartridge using a mobile phase consisting of methanol –0.1% phosphoric acid (60:40, v/v), and the column oven tem- perature was set at 50˚С. Mobile phase was filtered through a 0.45 µm nylon membrane filter, degassed and pumped at a flow rate 2 mL·min–1. 2.4.4. Analysis of Laboratory Prepared Mixtures Containing Different Ratios from Fenofibrate and its Degradation Product. 2.4.4.1. Bivariate method. 2D Aliquot portions equivalent to 18 - 2 µg mL–1 of fenofi- brate were transferred into a series of 10 mL volumetric flask containing 2 - 18 µg·mL–1 of fenofibrate degrada- Figure 1. The FTIR spectra of (a) Fenofibrate (b) Degrada- tion product. tion product and diluted to the volume by methanol. Continue as under linearity (section 2.4.2.1.) 2.4.4.2. Liquid Chromatographic Method. Aliquot portions equivalent to 20 - 2.5 µg·mL–1 of feno- fibrate and its basic degradation products of 5 - 22.5 µg·mL–1 containing salicylic acid (as I.S.) at constant concentration (10 µg·mL–1) were transferred into a series of 10 mL volumetric flasks. Ten µL of the prepared mixtures were injected into HPLC under the adopted operating conditions (section 2.4.3.1.). 2.4.5. Analysis of Fenofibrate in Lipolex Capsules. The powder of 10 Lipolex capsules, after unpacking, was weighed. An amount of powdered mass equivalent to 40 mg or 50 mg of fenofibrate was weighed and transferred to 50 mL conical flask, the drug from powder was dis- solved and extracted with methanol. The extract was filtered, and residue was washed with methanol. The extract and washing were pooled and transferred to a 100 mL volumetric flask and volume was made with metha- nol. Working solutions 40 µg·mL–1 or 50 µg·mL–1 were prepared in methanol by appropriate dilution and sub- jected to analysis as mentioned under (section 2.4.2.1 & 2.4.3.1) 3. Results and Discussion 3.1. Identification of the Degradation Product Identification was made by scanning the FTIR spectra on KBr discs and NMR spectra in deutrated chloroform for both fenofibrate and its degradation product. The FTIR spectrum of pure fenofibrate (Figure 1(a)) shows two absorption peaks at 1728 and 1651 cm–1 which indicates the presence of two carbonyl frequencies of ester and ketone, respectively. The ester peak is con- firmed by its characteristic absorption at 1178 and 1246 cm–1. The appearance of the absorption peaks at 2800 - 3400 cm–1 are associated with carbon-hydrogen (C–H) stretching vibrations. On the other hand, the FTIR of degraded fenofibrate (Figure 1(b)) shows broad absorp- tion band at 3000 - 2500 cm–1 which indicates hydrogen bonded (O–H) of a carboxylic acid dimer. Peaks at 1664 and 1305 cm–1 are also indicative of this group and peak corresponding to ketone functional group is shifted to 1643 cm–1. Moreover, there is a complete disappearance of the ester peak at 1728 cm-1 and disappearance of some peaks of (C-H) stretching which indicating the removal of isopropyl moiety. 1H NMR spectrum of fenofibrate in (Figure 2(a)) shows doublet at 1.21 of the six protons of the two ethyl groups of [–O–CH–(CHm3)2], singlet at δ 1.68 of Copyright © 2011 SciRes. AJAC  F. M. M. SALAMA ET AL. Copyright © 2011 SciRes. AJAC 335 (a) (b) Figure 2. 1H NMR spectra of (a) Fenofibrate (b) Degradation product.  F. M. M. SALAMA ET AL. 336 (a) (b) Figure 3. 13C NMR spectra of (a) Fenofibrate (b) Degradation product. Copyright © 2011 SciRes. AJAC  F. M. M. SALAMA ET AL. Copyright © 2011 SciRes. AJAC 337 For the selection of the two most appropriate wave- lengths with respect to their sensitivity for the simulta- neous determination of the substances, we applied Kai- ser’s [28-30] method, which consists of resolving the determinant from the so called selectivity matrix, K. Scheme 1. The degradation pathway of fenofibrate. 11 22 AB AB K the six protons of the two methyl group of [O=C– C(CH3)2–O–] and multiplet at 5.08 - 5.13 of the me- thine proton [–O–CH–(CH3)2]. In addition to the pres- ence of a doublet aromatic protons at 6.87 - 6.89, 7.45 - 7.47 and 7.70 - 7.76. While 1H NMR spec- trum of degraded fenofibrate in (Figure 2(b)) shows a complete disappearance of a doublet and multiplet sig- nals at 1.21 and 5.08 - 5.13, respectively. This gives an evidence of the removal of the isopropyl moi- ety. where 1 , 2 represent the sensitivity parameters of component A at the two selected wavelengths (1 , 2 ) and 1 , 2 , correspond to the sensitivity parameters of component B, in this case considered as calibration curve slopes for each component at two given wave- lengths. 13C NMR spectra of fenofibrate and its degraded prod- ucts in (Figures 3(a) & 3(b)) show identical carbon peaks except in the degraded product there is a complete disappearance of carbon peaks at δ 21.52 and at 69.34 corresponding to the aliphatic carbon of the two methyl groups of [–O–CH–(CH3)2] and the methine carbon of [–O–CH–(CH3)2], respectively. And this is considered as a further confirmation of the removal of the isopropyl moiety. The degradation pathway is illustrated in Scheme 1. 3.2. Bivariate Method The resolution of two components by the bivariate cali- bration has been recently proposed [23-27]. The concen- tration of two components A and B in a mixture can be determined according to Lambert-Beer’s law, through a system of four calibration curves: that is, using the sec- ond two derivative spectra calibration curves for each component at two different wavelengths: 222 11111 1 int ABABAA BBAB DDD CC 222 intDDD CC 1 2 22222 2ABABAABBAB where 1 , 2 and 1 , 2 represent the calibra- tion curve slope values of the second derivative spectra, C and C the concentration of components A and B, respectively and 1 int B, 2 int B represent the sum of the intercept of the calibration curves of the two components at the two given wavelengths. The solution of this algo- rithm system of equations allows the determination of C and C as follows: Equation 1: 2 211 122 21 12 (((int)((int)) AABABA ABAB B AB AB D C 2 D The “bivariate calibration method” was applied to the second derivative spectrum for the resolution of the bi- nary mixture of fenofibrate and its degradation product (Figure 4(a)). The main advantage of the derivative method is the presence of a large number of maxima and minima, which in turn, provides an opportunity for the determination of active compounds in the presence of other degradation products, which possibly interfere with the analysis. Moreover, in the zero order and first order “bivariate calibration method” a particular case arises when one or both of the analytes present broad or flat bands with no well-defined maximum (Figures 4(b) & 4(c)). In such cases similar consecutive results are ex- pected within the range of wavelengths of the band [31]. For these reasons, the spectra for fenofibrate and its degradation product standard solutions were selected. The effect of pH on the absorbance of fenofibrate and its degradation product was studied by using phosphate buffer of different pH, as shown in (Figure 4(d)) neither absorbance nor 2D maxima affected significantly by pH changes. The optimization of the derivative spectra was achieved at = 10 and scaling factor of 1000. In or- der to apply the “derivative bivariate calibration method” for the resolution of the binary mixture fenofibrate and its degradation product, the signals of all standard solu- tions at nine located wavelengths were obtained. The correlation data of their calibration curves are presented in (Table 1). According to Kaiser’s method the slope values from these regression lines represent the sensitiv- ity values for each component. The sensitivity value for each wavelength pair was defined (Table 2) by resolving the determinants of the selectivity matrices K proposed by this method. In order to resolve the respective deter- minants, it is suggested that the value of the slope should be kept (including its sign (±), which is obtained from the calibration curve). It is worth mentioning that, for the model proposed, it is necessary for the calibration curves of the two components to comply with Lambert-Beer’s aw at each wavelength, giving a straight line. Otherwise Equation 2: 2 111 1 int BABB A A DC C B l  F. M. M. SALAMA ET AL. Copyright © 2011 SciRes. AJAC 338 (a) (b) (c) (d) Figure 4. UV-spectra of (a) Zero-order spectra of 10 µg·mL–1 fenofibrate (······), 10 µg·mL–1 degradation product (―), and their mixture (·-·-·-). (b) First-derivative spectra of fenofibrate (······), degradation product (―), and their mixture (·-·-·-). (c) second-derivative spectra of fenofibrate (······), degradation product (―), and their mixture (·-·-·-). (d) Effect of pH on the absorbance of fenofibrate and its basic degradation at pH 4.0 (······), pH 7.0 (―), pH 9.0 (·-·-·-). Table 1. Correlation data of calibration curves to 2D spectrum obtained for the fenofibrate and its degradation product, at the selected wavelengths and considered as sensitivity parameters in Kaiser’s matrix. Fenofibrate Degradation product nm Slope Intercept Correlation coefficient Slope Intercept Correlation coefficient 289 –0.107 0.025 0.999 –0.0470.027 0.999 291 –0.112 0.045 0.999 –0.0680.051 0.999 293 –0.112 0.06 0.999 –0.0880.069 0.999 298 –0.08 0.067 0.999 –0.1250.088 0.999 302 –0.032 0.045 0.999 –0.1290.075 0.999 306 0.021 0.019 0.999 –0.1040.048 0.999 308 0.045 0.011 0.998 –0.0820.037 0.999 318 0.08 0.003 0.999 0.04 –0.006 0.999 320 0.074 –0.001 0.999 0.054 –0.009 0.999 there will be a great error in determination, as it will not be possible, the contribution of one of the components (to the mixture) to be assessed adequately. In the present investigation, all the calibration curves show a satisfac- tory linear regression coefficient (>0.999). According to the results, the wavelength pairs with the highest abso- lute sensitivity values were 293 and 306 nm. By using the correlation data of the above wavelength pairs and the two Equations 1 and 2, the recoveries of synthetic mixtures were calculated (Table 3).  F. M. M. SALAMA ET AL. 339 Table 2. Values of the selectivity matrix determinants cal- culated according to Kaiser’s method (K × 106) for the mix- ture of fenofibrate and its degradation product. nm 289 291 293 298302 306 308 318320 289 0 2012 4152 961512299 12115 10889 –520–2300 291 0 2240 856012272 13076 12244 960–1016 293 0 696011632 13496 13144 2560464 298 0 6320 10945 12185 68004930 302 0 6037 8429 90407818 306 0 2958 91608830 308 0 83608498 318 01360 320 0 3.3. Liquid Chromatographic Method In order to affect the simultaneous analysis of the two component peaks under isocratic conditions, the mixtures of methanol or acetonitrile with a buffer or 0.1% phos- phoric acid in different combinations were assayed as the mobile phase using phenyl packing a stationary phase. A binary mixture of methanol –0.1% phosphoric acid (60: 40, v/v) proved to be better than the mixture of acetone- trile-buffer for the separation since the chromatographic peaks were better defined and resolved, and free from tailing. Among several flow rates tested (0.5 - 2.5 mL·min –1), the flow rate of 2 mL·min–1 was the best with respect to location and resolution of analytical peaks. The temperature was examined in the range of 30˚С to 60˚С using methanol (50 - 65%, v/v) –0.1% phosphoric acid (50 - 35%, v/v) as a mobile phase. A combination of temperature (50˚С) and methanol (60%) gave a good separation for all of the components. Resolution and separation factors for this system were found 34.71 and 4.22, respectively. Tailing factor and the number of theoretical plates were 1.02 and 11603, respectively. The above described chromatographic conditions al- low a resolution between I.S. and fenofibrate in a rea- sonable time of 2.047 and 10.787 min, respectively. The chromatogram of the standard solution containing feno- fibrate and the I.S. is reported in (Figure 5(a)). As can be seen, the peaks are neat, symmetric and well separated and the wavelength changes do not distort in any way the baseline appearance. Degradation product obtained with forced the degradation condition is showen in (Figure 5(b)). The chromatogram of the degradation product showing that peaks of fenofibrate and I.S. were free of interference of the degradation product. Effects of small deliberate changes in the ionic strength of the mobile Table 3. Determination of fenofibrate in laboratory prepared mixtures by the proposed methods. Concentration taken (μg·ml–1) Percentage Recovery (% ) Method Fenofibrate Degradation productFenofibrate Degradation product Fenofibrate 1- Bivariate method Mix. 1 18 2 90 10 101.88 Mix. 2 16 4 80 20 101.71 Mix. 3 14 6 70 30 101.65 Mix. 4 12 8 60 40 102.34 Mix. 5 11 9 55 45 102.66 Mix. 6 10 10 50 50 101.59 Mix. 7 8 12 40 60 101.2 Mix. 8 6 14 30 70 101.52 Mix. 9 4 16 20 80 99.95 Mix. 10 2 18 10 90 101.83 Mean ± S.D. 101.63 ± 0.72 N 10 S.D. 0.72 RSD (%) 0.22 2- HPLC method Mix. 1 20 5 80 20 101.50 Mix. 2 15 10 60 40 99.14 Mix. 3 10 15 40 60 100.87 Mix. 4 5 20 20 80 102.47 Mix. 5 2.5 22.5 10 90 102.53 Mean ± S.D. 101.30 ± 1.25 N 5 S.D. 1.25 RSD (%) 0.55 Each result is the average of three separate determination Copyright © 2011 SciRes. AJAC  F. M. M. SALAMA ET AL. Copyright © 2011 SciRes. AJAC 340 Figure 5. The representative chromatograms of: (a) 10 µl injection of 15 µg·mL–1 fenofibrate and 10 µg·mL–1 of I.S, (b) 10 µl injection of laboratory-prepared mixture containing 20 µg·mL–1 fenofibrate, 5 µg·mL–1 basic degradation of fenofibrate, and 10 µg·mL–1 I.S. Table 4. Analytical parameters of the proposed methods. Bivariate method Parameters 293 nm 306 nm HPLC method Linearity range (µg·mL–1) 2 - 20 2 - 20 1 - 25 Limit of detection (µg·mL–1) 0.11 0.18 0.11 Limit of quantification (µg·mL–1) 0.32 0.55 0.36 Regression equation(a) Slope (b) –0.112 0.064 0.336 Intercept (a) 0.045 0.007 –0.080 Correlation coefficient (r) 0.999 0.999 0.999 Sy/x 0.0083 0.0026 0.11 Sa 0.0036 0.0012 0.013 Sb 0.0635 0.0124 0.0015 (a)y = a + xb where y is the amplitude of the second derivative peak in case of bivariate method or the analyte/I.S. peak area ratios in case o HPLC method; x is the concentration; Sy/x is the standard deviation o the residuals; Sa is the standard deviation of the intercept; Sbis the standard deviation of the slope phase, pH, percentage of organic phase, flow rate and wavelength detection were evaluated as a part of testing for method robustness. 3.4. Validation of the Method 3.4.1. Linearity, LOD and LOQ Satisfactory linearity (r > 0.999) was obtained for feno- fibrate over the concentration range 2 - 20 µg·mL–1 in Table 5. Precision and accuracy results of the validation. Bivariate method HPLC method Known concen- tration (µg·mL–1) Recovery (%) Known concen- tration (µg·mL–1) Recovery (%) Intra-day Intra-day 8 99.11 5 101.28 12 99.40 10 99.65 16 99.72 15 99.66 Mean ± S.D. 99.41 ± 0.31 100.20 ± 0.94 N 3 3 S.D. 0.31 0.94 RSD (%) 0.18 0.54 Inter-day Inter-day 8 99.03 5 101.89 12 99.83 10 99.76 16 99.99 15 100.39 Mean ± S.D. 99.62 ± 0.51 100.68 ± 1.10 N 3 9 S.D. 0.51 1.10 RSD (%) 0.30 0.63 Each result is the average of three separate determination Table 6. Tablet recovery by the proposed methods. Bivariate method HPLC method Method Known concen- tration (µg·mL–1) Recovery (%) Known concen- tration (µg·mL–1) Recovery (%) 8 98.33 5 101.76 12 98.32 10 100.57 16 98.36 15 99.96 Mean ± S.D. 98.34 ± 0.02 100.76 ± 0.91 N 3 3 S.D. 0.02 0.91 RSD (%) 0.01 0.52 Each result is the average of three separate determination case of bivariate method, and 1 - 25 µg·mL–1 for the HPLC method. The analytical parameters of the pro- posed methods are summarized in (Table 4). The detec- tion limit and the quantification limit were calculated using the following equation [32]: ; SD DL QLb where F: factor of 3.3 and 10 for DL and QL, respect- tively. SD: standard deviation of the intercept and b: slope of the regression line. The estimated limits were verified by analyzing a suitable number of samples con- taining the analyte at the corresponding concentrations. 3.4.2. Precision and Accuracy Precision was evaluated at three different concentrations 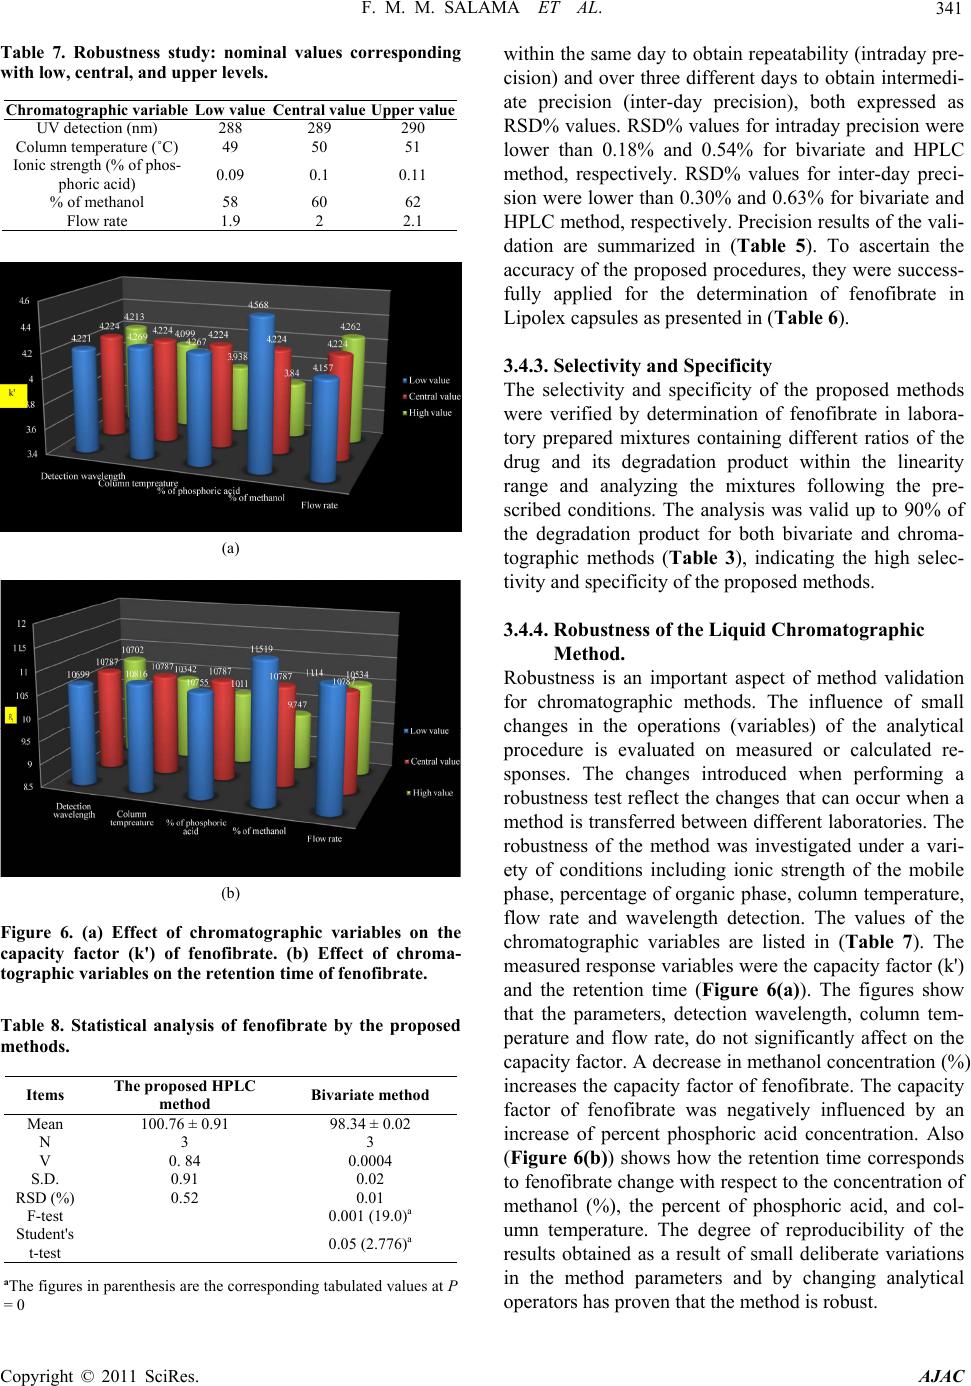 F. M. M. SALAMA ET AL. 341 Table 7. Robustness study: nominal values corresponding with low, central, and upper levels. Chromatographic variable Low value Central value Upper value UV detection (nm) 288 289 290 Column temperature (˚C) 49 50 51 Ionic strength (% of phos- phoric acid) 0.09 0.1 0.11 % of methanol 58 60 62 Flow rate 1.9 2 2.1 (a) (b) Figure 6. (a) Effect of chromatographic variables on the capacity factor (k') of fenofibrate. (b) Effect of chroma- tographic variables on the retention time of fenofibrate. Table 8. Statistical analysis of fenofibrate by the proposed methods. Items The proposed HPLC method Bivariate method Mean 100.76 ± 0.91 98.34 ± 0.02 N 3 3 V 0. 84 0.0004 S.D. 0.91 0.02 RSD (%) 0.52 0.01 F-test 0.001 (19.0)a Student's t-test 0.05 (2.776)a aThe figures in parenthesis are the corresponding tabulated values at P = 0 within the same day to obtain repeatability (intraday pre- cision) and over three different days to obtain intermedi- ate precision (inter-day precision), both expressed as RSD% values. RSD% values for intraday precision were lower than 0.18% and 0.54% for bivariate and HPLC method, respectively. RSD% values for inter-day preci- sion were lower than 0.30% and 0.63% for bivariate and HPLC method, respectively. Precision results of the vali- dation are summarized in (Table 5). To ascertain the accuracy of the proposed procedures, they were success- fully applied for the determination of fenofibrate in Lipolex capsules as presented in (Table 6). 3.4.3. Selectivity and Specificity The selectivity and specificity of the proposed methods were verified by determination of fenofibrate in labora- tory prepared mixtures containing different ratios of the drug and its degradation product within the linearity range and analyzing the mixtures following the pre- scribed conditions. The analysis was valid up to 90% of the degradation product for both bivariate and chroma- tographic methods (Table 3), indicating the high selec- tivity and specificity of the proposed methods. 3.4.4. Robustness of the Liquid Chromatographic Method. Robustness is an important aspect of method validation for chromatographic methods. The influence of small changes in the operations (variables) of the analytical procedure is evaluated on measured or calculated re- sponses. The changes introduced when performing a robustness test reflect the changes that can occur when a method is transferred between different laboratories. The robustness of the method was investigated under a vari- ety of conditions including ionic strength of the mobile phase, percentage of organic phase, column temperature, flow rate and wavelength detection. The values of the chromatographic variables are listed in (Table 7). The measured response variables were the capacity factor (k') and the retention time (Figure 6(a)). The figures show that the parameters, detection wavelength, column tem- perature and flow rate, do not significantly affect on the capacity factor. A decrease in methanol concentration (%) increases the capacity factor of fenofibrate. The capacity factor of fenofibrate was negatively influenced by an increase of percent phosphoric acid concentration. Also (Figure 6(b)) shows how the retention time corresponds to fenofibrate change with respect to the concentration of methanol (%), the percent of phosphoric acid, and col- umn temperature. The degree of reproducibility of the results obtained as a result of small deliberate variations in the method parameters and by changing analytical operators has proven that the method is robust. Copyright © 2011 SciRes. AJAC 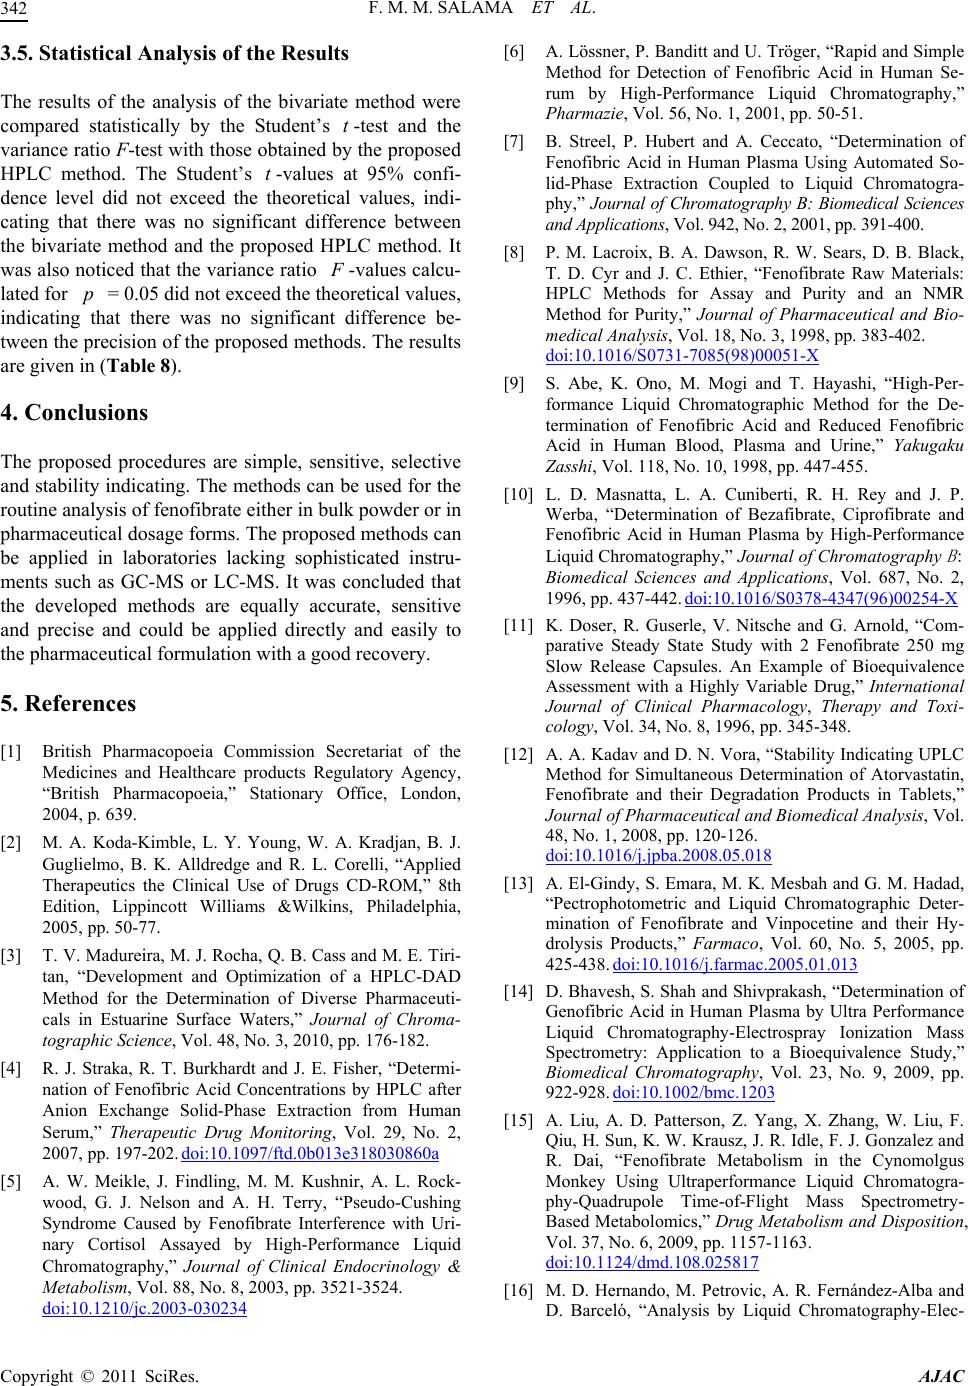 F. M. M. SALAMA ET AL. 342 3.5. Statistical Analysis of the Results The results of the analysis of the bivariate method were compared statistically by the Student’s t-test and the variance ratio F-test with those obtained by the proposed HPLC method. The Student’s -values at 95% confi- dence level did not exceed the theoretical values, indi- cating that there was no significant difference between the bivariate method and the proposed HPLC method. It was also noticed that the variance ratio t -values calcu- lated for = 0.05 did not exceed the theoretical values, indicating that there was no significant difference be- tween the precision of the proposed methods. The results are given in (Table 8). p 4. Conclusions The proposed procedures are simple, sensitive, selective and stability indicating. The methods can be used for the routine analysis of fenofibrate either in bulk powder or in pharmaceutical dosage forms. The proposed methods can be applied in laboratories lacking sophisticated instru- ments such as GC-MS or LC-MS. It was concluded that the developed methods are equally accurate, sensitive and precise and could be applied directly and easily to the pharmaceutical formulation with a good recovery. 5. References [1] British Pharmacopoeia Commission Secretariat of the Medicines and Healthcare products Regulatory Agency, “British Pharmacopoeia,” Stationary Office, London, 2004, p. 639. [2] M. A. Koda-Kimble, L. Y. Young, W. A. Kradjan, B. J. Guglielmo, B. K. Alldredge and R. L. Corelli, “Applied Therapeutics the Clinical Use of Drugs CD-ROM,” 8th Edition, Lippincott Williams &Wilkins, Philadelphia, 2005, pp. 50-77. [3] T. V. Madureira, M. J. Rocha, Q. B. Cass and M. E. Tiri- tan, “Development and Optimization of a HPLC-DAD Method for the Determination of Diverse Pharmaceuti- cals in Estuarine Surface Waters,” Journal of Chroma- tographic Science, Vol. 48, No. 3, 2010, pp. 176-182. [4] R. J. Straka, R. T. Burkhardt and J. E. Fisher, “Determi- nation of Fenofibric Acid Concentrations by HPLC after Anion Exchange Solid-Phase Extraction from Human Serum,” Therapeutic Drug Monitoring, Vol. 29, No. 2, 2007, pp. 197-202. doi:10.1097/ftd.0b013e318030860a [5] A. W. Meikle, J. Findling, M. M. Kushnir, A. L. Rock- wood, G. J. Nelson and A. H. Terry, “Pseudo-Cushing Syndrome Caused by Fenofibrate Interference with Uri- nary Cortisol Assayed by High-Performance Liquid Chromatography,” Journal of Clinical Endocrinology & Metabolism, Vol. 88, No. 8, 2003, pp. 3521-3524. doi:10.1210/jc.2003-030234 [6] A. Lössner, P. Banditt and U. Tröger, “Rapid and Simple Method for Detection of Fenofibric Acid in Human Se- rum by High-Performance Liquid Chromatography,” Pharmazie, Vol. 56, No. 1, 2001, pp. 50-51. [7] B. Streel, P. Hubert and A. Ceccato, “Determination of Fenofibric Acid in Human Plasma Using Automated So- lid-Phase Extraction Coupled to Liquid Chromatogra- phy,” Journal of Chromatography B: Biomedical Sciences and Applications, Vol. 942, No. 2, 2001, pp. 391-400. [8] P. M. Lacroix, B. A. Dawson, R. W. Sears, D. B. Black, T. D. Cyr and J. C. Ethier, “Fenofibrate Raw Materials: HPLC Methods for Assay and Purity and an NMR Method for Purity,” Journal of Pharmaceutical and Bio- medical Analysis, Vol. 18, No. 3, 1998, pp. 383-402. doi:10.1016/S0731-7085(98)00051-X [9] S. Abe, K. Ono, M. Mogi and T. Hayashi, “High-Per- formance Liquid Chromatographic Method for the De- termination of Fenofibric Acid and Reduced Fenofibric Acid in Human Blood, Plasma and Urine,” Yakugaku Zasshi, Vol. 118, No. 10, 1998, pp. 447-455. [10] L. D. Masnatta, L. A. Cuniberti, R. H. Rey and J. P. Werba, “Determination of Bezafibrate, Ciprofibrate and Fenofibric Acid in Human Plasma by High-Performance Liquid Chromatography,” Journal of Chromatography B : Biomedical Sciences and Applications, Vol. 687, No. 2, 1996, pp. 437-442. doi:10.1016/S0378-4347(96)00254-X [11] K. Doser, R. Guserle, V. Nitsche and G. Arnold, “Com- parative Steady State Study with 2 Fenofibrate 250 mg Slow Release Capsules. An Example of Bioequivalence Assessment with a Highly Variable Drug,” International Journal of Clinical Pharmacology, Therapy and Toxi- cology, Vol. 34, No. 8, 1996, pp. 345-348. [12] A. A. Kadav and D. N. Vora, “Stability Indicating UPLC Method for Simultaneous Determination of Atorvastatin, Fenofibrate and their Degradation Products in Tablets,” Journal of Pharmaceutical and Biomedical Analysis, Vol. 48, No. 1, 2008, pp. 120-126. doi:10.1016/j.jpba.2008.05.018 [13] A. El-Gindy, S. Emara, M. K. Mesbah and G. M. Hadad, “Pectrophotometric and Liquid Chromatographic Deter- mination of Fenofibrate and Vinpocetine and their Hy- drolysis Products,” Farmaco, Vol. 60, No. 5, 2005, pp. 425-438. doi:10.1016/j.farmac.2005.01.013 [14] D. Bhavesh, S. Shah and Shivprakash, “Determination of Genofibric Acid in Human Plasma by Ultra Performance Liquid Chromatography-Electrospray Ionization Mass Spectrometry: Application to a Bioequivalence Study,” Biomedical Chromatography, Vol. 23, No. 9, 2009, pp. 922-928. doi:10.1002/bmc.1203 [15] A. Liu, A. D. Patterson, Z. Yang, X. Zhang, W. Liu, F. Qiu, H. Sun, K. W. Krausz, J. R. Idle, F. J. Gonzalez and R. Dai, “Fenofibrate Metabolism in the Cynomolgus Monkey Using Ultraperformance Liquid Chromatogra- phy-Quadrupole Time-of-Flight Mass Spectrometry- Based Metabolomics,” Drug Metabolism and Disposition, Vol. 37, No. 6, 2009, pp. 1157-1163. doi:10.1124/dmd.108.025817 [16] M. D. Hernando, M. Petrovic, A. R. Fernández-Alba and D. Barceló, “Analysis by Liquid Chromatography-Elec- Copyright © 2011 SciRes. AJAC  F. M. M. SALAMA ET AL. Copyright © 2011 SciRes. AJAC 343 trospray Ionization Tandem Mass Spectrometry and Acute Toxicity Evaluation for Beta-Blockers and Lipid- Regulating Agents in Wastewater Samples,” Journal of Chromatography A, Vol. 1046, No. 1-2, 2004, pp. 133- 140. [17] P. Vazquez-Roig, R. Segarra, C. Blasco, V. Andreu and Y. Picó, “Determination of Pharmaceuticals in Soils and Sediments by Pressurized Liquid Extraction and Liquid Chromatography Tandem Mass Spectrometry,” Journal of Chromatography A, Vol. 1217, No. 16, 2010, pp. 2471 -2483. doi:10.1016/j.chroma.2009.11.033 [18] Ł. Komsta, G. Misztal, E. Majchrzak and A. Hauzer, “Separation of Fibrate-Type Antihyperlipidemic Drugs by Capillary Electrophoresis and their Quantitation in Pharmaceuticals,” Journal of Pharmaceutical and Bio- medical Analysis, Vol. 41, No. 2, 2010, pp. 408-414. doi:10.1016/j.jpba.2005.11.032 [19] Z. K. Shihabi, “Fenofibrate and Fenofibric Acid Analysis by Capillary Electrophoresis,” Electrophoresis, Vol. 25, No. 10-11, 2004, pp. 1648-1651. doi:10.1016/j.jpba.2005.11.032 [20] M. A. Korany, I. I. Hewala and K. M. Abdel-Hay, “De- termination of Etofibrate, Fenofibrate, and Atorvastatin in Pharmaceutical Preparations and Plasma Using Differen- tial Pulse Polarographic and Square Wave Voltammetric Techniques,” Journal of AOAC (Association of Official Agricultural Chemists) International, Vol. 91, No. 5, 2008, pp. 1051-1058. [21] C. Yardimci and N. Ozaltin, “Electrochemical Studies and Square-Wave Voltammetric Determination of Feno- fibrate in Pharmaceutical Formulations,” Analytical and Bioanalytical Chemistry, Vol. 378, No. 2, 2004, pp. 495- 498. doi:10.1007/s00216-003-2246-x [22] Nagaraj, K. Vipul and M. Rajshree, “Simultaneous Quan- titative Resolution of Atorvastatin Calcium and Fenofi- brate in Pharmaceutical Preparation by Using Derivative ratio Spectrophotometry and Chemometric Calibrations,” Analytical Sciences, Vol. 23, No. 4, 2007, pp. 445-451. doi:10.2116/analsci.23.445 [23] P. L. Lopez-de-Alba, L. Lopez-Martinez, K. Wrobel- Kaczmarczyk, K. Wrobel-Zasada, J. Amador-Hernandez and M. L. Yepez-Murrieta, “Application of the Bivariate Spectrophotometric Method for the Determination of Metronidazole, Furazolidone and Di-Iodohydroxyqui- noline in Pharmaceutical Formulations,” Journal of Phar- maceutical and Biomedical Analysis, Vol. 16, No. 2, 1997, pp. 349-355. doi:10.1016/S0731-7085(97)00068-X [24] L. Lopez-Martinez, P. L. Lopez-de-Alba and V. Cedra- Martin, “Bivariate Calibration as an Alternative for Zero- Crossing Technique in the Resolution of Binary Mixtures by Dderivative Spectrophotometry,” Analytical Letters, Vol. 34, No. 14, 2004, pp. 2563-2583. doi:10.1016/S0731-7085(97)00068-X [25] C. K. Markopoulou, E. T. Malliou and J. E. Koundourel- lis, “Chemometric and Derivative Methods as Flexible Spectrophotometric Approaches for Dissolution and As- Saying Tests in Multicomponent Tablets,” Farmaco, Vol. 59, No. 8, 2004, pp. 627-636. doi:10.1016/j.farmac.2004.02.006 [26] F. H. Metwally, “Simultaneous Determination of Nifu- roxazide and Drotaverine Hydrochloride in Pharmaceuti- cal Preparations by Bivariate and Multivariate Spectral Analysis,” Spectrochemica Acta, Vol. 69, No. 2, 2008, pp. 343-349. doi:10.1016/j.saa.2007.04.004 [27] C. K. Markopoulou and J. E. Koundourellis, “Two De- rivative Spectrophotometric Methods for the Simultane- ous Determination of Lovastatin Combined with Three Antioxidants,” Pharmaceutical and Biomedical Analysis, Vol. 33, No. 5, 2003, pp. 1163-1173. doi:10.1016/S0731-7085(03)00429-1 [28] D. L. Massart, B. G. M. Vandeginste, S. N. Deming, Y. Michotte and L. Kaufman, “Chemometrics,” Elsevier, Amsterdam, 1988, p. 124. [29] J. Karpin´ska, A. Wiszowata and M. Skoczylas, “Simul- taneous Determination of Levomepromazine Hydrochlo- ride and Its Sulfoxide by UV-Derivative Spectropho- tometry and Bivariate Calibration Method,” Analytical Letters, Vol. 39, No. 6, 2006, pp. 1129-1141. doi:10.1080/00032710600620609 [30] P. L. Lopez-de-Alba, L. Lopez-Martinez, K. Wrobel- Kaczmarczyk, K. Wrobel-Zasada and J. Amador-Hernan- dez, “The Resolution of Dye Binary Mixtures by Bivari- ate Calibration Using Spectrophotometric Data,” Ana- lytical Letters, Vol. 29, No. 3, 1996, pp. 487-503. [31] P. L. Lopez de Alba, L. Lopez Martinez, L. I. Michelini- Rodriguez, K. Wrobel and J. Amador-Herandez, “Extrac- tion of Sunset Yellow and Tartrazine by Ion-Pair Forma- tion with Adogen-464 and their Simultaneous Determina- tion by Bivariate Calibration and Derivative Spectropho- tometry,” Analyst, Vol. 122, No. 12, 1997, pp. 1575-1579. doi:10.1039/a702268i [32] J. Ermer and J. H. M. Miller, “Method Validation in Pharmaceutical Analysis. A Guide to Best Practice,” WILEY-VCH Verlag GmbH & Co. KGaA, Weinheim, 2005.
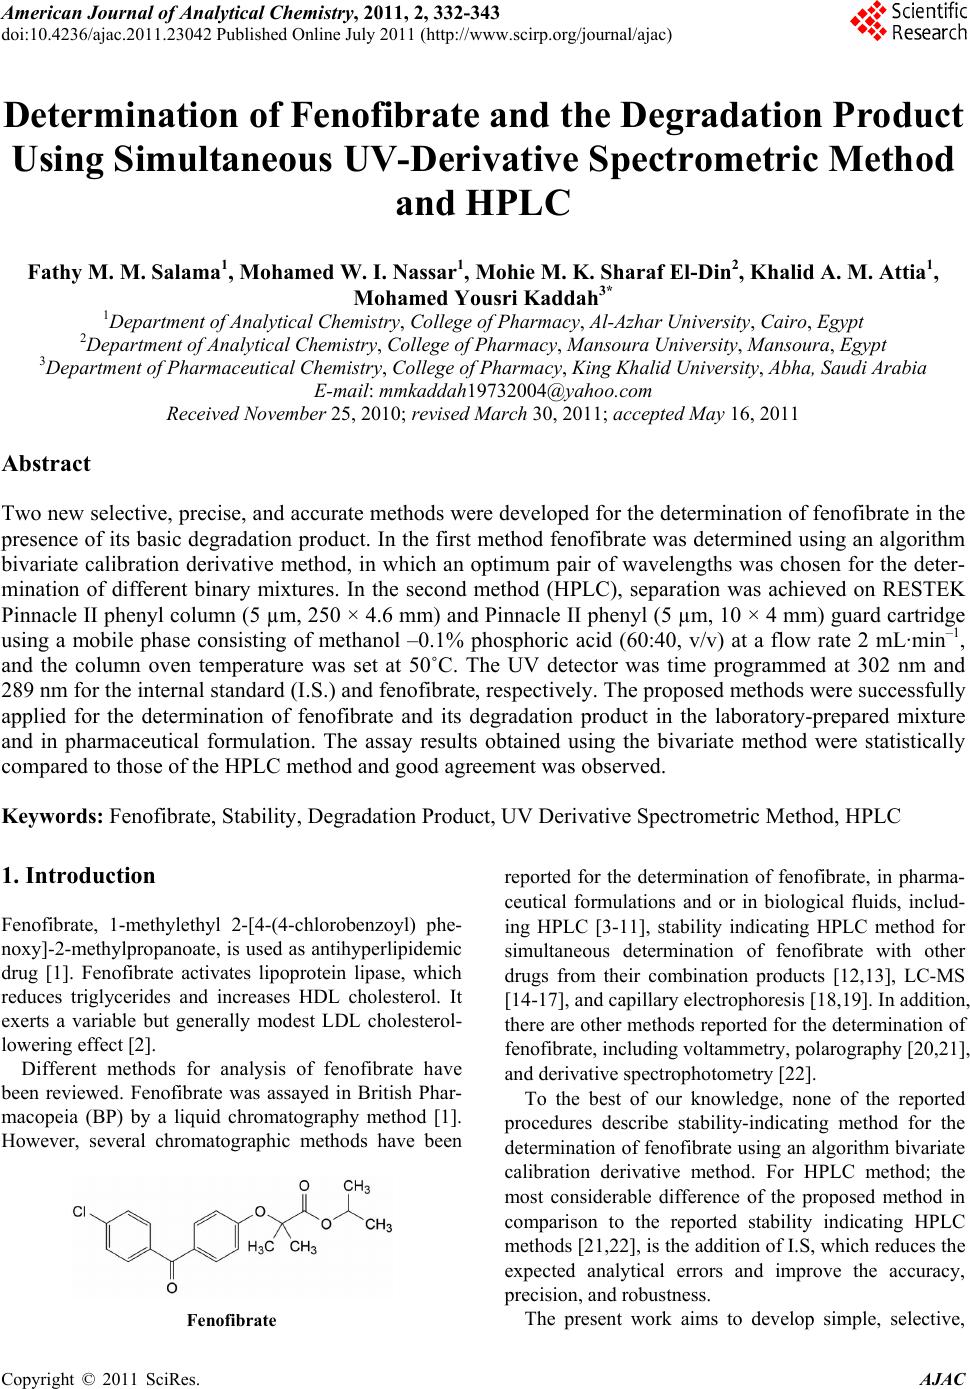
|