 Atmospheric and Climate Sciences, 2011, 1, 147-164 doi:10.4236/acs.2011.13017 Published Online July 2011 (http://www.SciRP.org/journal/acs) Copyright © 2011 SciRes. ACS 147 Understanding the Variability of Z-R Relationships Caused by Natural Variations in Raindrop Size Distributions (DSD): Implication of Drop Size and Number Abé D. Ochou1*, Eric-Pascal Zahiri1, Bakary Bamba1, Manlandon Koffi2 1Laboratoire de Physique de l’Atmosphère et Mécanique des fluides (LAPA-MF), Université de Cocody-Abidjan, Abidjan, Côte d’Ivoire 2Institut National Polytechnique Houphouët-Boigny, Yamoussoukro, Côte d’Ivoire E-mail: ochoud@yahoo.com Received May 9, 2011; revised June 13, 2011; accepted July 13, 2011 Abstract In the issue of rainfall estimation by radar through the necessary relationship between radar reflectivity Z and rain rate R (Z-R), the main limitation is attributed to the variability of this relationship. Indeed, several pre- vious studies have shown the great variability of this relationship in space and time, from a rainfall event to another and even within a single rainfall event. Recent studies have shown that the variability of raindrop size distributions and thereby Z-R relationships is therefore, more the result of complex dynamic, thermody- namic and microphysical processes within rainfall systems than a convective/stratiform classification of the ground rainfall signature. The raindrop number and size at ground being the resultant of various processes mentioned above, a suitable approach would be to analyze their variability in relation to that of Z-R relation- ship.In this study, we investigated the total raindrop concentration number NT and the median volume di- ameter D0 used in numerous studies, and have shown that the combination of these two ‘observed’ parame- ters appears to be an interesting approach to better understand the variability of the Z-R relationships in the rainfall events, without assuming a certain analytical raindrop size distribution model (exponential, gamma, or log-normal). The present study is based on the analysis of disdrometer data collected at different seasons and places in Africa, and aims to show the degree of the raindrop size and number implication in regard to the Z-R relationships variability. Keywords: Raindrop Size Distribution, Radar Reflectivity Factor, Rain Rate, Median Volume Diameter, Total Number of Drops Per Unit Volume, Z-R Relationship, Convective Rain, Stratiform Rain, Squall Lines, Thunderstorm 1. Introduction In the study of rainfall, one parameter of interest to es- timate with regard to rain drop size distributions (DSD) is the rain rate R. It can be measured from the ground using rain gauges and weather radar.The nature of space-time radar measurements represented by the re- flectivity factor Z has generated so much interest that many studies have focused on finding connections to bring it in intensity [1-12].Thus, numerous studies based on the measurement of DSD in precipitation around the world continue to show that empirical expression of the form b ARZ is a suitable relation to describe the rela- tionship between these two parameters. The fundamen- tal reason for the existence of such power law relation- ships is the fact that Z and R are related to each other via the raindrop size distribution. However, investigations on the establishment of these relations have shown and continue to show a great variability from a rainfall event to another, within a given rainfall event and from a type of precipitation to another [7-10,13]. For the case of Africa, the variability of Z-R relationships is widely documented by works of Sauvageot and Lacaux [4], Nzeukou et al. [11], Moumouni et al. [12], Russell et al. [14]. Thus, since Z-R relations proliferate in literature, it is difficult to know if an instantaneous rain rate calcu- lated with a fixed Z-R relation is necessarily correct, even if rainfall accumulations should be reasonable  A. D. OCHOU ET AL. Copyright © 2011 SciRes. ACS 148 when an appropriate climatological Z-R relation is used. The rain rate R and the reflectivity factor Z being related theoretically to the statistical moments of DSD, the mul- tiplicity of their relationship would be primarily the re- sult of the spatial and temporal variability of the DSD [15]. Steiner et al. [16] also argued that the relationship between Z and the rain rate R is very dependent on the characteristics of drop size distributions and their evolu- tion with rain rate. In other words, natural variations of DSD characteristics between type of rain and from storm to storm induce a variability in the Z-R relations which affect the quantitative estimation of rain rate from radar reflectivity. To improve the accuracy of rainfall estimation by ra- dar, numerous studies have given special attention to the determination of Z-R relationships valid for different climatic zones and particularly for different types of pre- cipitation since many authors have strongly suggested the coexistence of distinctly different convective and stratiform DSDs within tropical systems [5]. In special case of tropical Africa the convective and stratiform modes of rainfall are especially important because pre- cipitating clouds often organize into mesoscale convec- tive systems containing the two distinctive environments. Joss and Waldvogel [2] showed that application of Z-R relationships for each type of precipitation (convective or stratiform) would significantly increase the quality of radar measurements of rainfall at daily time step. In that scope, the precipitating systems are, on the basis of rainfall patterns or defined criteria, generally classified by type of precipitation with convective and stratiform parts and sometimes a transition zone [5,17-21] between both when considering rainfall events such as squall lines. Nevertheless, various investigations have revealed a variety of situations: Yuter and Houze [17] attribute to convective rains a multiplicative factor A higher than in stratiform rain while Tokay and Short [5], Atlas et al. [19], Narayana et al. [22], Maki et al. [7] show that the factor A of the stratiform part is about twice higher than the convective part, the exponent b varying a bit in both cases. Such disparities, suspected to be a cause of under- estimation or overestimation of rainfall from measured radar reflectivity, implicitly highlight three important issues: the fact that multiple rain rates can be associated with the same reflectivity because of variations in the drop size distribution; the problem of characterizing the nature of rainfall and the reliability of partitioning algorithms in stratiform/convective only according to the ground signature of rainy events or following drop size dis- tribution characteristics such as median volume di- ameter [17]; the difficulty of linking a Z-R relationship to a pre- vailing physical or microphysical process which leads to the formation or affects the DSD due to the variety of processes in each type of rain. The latter issue was addressed recently by Lee and Zawadzki [10] through an analysis of the DSD variabil- ity at different scales (climatologic, daily, within one day, between physical processes and within a physical process) and its implication on the Z-R relationship. Their work showed that the DSD variability and therefore that of Z-R relationship is more the result of complex dynamic, thermodynamic and microphysical processes within rainfall systems than a convective/stratiform classifica- tion of the ground rainfall signature. Similar work has been conducted by Rosenfeld and Ulbrich [23] through- out a notable comprehensive review which ultimate goal was to define the dominant properties of the drop size distribution, their microphysical origin, and their asso- ciation with the physical characteristics of the storm re- sponsible for their generation. They explored the ques- tion of the connections between raindrop size distribu -tions and Z-R relationships from the combined approach of rain-forming physical processes (such as coalescence, breakup, evaporation, size sorting by drafts, ) that shape the DSD, and a formulation of the DSD into the simplest free parameters of the rain intensity R, rain wa- ter content W and median volume diameter D0. Thereby, they suggested that their results may be used to illustrate the effects on the coefficient A and exponent b of each of the various physical processes. Lee and Zawadzki [10] as well as Rosenfeld and Ulbrich [23] came to the conclu- sion that the classification or identification of various physical processes within precipitating systems is essen- tial to reduce the rainfall estimation errors through the Z-R relationship. In the present work, we do not discuss the physical and microphysical processes underlying the variability of Z-R relationship, which would require a description of the vertical structure of precipitating systems from vol- umetric radar measurements, for example. However, as the raindrop number and size at ground are the result of different processes mentioned above, a suitable approach would be to analyze their variability in relation to that of Z-R relationships at the rainfall event scales. Such a study is interesting as some authors [10,24,25] reported that the DSD variability explains 30% to 50% of errors in the rain rate R estimation using the single traditional Z-R method. Because of this DSD variability, the pre- cipitations from different types of cloud may have simi- lar intensities even though the associated couples “di- ameter-number of raindrops” behave differently. Thus, it appeared essential to study simultaneously the behavior  A. D. OCHOU ET AL. Copyright © 2011 SciRes. ACS 149 Table 1. Data base description. SL (Squall Lines), ALL (whole rainy events). Events number/1 min. Spectra number Location Coordinates (Altitude) Observing Period SL Thunderstorm Stratiform ALL 1986 (Jun., Sept. - Dec.) 05/681 15/1098 02/179 22/1958 1987 (Feb. - Dec.) 20/2633 82/5198 17/2006 119/9837 1988 (Feb. - Jun.) 10/2000 26/1748 05/548 41/4296 Abidjan (Côte d’Ivoire) 5˚25N - 4˚W (40 m) 1986-1987-1988 35/5314 123/8044 24/2733 182/16091 1988 (May - Jul., Sept. - Dec.)25/5525 25/1434 11/1717 61/8676 1989 (Mar. - Jun.) 10/2243 19/2530 6/644 35/5417 Boyele (Congo) 2˚50N - 18˚04E (330 m) 1988-1989 35/7768 44/3964 17/2361 96/14093 1989 (Jul. to Sept.) 09/1379 13/1328 01/55 23/2762 1991 (Aug.) 03/357 02/94 02/146 07/597 Niamey (Niger) 13˚30N - 2˚10E (220 m) 1989-1991 12/1736 15/1422 03/201 30/3359 1997 (Jul. to Oct.) 04/699 12/1795 03/466 19/2960 1998 (Jul. to Sept.) 11/2581 16/1921 02/136 29/4638 1999 (Jul. to Sept.) 08/1839 13/1972 03/591 24/4402 2000 (Jul. to Oct.) 14/2247 11/1470 07/1152 32/4869 Dakar (Senegal) 14˚34 N - 17˚29 W (30 m) 1997-2000 37/7366 52/7158 15/2345 104/16869 of these two parameters that characterize the DSD to better quantify their influence on the Z-R relationship which variability within precipitations still raises many questions. With this in mind, Atlas et al. [19] studied the Z-R relationships variations within rainfall events taking into account the variability of the median volume diame- ter D0 and that of the intercept parameter N0 of an expo- nential or gamma theoretical function. Without assuming a certain drop size distribution model, we propose in this study, to use two observed parameters namely the total raindrop number per unit volume (or total number concentration) NT and the me- dian volume diameter D0 to show that the Z-R relation- ship variability in samples taken throughout rainy event scale and at different climatic sites, depends only on the combined effect of the raindrop size and number, an ef- fect taken into account by the ratio of these two DSD integrated variables. Thus, this work ultimately aims to provide insight to the fundamental causes of the system- atic differences in Z-R relations. To reach such a conclu- sion, we analyze all the particle size spectra collected by the Joss and Waldvogel disdrometer type at four obser- vation sites in Tropical Africa, each representing a dif- ferent type of climate. Section 2 gives a brief description of the database used here and deals with the convective-stratiform discrimina- tion method of the drop size spectra. A classification of different rain events is also done according to the fact that they are stormy, stratiform or squall line event. Sec- tion 3 is devoted to the analysis of Z-R variability rela- tive to that of the DSD at rainfall event scale. Section 4 discusses the contribution of the raindrops size and number observed minute by minute, in the variability of Z-R and emphasizes the simultaneous consideration of these two parameters to explain this variation regardless of analytical forms (exponential, gamma or lognormal). Section 5 schematizes various situations that justify and allow understanding the great disparity of Z-R relation- ships in precipitation. A conclusion which brings to- gether the main results is given in Section 6. 2. Data Base and Types of Analyzed Events 2.1. Observation Sites and Data The dataset used in this study was gathered with a Joss and Waldvogel [26] RD-69 disdrometer type in four Af- rican sites located in different climatic zones (Figure 1) at different periods listed in Table 1. This table presents the essential features of the database including 50412 one-minute spectra observation of rain covering 25 classes of raindrops diameter ranging from 0.3 mm to 5.2 mm at regular intervals of width 0.2 mm. To infer the drop density from disdrometer measurements at ground, we use the fall velocity formulae of Atlas et al. [27] ()9.6510.3exp( 0.6)VD D , where D and V(D) are expressed in mm and m·s–1. The measures cover different climatic zones (Coastal Equatorial for Abidjan, conti- nental humid Equatorial in Boyele, continental Sahelian zone in Niamey and Dakar located in a coastal Sahelian zone) in Africa and therefore different types of precipi- tating systems. Such a database, although not carried out simultaneously at different sites, is the guarantee of a good climatologically statistics study of the physical characteristics of precipitation at both seasonal and rain- fall event scales. The present study relies on this latter scale ranging from minutes to hours. To this end, the database consists of 412 major rain events (Table 1) de-  A. D. OCHOU ET AL. Copyright © 2011 SciRes. ACS 150 Figure 1. Geographical location of the rainfall measure- ment data sites by the aid of disdrometer. rived from the split of one-minute continuous data and analyzed in this paper. 2.2. Precipitating Systems and Categorizing Precipitation Types for DSD Data In the study of precipitations, notably warm or liquid rain, precipitation types are associated with clouds types in a given climate zone. Since the nature of the precipitation reflects the nature of the microphysical processes of hydrometeor formation, growth, and transformation, it is especially important to distinguish different modes of rainfall occurring in Africa tropical regions. Thus, we can analyze the similarities and differences between raindrop size distributions in various precipitation re- gimes and their impact on Z-R relationships. At surface, considering single punctual measurements, as in case of this study, the value of the rain rate R and its temporal variability can be the simplest way to identify the type of precipitation but did not provide information on micro- structure of rain. Figure 2 shows the temporal evolution of rainfall rate and DSD related to different types of pre- cipitation. There are convective rainfall associated with squall lines and isolated thunderstorms and rain associ- ated with the non convective or stratiform clouds. Wide- spread stratiform rains, usually from stratus clouds, are characterized by low and moderate intensities less than or equal to 10 mm·h–1, variable or stable over time and can last several hours. They are usually observed in monsoon periods or short dry season in tropical areas. Figure 2(b) shows an example of these rains in Abidjan. Rain from thunderstorm, are yielded by localized and isolated precipitating convective clouds characterized by one cell (Figure 2(c)) or more convective cells called clusters (Figure 2(d)). The former (called unicellular convective system) are relatively limited in time (about 20 minutes to an hour) when the latter, multi-cellular may last several hours. These rainy convective systems are characterized by high intensities which can reach more than 100 mm·h–1 in the active phase of storm cells. Figure 2(c) and Figure 2(d) show two typical cases of stormy rainfall in Abidjan. Finally, squall lines consist of precipitation generated by convective clouds multi-ce- llular cumulonimbus, well organized. Their time signa- ture at surface is characterized by two distinctive regions: a leading part called convective of relatively short dura- tion (20 - 30 minutes) and characterized by high rain rates (up to 100 to 150 mm·h–1) and another part called stratiform rain region which can last 1 to 6 hours with little varying, moderate and low (below 10 mm·h–1) in- tensities. Figure 2(a) shows a typical example of squall lines observed in Abidjan with both convective (referred by letter C) and stratiform region (referred by letter S). Because characteristics of these regions of squall lines are different, it is also important to categorize the DSD data according to whether the spectra were obtained in region of convective or stratiform precipitation. Accord- ing to the standard convective-stratiform definition, pre- cipitation type can be identified in the presence of si- multaneous observations of vertical air velocities and the terminal fall speed of hydrometeors [18,28] or based upon reflectivity structure [17,29]. None of these two methods of distinguishing convective from stratiform rain is applicable in our study because neither radar data nor draft magnitudes have been simultaneously collected during measurements periods of raindrop size distribu- tion used here. Since these observations are rare, Tokay and Short [5] and Tokay et al. [18] determined the sepa- ration between convective and stratiform precipitation on the basis of a jump in the intercept parameter (N0) of the gamma-fitted DSD, following the physical arguments of Waldvogel [30]. Nevertheless, as we do not consider specific theoretical DSD model in this study, precipita- tion was classified as convective or stratiform basing on hyetograph (time evolution of rain rate for a given rainy event) according to the method proposed by Testud et al. [6] and successfully applied by Moumouni et al. [12] and Gosset et al. [31] on recent African rainfall observed in northern Benin during the intensive campaign of the in- ternational African Monsoon Multidisciplinary Analysis (AMMA). This approach is based on the fact that stratiform pre- cipitations are low in intensity and have a large horizon- tal extension. Thus, for a sequence of values {Ri} inten- sities of rainfall from the hyetograph of a squall line, a spectrum k is classified as stratiform only if its intensity Rk and those of its 20 closest neighbors spectra (R10–k to R10+k) are all smaller than the threshold value of 10 mm·h–1. Otherwise, this spectrum is classified convective. In this latter case, the 20 adjacent spectra are also con- sidered as convective. In this way, such a criterion allows 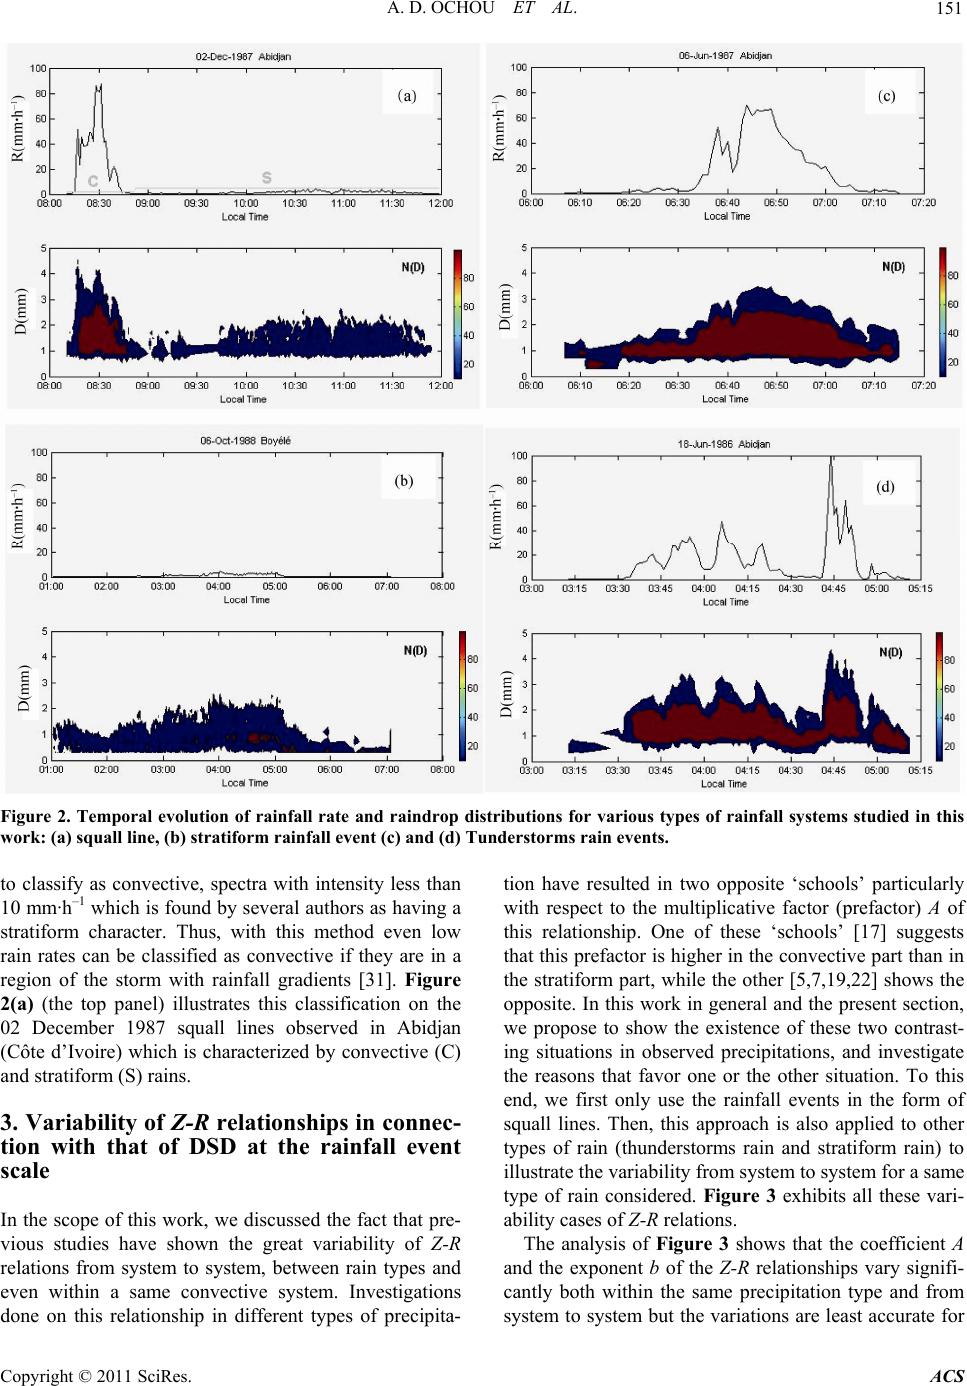 A. D. OCHOU ET AL. Copyright © 2011 SciRes. ACS 151 Figure 2. Temporal evolution of rainfall rate and raindrop distributions for various types of rainfall systems studied in this work: (a) squall line, (b) stratiform rainfall event (c) and (d) Tunderstorms rain events. to classify as convective, spectra with intensity less than 10 mm·h–1 which is found by several authors as having a stratiform character. Thus, with this method even low rain rates can be classified as convective if they are in a region of the storm with rainfall gradients [31]. Figure 2(a) (the top panel) illustrates this classification on the 02 December 1987 squall lines observed in Abidjan (Côte d’Ivoire) which is characterized by convective (C) and stratiform (S) rains. 3. Variability of Z-R relationships in connec- tion with that of DSD at the rainfall event scale In the scope of this work, we discussed the fact that pre- vious studies have shown the great variability of Z-R relations from system to system, between rain types and even within a same convective system. Investigations done on this relationship in different types of precipita- tion have resulted in two opposite ‘schools’ particularly with respect to the multiplicative factor (prefactor) A of this relationship. One of these ‘schools’ [17] suggests that this prefactor is higher in the convective part than in the stratiform part, while the other [5,7,19,22] shows the opposite. In this work in general and the present section, we propose to show the existence of these two contrast- ing situations in observed precipitations, and investigate the reasons that favor one or the other situation. To this end, we first only use the rainfall events in the form of squall lines. Then, this approach is also applied to other types of rain (thunderstorms rain and stratiform rain) to illustrate the variability from system to system for a same type of rain considered. Figure 3 exhibits all these vari- ability cases of Z-R relations. The analysis of Figure 3 shows that the coefficient A and the exponent b of the Z-R relationships vary signifi- cantly both within the same precipitation type and from system to system but the variations are least accurate for 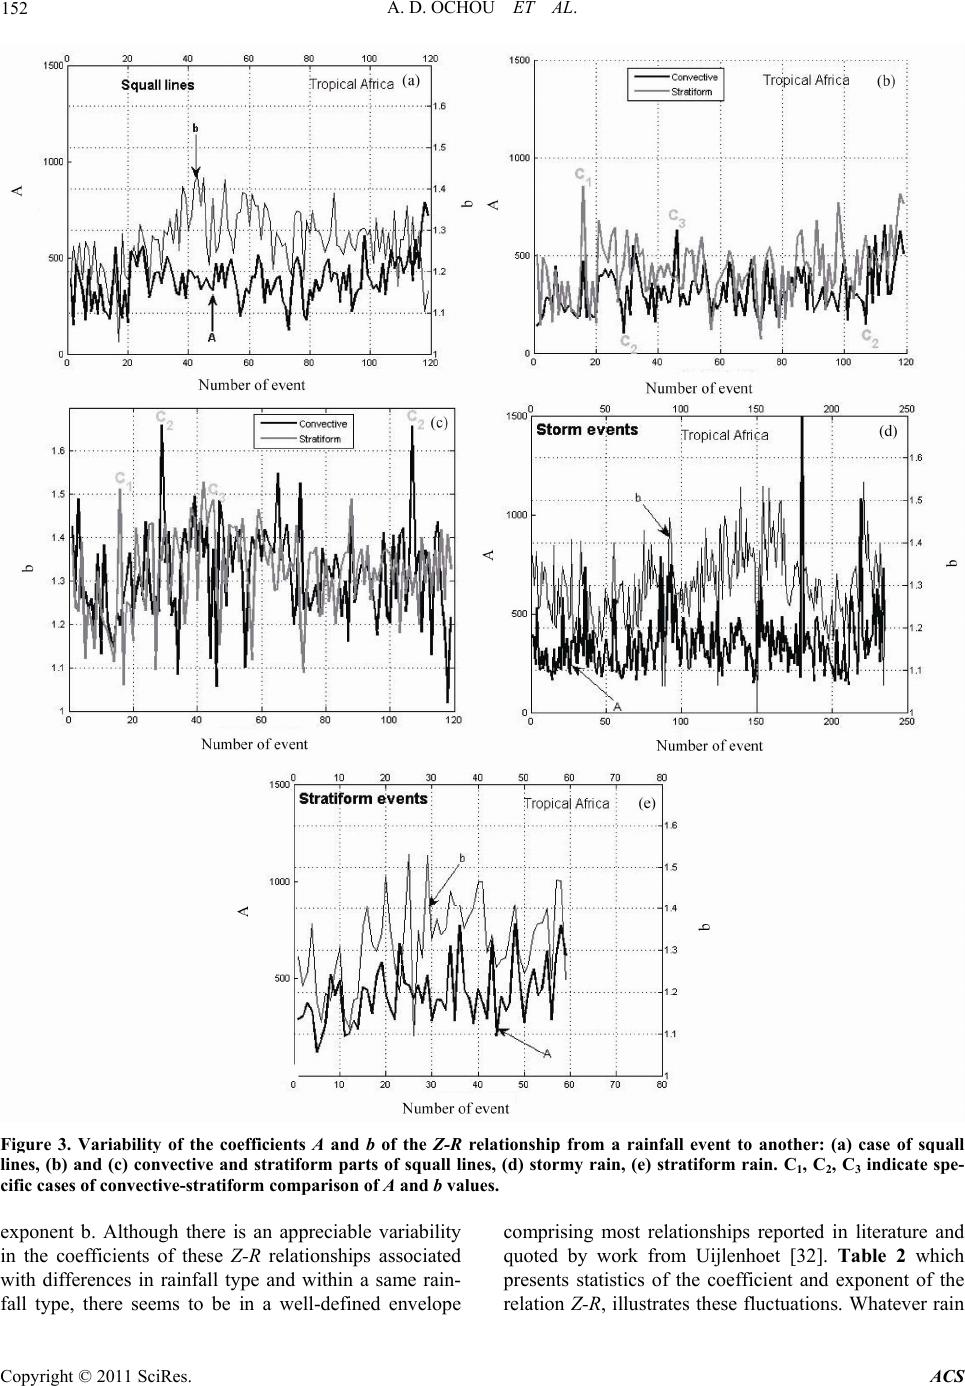 A. D. OCHOU ET AL. Copyright © 2011 SciRes. ACS 152 Figure 3. Variability of the coefficients A and b of the Z-R relationship from a rainfall event to another: (a) case of squall lines, (b) and (c) convective and stratiform parts of squall lines, (d) stormy rain, (e) stratiform rain. C1, C2, C3 indicate spe- cific cases of convective-stratiform comparison of A and b values. exponent b. Although there is an appreciable variability in the coefficients of these Z-R relationships associated with differences in rainfall type and within a same rain- fall type, there seems to be in a well-defined envelope comprising most relationships reported in literature and quoted by work from Uijlenhoet [32]. Table 2 which presents statistics of the coefficient and exponent of the relation Z-R, illustrates these fluctuations. Whatever rain 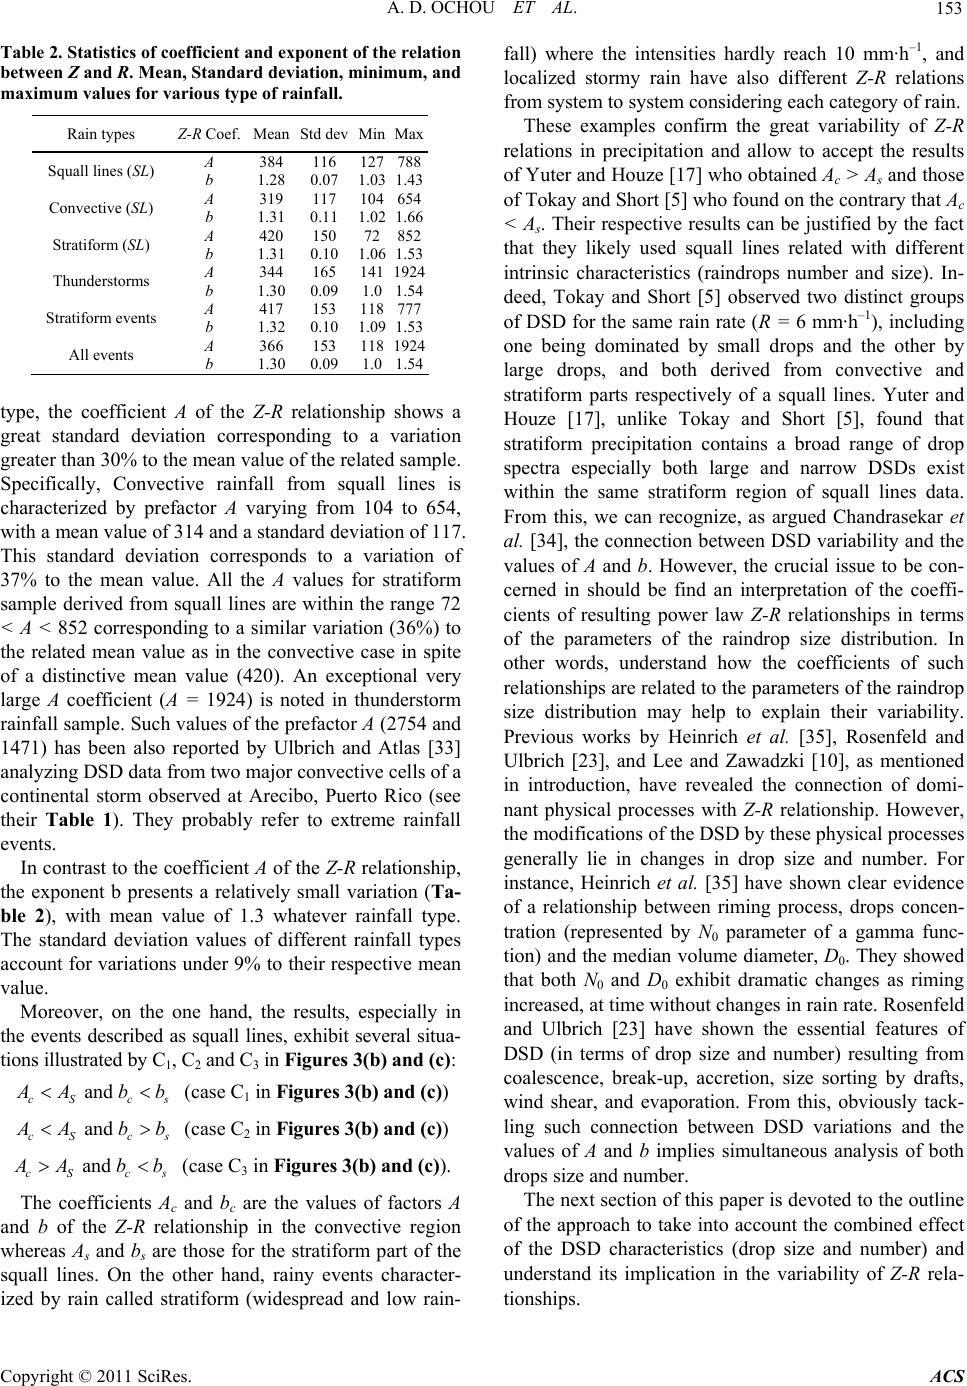 A. D. OCHOU ET AL. Copyright © 2011 SciRes. ACS 153 Table 2. Statistics of coefficient and exponent of the relation between Z and R. Mean, Standard deviation, minimum, and maximum values for various type of rainfall. Rain types Z-R Coef.Mean Std dev MinMax Squall lines (SL) A b 384 1.28 116 0.07 127 1.03 788 1.43 Convective (SL) A b 319 1.31 117 0.11 104 1.02 654 1.66 Stratiform (SL) A b 420 1.31 150 0.10 72 1.06 852 1.53 Thunderstorms A b 344 1.30 165 0.09 141 1.0 1924 1.54 Stratiform events A b 417 1.32 153 0.10 118 1.09 777 1.53 All events A b 366 1.30 153 0.09 118 1.0 1924 1.54 type, the coefficient A of the Z-R relationship shows a great standard deviation corresponding to a variation greater than 30% to the mean value of the related sample. Specifically, Convective rainfall from squall lines is characterized by prefactor A varying from 104 to 654, with a mean value of 314 and a standard deviation of 117. This standard deviation corresponds to a variation of 37% to the mean value. All the A values for stratiform sample derived from squall lines are within the range 72 < A < 852 corresponding to a similar variation (36%) to the related mean value as in the convective case in spite of a distinctive mean value (420). An exceptional very large A coefficient (A = 1924) is noted in thunderstorm rainfall sample. Such values of the prefactor A (2754 and 1471) has been also reported by Ulbrich and Atlas [33] analyzing DSD data from two major convective cells of a continental storm observed at Arecibo, Puerto Rico (see their Table 1). They probably refer to extreme rainfall events. In contrast to the coefficient A of the Z-R relationship, the exponent b presents a relatively small variation (Ta- ble 2), with mean value of 1.3 whatever rainfall type. The standard deviation values of different rainfall types account for variations under 9% to their respective mean value. Moreover, on the one hand, the results, especially in the events described as squall lines, exhibit several situa- tions illustrated by C1, C2 and C3 in Figures 3(b) and (c): and cS cs Abb (case C1 in Figures 3(b) and (c)) and cS cs Abb (case C2 in Figures 3(b) and (c)) and cS cs Abb (case C3 in Figures 3(b) and (c)). The coefficients Ac and bc are the values of factors A and b of the Z-R relationship in the convective region whereas As and bs are those for the stratiform part of the squall lines. On the other hand, rainy events character- ized by rain called stratiform (widespread and low rain- fall) where the intensities hardly reach 10 mm·h–1, and localized stormy rain have also different Z-R relations from system to system considering each category of rain. These examples confirm the great variability of Z-R relations in precipitation and allow to accept the results of Yuter and Houze [17] who obtained Ac > As and those of Tokay and Short [5] who found on the contrary that Ac < As. Their respective results can be justified by the fact that they likely used squall lines related with different intrinsic characteristics (raindrops number and size). In- deed, Tokay and Short [5] observed two distinct groups of DSD for the same rain rate (R = 6 mm·h–1), including one being dominated by small drops and the other by large drops, and both derived from convective and stratiform parts respectively of a squall lines. Yuter and Houze [17], unlike Tokay and Short [5], found that stratiform precipitation contains a broad range of drop spectra especially both large and narrow DSDs exist within the same stratiform region of squall lines data. From this, we can recognize, as argued Chandrasekar et al. [34], the connection between DSD variability and the values of A and b. However, the crucial issue to be con- cerned in should be find an interpretation of the coeffi- cients of resulting power law Z-R relationships in terms of the parameters of the raindrop size distribution. In other words, understand how the coefficients of such relationships are related to the parameters of the raindrop size distribution may help to explain their variability. Previous works by Heinrich et al. [35], Rosenfeld and Ulbrich [23], and Lee and Zawadzki [10], as mentioned in introduction, have revealed the connection of domi- nant physical processes with Z-R relationship. However, the modifications of the DSD by these physical processes generally lie in changes in drop size and number. For instance, Heinrich et al. [35] have shown clear evidence of a relationship between riming process, drops concen- tration (represented by N0 parameter of a gamma func- tion) and the median volume diameter, D0. They showed that both N0 and D0 exhibit dramatic changes as riming increased, at time without changes in rain rate. Rosenfeld and Ulbrich [23] have shown the essential features of DSD (in terms of drop size and number) resulting from coalescence, break-up, accretion, size sorting by drafts, wind shear, and evaporation. From this, obviously tack- ling such connection between DSD variations and the values of A and b implies simultaneous analysis of both drops size and number. The next section of this paper is devoted to the outline of the approach to take into account the combined effect of the DSD characteristics (drop size and number) and understand its implication in the variability of Z-R rela- tionships.  A. D. OCHOU ET AL. Copyright © 2011 SciRes. ACS 154 Figure 4. Scatter plots (D0/NT, R) and fitted curves on different samples: (a) case of a squall line divided into convec- tive-stratiform, (b) case of a widespread stratiform rain, (c) case of a single cell storm, (d) case of a multi-cellular storm. 4. Implication of the Drops Size and Number in the Variability of Z-R Relations 4.1. Methodology To take into account the simultaneous contribution of both the number of drops and their size in the variability of Z-R relations, we consider the ratio between these DSDs characteristic parameters. The approach in this work is to find functional relationships between the in- stant ratio D0/NT (between the median volume diameter and the total number of drops per unit volume for a given rainfall event) and the rain rate R in order to examine the influence on the corresponding Z-R relations. In particu- lar, we attempt to determine possible relations between coefficients of both relationships. Rosenfeld and Ulbrich [23] and more recently papers by Ulbrich and Atlas [36] and Ochou et al. [37] have suggested a set of relations between pairs of rainfall integral parameters. For in- stance, they proposed power-laws for the pairs integral parameters D0-R and NT-R such as 0 DR and T NR . Consequently, such power law relationship would also characterize the relation between parameters D0/NT and R. Thus, on the basis of whole or subdivided rainy events (in convective or stratiform region in cases of a squall line) functions fitted to the scatter plots (D0/NT, R) are power-laws of the form: 0T DN R . (1) On a log-log scale, the fitted function is a straight line where corresponds to the value of D0/NT for R = 1 mm·h–1, while is the slope of the line. The analogy between the expression (1) and the relation Z = ARb be- tween the reflectivity radar and the rain rate permits to assume the existence of a consistent behavior of the co- efficients A and b, regarding the coefficients and respectively. Such an analysis is performed with all the rain events in the database categorized according to dif- ferent types of precipitation. 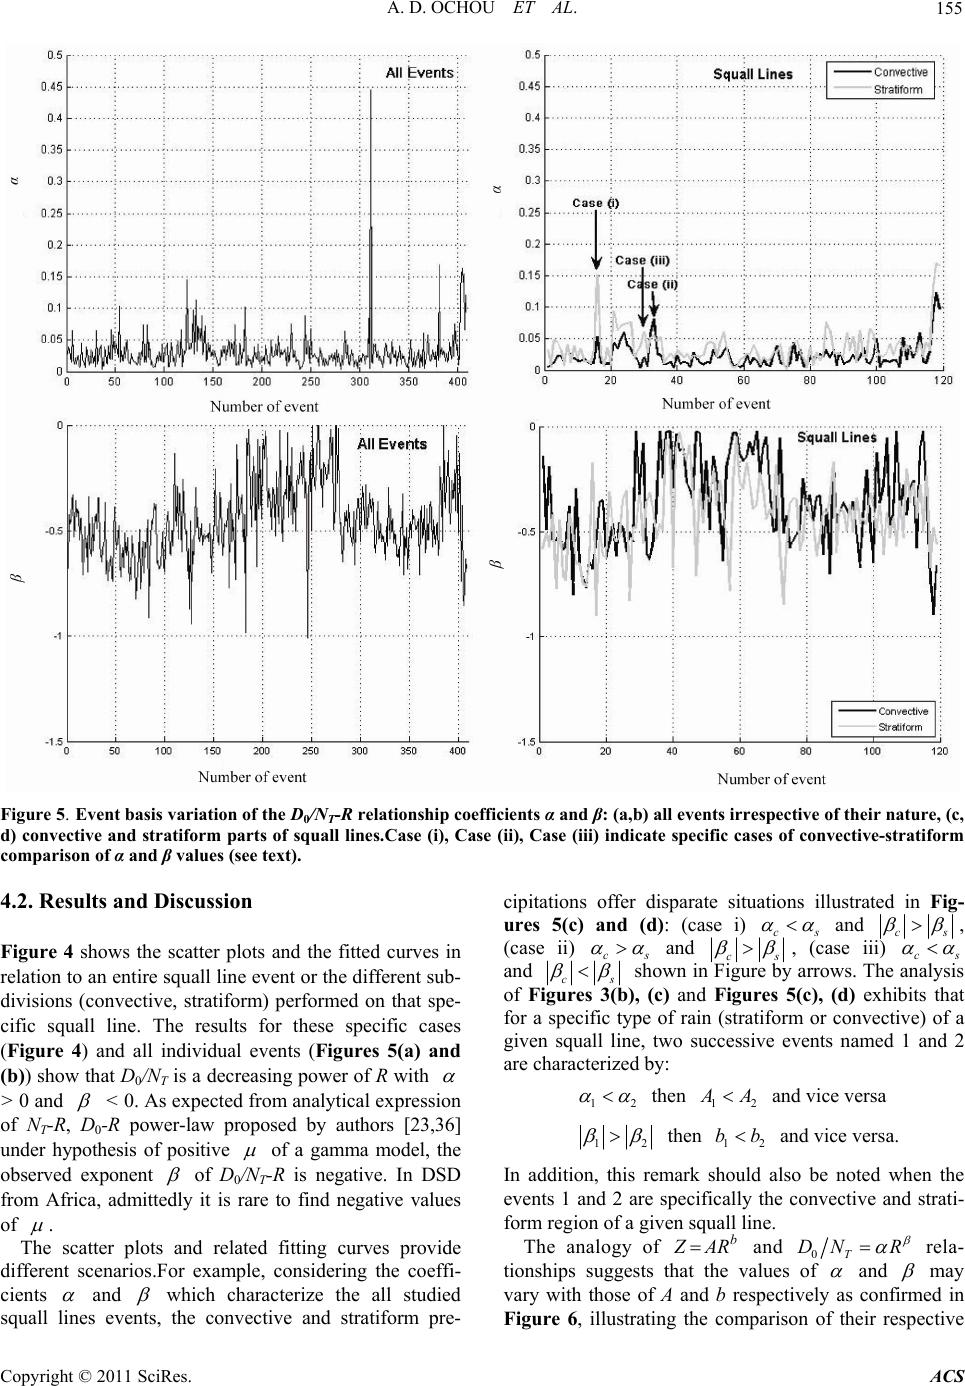 A. D. OCHOU ET AL. Copyright © 2011 SciRes. ACS 155 Figure 5. Event basis variation of the D0/NT-R relationship coefficients α and β: (a,b) all events irrespective of their nature, (c, d) convective and stratiform parts of squall lines.Case (i), Case (ii), Case (iii) indicate specific cases of convective-stratiform comparison of α and β values (see text). 4.2. Results and Discussion Figure 4 shows the scatter plots and the fitted curves in relation to an entire squall line event or the different sub- divisions (convective, stratiform) performed on that spe- cific squall line. The results for these specific cases (Figure 4) and all individual events (Figures 5(a) and (b)) show that D0/NT is a decreasing power of R with > 0 and < 0. As expected from analytical expression of NT-R, D0-R power-law proposed by authors [23,36] under hypothesis of positive of a gamma model, the observed exponent of D0/NT-R is negative. In DSD from Africa, admittedly it is rare to find negative values of . The scatter plots and related fitting curves provide different scenarios.For example, considering the coeffi- cients and which characterize the all studied squall lines events, the convective and stratiform pre- cipitations offer disparate situations illustrated in Fig- ures 5(c) and (d): (case i) cs and cs , (case ii) cs and cs , (case iii) cs and cs shown in Figure by arrows. The analysis of Figures 3(b), (c) and Figures 5(c), (d) exhibits that for a specific type of rain (stratiform or convective) of a given squall line, two successive events named 1 and 2 are characterized by: 12 then 12 A and vice versa 12 then 12 bb and vice versa. In addition, this remark should also be noted when the events 1 and 2 are specifically the convective and strati- form region of a given squall line. The analogy of b ARZ and 0T DN R rela- tionships suggests that the values of and may vary with those of A and b respectively as confirmed in Figure 6, illustrating the comparison of their respective 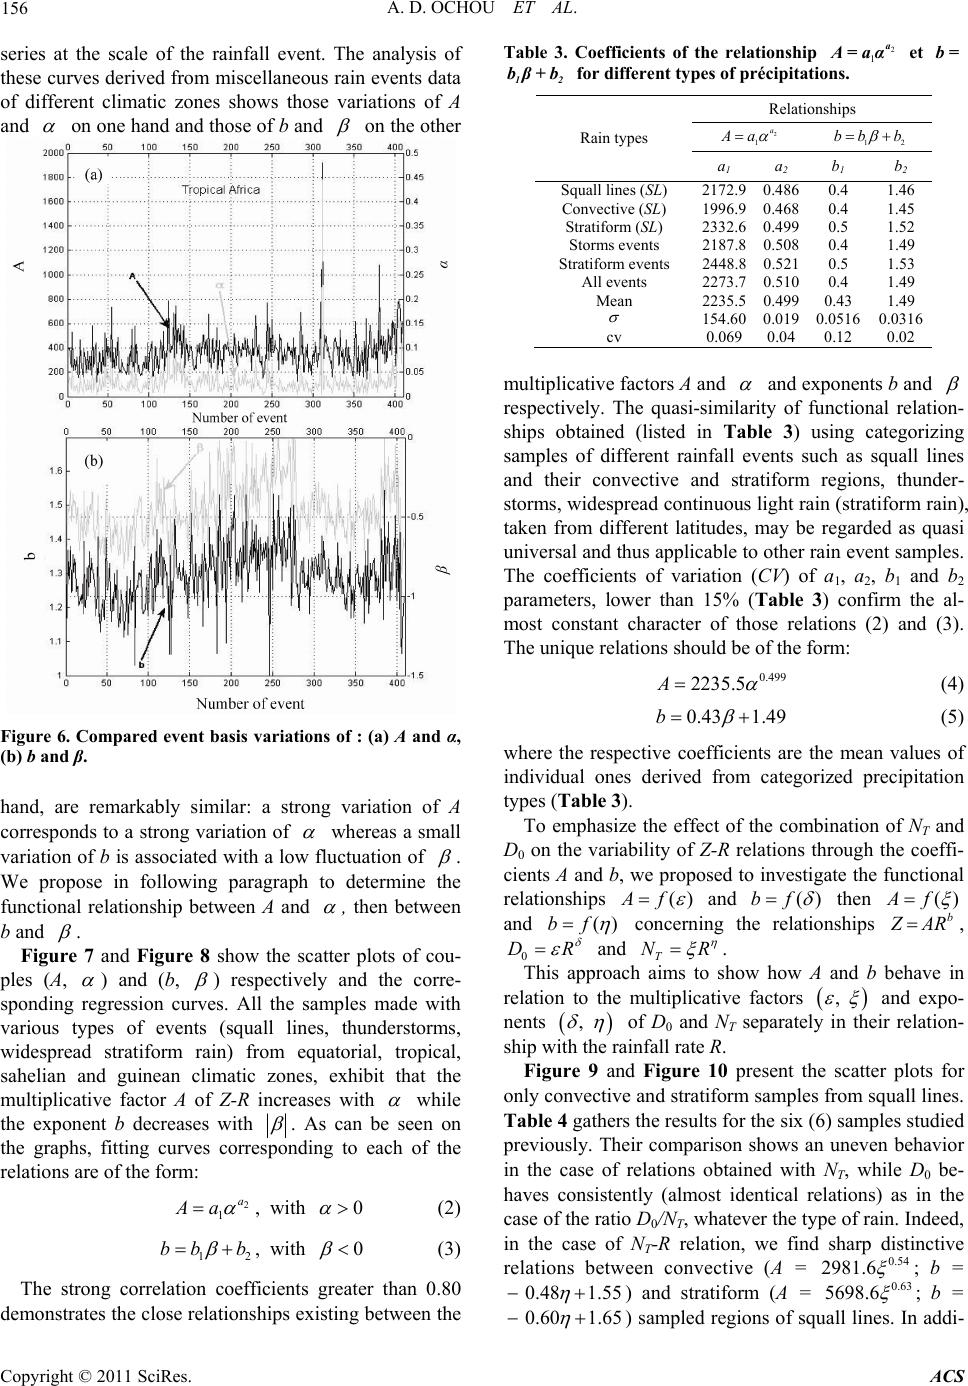 A. D. OCHOU ET AL. Copyright © 2011 SciRes. ACS 156 series at the scale of the rainfall event. The analysis of these curves derived from miscellaneous rain events data of different climatic zones shows those variations of A and on one hand and those of b and on the other Figure 6. Compared event basis variations of : (a) A and α, (b) b and β. hand, are remarkably similar: a strong variation of A corresponds to a strong variation of whereas a small variation of b is associated with a low fluctuation of . We propose in following paragraph to determine the functional relationship between A and , then between b and . Figure 7 and Figure 8 show the scatter plots of cou- ples (A, ) and (b, ) respectively and the corre- sponding regression curves. All the samples made with various types of events (squall lines, thunderstorms, widespread stratiform rain) from equatorial, tropical, sahelian and guinean climatic zones, exhibit that the multiplicative factor A of Z-R increases with while the exponent b decreases with . As can be seen on the graphs, fitting curves corresponding to each of the relations are of the form: 2 1 a Aa , with 0 (2) 12 bb b , with 0 (3) The strong correlation coefficients greater than 0.80 demonstrates the close relationships existing between the Table 3. Coefficients of the relationship 2 1 a A=aα et b= 12 bβ+b for different types of précipitations. Relationships 2 1 a Aa 12 bb b Rain types a1 a 2 b 1 b 2 Squall lines (SL) 2172.9 0.486 0.4 1.46 Convective (SL) 1996.9 0.468 0.4 1.45 Stratiform (SL) 2332.6 0.499 0.5 1.52 Storms events 2187.8 0.508 0.4 1.49 Stratiform events 2448.8 0.521 0.5 1.53 All events 2273.7 0.510 0.4 1.49 Mean 2235.5 0.499 0.43 1.49 154.60 0.019 0.0516 0.0316 cv 0.069 0.04 0.12 0.02 multiplicative factors A and and exponents b and respectively. The quasi-similarity of functional relation- ships obtained (listed in Table 3) using categorizing samples of different rainfall events such as squall lines and their convective and stratiform regions, thunder- storms, widespread continuous light rain (stratiform rain), taken from different latitudes, may be regarded as quasi universal and thus applicable to other rain event samples. The coefficients of variation (CV) of a1, a2, b1 and b2 parameters, lower than 15% (Table 3) confirm the al- most constant character of those relations (2) and (3). The unique relations should be of the form: 0.499 2235.5A (4) 0.43 1.49b (5) where the respective coefficients are the mean values of individual ones derived from categorized precipitation types (Table 3). To emphasize the effect of the combination of NT and D0 on the variability of Z-R relations through the coeffi- cients A and b, we proposed to investigate the functional relationships () f and )( fb then ()Af and ()bf concerning the relationships b AR, 0 DR and T NR . This approach aims to show how A and b behave in relation to the multiplicative factors , and expo- nents , of D0 and NT separately in their relation- ship with the rainfall rate R. Figure 9 and Figure 10 present the scatter plots for only convective and stratiform samples from squall lines. Table 4 gathers the results for the six (6) samples studied previously. Their comparison shows an uneven behavior in the case of relations obtained with NT, while D0 be- haves consistently (almost identical relations) as in the case of the ratio D0/NT, whatever the type of rain. Indeed, in the case of NT-R relation, we find sharp distinctive relations between convective (A = 0.54 2981.6 ; b = 0.48 1.55 ) and stratiform (A = 0.63 5698.6 ; b = 0.60 1.65 ) sampled regions of squall lines. In addi- 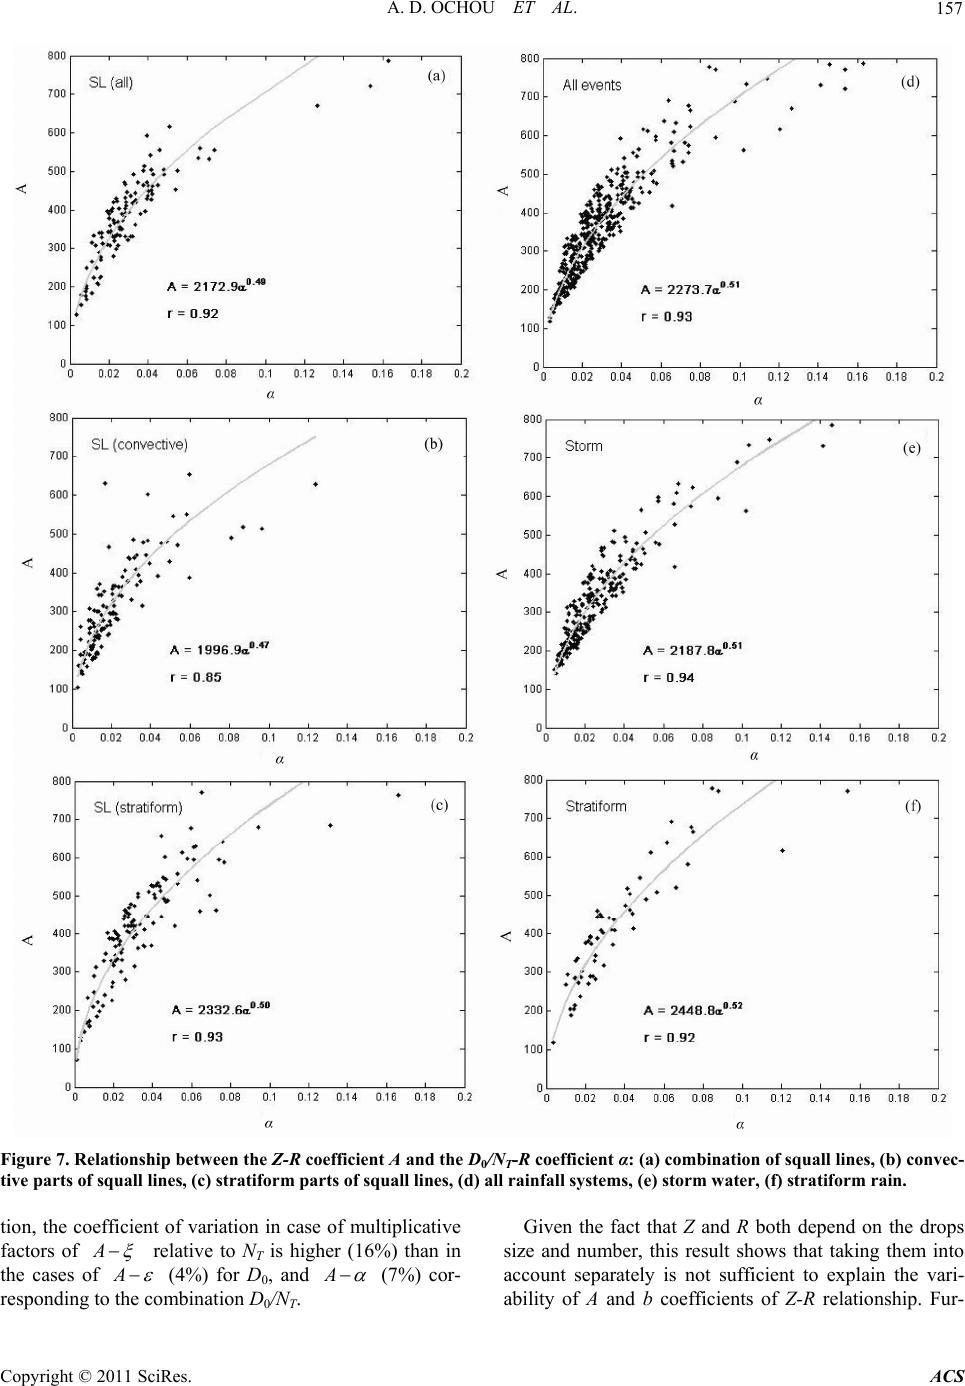 A. D. OCHOU ET AL. Copyright © 2011 SciRes. ACS 157 Figure 7. Relationship between the Z-R coefficient A and the D0/NT-R coefficient α: (a) combination of squall lines, (b) convec- tive parts of squall lines, (c) stratiform parts of squall lines, (d) all rainfall systems, (e) storm water, (f) stratiform rain. tion, the coefficient of variation in case of multiplicative factors of A relative to NT is higher (16%) than in the cases of A (4%) for D0, and A (7%) cor- responding to the combination D0/NT. Given the fact that Z and R both depend on the drops size and number, this result shows that taking them into account separately is not sufficient to explain the vari- ability of A and b coefficients of Z-R relationship. Fur- 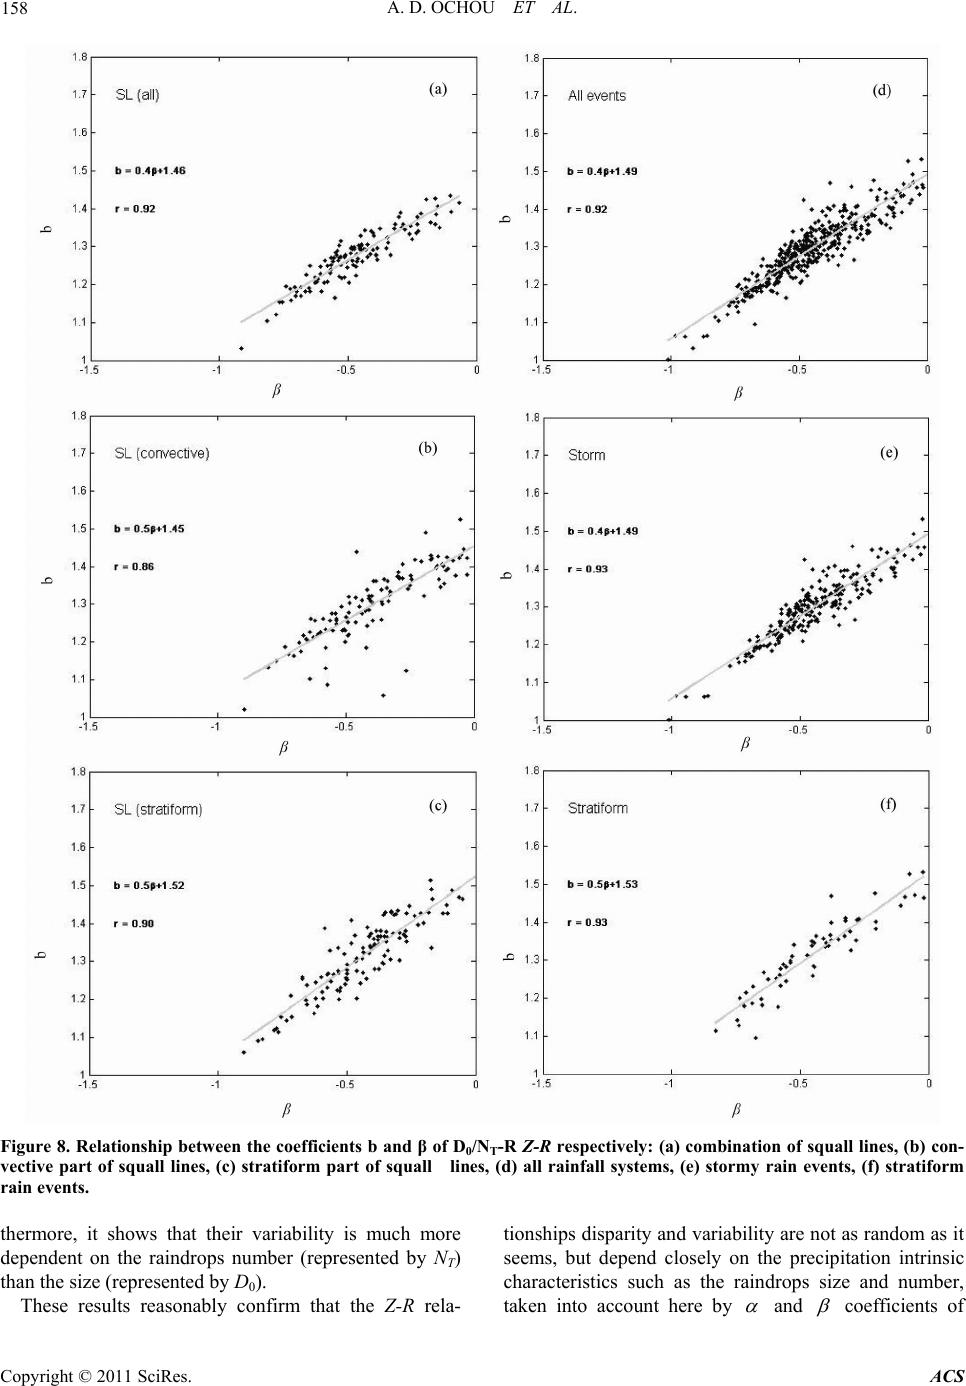 A. D. OCHOU ET AL. Copyright © 2011 SciRes. ACS 158 Figure 8. Relationship between the coefficients b and β of D0/NT-R Z-R respectively: (a) combination of squall lines, (b) con- vective part of squall lines, (c) stratiform part of squall lines, (d) all rainfall systems, (e) stormy rain events, (f) stratiform rain events. thermore, it shows that their variability is much more dependent on the raindrops number (represented by NT) than the size (represented by D0). These results reasonably confirm that the Z-R rela- tionships disparity and variability are not as random as it seems, but depend closely on the precipitation intrinsic characteristics such as the raindrops size and number, taken into account here by and coefficients of 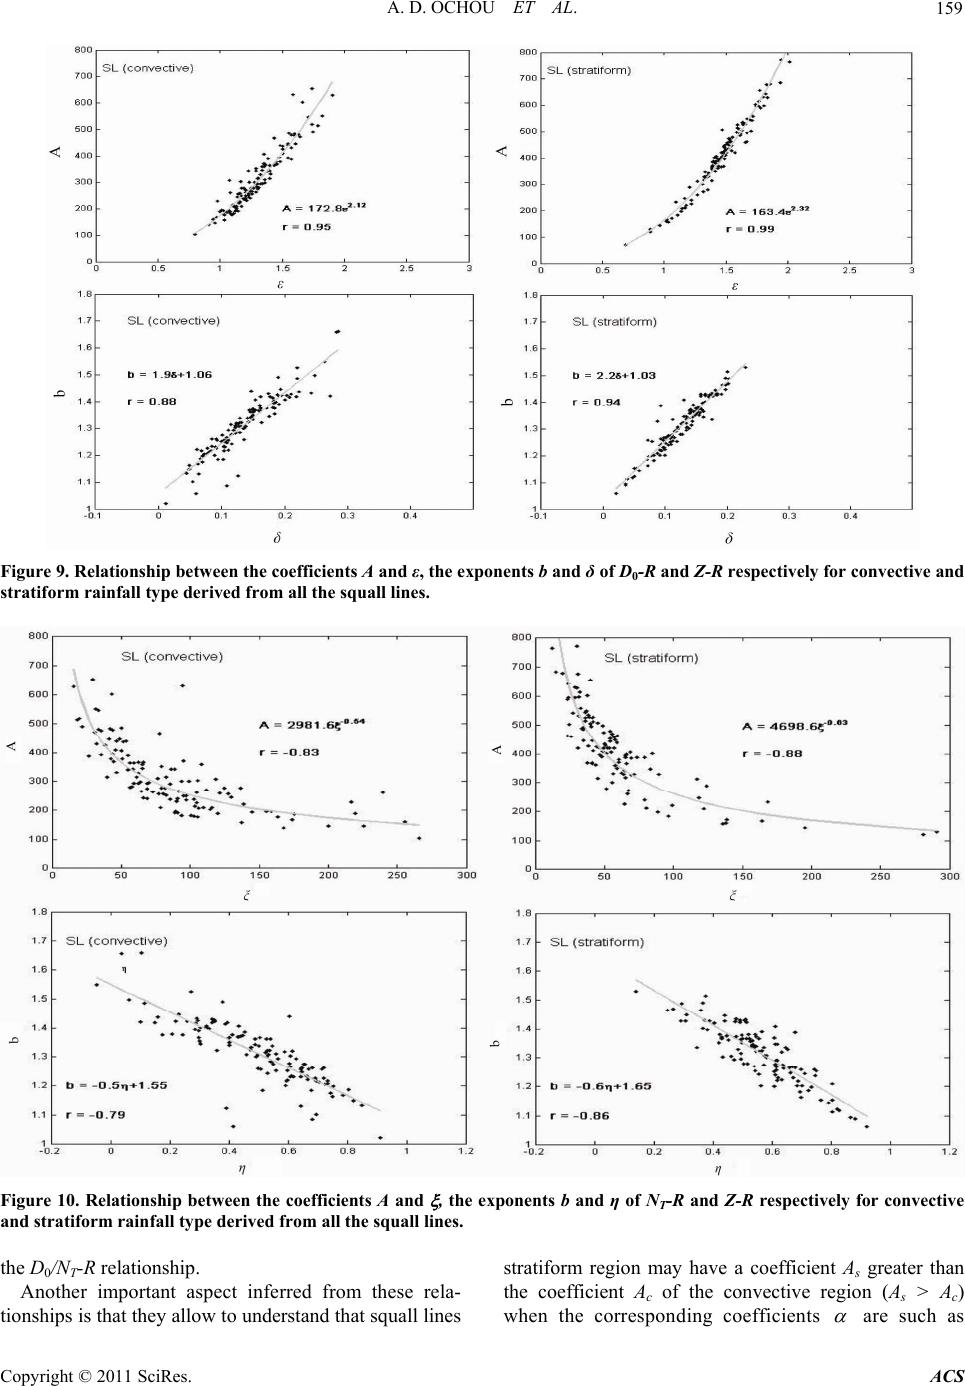 A. D. OCHOU ET AL. Copyright © 2011 SciRes. ACS 159 Figure 9. Relationship between the coefficients A and ε, the exponents b and δ of D0-R and Z-R respectively for convective and stratiform rainfall type derived from all the squall lines. Figure 10. Relationship between the coefficients A and , the exponents b and η of NT-R and Z-R respectively for convective and stratiform rainfall type derived from all the squall lines. the D0/NT-R relationship. Another important aspect inferred from these rela- tionships is that they allow to understand that squall lines stratiform region may have a coefficient As greater than the coefficient Ac of the convective region (As > Ac) when the corresponding coefficients are such as 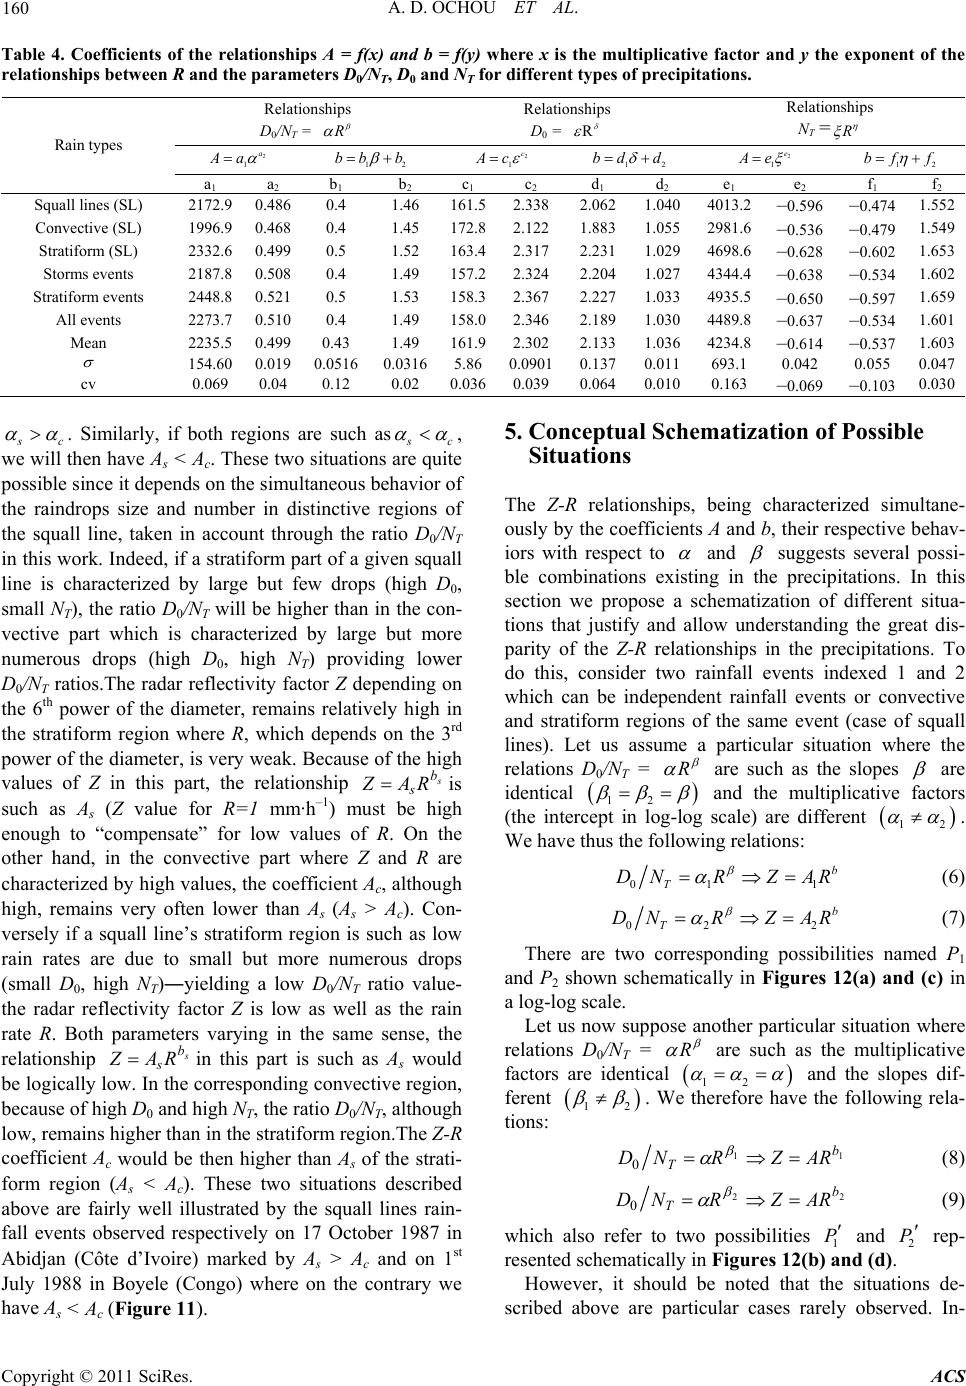 A. D. OCHOU ET AL. Copyright © 2011 SciRes. ACS 160 Table 4. Coefficients of the relationships A = f(x) and b = f(y) where x is the multiplicative factor and y the exponent of the relationships between R and the parameters D0/NT, D0 and NT for different types of precipitations. Relationships D0/NT = Relationships D0 = R Relationships NT = 2 1 a Aa 12 bb b 2 1 c c 12 bd d 2 1 e e 12 bf f Rain types a1 a 2 b 1 b 2 c 1 c 2 d 1 d 2 e 1 e 2 f 1 f 2 Squall lines (SL) 2172.9 0.486 0.4 1.46 161.52.338 2.0621.0404013.2 –0.596 –0.474 1.552 Convective (SL) 1996.9 0.468 0.4 1.45 172.82.122 1.8831.0552981.6 –0.536 –0.479 1.549 Stratiform (SL) 2332.6 0.499 0.5 1.52 163.42.317 2.2311.0294698.6 –0.628 –0.602 1.653 Storms events 2187.8 0.508 0.4 1.49 157.22.324 2.2041.0274344.4 –0.638 –0.534 1.602 Stratiform events 2448.8 0.521 0.5 1.53 158.32.367 2.2271.0334935.5 –0.650 –0.597 1.659 All events 2273.7 0.510 0.4 1.49 158.02.346 2.1891.0304489.8 –0.637 –0.534 1.601 Mean 2235.5 0.499 0.43 1.49 161.92.302 2.1331.0364234.8 –0.614 –0.537 1.603 154.60 0.019 0.0516 0.03165.86 0.0901 0.1370.011693.1 0.042 0.055 0.047 cv 0.069 0.04 0.12 0.02 0.0360.039 0.0640.0100.163 –0.069 –0.103 0.030 c . Similarly, if both regions are such as c , we will then have As < Ac. These two situations are quite possible since it depends on the simultaneous behavior of the raindrops size and number in distinctive regions of the squall line, taken in account through the ratio D0/NT in this work. Indeed, if a stratiform part of a given squall line is characterized by large but few drops (high D0, small NT), the ratio D0/NT will be higher than in the con- vective part which is characterized by large but more numerous drops (high D0, high NT) providing lower D0/NT ratios.The radar reflectivity factor Z depending on the 6th power of the diameter, remains relatively high in the stratiform region where R, which depends on the 3rd power of the diameter, is very weak. Because of the high values of Z in this part, the relationship s b sRAZ is such as As (Z value for R=1 mm·h–1) must be high enough to “compensate” for low values of R. On the other hand, in the convective part where Z and R are characterized by high values, the coefficient Ac, although high, remains very often lower than As (As > Ac). Con- versely if a squall line’s stratiform region is such as low rain rates are due to small but more numerous drops (small D0, high NT)―yielding a low D0/NT ratio value- the radar reflectivity factor Z is low as well as the rain rate R. Both parameters varying in the same sense, the relationship s b sRAZ in this part is such as As would be logically low. In the corresponding convective region, because of high D0 and high NT, the ratio D0/NT, although low, remains higher than in the stratiform region.The Z-R coefficient Ac would be then higher than As of the strati- form region (As < Ac). These two situations described above are fairly well illustrated by the squall lines rain- fall events observed respectively on 17 October 1987 in Abidjan (Côte d’Ivoire) marked by As > Ac and on 1st July 1988 in Boyele (Congo) where on the contrary we have As < Ac (Figure 11). 5. Conceptual Schematization of Possible Situations The Z-R relationships, being characterized simultane- ously by the coefficients A and b, their respective behav- iors with respect to and suggests several possi- ble combinations existing in the precipitations. In this section we propose a schematization of different situa- tions that justify and allow understanding the great dis- parity of the Z-R relationships in the precipitations. To do this, consider two rainfall events indexed 1 and 2 which can be independent rainfall events or convective and stratiform regions of the same event (case of squall lines). Let us assume a particular situation where the relations D0/NT = R are such as the slopes are identical 12 and the multiplicative factors (the intercept in log-log scale) are different 12 . We have thus the following relations: 01 1 b T DNRZAR (6) 02 2 b T DNRZ AR (7) There are two corresponding possibilities named P1 and P2 shown schematically in Figures 12(a) and (c) in a log-log scale. Let us now suppose another particular situation where relations D0/NT = R are such as the multiplicative factors are identical 12 and the slopes dif- ferent 12 . We therefore have the following rela- tions: 11 0 b TARZRND (8) 22 0 b TARZRND (9) which also refer to two possibilities 1 P and 2 P rep- resented schematically in Figures 12(b) and (d). However, it should be noted that the situations de- scribed above are particular cases rarely observed. In- 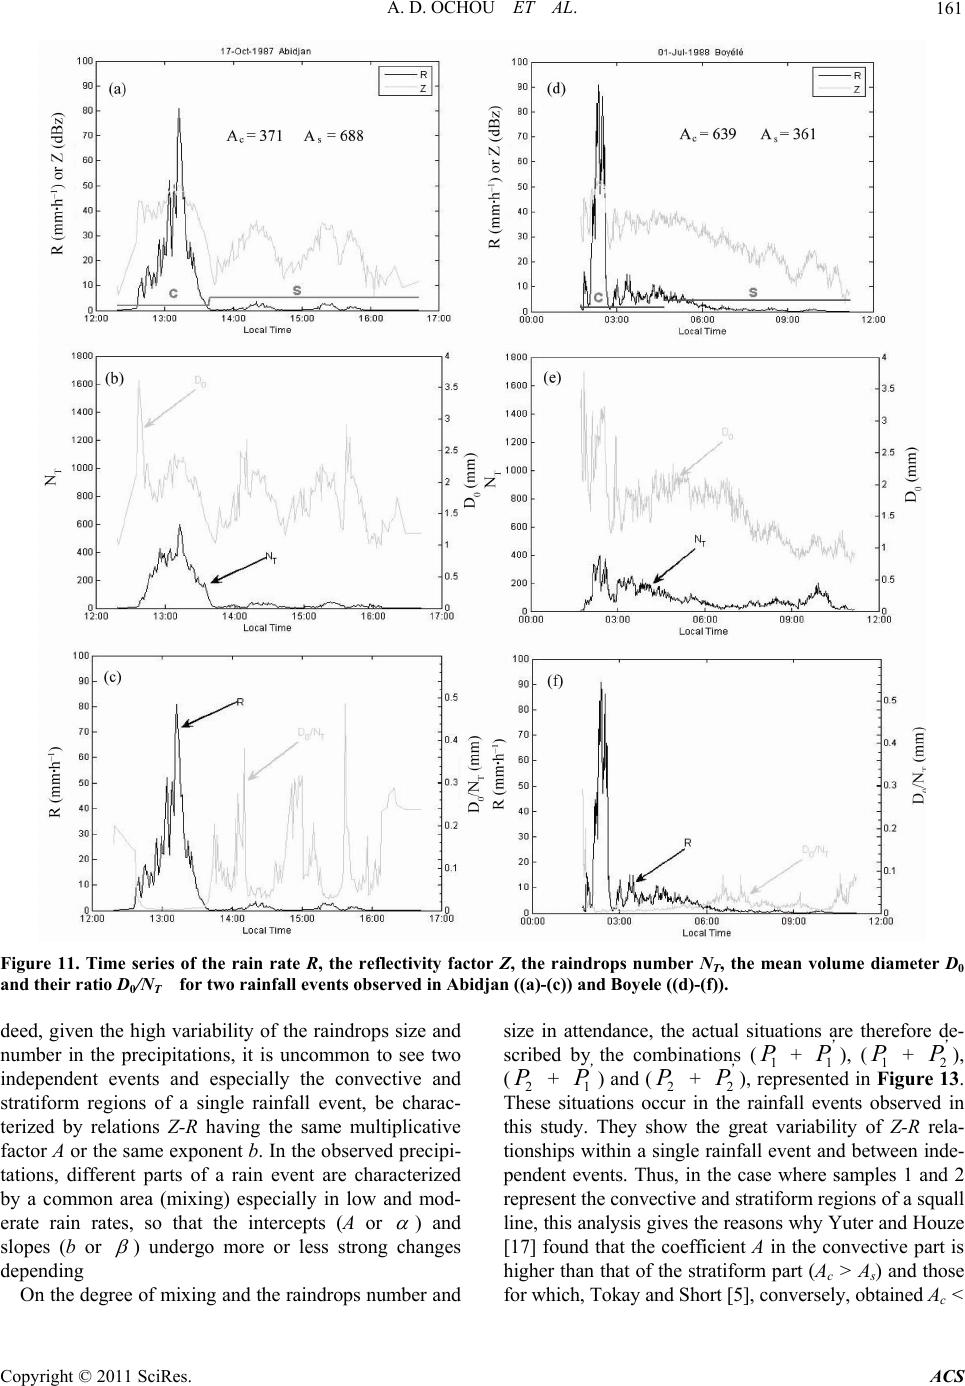 A. D. OCHOU ET AL. Copyright © 2011 SciRes. ACS 161 Figure 11. Time series of the rain rate R, the reflectivity factor Z, the raindrops number NT, the mean volume diameter D0 and their ratio D0/NT for two rainfall events observed in Abidjan ((a)-(c)) and Boyele ((d)-(f)). deed, given the high variability of the raindrops size and number in the precipitations, it is uncommon to see two independent events and especially the convective and stratiform regions of a single rainfall event, be charac- terized by relations Z-R having the same multiplicative factor A or the same exponent b. In the observed precipi- tations, different parts of a rain event are characterized by a common area (mixing) especially in low and mod- erate rain rates, so that the intercepts (A or ) and slopes (b or ) undergo more or less strong changes depending On the degree of mixing and the raindrops number and size in attendance, the actual situations are therefore de- scribed by the combinations (1 P + 1 P’ ), (1 P + 2 P’ ), (2 P + 1 P’ ) and (2 P + 2 P’ ), represented in Figure 13. These situations occur in the rainfall events observed in this study. They show the great variability of Z-R rela- tionships within a single rainfall event and between inde- pendent events. Thus, in the case where samples 1 and 2 represent the convective and stratiform regions of a squall line, this analysis gives the reasons why Yuter and Houze [17] found that the coefficient A in the convective part is higher than that of the stratiform part (Ac > As) and those for which, Tokay and Short [5], conversely, obtained Ac < 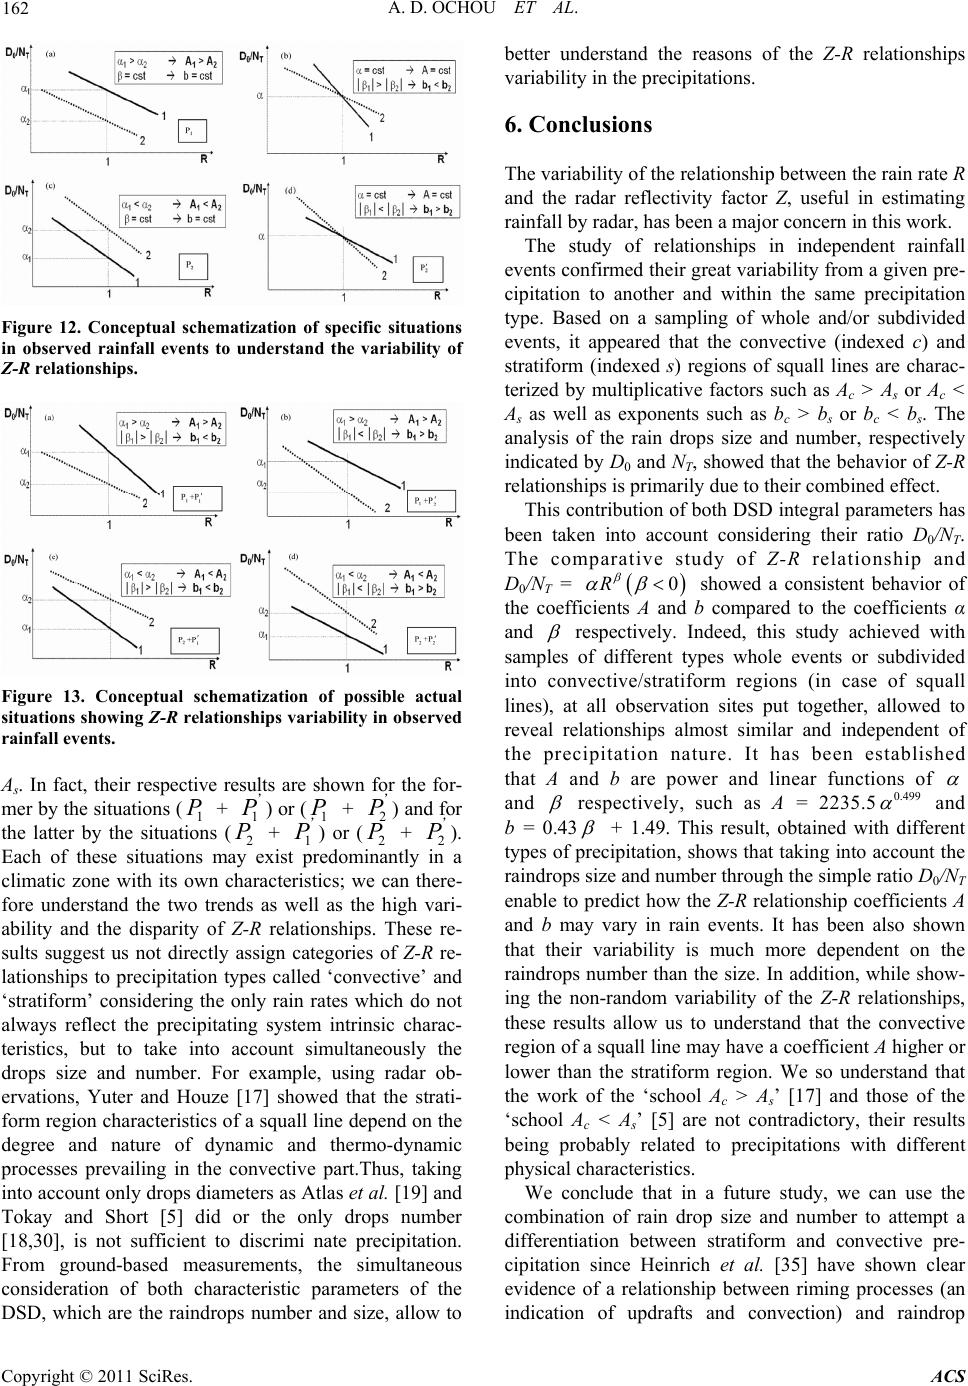 A. D. OCHOU ET AL. Copyright © 2011 SciRes. ACS 162 Figure 12. Conceptual schematization of specific situations in observed rainfall events to understand the variability of Z-R relationships. Figure 13. Conceptual schematization of possible actual situations showing Z-R relationships variability in observed rainfall events. As. In fact, their respective results are shown for the for- mer by the situations (1 P + 1 P’ ) or (1 P + 2 P’ ) and for the latter by the situations (2 P + 1 P’ ) or (2 P + 2 P’ ). Each of these situations may exist predominantly in a climatic zone with its own characteristics; we can there- fore understand the two trends as well as the high vari- ability and the disparity of Z-R relationships. These re- sults suggest us not directly assign categories of Z-R re- lationships to precipitation types called ‘convective’ and ‘stratiform’ considering the only rain rates which do not always reflect the precipitating system intrinsic charac- teristics, but to take into account simultaneously the drops size and number. For example, using radar ob- ervations, Yuter and Houze [17] showed that the strati- form region characteristics of a squall line depend on the degree and nature of dynamic and thermo-dynamic processes prevailing in the convective part.Thus, taking into account only drops diameters as Atlas et al. [19] and Tokay and Short [5] did or the only drops number [18,30], is not sufficient to discrimi nate precipitation. From ground-based measurements, the simultaneous consideration of both characteristic parameters of the DSD, which are the raindrops number and size, allow to better understand the reasons of the Z-R relationships variability in the precipitations. 6. Conclusions The variability of the relationship between the rain rate R and the radar reflectivity factor Z, useful in estimating rainfall by radar, has been a major concern in this work. The study of relationships in independent rainfall events confirmed their great variability from a given pre- cipitation to another and within the same precipitation type. Based on a sampling of whole and/or subdivided events, it appeared that the convective (indexed c) and stratiform (indexed s) regions of squall lines are charac- terized by multiplicative factors such as Ac > As or Ac < As as well as exponents such as bc > bs or bc < bs. The analysis of the rain drops size and number, respectively indicated by D0 and NT, showed that the behavior of Z-R relationships is primarily due to their combined effect. This contribution of both DSD integral parameters has been taken into account considering their ratio D0/NT. The comparative study of Z-R relationship and D0/NT = 0R showed a consistent behavior of the coefficients A and b compared to the coefficients α and respectively. Indeed, this study achieved with samples of different types whole events or subdivided into convective/stratiform regions (in case of squall lines), at all observation sites put together, allowed to reveal relationships almost similar and independent of the precipitation nature. It has been established that A and b are power and linear functions of and respectively, such as A = 2235.5 0.499 and b = 0.43 + 1.49. This result, obtained with different types of precipitation, shows that taking into account the raindrops size and number through the simple ratio D0/NT enable to predict how the Z-R relationship coefficients A and b may vary in rain events. It has been also shown that their variability is much more dependent on the raindrops number than the size. In addition, while show- ing the non-random variability of the Z-R relationships, these results allow us to understand that the convective region of a squall line may have a coefficient A higher or lower than the stratiform region. We so understand that the work of the ‘school Ac > As’ [17] and those of the ‘school Ac < As’ [5] are not contradictory, their results being probably related to precipitations with different physical characteristics. We conclude that in a future study, we can use the combination of rain drop size and number to attempt a differentiation between stratiform and convective pre- cipitation since Heinrich et al. [35] have shown clear evidence of a relationship between riming processes (an indication of updrafts and convection) and raindrop  A. D. OCHOU ET AL. Copyright © 2011 SciRes. ACS 163 spectra’s intrinsic integrated parameters namely the in- tercept parameter N0 of an exponential model fitting ob- served DSD and the median volume diameter, D0. 7. Acknowledgements The authors are grateful to all of those who contributed to the data set used in this study. Greatly appreciated are the advice, detailed comments on the manuscript and discussions with Prof. Henri Sauvageot. We are also grateful to the PASRES for their financial contribution. 8. References [1] J. S. Marshall and W. M. K. Palmer, “The Distribution of Raindrops with Size,” Journal of Meteorology, Vol. 5, No. 51948, pp. 165-166. doi:10.1175/1520-0469(1948)005<0165:TDORWS>2.0. CO;2 [2] J. Joss and A. Waldvogel, “Raindrop Size Distribution and Doppler Velocities,” Proceedings of the 14th Radar Meteorology Conference, Boston, 1970, pp. 153-156. [3] P. T. Willis, “Functional Fit to Some Observed Drop Size Distributions and Parameterization of Rain,” Journal of the Atmospheric Sciences, Vol. 41, No. 9, 1984, pp. 1648-1661. doi:10.1175/1520-0469(1984)041<1648:FFTSOD>2.0.C O;2 [4] H. Sauvageot and J. P. Lacaux, “The Shape of Averaged Drop Size Distributions,” Journal of the Atmospheric Sciences, Vol. 52, No. 8, 1995, pp. 1070-1083. doi:10.1175/1520-0469(1995)052<1070:TSOADS>2.0.C O;2 [5] A. Tokay and D. A. Short, “Convective vs Stratiform Rain in the West Pacific during TOGA COARE: Evi- dence from Raindrop Spectra,” Journal of Applied Mete- orology, Vol. 35, No. 3, 1996, pp. 355-371. doi:10.1175/1520-0450(2001)040<1118:TCONDT>2.0.C O;2 [6] J. Testud, S. Oury, R. A. Black, P. Amayenc and X. Dou, “The Concept of Normalized Distribution to Describe Raindrop Spectra: A Tool for Cloud Physics and Cloud Remote Sensing,” Journal of Applied Meteorology, Vol. 40, No. 6, 2001, pp. 1118-1140. doi:10.1175/1520-0450(2001)040<1118:TCONDT>2.0.C O;2 [7] M. Maki, T. D. Keenam, Y. Sasaki and K. Nakamura, “Characteristics of the Raindrop Size Distribution in Tropical Continental Squall Lines Observed in Darwin, Australia,” Journal of Applied Meteorology, Vol. 40, No. 8, 2001, pp. 1393-1412. doi:10.1175/1520-0450(2001)040<1393:COTRSD>2.0.C O;2 [8] R. Uijlenhoet, J. A. Smith and M. Steiner, “The Micro- physical Structure of Extreme Precipitation as Inferred from Ground-Based Raindrop Spectra,” Journal of the Atmospheric Sciences, Vol. 60, No. 10, 2003, pp. 1220- 1238. doi:10.1175/1520-0469(2003)60<1220:TMSOEP>2.0.C O;2 [9] R. Uijlenhoet, M. Steiner and J. A. Smith, “Variability of Raindrop Size Distributions in a Squall Line and Implica- tions for Radar Rainfall Estimation,” Journal of Hydro- meteorology, Vol. 4, No. 1, 2003, pp. 43-61. doi:10.1175/1525-7541(2003)004<0043:VORSDI>2.0.C O;2 [10] G. W. Lee and I. Zawadzki, “Variability of drop size distributions: Time-Scale Dependence of the Variability and its Effects on Rain Estimation,” Journal of Applied Meteorology, Vol. 44, No. 2, 2005, pp. 241-255. doi:10.1175/JAM2183.1 [11] A. Nzeukou, H. Sauvageot, A. D. Ochou and C. M. F. Kebe, “Raindrop Size Distribution and Radar Parameters at Cape Verde,” Journal of Applied Meteorology, Vol. 43, No. 1, 2004, pp. 90-105. doi:10.1175/1520-0450(2004)043<0090:RSDARP>2.0.C O;2 [12] S. Moumouni, M. Gosset, E. Houngninou, “Main Fea- tures of Rain Drop Size Distributions Observed in Benin, West Africa, with Optical Disdrometers,” Geophysical Research Letters, Vol. 35, 2008, L23807. doi:10.1029/2008GL035755 [13] L. J. Battan, “Radar Observation of the Atmosphere,” University of Chicago Press, Chicago, 1973. [14] B. Russell, E. R. Williams, M. Gosset, F. Cazenave, L. Descroix, N. Guy, T. Lebel, A. Ali, F. Metayer and G. Quantin, “Radar Rain-Gauge Comparisons on Squall Lines in Niamey, Niger for the AMMA,” Quarterly Journal of the Royal Meteorological Society, Vol. 136, No. S1, 2010, pp. 290-304. doi:10.1002/qj.548 [15] A. D. Ochou, “Variabilité Spatio-Temporelle des Mo- ments Statistiques des Distributions des Gouttes de Pluie et Conséquences sur la Mesure des Précipitations par Té- lédétection Micro-Ondes,” Ph.D. Dissertation, Université Cocody-Abidjan, Abidjan, 2003. [16] M. Steiner, J. A. Smith and R. Uijlenhoet, “A Micro- physical Interpretation of Radar Reflectivity-Rain Rate Relationships,” Journal of the Atmospheric Sciences, Vol. 61, No. 10, 2004, pp. 1114-1131. doi:10.1175/1520-0469(2004)061<1114:AMIORR>2.0.C O;2 [17] S. E. Yuter and R. A. Houze, “Measurements of Raindrop Size Distribution over the Pacific Warm Pool and Im- plementations for Z-R Relations,” Journal of Applied Meteorology, Vol. 36, No. 7, 1997, pp. 847-867. doi:10.1175/1520-0450(1997)036<0847:MORSDO>2.0. CO;2 [18] A. Tokay, D. A. Short, C. R. Williams, W. L. Ecklund and K. S. Gage, “Tropical Rainfall Associated with Con- vective and Stratiform Clouds: Intercomparison of Dis- drometer and Profiler Measurements,” Journal of Applied Meteorology, Vol. 38, No. 3, 1999, pp. 302-320. doi:10.1175/1520-0450(1999)038<0302:TRAWCA>2.0. CO;2 [19] D. Atlas, C. W. Ulbrich, F. D. Marks Jr., E. Amitai and C. R. Williams, “Systematic Variation of Drop Size and  A. D. OCHOU ET AL. Copyright © 2011 SciRes. ACS 164 Radar-Rainfall Relations,” Journal of Geophysical Re- search, Vol. 104, No. D6, 1999, pp. 6155-6169. doi:10.1029/1998JD200098 [20] D. Atlas, C. W. Ulbrich, F. D. Marks Jr., R. A. Black, E. Amitai, P. T. Willis and C. E. Samsury, “Partitioning Tropical Oceanic Convective and Stratiform Rains by Draft Strength,” Journal of Geophysical Research, Vol. 105, No. D2, 2000, pp. 2259-2267. doi:10.1029/1999JD901009 [21] C. W. Ulbrich and D. Atlas, “On the Separation of Tropical Convective and Stratiform Rains,” Journal of Applied Meteorology, Vol. 41, No. 2, 2002, pp. 188-195. doi:10.1175/1520-0450(2002)041<0188:OTSOTC>2.0.C O;2 [22] T. Narayana Rao, D. Narayana Rao and K. Mohan, “Classification of Tropical Precipitating Systems and Associated Z-R Relationships,” Journal of Geophysical Research, Vol. 104, 2001, pp. 17699-17711. [23] D. Rosenfeld and C. W. Ulbrich, “Cloud Microphysical Properties, Processes, and Rainfall Estimation Opportuni- ties. Radar and Atmospheric Science: A Collection of Essays in Honor of David Atlas,” Meteorological Mono- graphs, the American Meteorological Society, Boston, No. 52, 2003, pp. 237-258. [24] J. W. F. Goddard and S.M. Cherry, “The Ability of Dual Polarization Radar (Co-Polar Linear) to Predict Rainfall Rate and Microwave Attenuation,” Radio Science, Vol. 19, No. 1, 1984, pp. 201-208. doi:10.1029/RS019i001p00201 [25] N. Balakrishnan, D. S. Zrnic, J. Goldhirsh and J. Row- land, “Comparison of Simulated Rain Rate from Disdro- meter Data Employing Polarimetric Radar Algorithms,” Journal of Atmospheric and Oceanic Technology, Vol. 6, No. 3, 1989, pp. 476-486. doi:10.1175/1520-0426(1989)006<0476:COSRRF>2.0.C O;2 [26] J. Joss and A. Waldvogel, “Raindrop Size Distribution and Sampling Size Errors,” Journal of the Atmospheric Sciences, Vol. 26, No. 3, 1969, pp. 566-569. doi:10.1175/1520-0469(1969)026<0566:RSDASS>2.0.C O;2 [27] D. Atlas, R. C. Srivastava and R. S. Sekhon, “Doppler Radar Characteristics at Vertical Incidence,” Reviews of Geophysics, Vol. 11, No. 1, 1973, pp. 1-35. doi:10.1029/RG011i001p00001 [28] R. A. Houze Jr., “Cloud Dynamics,” Academic Press, New York, 1993. [29] M. Steiner, R. A. Houze Jr. and S. E. Yuter, “Clima- tological Characterization of Three-Dimensional Storm Structure from Operational Radar and Rain Gauge Data,” Journal of Applied Meteorology, Vol. 34, No. 9, 1995, pp. 1978-2007. doi:10.1175/1520-0450(1995)034<1978:CCOTDS>2.0.C O;2 [30] A. Waldvogel, “The N0 Jump of Raindrop Spectra,” Journal of the Atmospheric Sciences, Vol. 31, No. 4, 1974, pp. 1068-1078. doi:10.1175/1520-0469(1974)031<1067:TJORS>2.0.CO; 2 [31] M. Gosset, E.-P. Zahiri and S. Moumouni, “Rain Drop Size Distribution Variability and Impact on X-Band Po- larimetric Radar Retrieval: Results from the AMMA Campaign in Benin,” Quarterly Journal of the Royal Me- teorological Society, Vol. 136, No. S1, 2010, pp. 243-356. doi:10.1002/qj.556 [32] R. Uijlenhoet, “Raindrop Size Distributions and Radar Reflectivity-Rain Rate Relationships for Radar Hydrol- ogy,” Hydrology and Earth System Sciences, Vol. 5, No. 4, 2001, pp. 615-627. [33] C. W. Ulbrich and D. Atlas, “Radar Measurements of Rainfall with and without Polarimetry,” Journal of Ap- plied Meteorlogy Climate, Vol. 31, No. 4, 2008, pp. 1067-1078. doi:10.1175/2007JAMC1804.1. [34] V. Chandrasekar, R. Meneghini and I. Zawadzki, “Global and Local Precipitation Measurements by Radar. Radar and Atmospheric Science: A collection of Essays in honor of David Atlas,” Meteorology Monograohy, No. 52, American Meteorology Society, 2003, pp. 215-236. [35] W. J. Heinrich, J. Joss and A. Waldvogel, “Raindrop Size Distributions and the Radar Bright Band,” Journal of Ap- plied Meteorology, Vol. 35, No. 10, 1996, pp. 1688-1701. doi:10.1175/1520-0450(1996)035<1688:RSDATR>2.0.C O;2 [36] C. W. Ulbrich and D. Atlas, “Microphysics of Raindrop Size Spectra: Tropical Continental and Maritime Storms,” Journal of Applied Meteorology and Climatology, Vol. 46, No. 11, 2007, pp. 1777-1791. doi:10.1175/2007JAMC1649.1 [37] A. D. Ochou, A. Nzeukou and H. Sauvageot, “Pa- rametrization of Drop Size Distribution with Rain Rate,” Atmospheric Research, Vol. 84, No. 1, 2007, pp. 58-66. doi:10.1016/j.atmosres.2006.05.003
|