Journal of Materials Science and Chemical Engineering
Vol.03 No.12(2015), Article ID:61959,13 pages
10.4236/msce.2015.312009
Controlling and Evaluating the Structure and Morphology of Polymers on Multiple Scales
Geoffrey R. Mitchell1*, Ana Tojeira1, Thomas Gkourmpis2, James J. Holt3, Peter Harris4, Marilena Pezzuto5
1Centre for Rapid and Sustainable Product Development, Institute Polytechnic of Leiria, Marinha Grande, Portugal
2Innovation & Technology, Borealis AB, Stenungsund, Sweden
3Department of Physics, University of Reading, Whiteknghts, Reading, UK
4Centre for Advanced Microscopy, University of Reading, Whiteknights, Reading, UK
5CNR-Istituto di Chimica e Tecnologia dei Polimeri, Pozzuoli, Italy


Received 11 November 2015; accepted 10 December 2015; published 17 December 2015

ABSTRACT
Crystalline polymers spontaneously form hierarchical structures although the precise manner in which these scales of structure are interconnected especially terms of the formation and evolution of the complete structure remains unclear. We have set out to control these scales of structure by introducing additional components which self-assemble in to nano-scale units which then direct the crystallisation of the polymer matrix. In other words, we first assemble a low concentration top-level structure which is designed to template or direct the sub-sequent crystallisation of the matrix polymer. This top level structure takes on the role of controlling the structure. We have set out to both establish the design principles of such structures and to develop experimental proce- dures which allow us to follow the formation of such complex hierarchical polymer structures. In particular we focus of the relationships between these different levels of structure and time sequence of events required for the structure to evolve in the targeted manner. In this programme, we have exploited time-resolving small-angle X-ray scattering and electron microscopy together with neutron scattering to probe and quantify the different scales of structure and their evolution. We highlight new neutron scattering instrumentation which we believe have great potential in the growing field of hierarchical structures in polymers. The addition of small quantities of nanopar- ticles to conventional and sustainable thermoplastics leads to property enhancements with con- siderable potential in a number of areas Most engineered nano-particles are highly stable and these exist as nano-particles prior to compounding with the polymer resin, they remain as nano-particles during the active use as well as in the subsequent waste and recycling streams. In this work we also explore the potential for constructing nano-particles within the polymer matrix during processing from organic compounds selected to provide nanoparticles which can effec- tively control the subsequent crystallization process. Typically these nano-particles are rod-like in shape.
Keywords:
Component, Semi-Crystalline Polymers, Morphology, Texture, Nucleation, Growth, Shear Flow

1. Introduction
The properties of polymer products depend as much on the skill and expertise of the polymer processor as they do on the ingenuity of the polymer maker. The long chain nature of polymers means that a variety of structures are possible and this contribution addresses how we can control this on multiple scales. We will focus our attention on semi-crystalline polymers as these make up the vast majority of thermoplastic used in traditional manufacturing and in emerging technologies such as 3D printing and other Direct Digital Manufacturing techniques.
2. Crystallisation and Flow
Shaping polymers in to useful products involves starting with a liquid polymer, usually in the form of a molten polymer, placing this in a mould or other shaping process such as extrusion or spinning and generating a shaped polymer solid by reducing the temperature so that the material crystallises (eg polyethylene, polypropylene, poly (e-caprolactone)) or forms a glass (polystyrene, polymethylmethacrylate). For completeness, we note that processes such as reaction injection moulding (Mitchell 2013) involve solidification through the use of reactions to raise the vitrification temperature to above room temperature. Thus flow and solidification are intimately linked in polymer processing. It is well established that under sufficiently vigorous flow conditions, that long chain molecules of crystallisable polymers become extended in the flow field, easily for extensional flow, weakly in the case of shear flow and these extended chains may act as row nuclei for subsequent chain folded lamellar crystal growth which grow out from this central core with a high degree of common lamellar orientation. The level of extension and orientation and the subsequent crystallization and morphology profile depend on the chain conformation, with linear or near linear polymers with limited level of branching being easier to orient than heavily branched polymers with long and multiple branches. Figure 1 shows the small-angle neutron scattering pattern for a mixture of deuterated branched polyethylene and hydrogenated linear polyethylene. The lev- el of anisotropy is very low and it is difficult to discern such anisotropy from a visual inspection of the pattern. A quantitative analysis [5] gives a level of preferred orientation,

Figure 1. Small-angle neutron pattern of a polyethylene blend subjected to a shear flow of 10 s−1 in the melt phase. The flow direction is vertical on the page. The pattern display corresponds to a Q range parallel and perpendicular to the flow direction of ±0.10 Å−1.
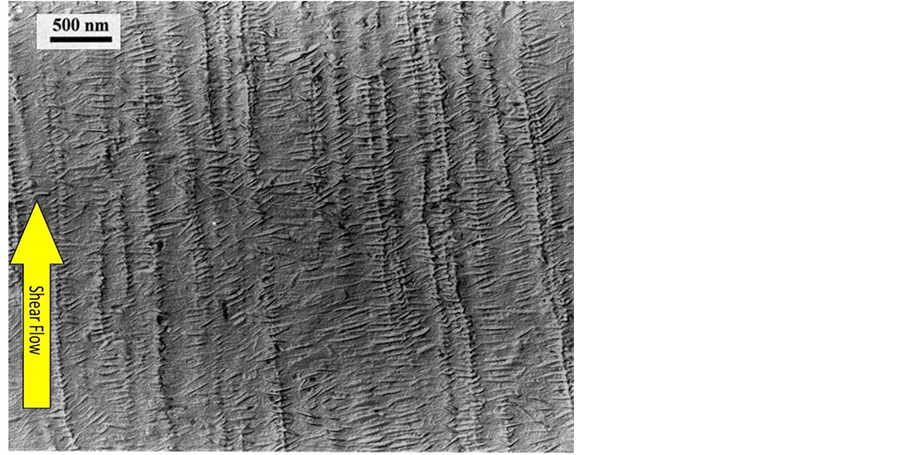
Figure 2. A transmission electron micrograph of a replica of a differentially etched [3] surface of a polyethylene blend crystallised after being subjected to the same shear history as for the sample shown in Figure 1.
the level of orientation in Figure 2 is >90%. In other words, crystallization has resulted in a huge amplification of the anisotropy (~1%) which developed in the melt during processing. Moreover, we can speculate that in the melt only the longest linear chains develop any level of anisotropy, whereas from Figure 2 it is clear that all the blend including both linear and branched components have been templated by the initial anisotropy. This is confirmed in the work of An et al. [1] using thermal analysis and microscopy techniques.
In the example shown above the ability to define the morphology of the whole sample by the simple means of extending a small fraction of the longest chains raises the possibility of using nanoparticles to achieve the same end. Of course such an approach would not require a high molecular weight polymer and this it decouples the process of developing orientation from the polymer. In this work we explore such a possibility using carbon nanoparticles in the form of carbon nanotubes and graphene flakes and self-asembling nanoparticles.
3. Experimental
We have used in-situ small-angle X-ray scattering (SAXS) and small-angle neutron scattering (SANS) procedures in conjunction with a special shear cell (Figure 3) to characterise the structure of the materials we have used. The sample is held between two thin mica discs supported on slotted metal plates within a small oven equipped with electrical heaters and a refrigerated gas cooling system. This temperature control system provided defined heating rates up to 20˚C/min and cooling rates up to 10˚C/min. This flow system allows X-ray and neutron scattering experiments to be performed during and following controlled shear flow. The incident X-ray beam lies normal to the plane of the sample and to the flow direction. Time resolved X-ray scattering experiments were performed on the I22 beam-line at the Diamond Light Source (UK) using a beam ~0.3 mm diameter.
The beam size defines the range of shear rates effectively sampled within the parallel plate cell which is ~±2% of the stated value. Small-angle X-ray scattering (SAXS) data were recorded using a 2-D detector which allowed data to be accumulated in the range |Q| ~ 0.01 to 0.2 Å−1, (|Q| = 4πsinθ/λ where λ is the incident wavelength and 2θ is the scattering angle). The data accumulation time was 10s for the time-resolving experiments. An ionisation chamber prior to the shear cell enabled the incident beam intensity variations to be measured and factored in to the analysis. The correction to account for the interception of the X-ray beam by the rotating spokes was established by calibration. The invariant is calculated from the azimuthually averaged data by evaluating the Q2 weighted integral which is directly related to the average of the square of the electron density differences. In the case of crystals within an amorphous matrix if the density difference is constant then the invariant is proportional to the volume fraction of crystals.
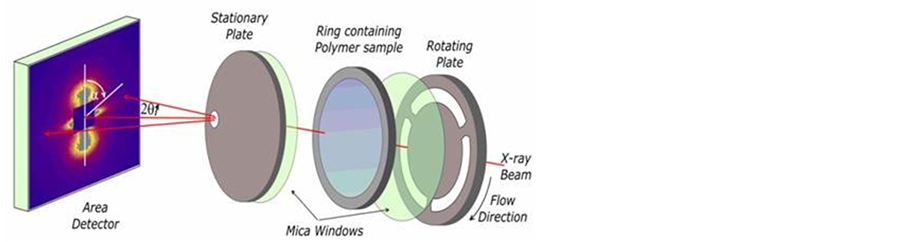
Figure 3. A schematic of the shear cell used for in-situ time-resolving small-angle X-ray scattering procedures. The same shear cell was used to obtain the SANS data shown in Figure 1.
The same shear cell was used for the in-situ SANS experiments but with a 2 mm diameter beam meaning agreaterspread of shear rates within the sample volume [5]. The Shear cell was mounted on LOQ at the pulsed neutron sources ISIS. Data accummulation times were 1800 s. The scattering from the cell was subtracted using the Colette Software and scaled to absolute units using standard polymer samples as described by King [6].
Polyethylene samples were based on blends of linear polyethylene and branched low density polyethylene, the latter was supplied by Borealis Polymers, and was characterised by molecular masses; Mw = 76,800 and Mn = 11,300 Daltons and a branching fraction of 0.06. For the SANS measurements we replaced this hydrogenated polyethylene with a deuterated equivalent obtained by deuterating a copolymer of 1.4 butadiene and 1.2 butadiene. This was supplied by Polymer Source. The ratio of 1.2 to 1.4 was selected to be the same as the branching ratio in the hydrogenated material. The linear material was supplied by BP Chemicals, and exhibited a broad molecular mass range, with Mw = 312,000 and Mn = 33,000 Daltons. All the blend samples were prepared by solution processing, using xylene at 140˚C as a co-solvent, and then recovered by precipitation in an excess of cold methanol, followed by filtration and vacuum drying.
Poly (ε-caprolactone) was supplied by Aldrich and had a molecular weight of 80,000 Daltons. Mixtures with small amounts of carbon nanotubes or graphene flakes were obtained using melt mixing. Carbon nanotubes were obtained from SES Research and Graphene flakes were obtained from Graphene Supermarket in the form of 10 nm flakes.
The nanoparticles were examined in the transmission electron microscope (JEOL 2010) operating at 200 kV equipped with an AMT digital camera by dispersing the particles on to lacey carbon grid using ethanol.
4. Directing Crystallisation Using Nanoparticles
Figure 4 shows a bright field image of the nanotubes used in this work. These were dispersed in the PCL by melt mixing at 80˚C. The resultant mixture melt was moulded in to a disc to mount in the shear cell. This was heated to 80˚C at a rate of 20˚C /min and held at that temperature for 300 s. It was then sheared with a shear rate of 10 s−1 for 1000 shear units (shear rate x time). Immediately after cessation of shear flow, the sample was cooled to room temperature at a rate of 10˚C/min. Figure 5 shows the small-angle X-ray scattering pattern obtained. This reveals a very high level of lamellar orientation in which the lamellar crystals are arranged normal to the flow direction. We attribute this to the alignment of the carbon nanotubes in the melt phase under shear flow parallel to the flow direction and those aligned carbon nanotubes acting as row nuclei which template the lamellar growth. It should be noted that the shear flow is performed at temperatures considerably above the crystallization temperature of the PCL matrix and in fact similar experiments performed on the PCL without the carbon nanotubes reveals an isotropic distribution of chain folded lamellae as reported by Wangsoub et al. [7]. This is due to the rapid relaxation of any extended chains produced during the shear flow process. Due to their geometry nanotubes offer an unhindered crystallization template along their axis leading to limited lattice matching for the induction of crystallization. Therefore by offering the entire nanotube surface as crystallization substrate only one nucleation site is needed in order for crystals to grow into disk-like shapes. Therefore the whole process is thermodynamically driven by the need of the crystallization process to grow towards a direction that offers no energetic penalty and no competition from other crystallization sites. This behaviour has been seen in the past for solution-based crystallization that leads to nano-hybrid shish-kebab structures [12]. In our

Figure 4. A transmission electron microscope image of carbon nanotubes. The scale bar corresponds to 100 nm.
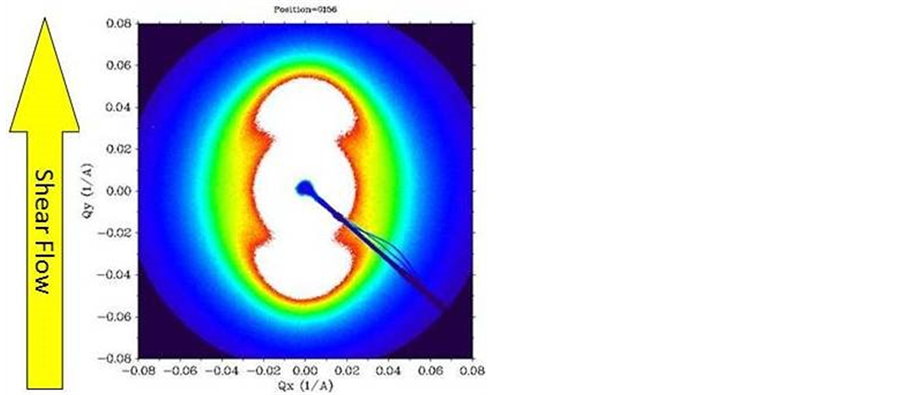
Figure 5. Small-angle X-ray pattern of a PCL with 1% carbon nanotubes subjected to the temperature/flow profile described in the text. The melt shear flow direction is shown by the vertical arrow. The pattern was obtained using BM16 at the ESRF.
system the whole crystallization process is further enhanced by the process of shear although it appears that the initial templating offered by the nanotube surface is retained.
Figure 6 shows the TEM micrograph of 10 nm graphene flakes. The image shows that the lateral size of the flakes is of the order of 1 µm although they are irregularly shaped. These were dispersed in a PCL matrix by melt mixing. The nanocomposites were then shaped in to discs and rings for the two shear cells used. The sample was subjected to the same temperature/flow profile as for the sample of carbon nanotubes and PCL. The SAXS equivalent to that shown in Figure 7 showed a small amount of isotropic scattering.

Figure 6. A transmission electron microscope image of the graphene nanoflakes used. The scale bars corresponds to 1 µm (left) and 10nm (right).
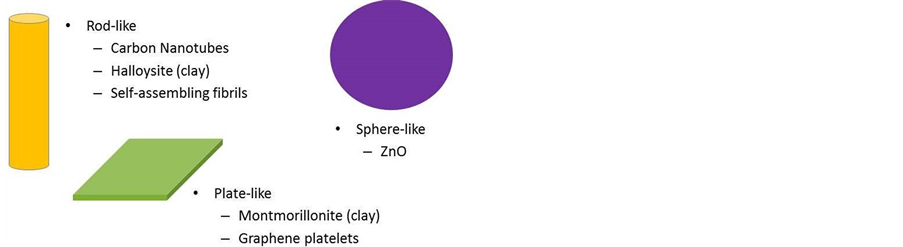
Figure 7. Examples of shapes of nanoparticles widely available from commercial sources [8].
Figure 8 shows the Couette Geometry used to obtain the SAXS pattern shown in Figure 9. This shows a highly anisotropic pattern. The lamellar scattering can be easily seen and this corresponds to lamellar arranged normal to the flow axis. The pattern shows a streak around the beam stop which corresponds to the scattering from the edge-on graphene sheets which are aligned so that the plane of the sheet is parallel to the flow direction and the sheet lies normal to the velocity gradient, that is along a line of constant velocity. Clearly the graphene sheets have aligned in the flow field and template the PCL chain folded lamellar crystals to grow normal to the graphene sheet.
The level of preferred orientation of the PCL crystals achieved by templating with carbon nanotubes is more or less similar to that achieved using the graphene sheets. These large aspect ratio objects are easily aligned in moderate flow fields rather more easily than extending high molecular weight chains in Figure 1 & Figure 2. The two systems together provide a powerful approach to templating or directing the crystallization of PCL. We emphasisethat the shear flow is conducted at temperatures some 40˚C above the crystallization temperature for PCL and the directing provided by the nanoparticles arises because the level of preferred orientation of those particles has not decayed at the time of nucleation and crystallisation. Clearly the relaxation behaviour of the nanoparticles will be rather different to the entropically driven relaxation of extended high molecular chains used in the methodology introduced at the start of this paper.

Figure 8. A photograph of the Couette type cell togetther with a schematic view of the flow field.

Figure 9. Small-angle X-ray pattern of a PCL with 1% subjected to the temperature/flow profile de-scribed in the text. The melt shear flow direction is shown by the vertical arrow. The pattern was obtained using BM16 at the ESRF.
In a similar study using isotactic polypropylene Xu [13] has reported various stages on the shear-flow induced crystallization with lattice matching being the dominant force due the two-dimensional graphitic structure, as seen by the crystallization times, in comparison with the one dimensional structure of the nanotubes. In the case of graphene the chain conformation and its ability to undergo the necessary structural changes minimizing the overall system energy will be of paramount importance with respect to the crystallization occurring in the vicinity or far away from the filler. This has been demonstrated by the difference in crystallization observed in the case of linear [13] and long chain branched polymers [14] [15] where the latter has been seen to crystallise away from the graphitic surface, indicating the role of the molecular weight and branching in the overall crystallization process.
5. Directing Crystallisation Using Self-Assembling Nanoparticles
Small amounts of Dibenzylidene Sorbitol (DBS Scheme 1) (Irgaclear D, Ciba Geigy) (3 wt%) were dispersed in poly(e-caprolactone) (PCL)(Mw = 80,000 Da) by solution blending using butanone as the co-solvent. Discs of PCL, for use in the shear flow experiments, were prepared by melt pressing at 80˚C.
We have used in-situ small-angle X-ray scattering (SAXS) and wide-angle X-ray scattering (WAXS) procedures to characterise the particles which form on cooling from the single phase solution in to the 2 phase region using the shear cell system shown in Figure 3.
Cooling a sample of the DBS/PCL system from a temperature in the single phase high temperature solution in to the biphasic region leads to the formation of DBS crystals. Figure 10 shows a plot of the so-called invariant derived from the SAXS as a function of temperature obtained for a 10% DBS in PCL system which has been cooled at 10˚C/min from the single phase solution. Reading from the high temperature end, the first increase in the invariant corresponds to the formation of nano-particles of DBS and the second increase at much lower temperatures is related to the crystallization of the PCL. If we impose a shear flow on the two phase region we are able to align the nano-particles with the flow direction as shown in Figure 11 and this enables us to estimate the size of the nanoparticles. We find the diameter of the particle is of the order of 15 nm while the length is >1000 nm. Figure 12 shows a WAXS pattern taking at the same time and temperature which clearly shows that the nanoparticles exhibit a highly ordered internal structure.

Scheme 1. Chemical structure of DBS.

Figure 10. A plot of the invariant obtained from SAXS patterns as the sample is cooled from the single phase region to room temperature.

Figure 11. The SAXS pattern for a sample of PCL.

Figure 12. The SAXS pattern for a sample of PCL.
Figure 13 shows part of the phase behaviour for the DBS/PCL system for low concentrations of DBS. This was obtained using in-situ small-angle X?ray and neutron scattering together with differential scanning calorimetry. The upper curve (Figure 13) is the liquidus line separating the higher temperature homogenous solution from the lower temperature two phase region of liquid PCL and crystalline DBS fibrils. The lower line corresponds to the crystallisation temperature of the polymer matrix. This is dependent on the concentration of the DBSas the DBS acts as a nucleating agent. Previouslywe have estimated a solubility of ~1% DBS in PCL at 80˚.
6. Neutron Scattering over Several Length Scales
We use novel neutron scattering instrumentation to follow in a single quantitative time-resolving experiment, the three critical scales of structural and morphological development which accompany the crystallisation of synthetic polymers. These three length scales span 3 orders of magnitude of the scattering vector Q. The study of polymer crystallisation begins with the pioneering experiments of Keller and others who discovered the chain-folded nature of the thin lamellae crystals which are usually found in synthetic polymers. The inherent connectivity or covalent bonding of polymers makes their crystallisation a multiscale transformation. Many studies have been undertaken and much understanding has developed over the intervening fifty years but the process of crystallization in polymers has remained something of a mystery. There are three critical length scales.

Figure 13. Part of the phase diagram for the DBS/PCL system.
The chain folded lamellar thickness is ~10 nm, the crystal unit cell is ~1 nm and the detail of the chain conformation is ~ 0.1 nm. In previous work these length scales have been addressed using different instrumentation or were coupled using compromised geometries. More recently researchers have attempted to exploit coupled time-resolved small-angle and wide-angle X-ray experiments. These turned out to be challenging experiments much related to the challenge of placing the scattering intensity on an absolute scale and the authors failed to rise to these challenges. However, they did stimulate the possibility of new processes in the very earliest stages of crystallisation. Although there is now considerable doubt on such experiments, they drew attention to the basic question as to the process of crystallisation in long chain molecules. We have used NIMROD on the second target station atISIS to follow all three critical length scales in a time-resolving manner for poly (e-caprolactone) [9]. The technique can provide a single set of data from Q = 0.01 to 100Å−1 on the same vertical scale. In Figure 14 we show an example of the data which can be obtained.
These data sets can be treated as individual experiments and a multiscale computational method driven by the experimental data linking the chain conformation to the lamellar orientation is developed [16]. The main principle behind this approach is the possibility to utilize computer generated models to reconstruct the scattering and compare it with the experimentally observed structure factor in a Reverse Monte Carlo approach [17]. By accurately extracting the chain conformation from the high Q scattering region (WANS) [17]-[19] we can reconstruct the polymer structure and build a coarse-grain model to account for the crystal lamellas [20] that can be driven and evaluated by the actual experimental data in a similar manner to the simple case of the amorphous polymer (Figure 15).
7. Direct Digital Manufacturing
Direct Digital Manufacturing is the umbrella name for a family of emerging manufacturing technologies which are able to produce objects from a digital design directly without the need for dedicated moulds or specialist tooling. Foremost amongst these techniques is 3-d printing and fused deposition modelling. Fused deposition modelling (FDM), developed by Stratasys® and commercialised in 1992, uses a thermoplastic filament that is heated above the materials melting temperature in a nozzle where it is further extruded forming a filament. The heated material quickly solidifies and provides enough mechanical support to the part during printing. After completion of each layer, the platform is lowered to enable a new layer deposition. Tojeira and Mitchell have shown that these apparently simple techniques can also lead to highly anisotropic internal morphologies in the printed parts [11] as shown graphically in Figure 16.
8. Summary
We have shown that high levels of preferred orientation of lamellar crystals may be achieved by templating or directing their crystallization using carbon nanotubes or graphene flakes. The geometry of the nanoparticle leads

Figure 14. The SAXS pattern for a sample of PCL in which the crystallization has been directed by the presence of acicular nanoparticles of DBS and a TEM micrograph of the corresponding sample showing the relationship between the nanoparticle and the templated structure.

Figure 15. Total structure factor for poly (ε-caprolactone) in the melt and semi-crystalline phase obtained from NIMROD at ISIS. The different regions of the scattering and the corresponding spatial arrangements of the polymer that give rise to them are shown schematically.

Figure 16. 2D SAXS patterns and the orientation parameter
to different types of alignment in the flow field which leads to a different morphology for the directed chain folded lamellae. These results mirror those obtained using systems containing high molecular fractions which also template the crystallization. We show that similar results can be obtained using self-assembling nanoparticles. This avoids the use of engineered nanoparticles with obvious advantages in food or medical applications. Similar achievements were recorded for 3-d printed parts produced using Direct Digital Manufacturing.
Acknowledgements
This work is supported by the Fundação para a Ciência e a Tecnologia (Portugal). The research leading to these results has received support from the European Community’s Seventh Framework Programme [FP7/2007-2013] under grant agreements n˚ 218331 NaPolyNet and nº 226716. Part of the work has been conducted within the COST FA904 programme The synchrotron work was conducted at the ESRF in Grenoble and at the STFC Diamond Light Source on the Harwell Campus UK and the SANS measurements were made at the ISIS Facility UK and we thank the beamline scientists Francois Fauth at the ESRF, Jen Hiller and Nick Terrill at Diamond and Steve King, Richard Heenam at ISIS for their help with the experiments.
Cite this paper
Geoffrey R. Mitchell,Ana Tojeira,Thomas Gkourmpis,James J. Holt,Peter Harris,Marilena Pezzuto, (2015) Controlling and Evaluating the Structure and Morphology of Polymers on Multiple Scales. Journal of Materials Science and Chemical Engineering,03,48-60. doi: 10.4236/msce.2015.312009
References
- 1. An, Y., Holt, J.J., Mitchell, G.R. and Vaughan, A.S. (2006) Influence of Molecular Composition on the Development of Micro-Structure from Sheared Polyethylene Melts: Molecular and Lamellar Templating. Polymer, 47, 5643-5656. http://dx.doi.org/10.1016/j.polymer.2006.01.097
- 2. Mateus, A., Bartolo, P. and Mitchell, G.R. (2013) Rheology and Reaction Injection Moulding. In: Mitchell, G.R., Ed., Chapter 4 in Rheology Theory, Properties and Practical Applications, Nova Press.
- 3. Olley, R.H. (1986) Science Progress, 70, 17-43.
- 4. Nogales, A., Thornley, S.A. and Mit-chell, G.R. (2004) Shear Cell for In-Situ WAXS, SAXS and SANS Experiments on Polymer Melts under Flow Fields. J Macromol Sci-Physics, B43, 1161-1170. http://dx.doi.org/10.1081/MB-200026521
- 5. Holt, J.J. and Mitchell, G.R. (2002) Unpublished Data.
- 6. King, S.M. (1999) Chapter 7 in Modern Techniques for Polymer Characterisation. In: Pethrick and Dawkins, Eds., Wi-ley.
- 7. Wangsoub, S., Olley, R.H. and Mitchell, G.R. (2005) Directed Crystallisation of Poly(e Caprolactone) Using a Low- Molar-Mass Self-Assembled Template. Macromol Chem Phys, 206, 1826-1839. http://dx.doi.org/10.1002/macp.200500176
- 8. Mitchell, G.R. (2013) Ecosustainable Polymer Nanomaterials for Food Packaging. In: Silvestre, C. and Cimmino, S., Ed., Taylor and Francis.
- 9. Mitchell, G.R., Bowron, D., Mateus, A., Bartolo, P., Gkourmpis, T., Phomphrai, K., Lopez, D. and Davis, F.J. (2013) SANS/WANS Time-Resolving Neutron Scattering Studies of Polymer Phase Transitions Using NIMROD. MRS Proceedings, 1528.
- 10. Tojeira, A. and Mitchell, G.R. (2013) Role of Anisotropy in Tissue Engineering. Procedia Engineering, 59, 117-125. http://dx.doi.org/10.1016/j.proeng.2013.05.100
- 11. Tojeira, A.O., Biscaia, S.S., Viana, T.Q., Sousa, I.S. and Mitchell, G.R. (2016) Controlling the Morphology of Poly- mers: Multiple Scales of Structure and Processing. In: Tojeira, A. and Mitchell, G.R., Eds., Springer.
- 12. Li, L., Li, B., Hood, M.A. and Li, C.Y. (2009) Carbon Nanotube Induced Polymer Crystallization: The Formation of Nanohybrid Shish-Kebabs. Polymer, 50, 953-965. http://dx.doi.org/10.1016/j.polymer.2008.12.031
- 13. Xu, J.Z., Chen, T., Wang, Y., Tang, H., Li, Z.-M. and Hsiao, B.S. (2011) Graphene Nanosheets and Shear Flow Induced Crystallization in Isotactic Polypropylene Nanocomposites. Macromolecules, 44, 2808-2818. http://dx.doi.org/10.1021/ma1028104
- 14. Oxfall, H., Ariu, G., Gkourmpis, T., Rychwalski, R. and Rigdahl, M. (2015) Effect of Carbon Black on Electrical and Rheological Properties of Graphite Nanoplatelets/Poly(Ethylene-Butyl Acrylate) Composites. eXPRESS Polym. Lett., 9, 66-76. http://dx.doi.org/10.3144/expresspolymlett.2015.7
- 15. Gkourmpis, T. (2014) High Aspect Ratio Polymer Nanocomposites. In: Mercader, A.G., Castro, E.A. and Haghi, A.K., Eds., Na-noscience and Computational Chemistry: Research Progress, Apple Academic Press Inc., London.
- 16. Gkourmpis, T., Lopez, D. and Mitchell, G.R. (2013) Multiscale Modeling of Polymers Closely Coupled to Broad Q Neutron Scattering from NIMROD. Mater. Res. Soc. Symp. Proc., 1524. http://dx.doi.org/10.1557/opl.2012.1765
- 17. Mitchell, G.R., Rosi-Schwartz, B. and Ward, D.J. (1994) Local Order in Polymer Glasses and Melts. Phil. Trans. R. Soc. Lond. A, 348, 97-115. http://dx.doi.org/10.1098/rsta.1994.0083
- 18. Gkourmpis, T. and Mitchell, G.R. (2011) Three Dimensional Picture of the Local Structure of 1,4 Polybutadiene from a Complete Atomistic Model and Neutron Scattering Data. Macromolecules, 44, 3140-3148. http://dx.doi.org/10.1021/ma102840p
- 19. Gkourmpis, T. and Mitchell, G.R. (2014) Experimentally Driven Atomistic Model of 1,2 Polybutadiene. J. Appl. Phys., 115, 053505-1-10. http://dx.doi.org/10.1063/1.4863950
- 20. Soper, A.K., Page, K. and Llobet, A. (2013) Empirical Potential Structure Refinement of Semi-Crystalline Polymer Systems: Poly-tetrafluoroethylene and Polychlorotrifluoroethylene. J. Phys. Condens. Mat., 25, 454219-1-11. http://dx.doi.org/10.1088/0953-8984/25/45/454219
NOTES

*Corresponding author.