 Atmospheric and Climate Sciences, 2011, 1, 69-85 doi:10.4236/acs.2011.13008 Published Online July 2011 (http://www.scirp.org/journal/acs) Copyright © 2011 SciRes. ACS 69 Validation of Spectral and Broadband UV-B (290 - 325 nm) Irradiance for Canada Jacqueline Binyamin1, John Davies2, Bruce McArthur3 1University of Winnipeg, Department of Geography, Winnipeg, Canada 2McMaster University, School of Geog raphy and Earth Sciences, Hamilton, Canada 3Meteorological Service of Canada, Air Quality Research Branch, Toronto, Canada E-mail: j.binyamin@uwinnipeg.ca Received March 20, 2011; revised April 27, 2011; accepted May 10, 2011 Abstract Stratospheric ozone depletion, as a result of increasing chlorofluorocarbons in the stratosphere, allows more UV-B irradiance (290 - 325 nm) to reach the earth’s surface with possible detrimental biological effects. Be- cause there are few UV-B radiation stations, irradiance models are useful tools for estimating irradiances where measurements are not made. Estimates of spectral and broadband irradiances from a numerical model are compared with Brewer spectrophotometer measurements at nine Canadian stations (Alert, Resolute Bay, Churchill, Edmonton, Regina, Winnipeg, Montreal, Halifax and Toronto) and 26 years of data. The model uses either the discrete ordinate radiative transfer (DISORT) or the delta-Eddington algorithms to solve the radiative transfer equation for a 49-layer, vertically inhomogeneous, plane-parallel atmosphere, with cloud inserted between the 2 and 3 km heights. Spectral calculations are made at 1 nm intervals. The model uses extraterrestrial spectral irradiance, spectral optical properties for each atmospheric layer for ozone, air mole- cules, and aerosol and surface albedo. A fixed broadband cloud optical depth of 27 was satisfactory for cal- culating cloudy sky irradiances at all stations except in the arctic. Comparisons are made both for daily totals and for monthly averaged spectral and broadband irradiances. The delta-Eddington method is shown to be unsuitable for calculating spectral irradiances under clear skies, at wavelengths less than 305 nm where absorption by ozone is high, and at large solar zenith angles. The er- rors are smaller for overcast conditions. The method is adequate for daily total and monthly averaged spec- tral ( 305 nm) and broadband calculations for all sky conditions, although consistently overestimating ir- radiances. There is a good agreement between broadband measurements and calculations for both daily totals and monthly averages with mean bias error mainly less than 5% of the mean measured daily irradiance and root mean square error less than 25%, decreasing to below 15% for monthly averages. Keywords: Modelling UV-B Radiation, DISORT, Delta-Eddington, Spectral and Broadband Radiation, Brewer Spectrophotometer, UV-B Measurements in Canada 1. Introduction Human made chemicals, including chlorofluorocarbons and other halocarbons, have damaged the stratospheric ozone layer that protects people, plants, and animals from harmful biologically active ultraviolet (UV-B) irradiance. The effective UV-B waveband is from 290 to 325 nm, which is the wavelength range of the Canadian Brewer spectrophotometer measurements. Even though the UV- B band is biologically important, it contains little energy, constituting only 1.8% of the total solar radiation at the top of the atmosphere, and no more than 1% at the earth’s surface [1]. Within the UV-B band the atmosphere becomes more transparent with increasing wavelength since ozone ab- sorption decreases by two orders of magnitude as wave- length increases between 290 - 325 nm [2]. Over this wavelength range the irradiance at the ground may vary through eleven orders of magnitude. Biological effects are not constant across the waveband. In general, the shorter the wavelength is, the greater the biological effect [3]. Therefore, spectral measurements are essential for 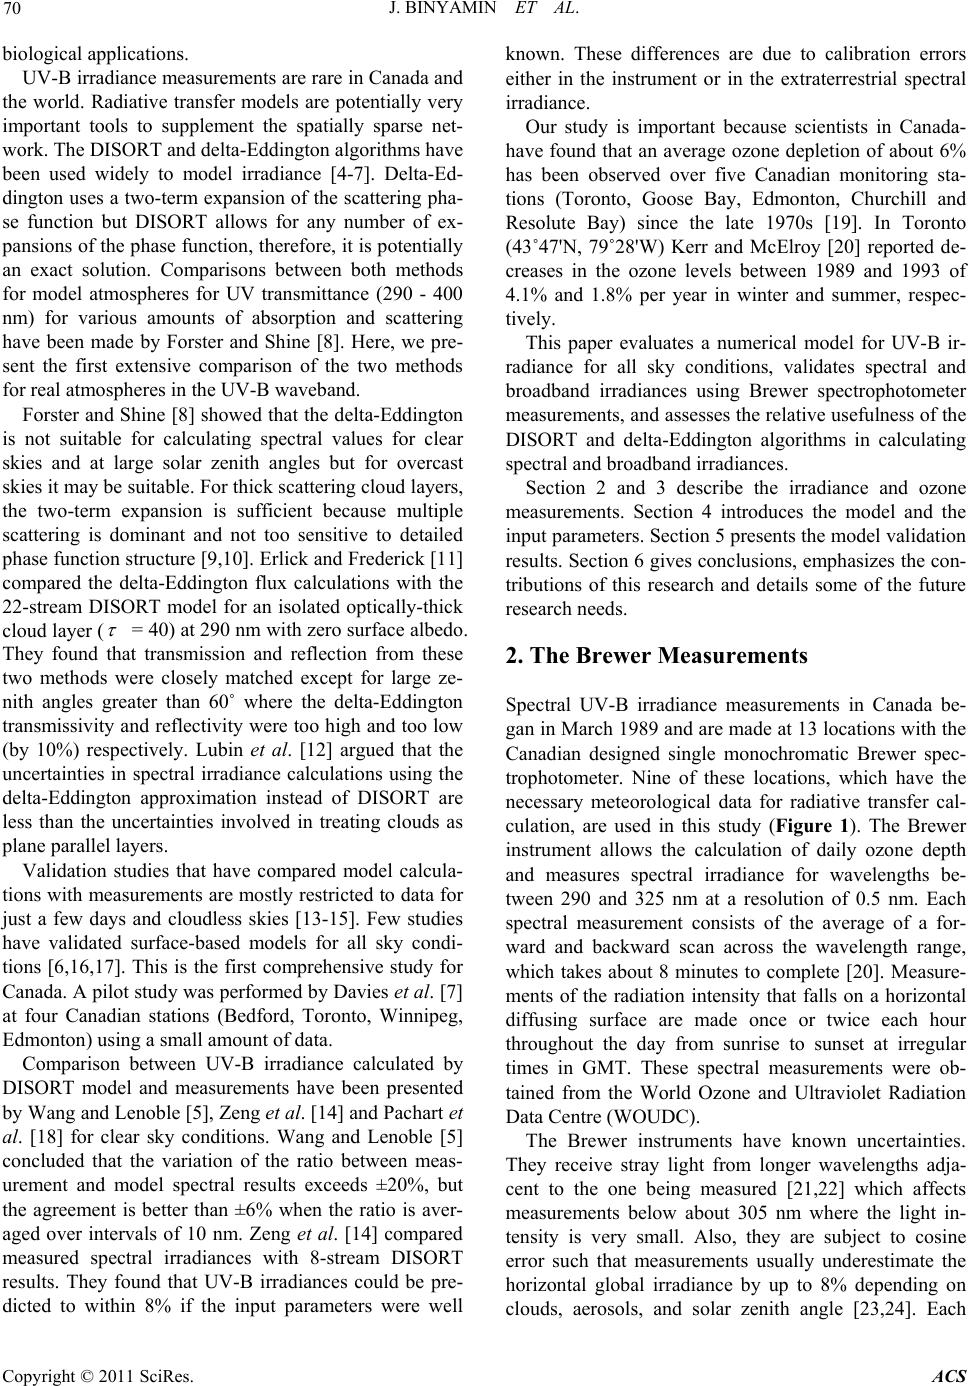 70 J. BINYAMIN ET AL. biological applications. UV-B irradiance measurements are rare in Canada and the world. Radiative transfer models are potentially very important tools to supplement the spatially sparse net- work. The DISORT and delta-Eddington algorithms have been used widely to model irradiance [4-7]. Delta-Ed- dington uses a two-term expansion of the scattering pha- se function but DISORT allows for any number of ex- pansions of the phase function, therefore, it is potentially an exact solution. Comparisons between both methods for model atmospheres for UV transmittance (290 - 400 nm) for various amounts of absorption and scattering have been made by Forster and Shine [8]. Here, we pre- sent the first extensive comparison of the two methods for real atmospheres in the UV-B waveband. Forster and Shine [8] showed that the delta-Eddington is not suitable for calculating spectral values for clear skies and at large solar zenith angles but for overcast skies it may be suitable. For thick scattering cloud layers, the two-term expansion is sufficient because multiple scattering is dominant and not too sensitive to detailed phase function structure [9,10]. Erlick and Frederick [11] compared the delta-Eddington flux calculations with the 22-stream DISORT model for an isolated optically-thick cloud layer ( = 40) at 290 nm with zero surface albedo. They found that transmission and reflection from these two methods were closely matched except for large ze- nith angles greater than 60˚ where the delta-Eddington transmissivity and reflectivity were too high and too low (by 10%) respectively. Lubin et al. [12] argued that the uncertainties in spectral irradiance calculations using the delta-Eddington approximation instead of DISORT are less than the uncertainties involved in treating clouds as plane parallel layers. Validation studies that have compared model calcula- tions with measurements are mostly restricted to data for just a few days and cloudless skies [13-15]. Few studies have validated surface-based models for all sky condi- tions [6,16,17]. This is the first comprehensive study for Canada. A pilot study was performed by Davies et al. [7] at four Canadian stations (Bedford, Toronto, Winnipeg, Edmonton) using a small amount of data. Comparison between UV-B irradiance calculated by DISORT model and measurements have been presented by Wang and Lenoble [5], Zeng et al. [14] and Pachart et al. [18] for clear sky conditions. Wang and Lenoble [5] concluded that the variation of the ratio between meas- urement and model spectral results exceeds ±20%, but the agreement is better than ±6% when the ratio is aver- aged over intervals of 10 nm. Zeng et al. [14] compared measured spectral irradiances with 8-stream DISORT results. They found that UV-B irradiances could be pre- dicted to within 8% if the input parameters were well known. These differences are due to calibration errors either in the instrument or in the extraterrestrial spectral irradiance. Our study is important because scientists in Canada- have found that an average ozone depletion of about 6% has been observed over five Canadian monitoring sta- tions (Toronto, Goose Bay, Edmonton, Churchill and Resolute Bay) since the late 1970s [19]. In Toronto (43˚47'N, 79˚28'W) Kerr and McElroy [20] reported de- creases in the ozone levels between 1989 and 1993 of 4.1% and 1.8% per year in winter and summer, respec- tively. This paper evaluates a numerical model for UV-B ir- radiance for all sky conditions, validates spectral and broadband irradiances using Brewer spectrophotometer measurements, and assesses the relative usefulness of the DISORT and delta-Eddington algorithms in calculating spectral and broadband irradiances. Section 2 and 3 describe the irradiance and ozone measurements. Section 4 introduces the model and the input parameters. Section 5 presents the model validation results. Section 6 gives conclusions, emphasizes the con- tributions of this research and details some of the future research needs. 2. The Brewer Measurements Spectral UV-B irradiance measurements in Canada be- gan in March 1989 and are made at 13 locations with the Canadian designed single monochromatic Brewer spec- trophotometer. Nine of these locations, which have the necessary meteorological data for radiative transfer cal- culation, are used in this study (Figure 1). The Brewer instrument allows the calculation of daily ozone depth and measures spectral irradiance for wavelengths be- tween 290 and 325 nm at a resolution of 0.5 nm. Each spectral measurement consists of the average of a for- ward and backward scan across the wavelength range, which takes about 8 minutes to complete [20]. Measure- ments of the radiation intensity that falls on a horizontal diffusing surface are made once or twice each hour throughout the day from sunrise to sunset at irregular times in GMT. These spectral measurements were ob- tained from the World Ozone and Ultraviolet Radiation Data Centre (WOUDC). The Brewer instruments have known uncertainties. They receive stray light from longer wavelengths adja- cent to the one being measured [21,22] which affects measurements below about 305 nm where the light in- tensity is very small. Also, they are subject to cosine error such that measurements usually underestimate the horizontal global irradiance by up to 8% depending on louds, aerosols, and solar zenith angle [23,24]. Each c Copyright © 2011 SciRes. ACS 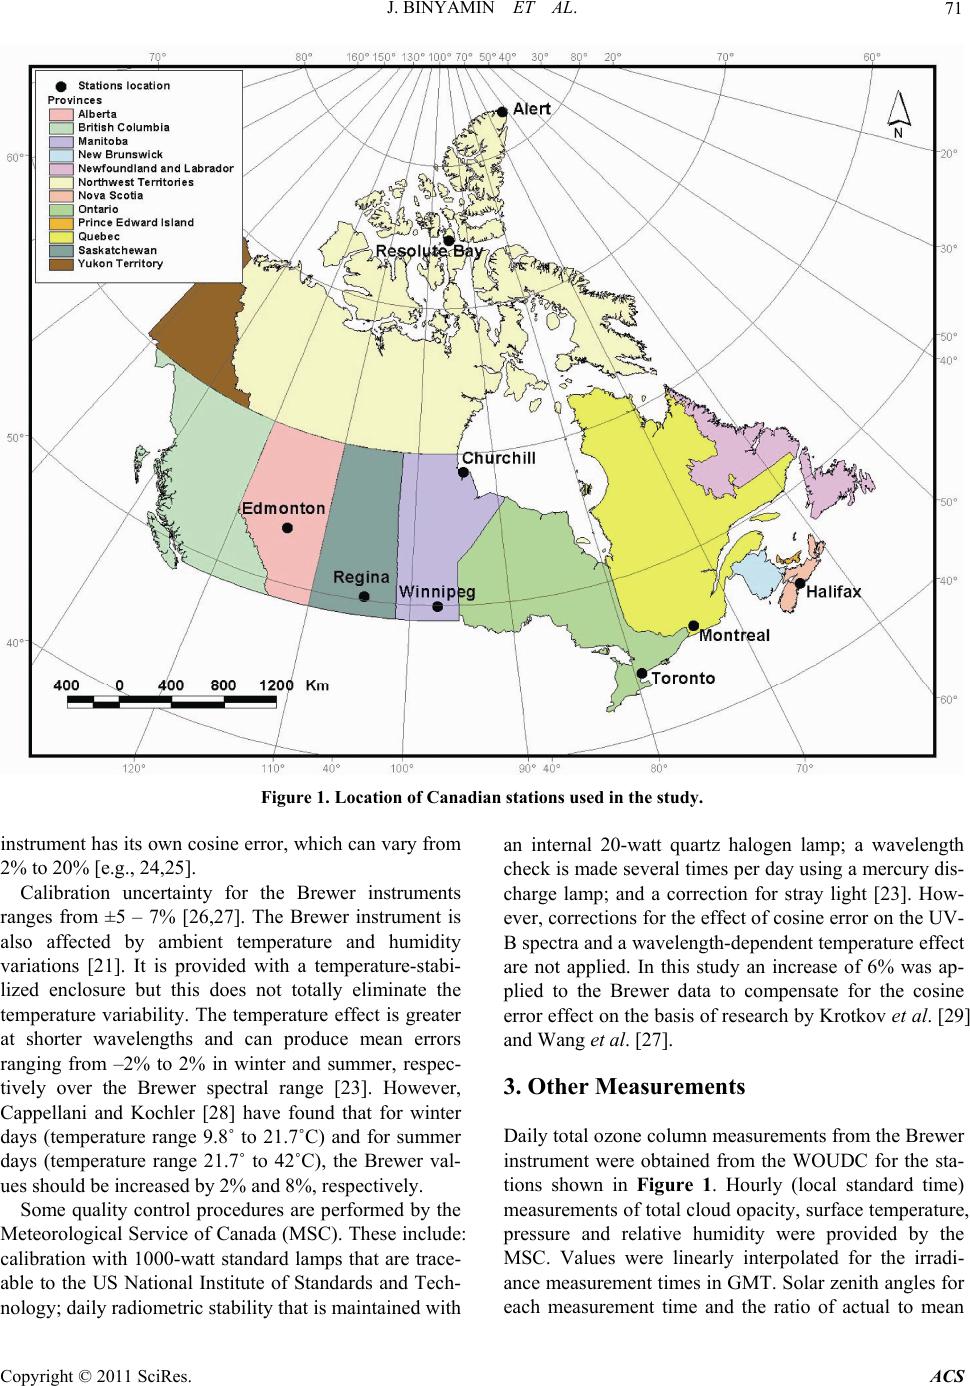 J. BINYAMIN ET AL. Copyright © 2011 SciRes. ACS 71 Figure 1. Location of Canadian stations used in the study. instrument has its own cosine error, which can vary from 2% to 20% [e.g., 24,25]. Calibration uncertainty for the Brewer instruments ranges from ±5 – 7% [26,27]. The Brewer instrument is also affected by ambient temperature and humidity variations [21]. It is provided with a temperature-stabi- lized enclosure but this does not totally eliminate the temperature variability. The temperature effect is greater at shorter wavelengths and can produce mean errors ranging from –2% to 2% in winter and summer, respec- tively over the Brewer spectral range [23]. However, Cappellani and Kochler [28] have found that for winter days (temperature range 9.8˚ to 21.7˚C) and for summer days (temperature range 21.7˚ to 42˚C), the Brewer val- ues should be increased by 2% and 8%, respectively. Some quality control procedures are performed by the Meteorological Service of Canada (MSC). These include: calibration with 1000-watt standard lamps that are trace- able to the US National Institute of Standards and Tech- nology; daily radiometric stability that is maintained with an internal 20-watt quartz halogen lamp; a wavelength check is made several times per day using a mercury dis- charge lamp; and a correction for stray light [23]. How- ever, corrections for the effect of cosine error on the UV- B spectra and a wavelength-dependent temperature effect are not applied. In this study an increase of 6% was ap- plied to the Brewer data to compensate for the cosine error effect on the basis of research by Krotkov et al. [29] and Wang et al. [27]. 3. Other Measurements Daily total ozone column measurements from the Brewer instrument were obtained from the WOUDC for the sta- tions shown in Figure 1. Hourly (local standard time) measurements of total cloud opacity, surface temperature, pressure and relative humidity were provided by the MSC. Values were linearly interpolated for the irradi- ance measurement times in GMT. Solar zenith angles for each measurement time and the ratio of actual to mean 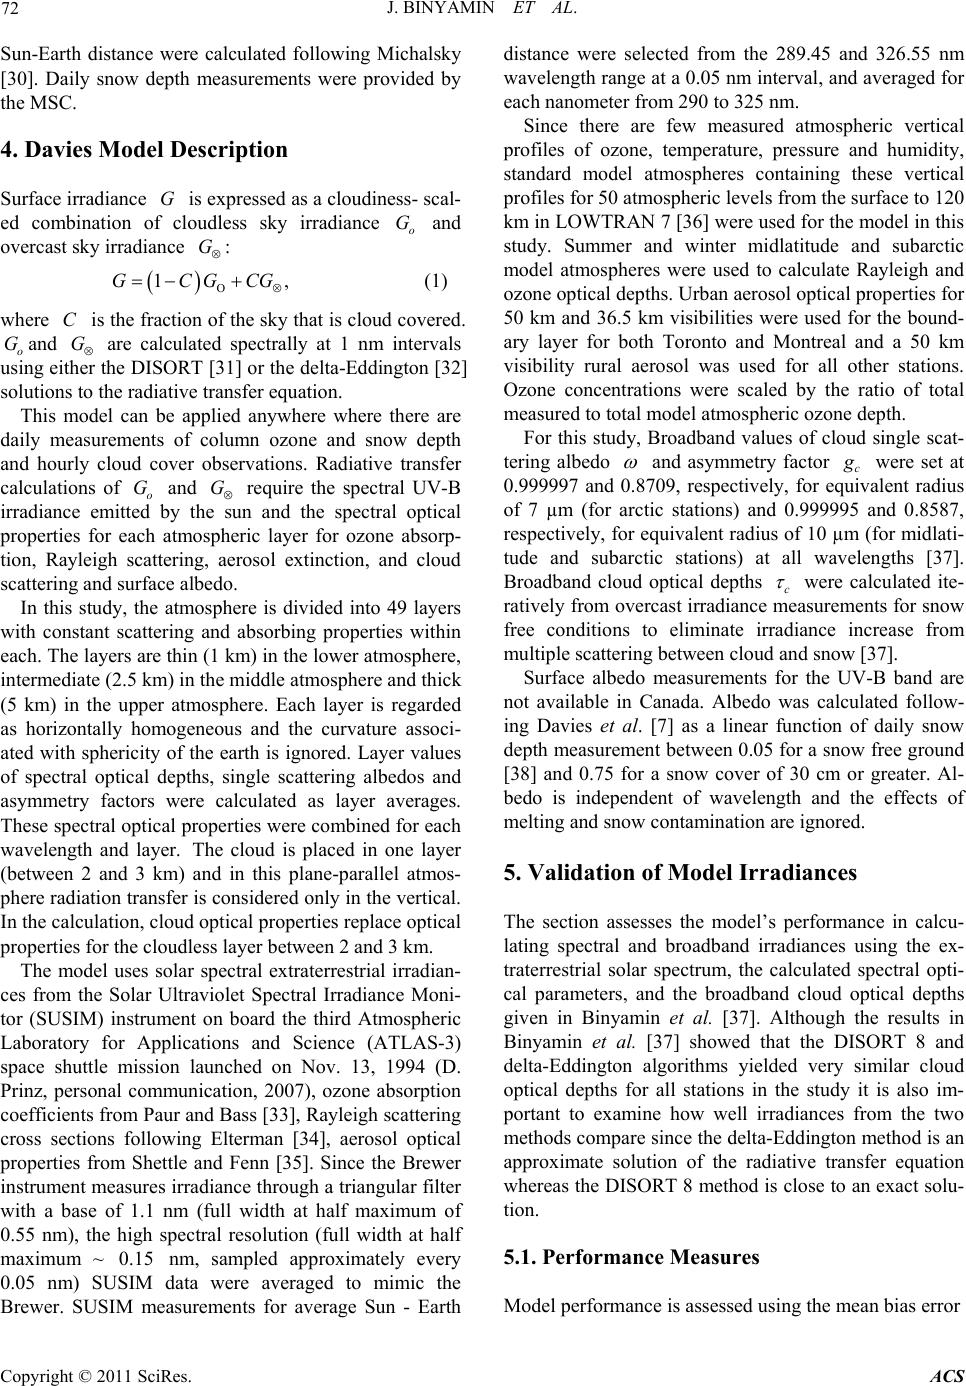 J. BINYAMIN ET AL. 72 , Sun-Earth distance were calculated following Michalsky [30]. Daily snow depth measurements were provided by the MSC. 4. Davies Model Description Surface irradiance is expressed as a cloudiness- scal- ed combination of cloudless sky irradiance and overcast sky irradiance : G o G G 1GCGCG (1) where is the fraction of the sky that is cloud covered. oand are calculated spectrally at 1 nm intervals using either the DISORT [31] or the delta-Eddington [32] solutions to the radiative transfer equation. C GG This model can be applied anywhere where there are daily measurements of column ozone and snow depth and hourly cloud cover observations. Radiative transfer calculations of o and require the spectral UV-B irradiance emitted by the sun and the spectral optical properties for each atmospheric layer for ozone absorp- tion, Rayleigh scattering, aerosol extinction, and cloud scattering and surface albedo. G G In this study, the atmosphere is divided into 49 layers with constant scattering and absorbing properties within each. The layers are thin (1 km) in the lower atmosphere, intermediate (2.5 km) in the middle atmosphere and thick (5 km) in the upper atmosphere. Each layer is regarded as horizontally homogeneous and the curvature associ- ated with sphericity of the earth is ignored. Layer values of spectral optical depths, single scattering albedos and asymmetry factors were calculated as layer averages. These spectral optical properties were combined for each wavelength and layer. The cloud is placed in one layer (between 2 and 3 km) and in this plane-parallel atmos- phere radiation transfer is considered only in the vertical. In the calculation, cloud optical properties replace optical properties for the cloudless layer between 2 and 3 km. The model uses solar spectral extraterrestrial irradian- ces from the Solar Ultraviolet Spectral Irradiance Moni- tor (SUSIM) instrument on board the third Atmospheric Laboratory for Applications and Science (ATLAS-3) space shuttle mission launched on Nov. 13, 1994 (D. Prinz, personal communication, 2007), ozone absorption coefficients from Paur and Bass [33], Rayleigh scattering cross sections following Elterman [34], aerosol optical properties from Shettle and Fenn [35]. Since the Brewer instrument measures irradiance through a triangular filter with a base of 1.1 nm (full width at half maximum of 0.55 nm), the high spectral resolution (full width at half maximum ~ 0.15 nm, sampled approximately every 0.05 nm) SUSIM data were averaged to mimic the Brewer. SUSIM measurements for average Sun - Earth distance were selected from the 289.45 and 326.55 nm wavelength range at a 0.05 nm interval, and averaged for each nanometer from 290 to 325 nm. Since there are few measured atmospheric vertical profiles of ozone, temperature, pressure and humidity, standard model atmospheres containing these vertical profiles for 50 atmospheric levels from the surface to 120 km in LOWTRAN 7 [36] were used for the model in this study. Summer and winter midlatitude and subarctic model atmospheres were used to calculate Rayleigh and ozone optical depths. Urban aerosol optical properties for 50 km and 36.5 km visibilities were used for the bound- ary layer for both Toronto and Montreal and a 50 km visibility rural aerosol was used for all other stations. Ozone concentrations were scaled by the ratio of total measured to total model atmospheric ozone depth. For this study, Broadband values of cloud single scat- tering albedo and asymmetry factor c were set at 0.999997 and 0.8709, respectively, for equivalent radius of 7 µm (for arctic stations) and 0.999995 and 0.8587, respectively, for equivalent radius of 10 µm (for midlati- tude and subarctic stations) at all wavelengths [37]. Broadband cloud optical depths c were calculated ite- ratively from overcast irradiance measurements for snow free conditions to eliminate irradiance increase from multiple scattering between cloud and snow [37]. Surface albedo measurements for the UV-B band are not available in Canada. Albedo was calculated follow- ing Davies et al. [7] as a linear function of daily snow depth measurement between 0.05 for a snow free ground [38] and 0.75 for a snow cover of 30 cm or greater. Al- bedo is independent of wavelength and the effects of melting and snow contamination are ignored. 5. Validation of Model Irradiances The section assesses the model’s performance in calcu- lating spectral and broadband irradiances using the ex- traterrestrial solar spectrum, the calculated spectral opti- cal parameters, and the broadband cloud optical depths given in Binyamin et al. [37]. Although the results in Binyamin et al. [37] showed that the DISORT 8 and delta-Eddington algorithms yielded very similar cloud optical depths for all stations in the study it is also im- portant to examine how well irradiances from the two methods compare since the delta-Eddington method is an approximate solution of the radiative transfer equation whereas the DISORT 8 method is close to an exact solu- tion. 5.1. Performance Measures Model performance is assessed using the mean bias error Copyright © 2011 SciRes. ACS 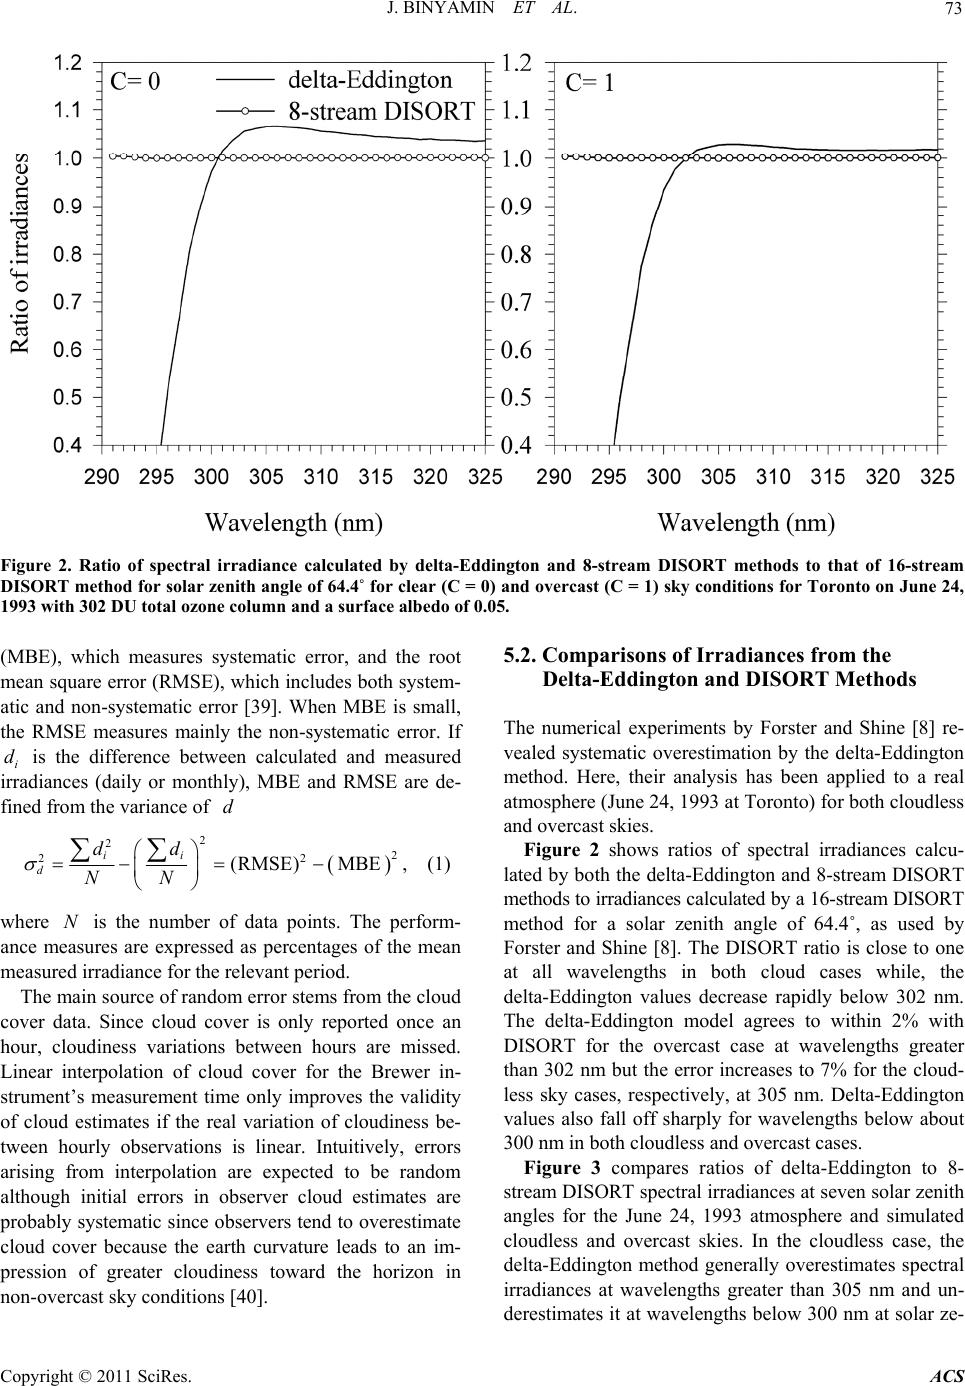 J. BINYAMIN ET AL. Copyright © 2011 SciRes. ACS 73 Figure 2. Ratio of spectral irradiance calculated by delta-Eddington and 8-stream DISORT methods to that of 16-stream DISORT method for solar zenith angle of 64.4˚ for clear (C = 0) and overcast (C = 1) sky conditions for Toronto on June 24, 1993 with 302 DU total ozone column and a surface albedo of 0.05. 5.2. Comparisons of Irradiances from the Delta-Eddington and DISORT Methods (MBE), which measures systematic error, and the root mean square error (RMSE), which includes both system- atic and non-systematic error [39]. When MBE is small, the RMSE measures mainly the non-systematic error. If i is the difference between calculated and measured irradiances (daily or monthly), MBE and RMSE are de- fined from the variance of d d The numerical experiments by Forster and Shine [8] re- vealed systematic overestimation by the delta-Eddington method. Here, their analysis has been applied to a real atmosphere (June 24, 1993 at Toronto) for both cloudless and overcast skies. 2 2 2 2 (RMSE) MBE ii d dd NN 2 , (1) Figure 2 shows ratios of spectral irradiances calcu- lated by both the delta-Eddington and 8-stream DISORT methods to irradiances calculated by a 16-stream DISORT method for a solar zenith angle of 64.4˚, as used by Forster and Shine [8]. The DISORT ratio is close to one at all wavelengths in both cloud cases while, the delta-Eddington values decrease rapidly below 302 nm. The delta-Eddington model agrees to within 2% with DISORT for the overcast case at wavelengths greater than 302 nm but the error increases to 7% for the cloud- less sky cases, respectively, at 305 nm. Delta-Eddington values also fall off sharply for wavelengths below about 300 nm in both cloudless and overcast cases. where is the number of data points. The perform- ance measures are expressed as percentages of the mean measured irradiance for the relevant period. N The main source of random error stems from the cloud cover data. Since cloud cover is only reported once an hour, cloudiness variations between hours are missed. Linear interpolation of cloud cover for the Brewer in- strument’s measurement time only improves the validity of cloud estimates if the real variation of cloudiness be- tween hourly observations is linear. Intuitively, errors arising from interpolation are expected to be random although initial errors in observer cloud estimates are probably systematic since observers tend to overestimate cloud cover because the earth curvature leads to an im- pression of greater cloudiness toward the horizon in non-overcast sky conditions [40]. Figure 3 compares ratios of delta-Eddington to 8- stream DISORT spectral irradiances at seven solar zenith angles for the June 24, 1993 atmosphere and simulated cloudless and overcast skies. In the cloudless case, the delta-Eddington method generally overestimates spectral irradiances at wavelengths greater than 305 nm and un- erestimates it at wavelengths below 300 nm at solar ze- d 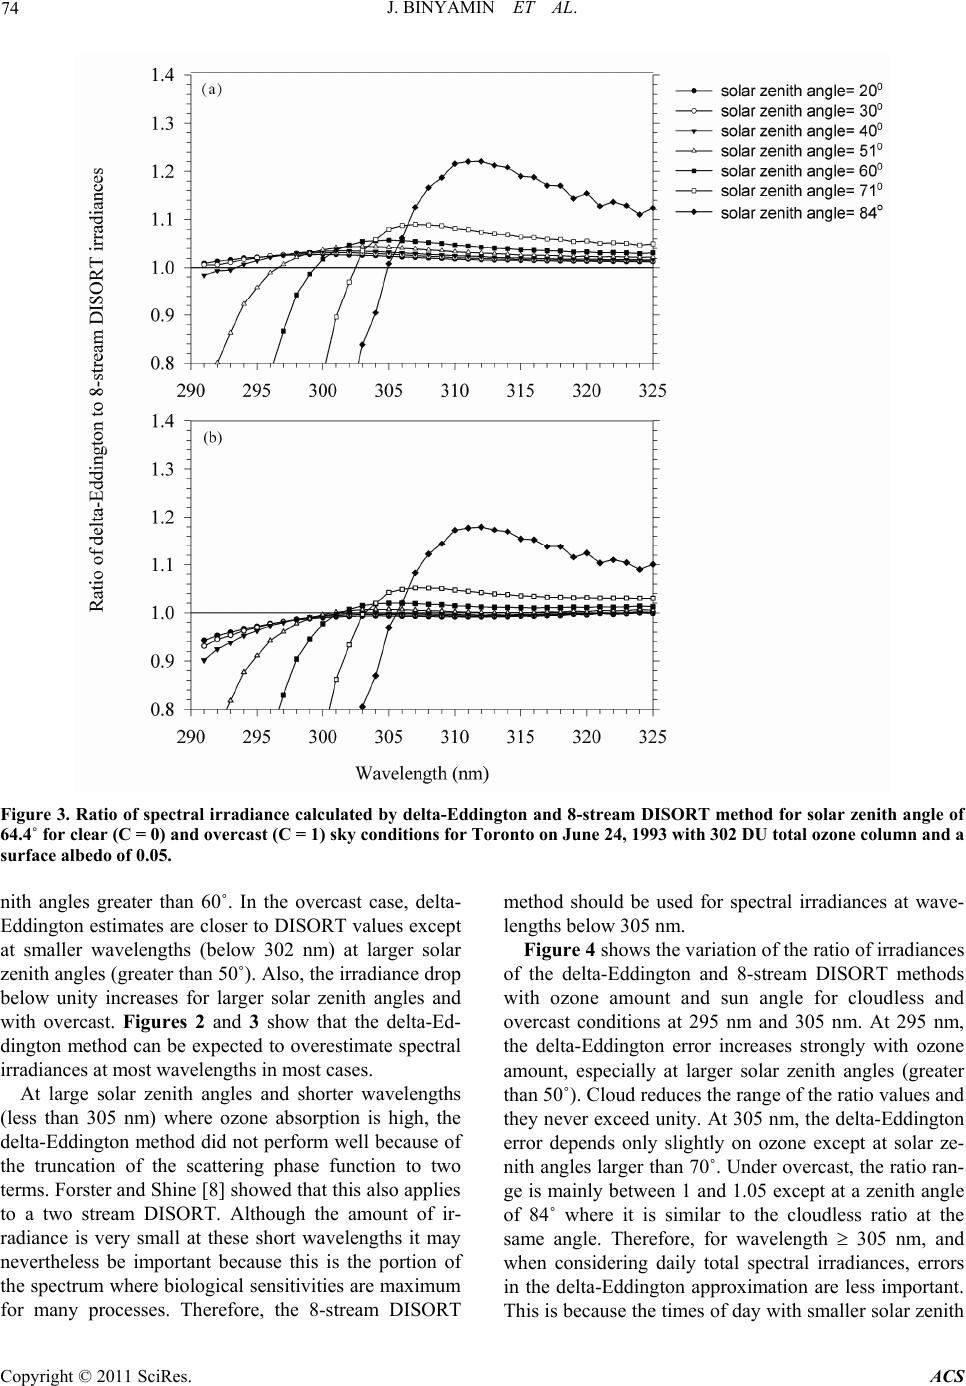 J. BINYAMIN ET AL. Copyright © 2011 SciRes. ACS 74 Figure 3. Ratio of spectral irradiance calculated by delta-Eddington and 8-stream DISORT method for solar zenith angle of 64.4˚ for clear (C = 0) and overcast (C = 1) sky conditions for Toronto on June 24, 1993 with 302 DU total ozone column and a surface albedo of 0.05. nith angles greater than 60˚. In the overcast case, delta- Eddington estimates are closer to DISORT values except at smaller wavelengths (below 302 nm) at larger solar zenith angles (greater than 50˚). Also, the irradiance drop below unity increases for larger solar zenith angles and with overcast. Figures 2 and 3 show that the delta-Ed- dington method can be expected to overestimate spectral irradiances at most wavelengths in most cases. At large solar zenith angles and shorter wavelengths (less than 305 nm) where ozone absorption is high, the delta-Eddington method did not perform well because of the truncation of the scattering phase function to two terms. Forster and Shine [8] showed that this also applies to a two stream DISORT. Although the amount of ir- radiance is very small at these short wavelengths it may nevertheless be important because this is the portion of the spectrum where biological sensitivities are maximum for many processes. Therefore, the 8-stream DISORT method should be used for spectral irradiances at wave- lengths below 305 nm. Figure 4 shows the variation of the ratio of irradiances of the delta-Eddington and 8-stream DISORT methods with ozone amount and sun angle for cloudless and overcast conditions at 295 nm and 305 nm. At 295 nm, the delta-Eddington error increases strongly with ozone amount, especially at larger solar zenith angles (greater than 50˚). Cloud reduces the range of the ratio values and they never exceed unity. At 305 nm, the delta-Eddington error depends only slightly on ozone except at solar ze- nith angles larger than 70˚. Under overcast, the ratio ran- ge is mainly between 1 and 1.05 except at a zenith angle of 84˚ where it is similar to the cloudless ratio at the same angle. Therefore, for wavelength 305 nm, and when considering daily total spectral irradiances, errors in the delta-Eddington approximation are less important. his is because the times of day with smaller solar zenith T 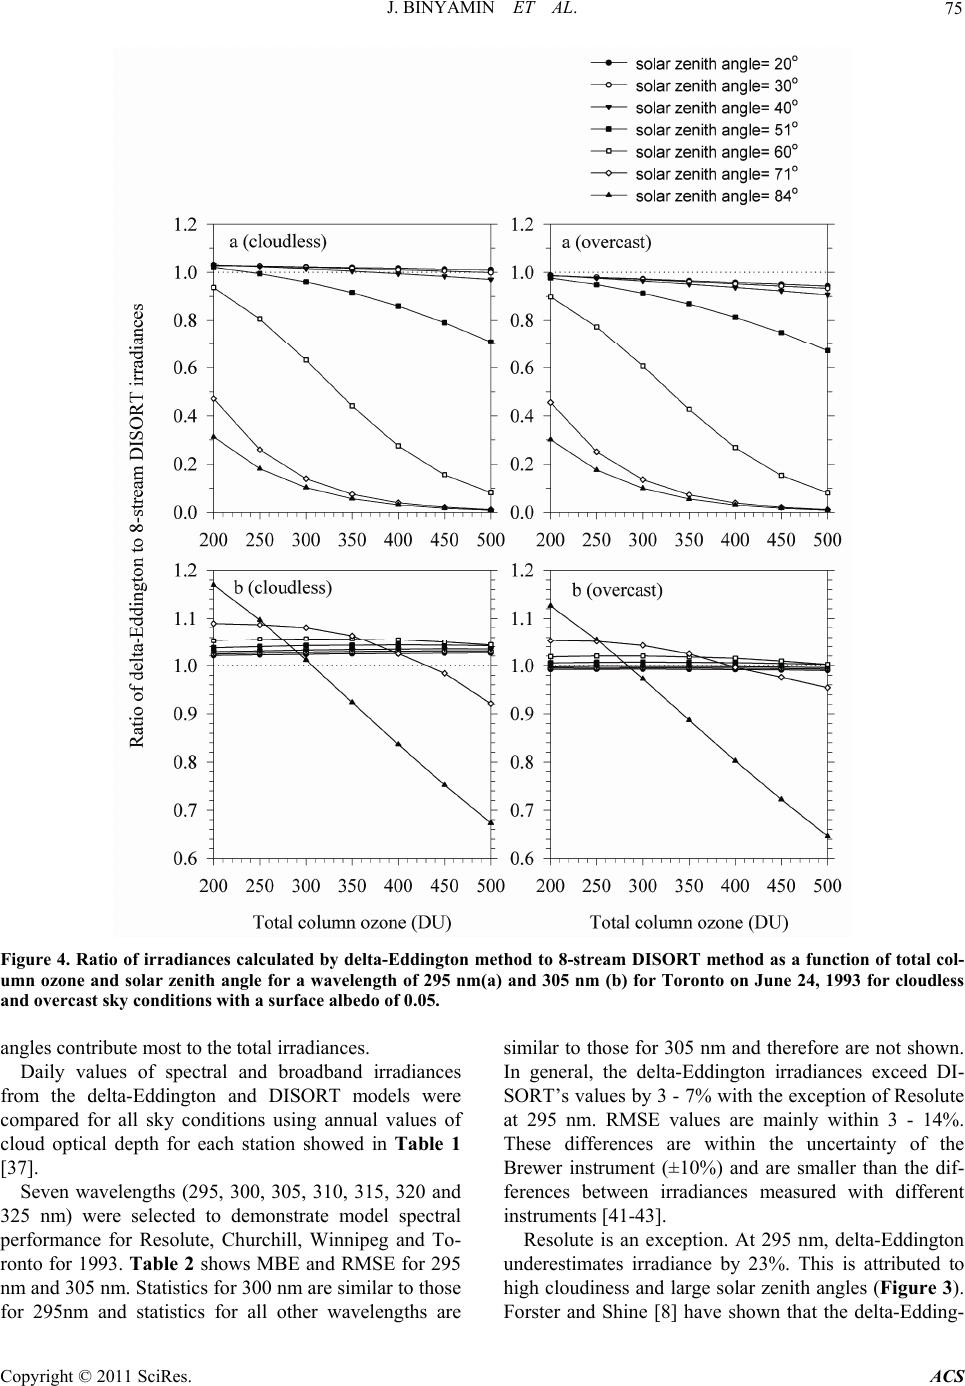 J. BINYAMIN ET AL. Copyright © 2011 SciRes. ACS 75 Figure 4. Ratio of irradiances calculated by delta-Eddington method to 8-stream DISORT method as a function of total col- umn ozone and solar zenith angle for a wavelength of 295 nm(a) and 305 nm (b) for Toronto on June 24, 1993 for cloudless and overcast sky conditions with a surface albedo of 0.05. angles contribute most to the total irradiances. Daily values of spectral and broadband irradiances from the delta-Eddington and DISORT models were compared for all sky conditions using annual values of cloud optical depth for each station showed in Table 1 [37]. Seven wavelengths (295, 300, 305, 310, 315, 320 and 325 nm) were selected to demonstrate model spectral performance for Resolute, Churchill, Winnipeg and To- ronto for 1993. Table 2 shows MBE and RMSE for 295 nm and 305 nm. Statistics for 300 nm are similar to those for 295nm and statistics for all other wavelengths are similar to those for 305 nm and therefore are not shown. In general, the delta-Eddington irradiances exceed DI- SORT’s values by 3 - 7% with the exception of Resolute at 295 nm. RMSE values are mainly within 3 - 14%. These differences are within the uncertainty of the Brewer instrument (±10%) and are smaller than the dif- ferences between irradiances measured with different instruments [41-43]. Resolute is an exception. At 295 nm, delta-Eddington underestimates irradiance by 23%. This is attributed to high cloudiness and large solar zenith angles (Figure 3). orster and Shine [8] have shown that the delta-Edding- F  J. BINYAMIN ET AL. Copyright © 2011 SciRes. ACS 76 Table 1. Characteristics of the inferred cloud optical depth for the nine Canadian datasets. N is the number of data points. Station Year Aerosol type Mean and Median cloud optical depth -Eddington Mean Median DISORT 8 Mean Median N Alert (NWT) 1995 Rural + 50 km 13.6 9.0 271 Resolute (NWT) 1993 Rural + 50 km 22.9 16.7 22.3 15.9 294 1994 22.9 16.9 271 1995 36.8 22.9 36.3 22.4 313 1996 25.2 16.6 283 Station 27.2 18.0 1161 Churchill (Man.) 1993 Rural + 50 km 39.8 27.5 39.7 26.7 170 1994 78.1 34.2 216 1995 48.3 26.6 216 1996 37.9 23.4 454 Station 48.6 27.1 1056 Edmonton (Alta.) 1993 Rural + 50 km 34.7 24.8 112 1994 40.4 30.6 127 1995 51.0 33.5 149 1996 33.9 24.8 211 Station 39.7 27.9 599 Regina (Sask.) 1994 Rural + 50 km 40.7 25.4 246 1995 54.7 26.4 113 Station 45.1 25.9 359 Winnipeg (Man.) 1993 Rural + 50 km 37.4 26.9 37.6 27.4 405 Montreal (Que.) 1993 Urban + 50 km 53.0 34.7 215 1994 49.5 28.9 239 Station 51.1 29.6 454 1993 Urban + 36.5 km 43.5 29.3 1994 41.7 24.6 Halifax (NS) 1993 Rural + 50km 48.9 31.7 516 1994 39.3 27.6 531 1995 40.5 27.4 609 1996 34.2 25.6 613 Station 40.5 27.8 2269 Toronto (Ont.) 1993 Urban + 50 km 43.9 26.8 43.7 26.7 405 1994 44.7 31.0 765 1995 53.0 29.7 583 1996 53.7 38.4 880 Station 49.4 32.6 2633 1993 Urban + 36.5 km 37.89 22.8 590 1995 47.1 25.2 705 Table 2. Comparison of daily spectral irradiances from the delta-Eddington and 8-stream DISORT methods for the period indicated for each station. is the number of data points and NM is the mean annual daily spectral irra diance calculated by DISORT (J·m–2·day–1·nm–1). Values of MBE and RMSE are given as percentages of M. Positive MBE values indicate delta-Eddington overestimation. Statistics Resolute Bay 1993 Churchill 1993 Winnipeg 1993 Toronto 1993 295 nm N 89 136 136 192 0.07 0.46 0.83 1.37 MBE –23.00 6.92 5.72 6.61 RMSE 26.44 13.94 9.00 10.25 305 nm N 141 178 228 250 180.45 347.49 370.41 474.93 MBE 7.40 3.71 3.15 3.31 RMSE 11.11 3.26 3.32 4.41  J. BINYAMIN ET AL. 77 Figure 5. Comparison of 8-stream DISORT and delta-Eddington daily totals (white circles) and monthly averages (black circles) broadband irradiances using annual values of cloud optical depth for each station (Table 1) at Resolute Bay, Chur- chill, Winnipeg and Toronto. The dotted lines repres e n t linear regressions constrained to pass through the origin. ton method underestimates the multiple scattering of cloud by up to 14%. The underestimation is not apparent at the lower latitude stations where cloudiness is less and sun angles are higher. For broadband irradiances, Forster and Shine [8] showed for a theoretical atmosphere that the average del- ta-Eddington transmittance exceeds 16 stream DISORT estimates by 5% at a sun angle of 60˚. We confirm this for real atmospheres for 1993 at Resolute, Churchill, Winnipeg and Toronto (Figure 5) using 8-stream DI- SORT. The overestimates are less than 4%. The irradi- ances represent the wide range of solar zenith angles and sky conditions found in midlatitude, subarctic and arctic stations. 5.3. Comparisons of Model Calculations with Measurements 5.3.1. Spec tra l Results Comparison statistics of daily spectral irradiances be- tween models and measurements is given in Table 3 for the two wavelengths (295 nm and 305 nm used previ- ously) for one year at nine stations. For wavelengths ≧ 305 nm the MBE for the two methods is mainly within 5% of the mean measured irradiance. This is well within the uncertainty of the Brewer instrument. Biases for del- ta-Eddington are mainly positive while those for DISORT are mainly negative. This follows from section 5.2 which showed that the delta-Eddington method, generally, pro- duces larger spectral irradiances than DISORT. The bet- ter MBE for delta-Eddington (the inferior model) at longer wavelengths may suggest systematic overestima- tion by Brewer instruments. The comparisons between model estimates and meas- urements are poorer at wavelengths below 305 nm al- though DISORT estimates match measurements closer than the delta-Eddington estimates as expected (Table 3). The larger magnitude of the MBE values at 295 nm at most stations for both models may be attributed in part to the difficulty in measuring within this spectral region. In this range, very low light levels and increased stray light scattering increase the instrumental uncertainty (E. Wu of MSC, personal communication, 2007). Delta-Eddington’s rapid decrease in irradiance at 295 nm, shown in section 5.2, is only detectable at the arctic stations as a result of the greater cloudiness and solar ze- nith angles. At the other stations, except Halifax, delta- Eddington’s MBE values are positive. This follows from flux overestimation in cloudless skies that are more ommon than in the arctic (Figure 3). At Halifax, the c Copyright © 2011 SciRes. ACS  J. BINYAMIN ET AL. Copyright © 2011 SciRes. ACS 78 Table 3. Comparison of daily spectral irradiances from the delta-Eddington (DE) and 8-stream DISORT (D8) methods against measurements for the period indicated for each station. is the number of data points and NM is the mean an- nual measured daily spectral irradiance (J·m–2·day–1·nm–1). Values of MBE and RMSE are given as percentages of M Posi- tive MBE alues indicate model overest ima tion. Statistics Alert 1995 Resolute 1995 Churchill 1993Edmonton 1994 Regina 1994Winnipeg 1993 Montreal 1994 Halifax 1993 Toronto 1993 295 nm N 12 80 136 135 204 136 154 206 192 0.02 0.05 0.46 0.62 0.84 0.84 0.72 0.80 1.25 MBE (DE) –39.93 –3.54 5.25 71.62 1.99 10.50 43.94 –12.31 20.22 MBE (D8) 33.46 24.46 –1.21 51.60 –9.06 –0.42 27.90 –19.67 9.41 RMSE (DE) 85.71 88.09 51.14 87.31 49.19 32.28 70.22 45.18 38.84 RMSE (D8) 64.40 90.81 51.47 75.81 45.56 34.21 51.34 51.89 32.08 305 nm N 31 154 178 274 211 228 212 231 250 121.09 155.68 355.85 340.43 497.54 405.60 475.38 425.44 494.14 MBE (DE) –1.88 14.37 5.72 5.07 5.23 –1.26 0.28 –6.15 2.85 MBE (D8) –11.58 7.85 –2.35 –2.15 –1.73 –6.68 –6.39 –10.68 –3.89 RMSE (DE) 26.69 23.50 25.11 25.08 20.13 14.18 12.82 13.76 11.83 RMSE (D8) 29.50 25.30 23.28 20.18 17.77 18.40 13.14 17.55 12.15 Figure 6. Mean monthly measured (solid lines) and calculated by delta-Eddington (dotted lines) methods s pectral irradiance at 295, 305 nm for Toronto in 1993, Edmonton in 1994 and Resolute Bay in 1995. negative MBE for both models suggests a systematic error in the Brewer instrument. RMSE values for wavelengths greater than 300 nm are mainly within 12% to 25%. These decrease with length of averaging period for both models to below 10% for 30-day averaging periods, which is similar to decreases for broadband solar radiation estimates [44]. Mean monthly measured and calculated spectral ir- radiances for 295 nm and 305 nm are plotted for four stations (Resolute, Churchill, Edmonton and Toronto) in Figure 6. Both model estimates follow measurements well but at 295 nm the delta-Eddington method consis- tently overestimates irradiances. Figure 7 shows the annual variation of measured and  J. BINYAMIN ET AL. Copyright © 2011 SciRes. ACS 79 Figure 7. Mean monthly measured (solid lines) spectral and calculated by the delta-Eddington (dotted lines) and DISORT (dash lines) models for various wavelengths for Toronto 1993. Table gives relative MBE and RMSE values with positive MBE indicating model overestimation. is the mean monthly measured irradiance. M modeled spectral irradiances for 295 nm and 305 nm for Toronto 1993. The table below Figure 7 indicates larger MBE and RMSE at 295 nm. Both models perform well at wavelengths 305 nm with greatly reduced MBE and RMSE. Figure 8 shows mean monthly measured spectral ir- radiance and corresponding model values with both lin- ear and logarithmic plots for three months (January, March and June) for Edmonton in 1994, Halifax in 1993 and Toronto in 1993. The linear plot illustrates more clearly the agreement of measured and calculated irradi- ances at larger wavelengths while the logarithmic plot is better for showing the agreement at smaller wavelengths. Model values follow measurements well except below 300 nm. This may be attributable as stated earlier to the difficulty of measuring such low irradiance levels and to the light leakage problem even though a correction has been applied to irradiances for wavelengths less than 305 nm [23]. Model calculations show the same spectral variation as the Brewer measurements at wavelengths greater than 295 - 298 nm. The Halifax and Toronto data show evidence of stray light leakage in the corrected Brewer measurements. 5.3.2 Broadband Results Performance statistics for daily total and monthly aver- aged broadband irradiances are given in Table 4 for one year at nine stations. In general, both models perform well for broadband calculations with MBE mainly less than 5% and RMSE less than 25%, which is similar to values obtained from comparisons for global irradiance [45] and the preliminary UV-B irradiance study for Ca- nadian stations by Davies et al. [7]. This comparison shows that the delta-Eddington algorithm is adequate for estimating surface broadband UV-B irradiance under all sky conditions from mid-latitudes to the arctic. The method is faster computationally than the DISORT algo- rithm. Three sets of irradiances were calculated and compared to show the sensitivity of the model to c . Daily and monthly broadband irradiances from delta- Eddington algorithm were calculated separately using (a) annual c for each station, (b) one c for each station, and (c) one c for all non-arctic stations. Agreement in all three cases is good and the results are very similar. MBE is less than 7% and daily RMSE less than 25%, ecreasing to less than 15% for monthly averages d  J. BINYAMIN ET AL. Copyright © 2011 SciRes. ACS 80 Figure 8. Mean monthly measured (solid lines) and calculated by delta-Eddington (Black circles, triangles and squares) and 8-stream DISORT (white circles, tr iangles and squares) spectral irr adiance on a logarithmic (upper lines, left axis) and linear (lower lines, right axis) scale for January (circles), March (triangles) and June (squares) for Edmonton in 1994, Halifax in 1993 and Toronto in 1993. Table gives N which is the number of days used for each month. Table 4. Summary of delta-Eddington (DE) and 8-stream DISORT (D8) performance measures against measurements for daily total and monthly averaged br oadband irradiances for the period indicated for each station. is the number of data points and N M is the mean annual measured daily total irradiance (KJ·m–2·day–1). Values of MBE and RMSE are given as- percentages (italic) of M. Positive MBE values indicate model overestimation. Statistics Alert 1995 Resolute 1995 Churchill 1993 Edmonton 1994 Regina 1994 Winnipeg 1993 Montreal 1994 Halifax 1993 Toronto 1993 Daily total N 31 154 178 274 211 228 212 231 250 38.26 51.28 60.32 49.66 63.23 54.14 62.66 54.80 60.15 MBE (DE) –0.45 3.13 –0.47 5.55 6.30 3.73 –1.19 –1.10 1.92 MBE (D8) –7.59 –0.98 –5.95 –0.50 0.57 –1.52 –7.07 –5.75 –2.96 RMSE (DE) 23.24 11.37 18.09 19.21 16.58 13.34 14.33 17.76 14.78 RMSE (D8) 24.67 11.30 18.78 15.88 14.25 12.60 15.18 18.94 14.61 Monthly average N 4 8 10 12 10 12 12 12 12 38.27 39.76 49.09 46.33 55.02 47.79 50.17 52.18 55.81 MBE (DE) –2.18 2.80 –1.85 5.10 5.30 3.25 –1.50 –1.20 1.77 MBE (D8) –9.02 –1.51 –7.31 0.91 –0.49 –2.00 –7.53 –5.88 –3.21 RMSE (DE) 10.64 8.13 14.15 10.41 9.37 5.34 6.79 9.28 4.88 RMSE (D8) 15.14 6.55 15.23 7.49 5.86 3.79 10.00 11.59 5.35 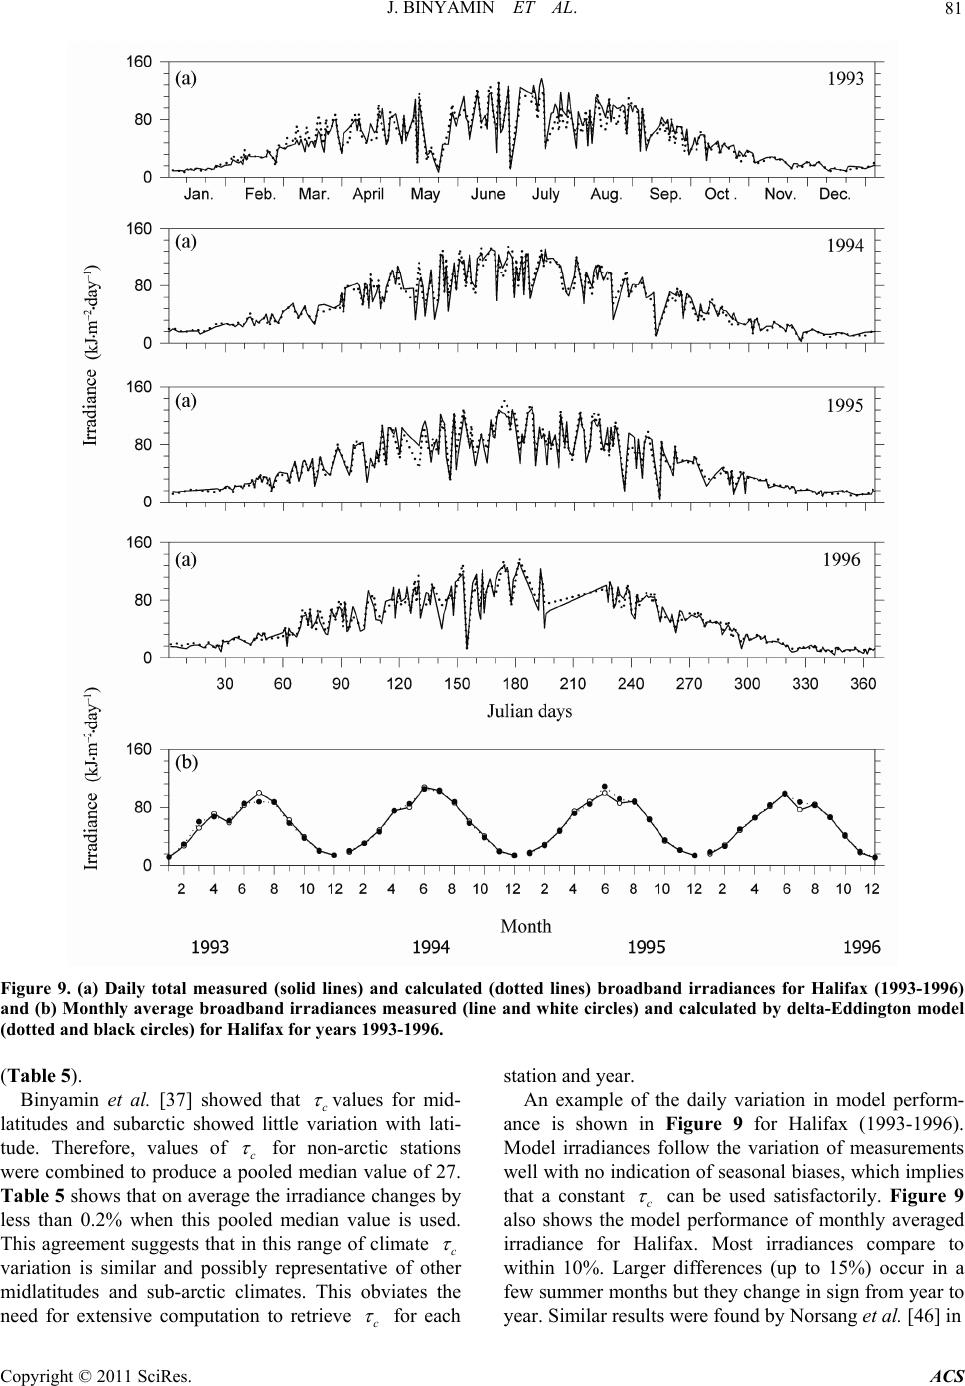 J. BINYAMIN ET AL. 81 Figure 9. (a) Daily total measured (solid lines) and calculated (dotted lines) broadband irradiances for Halifax (1993-1996) and (b) Monthly average broadband ir radiances measured (line and white circles) and c alculated by delta-Eddington model (dotted and black circles) for Halifax for years 1993-1996. (Table 5). Binyamin et al. [37] showed that c values for mid- latitudes and subarctic showed little variation with lati- tude. Therefore, values of c for non-arctic stations were combined to produce a pooled median value of 27. Table 5 shows that on average the irradiance changes by less than 0.2% when this pooled median value is used. This agreement suggests that in this range of climate c variation is similar and possibly representative of other midlatitudes and sub-arctic climates. This obviates the need for extensive computation to retrieve c for each station and year. An example of the daily variation in model perform- ance is shown in Figure 9 for Halifax (1993-1996). Model irradiances follow the variation of measurements well with no indication of seasonal biases, which implies that a constant c can be used satisfactorily. Figure 9 also shows the model performance of monthly averaged irradiance for Halifax. Most irradiances compare to within 10%. Larger differences (up to 15%) occur in a few summer months but they change in sign from year to ear. Similar results were found by Norsang et al. [46] in y Copyright © 2011 SciRes. ACS 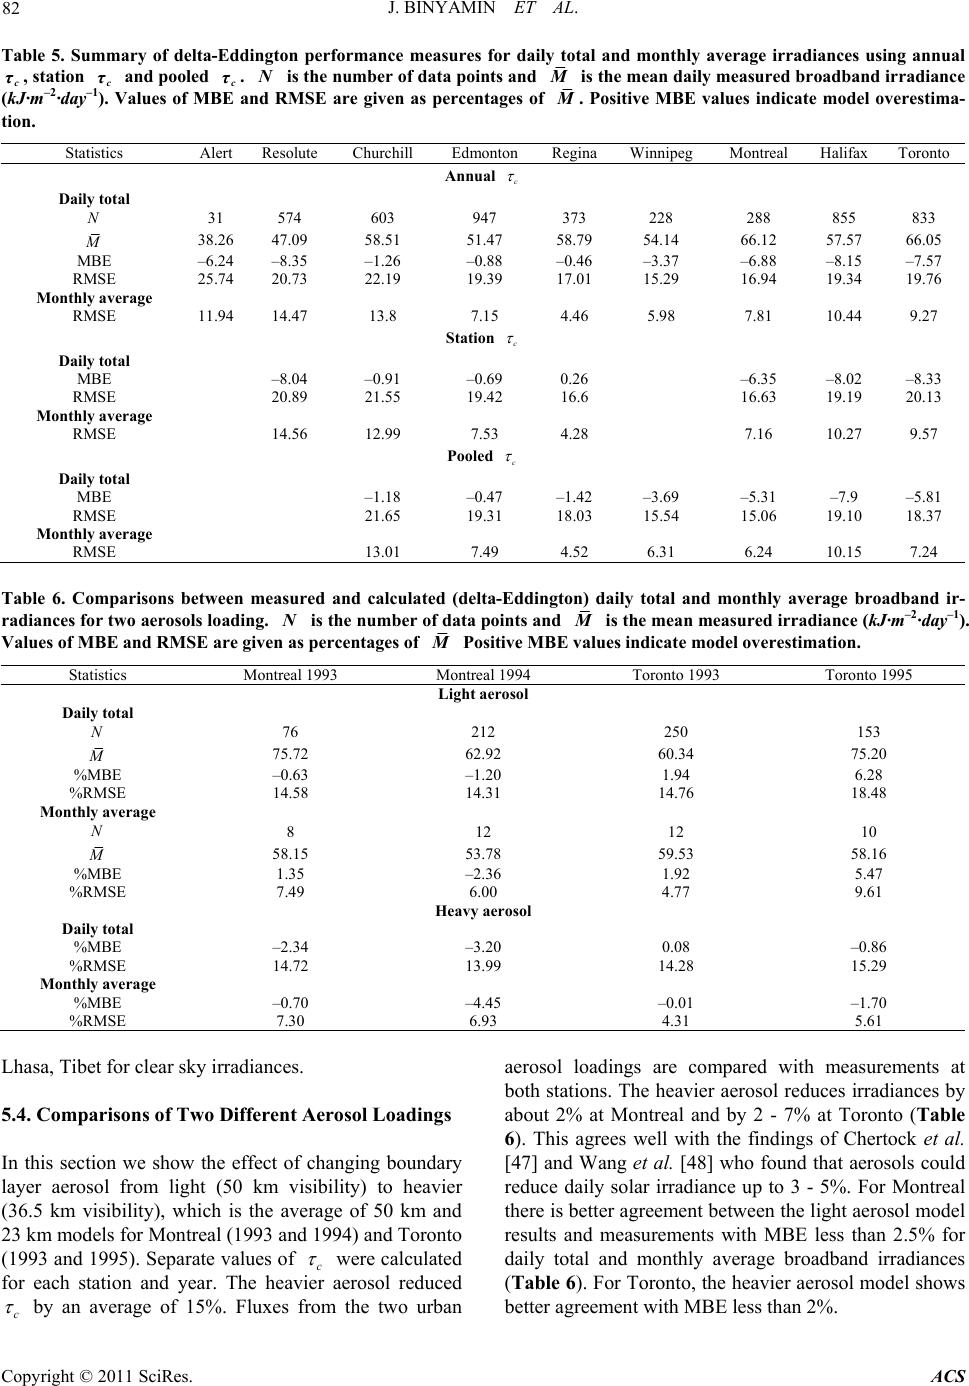 J. BINYAMIN ET AL. Copyright © 2011 SciRes. ACS 82 Table 5. Summary of delta-Eddington performance measures for daily total and monthly average irradiances using annual c, station c and pooled c τ. is the number of data points and τ τNM is the mean daily measured broadband irradiance (kJ·m–2·day–1). Values of MBE and RMSE are given as percentages of M. Positive MBE values indicate model overestima- tion. Statistics Alert Resolute Churchill Edmonton ReginaWinnipeg Montreal Halifax Toronto Annual c Daily total N 31 574 603 947 373 228 288 855 833 38.26 47.09 58.51 51.47 58.79 54.14 66.12 57.57 66.05 MBE –6.24 –8.35 –1.26 –0.88 –0.46 –3.37 –6.88 –8.15 –7.57 RMSE 25.74 20.73 22.19 19.39 17.01 15.29 16.94 19.34 19.76 Monthly average RMSE 11.94 14.47 13.8 7.15 4.46 5.98 7.81 10.44 9.27 Station c Daily total MBE –8.04 –0.91 –0.69 0.26 –6.35 –8.02 –8.33 RMSE 20.89 21.55 19.42 16.6 16.63 19.19 20.13 Monthly average RMSE 14.56 12.99 7.53 4.28 7.16 10.27 9.57 Pooled c Daily total MBE –1.18 –0.47 –1.42 –3.69 –5.31 –7.9 –5.81 RMSE 21.65 19.31 18.03 15.54 15.06 19.10 18.37 Monthly average RMSE 13.01 7.49 4.52 6.31 6.24 10.15 7.24 Table 6. Comparisons between measured and calculated (delta-Eddington) daily total and monthly average broadband ir- radiances for two aerosols loading. is the number of data points and NM is the mean measured irradiance (kJ·m–2·day–1). Values of MBE and RMSE are given as percentages of M Positive MBE values indicate model overestimation. Statistics Montreal 1993 Montreal 1994 Toronto 1993 Toronto 1995 Light aerosol Daily total N 76 212 250 153 75.72 62.92 60.34 75.20 %MBE –0.63 –1.20 1.94 6.28 %RMSE 14.58 14.31 14.76 18.48 Monthly average N 8 12 12 10 58.15 53.78 59.53 58.16 %MBE 1.35 –2.36 1.92 5.47 %RMSE 7.49 6.00 4.77 9.61 Heavy aerosol Daily total %MBE –2.34 –3.20 0.08 –0.86 %RMSE 14.72 13.99 14.28 15.29 Monthly average %MBE –0.70 –4.45 –0.01 –1.70 %RMSE 7.30 6.93 4.31 5.61 Lhasa, Tibet for clear sky irradiances. 5.4. Comparisons of Two Different Aerosol Loadings In this section we show the effect of changing boundary layer aerosol from light (50 km visibility) to heavier (36.5 km visibility), which is the average of 50 km and 23 km models for Montreal (1993 and 1994) and Toronto (1993 and 1995). Separate values of c were calculated for each station and year. The heavier aerosol reduced c by an average of 15%. Fluxes from the two urban aerosol loadings are compared with measurements at both stations. The heavier aerosol reduces irradiances by about 2% at Montreal and by 2 - 7% at Toronto (Table 6). This agrees well with the findings of Chertock et al. [47] and Wang et al. [48] who found that aerosols could reduce daily solar irradiance up to 3 - 5%. For Montreal there is better agreement between the light aerosol model results and measurements with MBE less than 2.5% for daily total and monthly average broadband irradiances (Table 6). For Toronto, the heavier aerosol model shows better agreement with MBE less than 2%.  J. BINYAMIN ET AL. 83 6. Conclusions This study evaluated the relative performance of the delta-Eddington and DISORT algorithms within a nu- merical model for estimating spectral and broadband UV-B irradiances for Canadian conditions and to vali- date model results with Brewer spectrophotometer meas- urements. The most important findings are: · The delta-Eddington method produces daily total spectral irradiances for all sky conditions, which are generally 3 - 7% larger than those from the 8-stream DISORT method. The fractional overestimation de- creases as wavelength increases. Irradiances are accept- able for wavelengths ≥ 305 nm. This method is unsuit- able for wavelengths below 305 nm where ozone absorp- tion is high due to the truncation of the scattering phase function to two terms. At longer wavelengths its per- formance varies with solar zenith angle and cloudiness. For clear skies, the method always overestimates irradi- ances at all sun angles with the error increasing as the solar zenith angle increases. For cloudy skies the errors are much smaller. · The delta-Eddington method performs very well for broadband calculations for both daily total and monthly averaged irradiances. · Comparison of spectral estimates from both models with measurements indicate uncertainties in the Brewer measurements at wavelengths < 305 nm. · At wavelengths ≥ 305 nm better agreement with measurements by the delta-Eddington than by DISORT suggests overestimation by the Brewer spectrophotome- ter. · Model estimates for broadband irradiances for both daily totals and monthly averages have a MBE less than 5% and RMSE less than 25% deceases to less than 15% for monthly averages. These statistics compare favoura- bly with those obtained for global radiation [45]. · A constant c value of 27 is adequate for all sta- tions except the arctic. This is important because it sug- gests that further estimation of c is not necessary. · A light boundary layer aerosol model was suitable for Montreal and a heavy aerosol model for Toronto. This research is the first to provide extensive evalua- tion for spectral and broadband irradiances for a large data set, which includes midlatitude, subarctic, and arctic stations. The spectral information is important to biolo- gists who can combine it with various an action spectrum to determine potential biological exposure. This physically-based model can be applied anywhere. Refinements to the extraterrestrial solar spectrum, Rayleigh scattering cross sections and ozone absorption coefficients are unlikely to be large and the model’s lin- ear combination of cloudless and overcast components has been shown to work in a wide range of Canadian conditions. The greatest restriction to its use is the avail- ability of cloud cover information. Future applications of the model should use satellite measurements of ozone and cloud. The Brewer instrument data sets have not been cor- rected for the cosine error of the diffuser, temperature errors, as well as absolute radiometric calibration errors. In fact, the 6% increase made to the Brewer data in this study was an approximate correction to remove the sys- tematic cosine error but the actual correction should be made depending on the solar zenith angle and sky illu- mination conditions [23]. 7. Acknowledgments We thank Dr. Hanna Maoh of University of Windsor for supplying Figure 1. 8. References [1] J. E. Frederick, H. E. Snell and E. K. Haywood, “Solar Ultraviolet Radiation at the Earth’S Surface,” Photo- chemistry and Phtobiology, Vol. 50, No. 4, 1989, pp. 443-450. doi:10.1111/j.1751-1097.1989.tb05548.x [2] L. T. Molina and M. J. Molina, “Absolute Absorption Cross Sections of Ozone in the 185-350 um Wavelength Range,” Journal of Geophysical Research, Vol. 91, No. D13, 1986, pp. 14501-14508. doi:10.1029/JD091iD13p14501 [3] D. Lubin, B. G. Mitchell, J. E. Frederick, A. D. Albert’s, C. R. Booth, T. Lucas and D. Neuschuler, “A Contribu- tion toward Understanding the Biospherical Significance of Antarctic Ozone Depletion,” Journal of Geophysical Research, Vol. 97, 1992, pp. 7817-7827. [4] S.-C. Tsay and K. Stamnes, “Ultraviolet Radiation in the Arctic: The Impact of Potential Ozone Depletions and Cloud Effects,” Journal of Geophysical Research At- mospheres, Vol. 97, 1992, pp. 7829-7840. [5] P. Wang and J. Lenoble, “Comparison between Meas- urements and Modeling of UV-B Irradiance for Clear Sky: A Case Study,” Applied Optics, Vol. 33, No. 18, 1994, pp. 3964-3971. doi:10.1364/AO.33.003964 [6] P. M. de F. Forster, K. P. Shine and A. R. Webb, “Mod- elling Ultraviolet Radiation at the Earth’S Surface. PART II: Model and Instrument Comparison,” Journal of Ap- plied Meteorology, Vol. 34, No. 11, 1995, pp. 2426-2439. [7] J. Davies, P. Kuhn, G. Duhamel, J. Binyamin and K. Runnalls, “An Ultraviolet (290 to 325 nm) Irradiation Model for Southern Canadian Conditions,” Physical Ge- ography, Vol. 21, No. 4, 2000, pp. 327-344. [8] P. M. de F. Forster and K.P. Shine, “A Comparison of Two Radiation Schemes for Calculating Ultraviolet Ra- diation,” Quarterly Journal of Royal Meteorological So- ciety, Vol. 121, No. 525, 1995, pp. 1113-1131. Copyright © 2011 SciRes. ACS  84 J. BINYAMIN ET AL. [9] W. J. Wiscombe and J. H. Joseph, “The Range of Valid- ity of the Eddington Approximation,” Icarus, Vol. 32, No. 3, 1977, pp. 262-377. doi:10.1016/0019-1035(77)90008-2 [10] J. Lenoble, “Atmospheric Radiative Transfer,” A. Deepak Pubulishing, Hampton, 1993, p. 176. [11] C. Erlick and J. E. Frederick, “Effects of Aerosols on the Wavelength Dependence of Atmospheric Transmission in the Ultraviolet and Visible: 1. A ‘Single-Scattering-Sepa- rate’ Delta-Eddington Model,” Journal of Geophysical Research, Vol. 103, No. D10, 1998, pp.11465-11472. doi:10.1029/98JD00772 [12] D. Lubin, E. H. Jensen and H. P. Gies, “Global Surface Ultraviolet Radiation Climatology from TOMS and ERBE Data,” Journal of Geophysical Research, Vol. 103, No. D20, 1998, pp. 26061-26091. doi:10.1029/98JD02308 [13] T. Koskela, P. Tallas and E. Kyrö, “Measured and Mod- eled UV-B Spectrum Compared with Some Atmospheric Parameters,” In: K. H. Stamnes, Ed., Atmospheric Radia- tion, Proceeding of SPIE 2049, Tromso, 30 June 1993, pp. 296-306. doi:10.1117/12.163526 [14] J. Zeng, R. McKenzie, K. Stamnes, M. Wineland and J. Rosen, “Measured UV Spectra Compared with Discrete Ordinate Method Simulations,” Journal of Geophysical Research, Vol. 99, No. D11, 1994, pp. 23019-23030. doi:10.1029/94JD02145 [15] B. Mayer, G. Seckmeyer and A. Kyling, “Systematic Long-Term Comparison of Spectral UV Measurements and UVSPEC Modeling Results,” Journal of Geophysical Research, Vol. 102, No. D7, 1997, pp. 8755-8767. doi:10.1029/97JD00240 [16] E. Leontyeva and K. Stamnes, “Estimations of Cloud Optical Thickness from Ground-Based Measurements of Incoming Solar Radiation in the Arctic,” Journal of Cli- mate, Vol. 7, No. 4, 1994, pp. 566-578. doi:10.1175/1520-0442(1994)007<0566:EOCOTF>2.0.C O;2 [17] P. M. de F. Forster, “Modelling Ultraviolet Radiation at the Earth’s Surface. Part I: The Sensitivity of Ultraviolet Irradiances to Atmospheric Changes,” Journal of Applied Meteorological, Vol. 34, No. 11, 1995, pp. 2412-2425. doi:10.1175/1520-0450(1995)034<2412:MURATE>2.0. CO;2 [18] E. Pachart, J. Lenoble and C. Brogniez, “Consistency Tests on UV Spectral Irradiance Measurements Using Modeling and a Broadband Instrument,” Journal of Geo- physical Res earch, Vol. 105, No. D4, 2000, pp. 4851-4856. doi:10.1029/1999JD900812 [19] Atmospheric Environment Service (AES), “Canada’s National Environmental Indicator Series: Stratospheric ozone depletion,” Environment Canada, Ontario, 1999. [20] J. B. Kerr and C. T. McElory, “Evidence for Large Up- ward Trends of Ultraviolet-B Radiation Linked to Ozone Depletion,” Science Magazine, Vol. 262, No. 5136, 1993, pp. 1032-1035. doi:10.1126/science.262.5136.1032 [21] A. F. Bais, C. S. Zerefos and C. T. McElory, “Solar UVB Measurements with the Double and Single Monochro- mator Brewer Ozone Spectrophotometers,” Geophysical Research Letters, Vol. 23, No. 8, 1996, pp. 833-836. doi:10.1029/96GL00842 [22] J. A. Davies, “Correcting for Stray Light in Brewer Spec- troradiometers,” Environmental Technology, Vol. 17, No. 4, 1996, pp. 421-426. doi:10.1080/09593331708616402 [23] D. L. Wardle and J. B. Kerr, “Scientific Sponsorship Statement for Brewer Spectral Data from Canadian Sta- tions,” WUDC documents, 1999. [24] A. F. Bais, S. Kazadzis, D. Balis, C. S. Zerefos and M. Blumthaler, “Correcting Global Solar Ultraviolet Spectra Recorded by a Brewer Spectroradiometer for its Angular Response Error,” Applied Optics, Vol. 37, No. 27. 1998, pp. 6339-6344. doi:10.1364/AO.37.006339 [25] U. Feister, R. Grewe and K. Gericke, “A Method for Correction of Cosine Errors in Measurements of Spectral UV Irradiance,” Solar Energy, Vol. 60, No. 6, 1997, pp. 313-332. doi:10.1016/S0038-092X(97)00030-3 [26] J. R. Herman, N. Krotkov, E. Celarier, D. Larko and G. Labow, “Distribution of UV Radiation at the Earth’s Sur- face from TOMS-Measured UV-Backscattered Radi- ances,” Journal of Geophysical Research, Vol. 104, No. D10, 1999, pp. 12059-12076. doi:10.1029/1999JD900062 [27] P. Wang, Z. Li, J. Cihlar, D. I. Wardle and J. Kerr, “Validation of an UV Inversion Algorithm Using Satellite and Surface Measurements,” Journal of Geophysical Re- search, Vol. 105, No. D4, 2000, pp. 5037-5048. doi:10.1029/1999JD900403 [28] F. Cappellani and C. Kochler, “Temperature Effects Cor- rection in a Brewer MKIV Spectrophtometer for Solar UV Measurements,” Journal of Geophysical Research, Vol. 105, No. D4, 1999, pp. 4829-4831. doi:10.1029/1999JD900254 [29] N. A. Krotkov, P. K. Bhartia, J. R. Herman, V. Fioletov and J. Kerr, “Satellite Estimation of Spectral Surface UV Irradiance in the Presence of Tropospheric Aerosols: 1. Cloud-Free Case,” Journal of Geophysical Research, Vol. 103, No. D8, 1998, pp. 8779-8793. doi:10.1029/98JD00233 [30] J. L. Michalsky, “The Astronomical Almanac’s Algo- rithm for Approximate Solar Position (1950-2050),” So- lar Energy, Vol. 40, No. 3, 1988, pp. 227-235. doi:10.1016/0038-092X(88)90045-X [31] K. Stamnes, S.-C. Tsay, W. J. Wiscombe and K. Jayaw- erra, “Numerically Stable Algorithm for Discrete Ordi- nate Method Radiative Transfer in Multiple Scattering and Emitting Layered Media,” Applied Optics, Vol. 27, No. 12, 1988, pp. 2503-2509. doi:10.1364/AO.27.002502 [32] J. H. Joseph, W. J. Wiscombe and J. A. Weinman, “The Delta-Eddington Approximation for Radiative Flux Transfer,” Journal of the Atmospheric Sciences, Vol. 33, No. 12, 1976, pp. 2452-2459. [33] R. J. Paur and A. M. Bass, “The Ultraviolet Cross Sec- tions of Ozone: II. Results and Temperature Dependence” Reidel Publishing, Dordrecht, 1985, pp. 606-616. [34] L. Elterman, “UV, Visible and IR Attenuation for Alti- tudes to 50 km,” Environmental Research Paper, Air Force Cambridge Research Laboratories, Bedford, 1986, pp. 1-59. Copyright © 2011 SciRes. ACS  J. BINYAMIN ET AL. Copyright © 2011 SciRes. ACS 85 [35] E. P. Shettle and R. W. Fenn, “Models for the Aerosols of the Lower Atmosphere and the Effects of Humidity Variations on Their Optical Properties,” AFGL Technical Report 79-0214, Environmental Research Papers, Air Force Geophysics Laboratory, Bedford, 1979. [36] F. X. Kneizys, E. P. Shettle, L. W. Abreu, J. H. Chet- wynd, G. P.Anderson, W. O. Gallery, J. E. A. Selby and S. A. Clough, “Users Guide to LOWTRAN 7,” Technical Report, Air Force Geophysics Laboratory, Bedford, 1988. [37] J. Binyamin, J. Davies and B. McArthur, “UV-B Cloud Optical Properties for Canada,” International Journal of Climatology, Vol. 30, No. 8, 2010, pp.1246-1255. [38] D. E. Bowker, R. E. Davis, D. I. Myrick, K. Stacy and W. T. Jones, “Spectral Reflectance of Natural Targets for Use in Remote Sensing Studies,” NASA Reference Pub- lication 1139, NASA Langley Research Center, Hampton, 1985. [39] J. E. Hay and D. I. Wardle, “An Assessment of the Un- certainty in Measurements of Solar Radiation,” Solar Energy, Vol. 29, No. 4, 1982, pp. 271-278. doi:10.1016/0038-092X(82)90242-0 [40] N. A. Hughes, “Global Cloud Climatologies: A Historical Review,” Journal of Applied Meteorology, Vol. 23, No. 5, 1994, pp. 724-750. doi:10.1175/1520-0450(1984)023<0724:GCCAHR>2.0. CO;2 [41] B. G. Gardiner, A. R. Webb, A.F. Bais, M. Blumthaler, I. Dirmhirn, P. Forster, D. Gillotay, K. Henriksen, M. Huber, P. J. Kirsch, P. C. Simon, T. Svenoe, P. Weihs and C. S. Zerfos, “European Intercomparison of Ultra- violet Spectroradiometers,” Environmental Technology, Vol. 14, No. 1, 1993, pp. 25-43. doi:10.1080/09593339309385262 [42] A. F. Bais, B. G. Gardiner, H. Slaper, M. Blumthaler, G. Bernhard, R. McKenize, A. R. Wedd, G. Seckmeyer, B. Kjeldstad, T. Koskela, P. J. Kirsch, J. Gröbner, J. B. Kerr, S. Kazadzis, K. Leszczynski, D. Wardle, W. Josefsson, C. Brogniez, D. Gillotay, H. Reinen, P. Weihs, T. Svenoe, P. Eriksen, F. Kuik and A. Redondas, “SUSPEN Intercom- parison of Ultraviolet Spectroradiometers,” Journal of Geophysical Research, Vol. 106, No. D12, 2001, pp. 12509-12525. doi:10.1029/2000JD900561 [43] O. Meinander, S. Kazadzis, M. Blumthaler, L. Ylianttila, B. Johnsen, K. Lakkala, T. Koskela, and W. Josefsson, “Diurnal Discrepancies in Spectral Solar UV Radiation Measurements,” Applied Optics, Vol. 45, No. 21, 2006, pp. 5346-5357. doi:10.1364/AO.45.005346 [44] J. A. Davies and D. C. McKay, “Estimating Solar Irradi- ance and Components,” Solar Energy, Vol. 29, No. 1, 1982, pp. 55-64. doi:10.1016/0038-092X(82)90280-8 [45] J. A. Davies and D.C. McKay, “Evaluation of Selected Models for Estimating Solar Radiation on a Horizontal Surfaces,” Solar Energy, Vol. 43, No. 3, 1989, pp.153-168. doi:10.1016/0038-092X(89)90027-3 [46] G. Norsang, L. Kocbach, W. Tsoja, J. J. Stamnes, A. Dahlback and P. Nema, “Ground-Based Measurements and Modelling of Solar UV-B Radiation in Lhasa, Tibet,” Atmospheric Environment, Vol. 43, No. 9, 2009, pp. 1498-1502. doi:10.1016/j.atmosenv.2008.11.048 [47] B. Chertock, R. Frouin and C. Gautier, “A Technique for Global Monitoring of Net Solar Irradiance at the Ocean Surface. Part II: Validation,” Journal of Applied Meteor- ology, Vol. 31, No. 9, 1992, pp. 1067-1083. doi:10.1175/1520-0450(1992)031<1067:ATFGMO>2.0. CO;2 [48] T. J. Wang, K. S. Lam, Q. Liu and T. K. Chan, “Assess- ment of Long Term UV Radiation Measured by the Brewer Spectrophotometer in Hong Kong During 1995-2005,” Atmospheric and Climate Sciences, Vol. 1, No. 1, 2011, pp. 9-17. doi:10.4236/acs.2011.11002
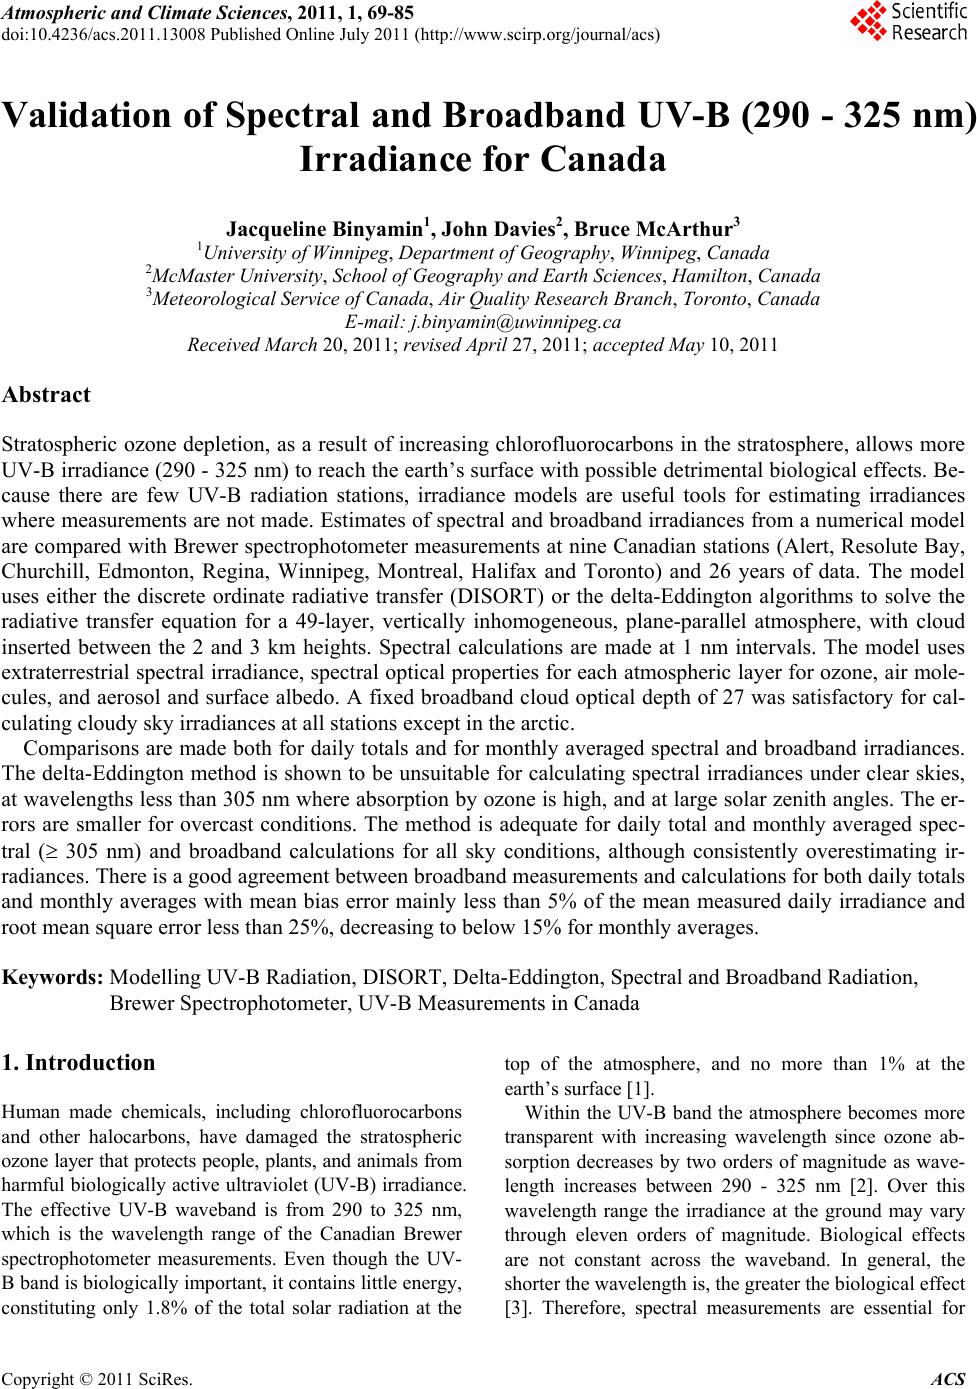
|