Photoacoustic Studies of Colloidal Silica Particles after MeV Ion-Induced Shape Deformation 65
consequence of ion-induced shape deformation. FFT
analysis of the photoacoustic signals includes the lon
gitudinal, transverse and surface waves and it was
necessary to discriminate the substrate vibrations (at
low frequency) from those due to the particles.
3. Results and Discussion
The as-prepared samples consisted of ~520 nm diame-
ter colloidal silica particles deposited onto a Si(100)
substrate, arranged in a continuous and homogeneous
monolayer, forming a 2-D hexagonally-ordered struc-
ture. In most cases quite narrow particle size distribu-
tions were obtained, indicating that essentially mono-
disperse SiO2 particles were synthesized [7]. Figure 2
shows a series of SEM micrographs corresponding to
as-prepared silica particles (viewed under normal inci-
dence) and those irradiated with a 6 MeV Si ions at
various fluences up to 4.5 × 10¹⁵ Si/cm2. One can ob-
serve that the spherical silica particles experimented
extreme deformations under exposure to MeV Si ions
at room temperature, and turned into oblate ellipsoids
as a result of the increase of the particle dimension
perpendicular to the ion beam and the decrease in the
direction parallel to the ion beam [6,7]. This anisot-
ropic plastic deformation increases with the ion fluence
and depends on the ion beam energy, as described in
our previous papers [6,7].
Concerning the PLPA characterization of the sam-
ples, we have performed comparative experiments for
different samples throughout the study of their time
signals as a function of the irradiation energy and flu-
ence. By using a 240 kHz PZT transducer, the photo-
acoustic signals were obtained from the bare Si(100)
substrate and from the samples consisting of silica par-
ticles deformed by 6 MeV Si ions with the following
fluences: (1.5, 3, 3.5, 4, and 4.5) × 1015 Si/cm2.
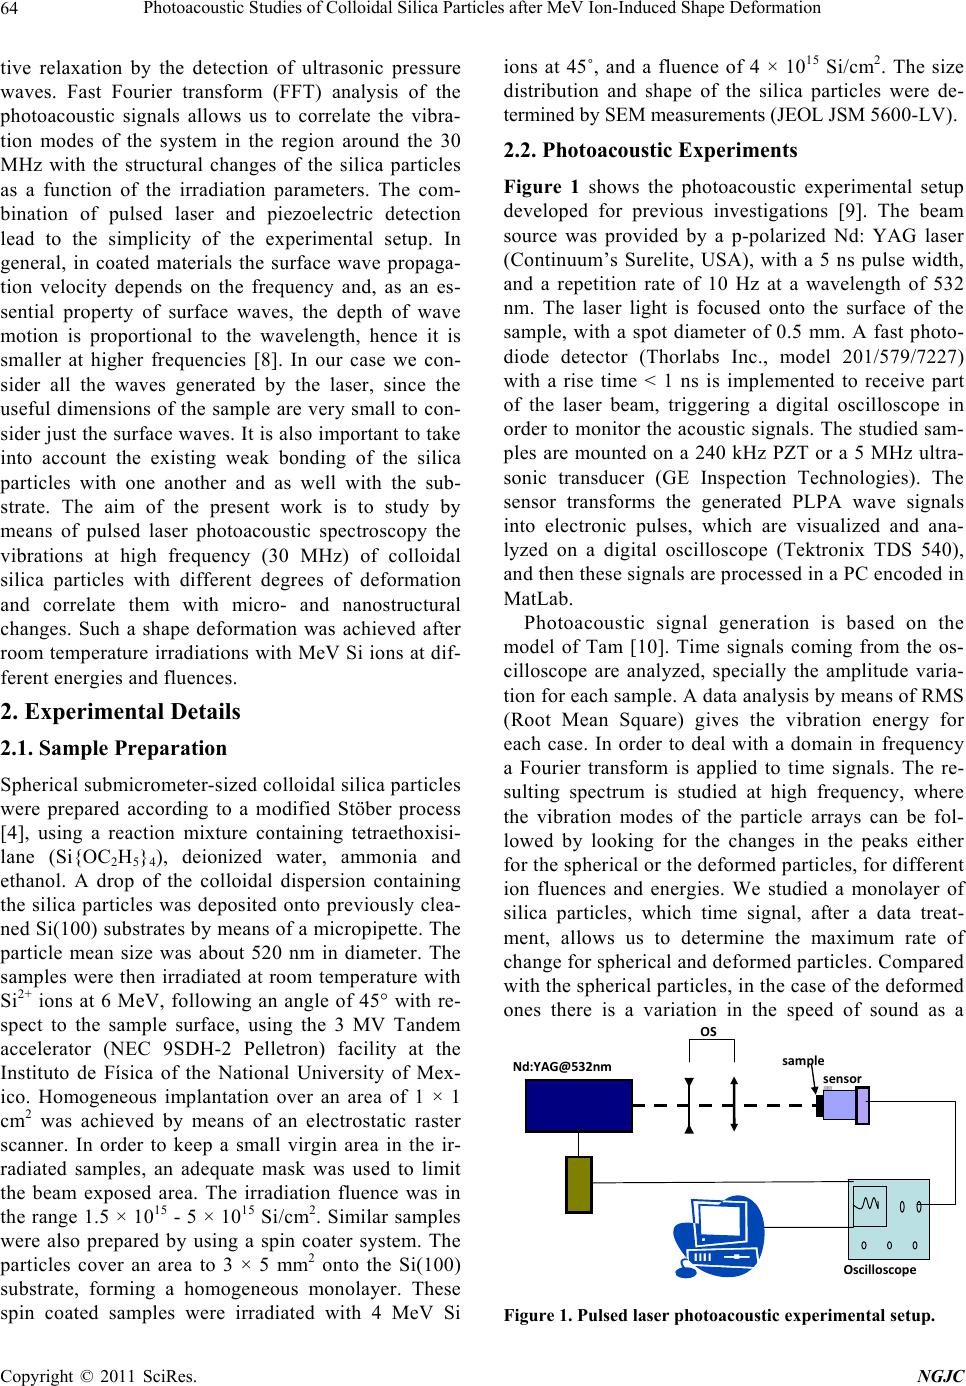
Figure 3 shows the corresponding set of PLPA sig-
nals exhibiting amplitude oscillations which decay as
the acoustic wave loses energy. Compared with the
other samples, the bare Si substrate shows a similar
PLPA signal up to 0.05 ms (region not shown), and
then its amplitude rises to a higher value as can be
clearly seen in Figure 3. Indeed, the important feature
that we would like to highlight from this figure is the
noticeable difference in the PLPA signals from the bare
substrate and the spherical and oblate particles.
Spherical and deformed particles show similar signals,
but the amplitude for the spherical ones is consistently
greater over the entire time spectrum. In the case of the
deformed particles, the higher the deformation, the
lower the signal amplitude and the signal shifts slightly
to shorter times (to the left) as a function of the ion
fluence.
a
b
c
d
Figure 2. SEM micrographs corresponding to: (a) As-prepared
spherical silica particles (top view); (b) 1.5 × 10¹⁵ Si/cm2, (c)
3 × 10¹⁵ Si/cm2, (d) 4.5 × 10¹⁵ Si/cm2 irradiated samples
(viewed in a direction perpendicular to the irradiation
beam, under an angle of 45° with respect to the sample
surface). The scale bar is 1 μm, except for (b), where it cor-
responds to 2 μm.
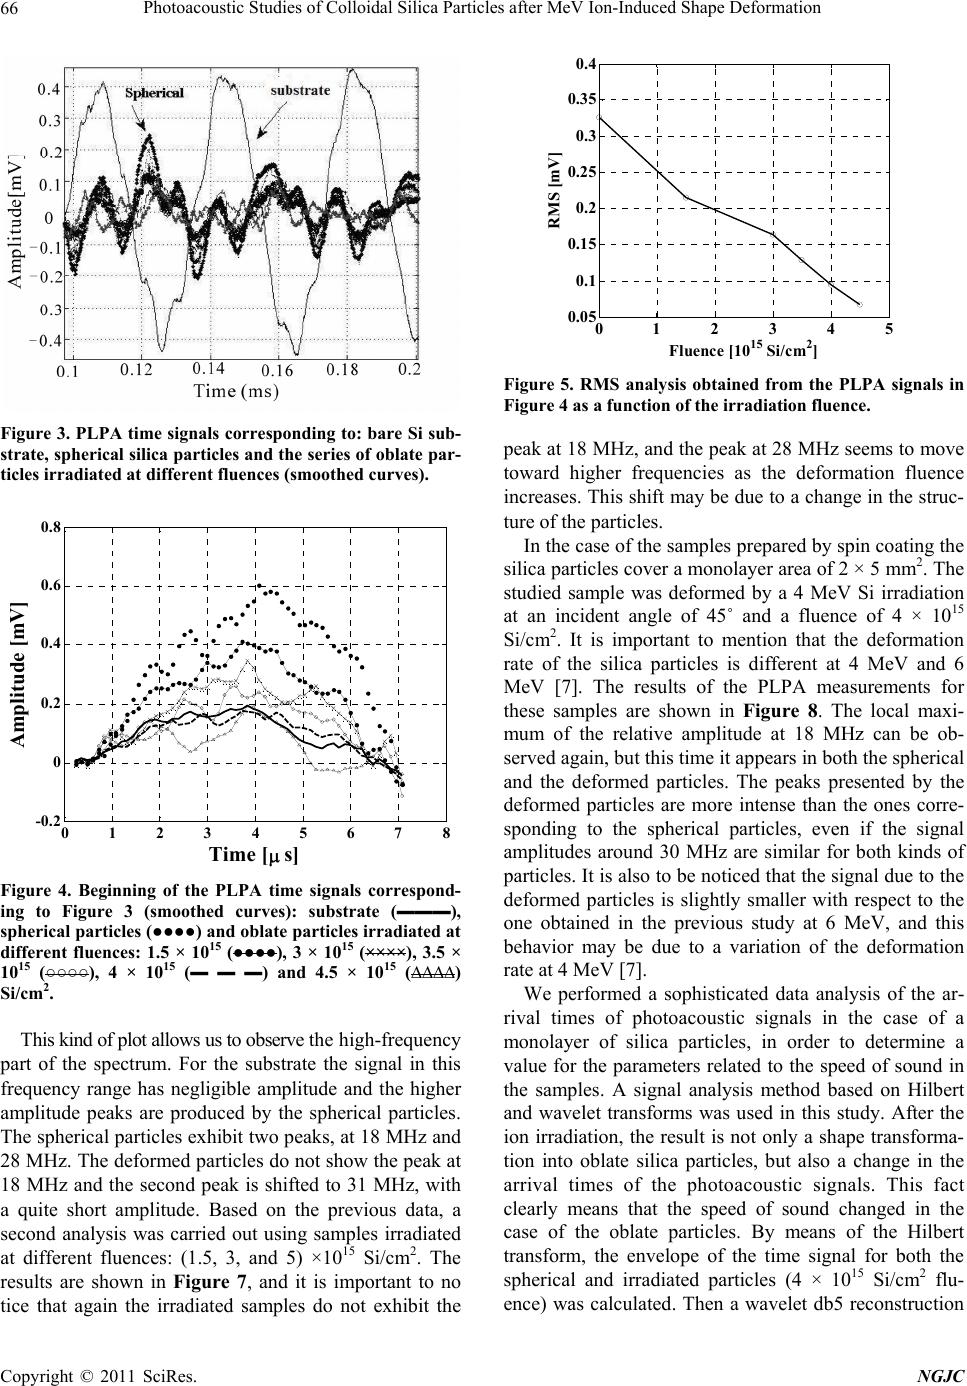
Figure 4 shows in detail the beginning of the previ-
ous signals once smoothed. Appearing after the initial
noise signal, the first local maxima were analyzed for
the different samples. Time signal exhibits a maximum
in amplitude for the spherical particles. For the irradi-
ated samples, their amplitude decreases systematically
as a function of the fluence up to 4.5 × 10¹⁵ Si/cm2. As
the shape deformation increases, the local maximum
corresponds to shorter arrival time. Therefore, the
speed of sound has different values for different de-
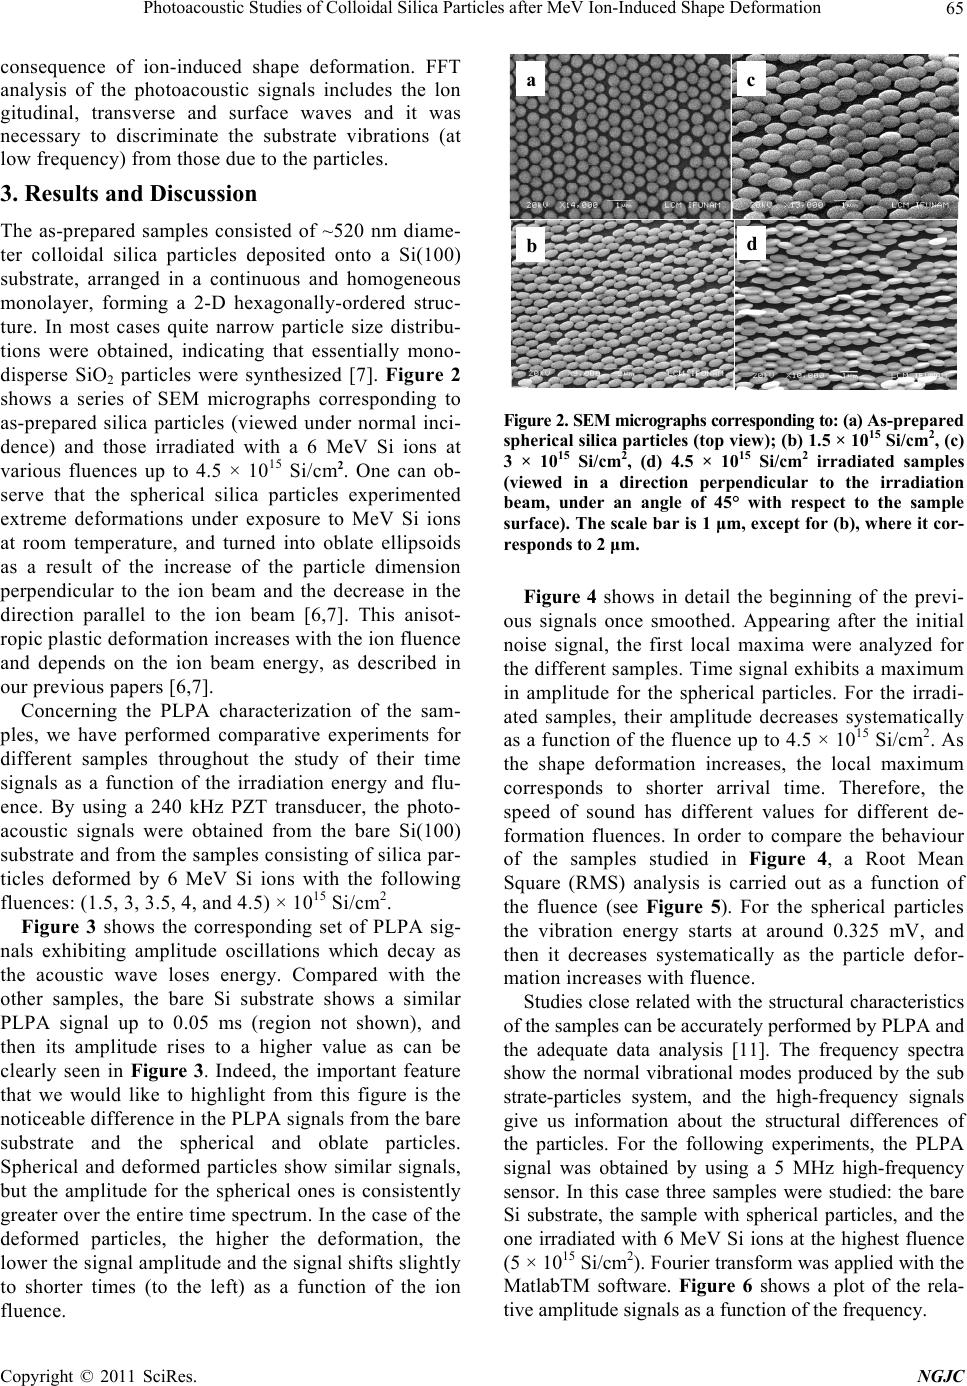
formation fluences. In order to compare the behaviour
of the samples studied in Figure 4, a Root Mean
Square (RMS) analysis is carried out as a function of
the fluence (see Figure 5). For the spherical particles
the vibration energy starts at around 0.325 mV, and
then it decreases systematically as the particle defor-
mation increases with fluence.
Studies close related with the structural characteristics
of the samples can be accurately performed by PLPA and
the adequate data analysis [11]. The frequency spectra
show the normal vibrational modes produced by the sub
strate-particles system, and the high-frequency signals
give us information about the structural differences of
the particles. For the following experiments, the PLPA
signal was obtained by using a 5 MHz high-frequency
sensor. In this case three samples were studied: the bare
Si substrate, the sample with spherical particles, and the
one irradiated with 6 MeV Si ions at the highest fluence
(5 × 10¹⁵ Si/cm2). Fourier transform was applied with the
MatlabTM software. Figure 6 shows a plot of the rela-
tive amplitude signals as a function of the frequency.
C
opyright © 2011 SciRes. NGJC