Paper Menu >>
Journal Menu >>
 Vol.1, No.2, 24-32 (2011) Open Journal of Animal Sciences doi:10.4236/ojas.2011.12004 Copyright © 2011 SciRes. Openly accessible at http://www.scirp.org/journal/OJAS/ Productive performance and blood metabolıtes as affected by protected protein in sheep A. A. Abdel-Ghani1, G. M. A. Solouma2, A. K. I. Abd Elmoty1, A. Y. Kassab2, E. B. Soliman1 1Department of Animal Production, Faculty of Agriculture, Minia University, Minia City, Egypt; 2Department of Animal Production, Faculty of Agriculture, Sohag University, Sohag, Egypt; profdradel@yahoo.com Received 19 April 2011, revised 5 May 2011, accepted 16 June 2011. ABSTRACT This investigation included two experiments. Experiment 1 was executed to study the effect of feeding different rations of protected protein of canola meal on digestibility and nutritive val- ues within sheep. Twenty male, healthy sheep were divided into five treatments according to the methods of protein protection (control, heat, sodium hydroxide, formaldehyde, and acetic acid treatments). Experiment 2 was carried out on developing lambs to investigate the effect of protected protein on growth performance and some blood metabolites. Animals in this ex- periment were also divided into the same treatments as Experiment 1. Animals in the first and second experiment were fed concentrate ration (80%) and wheat straw (20%) to cover the feed requirements. Nutritive values expressed as total digestible nutrients (TDN%) and di- gestible crude protein (DCP%) of the experi- mental rations was calculated. In the second experimental all animals were weighed biweekly and the amounts of rations were adjusted throughout the experimental period (120 days) according to their body weight change. Results indicated that in the first experimental protected protein by heat (HE) and sodium hy- droxide (NH) had positive (P < 0.05) effects on most of digestibility coefficients of different nu- trients. Protein protection methods also im- proved (P < 0.05) the nutritive values (TDN and DCP) in the HE treatment and NH treatment. In the second experiment body weight increased by 14% and 7% and also daily gain by 27% and14% in HE and NH, respectively, while FM and AC decreased body weight by 8% and 4.4%. Higher values (P < 0.01) in both thyroid hor- mones were observed in HE and NH than those other treatments. Also, higher values (P < 0.01) of total protein, albumin, and glucose were ob- served in HE and NH than other treatments. The control (CTL) group recorded higher concentra- tions of urea-N and creatinine at different peri- ods of the experiment in comparison with other treatments. Generally, from the present investi- gation it can be concluded that protected pro- tein of canola meal by heat or sodium hy droxide treatments were more efficient for productive performance and some blood metabolites of sheep. Keywords: Protected Protein; Performa nce; Blood Metabolites; Sheep 1. INTRODUCTION Protein is an expensive component of animal diets, and its content in diets of ruminant animals is very es- sential for improving the productive performance. Pro- tein content of some feedstuffs with high quality protein can be degraded in the rumen while 80 to 90% of the protein content of some feedstuffs with high quality protein may be degraded in the rumen (Beever, 1984). There are several methods for protected protein which can be categorized into chemical (e.g. sodium hydroxide (Mir et al, 1984), acetic acid (Waltz and Loerch, 1986) formaldehyde (Ferguson et al, 1967) and physical (e.g. heat) treatments (Stern et al., 1985). Incorporation of protected protein in diets is recommended in high pro- ducing animals to increase their productivity. Virk et al. (1994) reported that protected protein increased growth rate and nitrogen retention in goats. The beneficial ef- fects of protected protein on body weight and weight gain in lambs were established and documented (EL-Ayek et al., 1999 a and b). Economic value of sup- plemental protein feed is determined largely by the amount that escapes ruminal degradation and is available for digestion and absorption in the small intestine (Beauchemin et al., 1995 and Tomllinson et al., 1997). 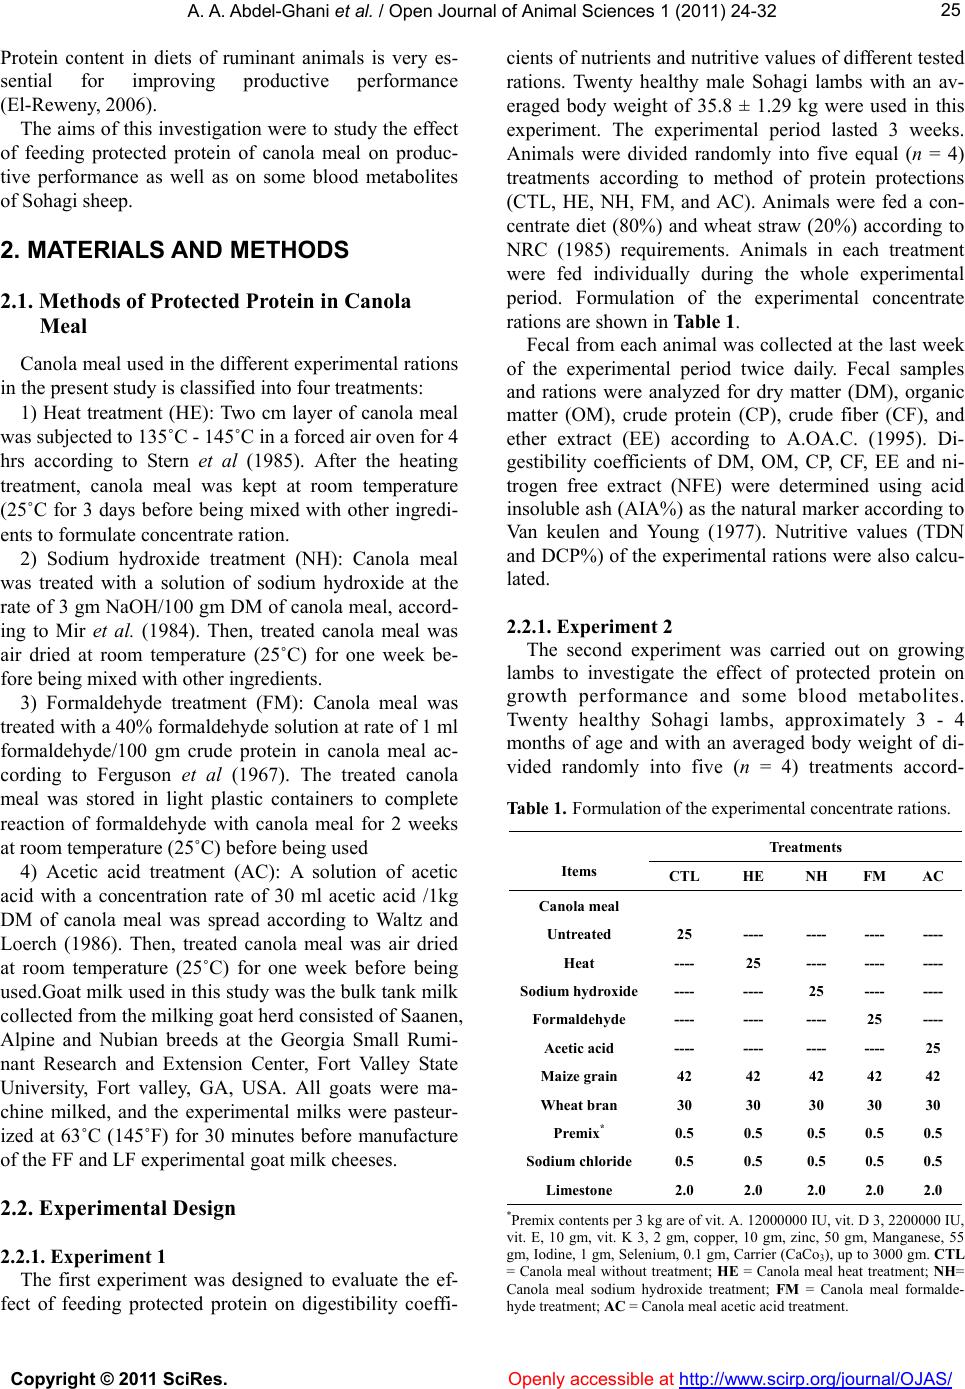 A. A. Abdel-Ghani et al. / Open Journal of Animal Sciences 1 (2011) 24-32 Copyright © 2011 SciRes. Openly accessible at http://www.scirp.org/journal/OJAS/ 2525 Protein content in diets of ruminant animals is very es- sential for improving productive performance (El-Reweny, 2006). The aims of this investigation were to study the effect of feeding protected protein of canola meal on produc- tive performance as well as on some blood metabolites of Sohagi sheep. 2. MATERIALS AND METHODS 2.1. Methods of Protected Protein in Canola Meal Canola meal used in the different experimental rations in the present study is classified into four treatments: 1) Heat treatment (HE): Two cm layer of canola meal was subjected to 135˚C - 145˚C in a forced air oven for 4 hrs according to Stern et al (1985). After the heating treatment, canola meal was kept at room temperature (25˚C for 3 days before being mixed with other ingredi- ents to formulate concentrate ration. 2) Sodium hydroxide treatment (NH): Canola meal was treated with a solution of sodium hydroxide at the rate of 3 gm NaOH/100 gm DM of canola meal, accord- ing to Mir et al. (1984). Then, treated canola meal was air dried at room temperature (25˚C) for one week be- fore being mixed with other ingredients. 3) Formaldehyde treatment (FM): Canola meal was treated with a 40% formaldehyde solution at rate of 1 ml formaldehyde/100 gm crude protein in canola meal ac- cording to Ferguson et al (1967). The treated canola meal was stored in light plastic containers to complete reaction of formaldehyde with canola meal for 2 weeks at room temperature (25˚C) before being used 4) Acetic acid treatment (AC): A solution of acetic acid with a concentration rate of 30 ml acetic acid /1kg DM of canola meal was spread according to Waltz and Loerch (1986). Then, treated canola meal was air dried at room temperature (25˚C) for one week before being used.Goat milk used in this study was the bulk tank milk collected from the milking goat herd consisted of Saanen, Alpine and Nubian breeds at the Georgia Small Rumi- nant Research and Extension Center, Fort Valley State University, Fort valley, GA, USA. All goats were ma- chine milked, and the experimental milks were pasteur- ized at 63˚C (145˚F) for 30 minutes before manufacture of the FF and LF experimental goat milk cheeses. 2.2. Experimental Design 2.2.1. Experiment 1 The first experiment was designed to evaluate the ef- fect of feeding protected protein on digestibility coeffi- cients of nutrients and nutritive values of different tested rations. Twenty healthy male Sohagi lambs with an av- eraged body weight of 35.8 ± 1.29 kg were used in this experiment. The experimental period lasted 3 weeks. Animals were divided randomly into five equal (n = 4) treatments according to method of protein protections (CTL, HE, NH, FM, and AC). Animals were fed a con- centrate diet (80%) and wheat straw (20%) according to NRC (1985) requirements. Animals in each treatment were fed individually during the whole experimental period. Formulation of the experimental concentrate rations are shown in Table 1. Fecal from each animal was collected at the last week of the experimental period twice daily. Fecal samples and rations were analyzed for dry matter (DM), organic matter (OM), crude protein (CP), crude fiber (CF), and ether extract (EE) according to A.OA.C. (1995). Di- gestibility coefficients of DM, OM, CP, CF, EE and ni- trogen free extract (NFE) were determined using acid insoluble ash (AIA%) as the natural marker according to Van keulen and Young (1977). Nutritive values (TDN and DCP%) of the experimental rations were also calcu- lated. 2.2.1. Experiment 2 The second experiment was carried out on growing lambs to investigate the effect of protected protein on growth performance and some blood metabolites. Twenty healthy Sohagi lambs, approximately 3 - 4 months of age and with an averaged body weight of di- vided randomly into five (n = 4) treatments accord- Table 1. Formulation of the experimental concentrate rations. Treatments Items CTL HE NH FM AC Canola meal Untreated 25 ---- ---- ---- ---- Heat ---- 25 ---- ---- ---- Sodium hydroxide---- ---- 25 ---- ---- Formaldehyde ---- ---- ---- 25 ---- Acetic acid ---- ---- ---- ---- 25 Maize grain 42 42 42 42 42 Wheat bran 30 30 30 30 30 Premix* 0.5 0.5 0.5 0.5 0.5 Sodium chloride 0.5 0.5 0.5 0.5 0.5 Limestone 2.0 2.0 2.0 2.0 2.0 *Premix contents per 3 kg are of vit. A. 12000000 IU, vit. D 3, 2200000 IU, vit. E, 10 gm, vit. K 3, 2 gm, copper, 10 gm, zinc, 50 gm, Manganese, 55 gm, Iodine, 1 gm, Selenium, 0.1 gm, Carrier (CaCo3), up to 3000 gm. CTL = Canola meal without treatment; HE = Canola meal heat treatment; NH= Canola meal sodium hydroxide treatment; FM = Canola meal formalde- hyde treatment; AC = Canola meal acetic acid treatment.  A. A. Abdel-Ghani et al. / Open Journal of Animal Sciences 1 (2011) 24-32 Copyright © 2011 SciRes. Openly accessible at http://www.scirp.org/journal/OJAS/ 26 16.80 ± 0.23 kg, were used in this study. Animals were ingto the rations type in the first experiment. The ex- perimental period lasted for 4 months. Animal fed on concentrate feed mixture rations (80%) and wheat straw (20%) to cover the requirement of DM and TDN for average daily gain (ADG) and body weights (BW) according to NRC (1985). Animals’ body weights were recorded every 15 days, and the amounts of ration were adjusted throughout the experimental pe- riod according of the BW changes. Fresh water was available at all times. Total dry matter intake and total protein intake (from concentrate diets and wheat straw) per animal and treat- ment were recorded. Daily dry matter, protein intakes, and body weight gains were also calculated. Dry matter and protein efficiency were also calculated. Blood samples (about 8 ml/animal) were collected at the beginning of the experiment and then at monthly intervals. Blood samples were allowed to clot at room temperature, and serum was then separated by centrifu- gation at 3000 r.p.m for 15 minutes. Serum samples were divided into two parts and then transferred into dry glass vials and stored at -20 C until subsequent analysis. In the first part of the serum, the concentration values of total protein (g/dl), albumin (g/dl), glucose (mg/dl), creatinine (mg/dl) and urea-N (mg/dl) were determined by spec- trophotometer using commercial kits produced by the Stanbio Company. Globulin (g/dl) values were deter- mined by subtracting albumin values from total protein values. The second part of the serum was used to deter- mine the concentrations of triiodothyronine (FM) and thyroxin (AC) hormones using radioimmunoassay of serum techniques. The coat-A count T3 kits produced by Diagnostic Products Corporation (USA) were used for the determination of serum triiodothyronine concentra- tion according to Bates (1994). The coat-A count kits produced by Diagnostic Products Corporation (USA) were used for the determination of serum thyroxine concentration according to Albertini (1982). 2.3. Statistical Analysis Results were statistically analyzed using the General Linear Model (SAS, 1998) for Complete Randomized Design (CRD). Productive performance and blood pa- rameters were performed by methods of analysis of variance. Significant differences among treatments means were tested using Duncan, (1955). 3. RESULTS AND DIS CUSSION 3.1. Digestibility Coefficients and Nutritive Values Data presented in Table 2 illustrates that the different protected protein methods led to significantly improved (P < 0.05) digestible coefficient values of different nu- trients except crude fiber. Also, the nutritive values (TDN% and DCP%) significantly improved as a result of using different protected protein methods. The present results show that protected protein by heat and sodium hydroxide treatments increased the values of TDN by 4.2% and 2.6% respectively, as compared with the CTL. Also, DCP values increased by 6.6% and 5.02% for HE and NH in comparison with the CTL treatment. Con- versely, FM and AC treatments had adverse effect on TDN% and DCP%, but the differences were not signifi- cant among the CTL treatment, FM, and AC. The im- provement of TDN and DCP values may be due to en- hanced digestibility coefficient of nutrients in response to the protected protein methods by heat and sodium hydroxide treatments. Similar results were reported by EL-Reweny 1999 and 2006, who also indicated that the values of TDN were significant higher in sheep fed diet supplemented with protected protein in concentrate feed mixture. 3.2. Growth Performance of Lambs Data in Ta b l e 3 shows the effect of protected protein treatments on body weight, total gain, and daily gain. Body weight, total gain, and daily gain of lambs showed the highest values in HE followed by NH, CTL, AC and FM, respectively. Results indicate that the protected protein by HE and NH treatments increased body weight at the end of experimental period by 14% and 7% re- spectively, as compared to CTL treatment, while FM and AC treatments decreased body weight by 8% and 4.4 respectively, compared to CTL treatment. A similar trend was observed in total gain and daily gain. This trend could be related to the higher values of the nutrients di- gestibility coefficients and feeding values (TDN and DCP) in HE and NH than in the other tested rations (Ta- ble 2). Moreover, many investigators indicated that the ru- minal undegradable proteins increase as a result of pro- tected protein. Ruminal undegradable proteins bypass to the abomasum and, subsequently, increase the amino acids yield in the abomasum of the host and, hence, in- crease the retained nitrogen and growth performance (Beauchemin et al., 1995 and Tomllinson et al., 1997). In addition, Taie (1998) found that there was a strict correlation between dietary protein and average daily gain in sheep. The present results are in agreement with those finding from El-Reweny (1999), El-Ayek et al., (1999 b) and Khalafalla (2004). The presented results in Table 3 indicate that the total dry matter intake and total protein intake values in the different treatments (CTL, HE, NH, FM and AC) are nearly similar. The total  A. A. Abdel-Ghani et al. / Open Journal of Animal Sciences 1 (2011) 24-32 Copyright © 2011 SciRes. Openly accessible at http://www.scirp.org/journal/OJAS/ 2727 Table 2. Effect of treatment on the nutrients digestibility coefficients and nutritive value of the experimental rations. Digestibility coefficien ts (LSM)• Treatments DM OM CP EE CF NFE TDN DCP CTL 66.03c 68.04c 67.84c 67.69c 61.23 69.39c 65.27c 9.96c HE 69.77a 71.42a 71.87a 71.30a 61.11 72.51a 68.01a 10.62a NH 67.79b 69.76b 70.31b 69.69b 61.76 71.21b 66.98b 10.46a FM 62.69d 65.43d 66.83c 67.12c 59.66 68.35 c 64.09 c 9.91c AC 62.94d 65.60d 67.11c 67.20c 59.38 68.52 c 64.14 c 10.01c ±SE 1.44 1.57 1.19 1.38 1.05 1.00 1.32 0.36 Sig. * * * * NS * * * •Values are least square means (LSM) ± standard error; a, b, c, d values with different letters in the same column are significantly different,*(P < 0.05), NS = Not significant. Table 3. Effect of protected protein methods on some productive performance of lambs during the experimental periods. Treatments (LSM)• Items CTL HE NH FM AC ±SE Sig. Initial weight 16.80 17.00 16.80 16.80 16.60 0.23 NS Final weight 34.20 c 39.00a 36.60b 31.50e 32.70d 0.29 ** Total gain (Kg) 17.40c 22.00a 19.80b 14.70e 16.10d 0.24 ** Daily gain (g/d) 144.40c 183.00a 164.40b 122.00e 133.80d 1.97 ** Total dry matter intake (g/d) 800.62 810.72 811.87 798.45 806.89 3.54 NS Total protein intake (g/d) 117.61 119.74 120.81 118.48 120.38 0.67 NS Dry matter effi- ciency 0.18c 0.2a 0.20b 0.15e 0.17d 0.01 ** Protein efficiency 1.23c 1.53a 1.36b 1.03e 1.10d 0.02 ** •Values are least square means (LSM) ± standard error; a, b, c, d values with different letters in the same row are significantly different; **(P < 0.01), NS = Not significant; Total gain calculated by subtracts initial body weight from final body weight; Daily gain calculated by divided total gain on 120 days. dry matter intake during the experimental period in the different experimental treatments ranged from 798.45 to 811.87 g/d, while the total protein intake from concen- trate and roughage ranged from 117.61 to 120.81 g/d. The values of dry matter and protein efficiency were significantly different (P < 0.01). The highest values were obtained with HE followed by NH and CTL, while the lowest values were recorded in FM and AC. Pro- tected protein supplementation increased dry matter effi- ciency for lambs fed HE and NH rations by 27.8 and 11.1%, respectively, as compared with CTL group. Conversely, protected protein by FM treatment and AC treatment decreased dry matter efficiency for lambs fed FM and AC rations by 16.7 and 5.6% respectively, compared with those fed CTL ration. The improvement of dry matter efficiency and protein efficiency values in HE and NH may be due to the positive effects of pro- tected protein methods on digestibility coefficients of most nutrients, feeding values, and/or the significant, positiveeffects of these treatments on daily gain. At the same time there are no significant effects of treatment on total dry matter intake or total protein intake. These re- sults are in agreement with Abd El- Maksoud (1990) and Virk et al (1994) who found no improvement in feed conversion when were goats fed protein treated diet compared with the CTL. Recently however, El- Reweny (2006) observed that lambs fed protected protein diets revealed significantly high (P < 0.05) feed conversion compared with those fed CTL diet. 3.3. Blood Metabolites 3.3.1 Th yr oi d Hormones Blood serum triiodothyronine and thyroxin concentrations at experimental periods in ram lambs groups are pre- sented in Table 4. Thyroxin values differed significantly  A. A. Abdel-Ghani et al. / Open Journal of Animal Sciences 1 (2011) 24-32 Copyright © 2011 SciRes. Openly accessible at http://www.scirp.org/journal/OJAS/ 28 (P < 0.01) at the 2nd and 4th month stages of testing. Thyroid hormones concentrations recorded were sig- nificantly different (P < 0.01) concerning the effect of treatments (regardless of age) on serum. Triiodothyronine concentration increased by 7.94% and 2.33% for HE and NH compared with CTL. Also, the corresponding increase for thyroxin was 9.97% and 2.67%, respectively. Improvement in the secretion of thyroid hormone concentrations in HE and NH may be due to the increase of carbohydrate, fat, and protein me- tabolism, as reflected by a positive effect on digestibility coefficient of carbohydrate, fat, and protein (Table 2). Also, the increase in the secretion of thyroid hormones may be due to the increase of TDN values (Ta b l e 2 ) in HE and NH in comparison with the other treatments. There was a positive relationship between energy intake and the concentration of the thyroid hormones as re- ported by Tiirates (1997) and Ahmed (2003).Thyroid hormones are necessary for normal growth and devel- opment of mammals as reported by Shalaby and Shehata (1995) and Abdel-Hafez (1997). Concerning the effect of age (regardless of treatments) on serum triiodothyronine and thyroxin concentrations (Table 4), it can be ob- served that the lowest values of triiodothyronine and thyroxin concentrations were recorded at the beginning of experiment, while the highest values are recorded at the end of experimental period (after 4 months) . Results indicate that the values of triiodothyronine and thyroxin concentrations increased gradually with the advancement of age. Similar trends were observed by Hussein (1991), Yousef (1992), Shaban (2000) and Saleem (2006). They found that the two hormone con- centrations were increased by the advancement of age. 3.3.2 Total Protein, Albumin, and Globulin Concentrations Blood serum total protein, albumin, and globulin (g/dl) concentrations at the beginning and after 2 and 4 months in ram lambs of the experimental groups were presented in Table 5.Total protein and albumin values were sig- nificantly different (P < 0.05 or P < 0.01, respectively) at 2 and 4 months. Protected protein by HE or NH led to a significant increase of serum protein and albumin con- centrations at 2 and 4 months during the experimental period in comparison with those of the CTL, FM, and AC treatments. Generally, data in Table 5 indicate that the highest values of total protein and albumin were within HE and NH followed by CTL, FM and AC. The improvement in HE and NH values may be due to the increase of di- gestibility coefficient of CP and nutritive values ex- pressed as DCP (Table 2) as a result of protected protein methods (HE and NH treatments). A positive correlation between dietary protein and plasma protein concentra- tions were reported by Yousef and Zaki (2001) and Sha- hen et al. (2004). They found that the increase in di- gestibility of CP could be attributed to the increase in serum total protein and its fractions. Moreover, protec- tion of dietary proteins led to lower rumen degradability and higher concentrations of proteins escaping to the abomasum and small intestine by gastric and intestinal juices and, simultaneously, found higher absorption of dietary amino acids, which lead to high level of plasma protein. The present results were in agreement with those of Aly (2005) and Shabrawy (2006). They reported that values of serum total proteins, albumin, and globulin were increased (P < 0.01) when goats were fed protected protein in the diet. On the other hand, El-Reweny (1999 and 2006) found that the concentration of total protein, albumin, and globulin did not significantly change by using different sources of protein and protected protein treatment methods. Concerning the effect of age (regardless of treatments) on serum total protein and its fractions, data presented in Tabl e 5 , illustrates that there was a significance differ- ence (P < 0.01) among the different ages. The values (overall mean) of total protein increased gradually. From the present results, it is clear that serum total protein, albumin, and globulin tended to increase with advancing age. Similar results were reported with sheep by Hayder (1996 and 2004) and El-Reweny (2006). 3.3.3. Bloo d Urea Ni troge n, Creatini ne, and Glucose Blood serum urea-N (BUN), creatinine (Cr), and glu- cose (mg/dl) concentrations at three different intervals, of 0, 2, and 4 months, of the experiment are presented in Table 6. It can be noticed that differences in urea-N and creatinine values were not significant at the beginning of the experiment, but after 2 and 4 months, the values were significantly different (P < 0.01). Concentrations of urea-N and creatinine in CTL group showed the highest values at different testing periods in comparison with the other treatments, while the lowest values (P < 0.05) or (P < 0.01) of urea-N and creatinine were obtained in HE. Data in Table 6 illustrates that blood serum urea-N and creatinine concentrations in treatments groups (re- gardless of age) recorded were significantly different (P < 0.01). It can be observed that the values of urea-N and creatinine decreased as a result of protein protection more than those with untreated (CTL) feed. These dif- ferences may be due the reduction of ammonia concen- tration released through the microbial fermentation in rumen of lambs fed protected protein. Subsequently, then decreasing the absorbed ammonia via the ruminal wall, which in turn is converted into urea in liver. So, the decreased level of ammonia in rumen of sheep fed pro-  A. A. Abdel-Ghani et al. / Open Journal of Animal Sciences 1 (2011) 24-32 Copyright © 2011 SciRes. Openly accessible at http://www.scirp.org/journal/OJAS/ 2929 Ta b l e 4 . Effect of protected protein methods on the concentrations of Triiodothyronine and thyroxin in serum of lambs during ex- perimental periods. Treatments (LSM)• Items CTL HE NH FM AC ±SE Age effect Triiodothyronine (µg/dl) At the beginning 64.40 64.40 64.40 64.40 64.40 0.66NS 64.40C 2 months 96.86b 103.84a 95.74b 96.74b 93.09b 1.80** 97.25B 4 months 104.73ab 110.93a 107.41ab 102.52b 103.91ab 2.54NS 105.90A Treatment effect 84.56CB 91.28A 86.53B 84.68CB 82.27C 0.80** ±0.90** Thyroxin (µg/dl) At the beginning 2.99 2.99 2.99 2.99 2.99 0.05NS 2.99E 2 months 4.73b 5.07a 4.66b 4.22b 4.48b 0.18** 4.81C 4 months 5.03d 5.75a 5.29b 5.22d 5.01c 0.22** 5.36A Treatment effect 4.11D 4.52A 4.22B 3.95D 4.04C 0.07** ±0.09** •Values are least square means (LSM) ± standard error; a, b, c, d means with the same letters in same row are significantly different. A, B, C, D, E means with same letters in the same raw or the same column in each parameter are significantly different, **(P< 0.01), NS= Not significant. Ta bl e 5 . Effect of protected protein methods on total protein, albumin, and globulin concentrations in serum of lambs during the experimental periods. Treatments (LSM)• Items CTL HE NH FM AC ±SE Age effect Total protein (g/dl) At the beginning 4.86 4.86 4.86 4.86 4.86 0.22NS 4.86C 2 months 5.29b 5.40a 5.38a 5.28b 5.21c 0.06* 5.31B 4 months 6.08b 6.70a 6.63a 6.19b 6.13b 0.09** 6.35A Treatment effect 5.43B 5.66A 5.63A 5.39B 5.38B 0.05** ±0.18** Albumin(g/dl) At the beginning 2.75 2.75 2.75 2.75 2.75 0.06NS 2.75D 2 months 3.06c 3.27a 3.22ab 3.13bc 3.14bc 0.04** 3.16C 4 months 3.77bc 3.98a 3.91ab 3.70c 3.64c 0.05** 3.80A Treatment effect 3.23B 3.38A 3.36A 3.23B 3.20B 0.02** ±0.03** Globulin (g/dl) At the beginning 2.11 2.11 2.11 2.11 2.11 0.25NS 2.11CD 2 months 2.23 2.13 2.16 2.14 2.07 0.06NS 2.15C 4 months 2.30 2.72 2.72 2.49 2.49 0.11NS 2.54A Treatment effect 2.20 2.28 2.27 2.17 2.19 0.06NS ±0.02** •Values are least square means (LSM) ± standard error; a, b, c means with the same letters in same row are significantly different; A, B, C, D means with same letters in the same row or the same column in each parameter are significantly different, *(P < 0.05), **(P < 0.01), NS = Not significant tected protein was reflected in lower level of urea in their blood (El-Ayek 1999 a). Generally, the lower creatinine level in serum of lambs fed on protected protein may indicate the higher utilization of dietary proteins as a result of higher digestibility of CP (Table 2) in lambs fed protected protein more than the CTL. Daura and Reid (1991) reported that blood urea con- centration decreased (P < 0.01) in lambs fed diets con- taining protected soybean meal than CTL, which is in agreement with the present results. Also, El-Sherbieny (2000) found that plasma urea-N and creatinine de- creased when bulls were fed protected protein in concen- trate feed mixture as compared to CTL diet. In addition, El-Shabrawy (2000) found that protected protein method caused significant (P < 0.01) reductions in plasma urea-N concentrations as a result of heat or formaldehyde treated diets in comparison with untreated ones. Recently, El- Shabrawy (2006) found lower (P < 0.05) values of urea-N in plasma of goats receiving formalde- hyde soybean meal and heat soybean seed diets than those receiving untreated soybean meal diets. However, Guillaume et al. (1991), Bruckental et al. (1996), and Rodriguez et al. (1997) found a non-significant effect of protected dietary protein on the blood level of urea-N with dairy cows. Concerning the effect of age (regardless of treatments) on urea-N and creatinine concentrations, data in Table 6, illustrates that the values of urea-N increased gradually.  A. A. Abdel-Ghani et al. / Open Journal of Animal Sciences 1 (2011) 24-32 Copyright © 2011 SciRes. Openly accessible at http://www.scirp.org/journal/OJAS/ 30 Table 6. Effect of protected protein methods on urea-N, creatinine, and glucose concentrations in serum of lambs during the experi- mental periods. Treatments (LSM)• Items CTL HE NH FM AC ±SE Age effect Urea-N (mg/dl) At the beginning 8.49 8.49 8.49 8.49 8.49 0.08NS 8.49D 2 months 12.67a 9.83b 9.70b 9.56 b 9.49b 0.16** 10.25B 4 months 12.43a 9.79b 9.93b 10.38 b 10.52b 0.25** 10.61A Treatment effect 11. 33A 9.40B 9.42B 9.49 B 9.49 B 0.10** ±0.17** Creatinine (mg/dl) At the beginning 0.95 0.95 0.95 0.95 0.95 0.01NS 0.95CB 2 months 1.01a 0.93b 0.93b 0.95b 0.97ba 0.02** 0.96B 4 months 1.11a 0.94b 0.97b 0.96b 0.98b 0.03** 0.99B Treatment effect 1.06A 0.94B 0.95B 0.96B 0.98B 0.02** ±0.01** Glucose (mg/dl) At the beginning 80.58 80.59 80.46 80.36 80.28 0.68NS 80.45A 2 months 71.85bc 77.44a 73.64ab 68.45 c 72.64bc 1.40** 72.80CB 4 months 70.59 71.12 71.05 70.75 70.95 0.59NS 70.89C Treatment effect 73.08CD 76.77A 74.99B 71.96D 73.94C 0.55** ±0.79** •Values are least square means (LSM) ± standard error a, b, c means with the same letters in same row are significantly different; A, B, C, D means with same letters in the same row or the same column in each parameter are significantly different, *(P < 0.05), **(P < 0.01), NS = Not significant This result indicates that serum urea-N and creatinine increased with advancing age (Table 6). Consistent re- sults were reported by Rezaei-Roodbari and Zamiri (2003), and Hayder (2004). The effect of protected protein on glucose concentra- tions are presented in Table 6. The values of glucose after 2 months were significantly different (P < 0.01), while the differences at the beginning and after 4 months were not significant. Results of blood serum glucose concentrations (regardless of age) recorded the highest value in HE and NH in comparison with the other treat- ments. Ammann (1991) and Krober et al. (2000) ob- served that feeding protected protein increased plasma glucose in the blood. In addition, Aly (2005) reported that values of serum glucose were increased (P < 0.01) by using protected methionine and lysine in the diet. The improvement of glucose values in HE and NH compared with the other treatments may be due to the positive ef- fect of protein protection methods on the nutritive values expressed as TDN (Table 2). These results are in agree- ment with those of Hadley (1984). He reported that the high intake of energy supply may increase serum glu- cose concentration. Also, results obtained by Abd El- Latif (2003) indicated that values of blood glucose con- centration in growing Friesian calves were correlated with energy in the diets. Moreover, an increase of glu- cose concentrations in HE and NH compared with the other treatments may be due to the higher carbohydrate metabolism as a result of higher thyroid hormones secre- tion (Table 6). The increase in blood glucose in response to thyroid hormones may also be attributed to the in- crease of carbohydrate metabolism (Haper et al.1979). Thyroid hormones increase gluconeogensis and/or plasma glucose concentration in blood (Cole et al. 1994). Concerning the effect of age (regardless of treatments) on glucose concentrations (Ta b l e 6 ), it can be observed that the glucose concentration started at a high level at the beginning of the experiment then decreased progres- sively by the advancing of age of lambs. The decrease of glucose levels by the advancement of age may be due to high metabolic rates of young animals resulted from the high rates of cellular reactions, but this may also be partly attributed to the rapid synthesis of cellular reac- tion materials and growth of the body, which require moderate quantities of energy (Abd-El-Fattah (1993). Similar results were obtained by Yousef (1992) and Abd- El-Fattah (1993). They recorded that blood glucose lev- els significantly declined with an increase of age in calves (from 1 to 9 to 12 month of age). From the present results it can be concluded that pro- tected protein by HE or NH treatments were more effi- cient than the other treatments (CTL, FM, and AC). Both methods improved the digestibility coefficients and nu- tritive values of tested rations and also improved the productive performance of ram lambs (body weights, daily gains, total gains, feed efficiency, and protein effi-  A. A. Abdel-Ghani et al. / Open Journal of Animal Sciences 1 (2011) 24-32 Copyright © 2011 SciRes. Openly accessible at http://www.scirp.org/journal/OJAS/ 3131 ciency). In addition, the methods of protected protein had beneficial effects on some blood metabolites. REFERENCES [1] Abd El-Fattah, O.S.A. (1993) The effect of age on serum biochemical constituents in buffalo bull calves. M. Sc. Thesis, Faculity of Veterinary Medicine, Cairo University, Cairo. [2] Abd El-Latif, E.S.K. (2003) Nutritional studies on beef cattle. M. Sc. Thesis, Faculty of Agriculture, Cairo Uni- versity, Cairo. [3] Abdel-Hafez, M.A.M (1997) Effect of heat stress on fat-tailed crossbred sheep. M. Sc. Thesis, Faculty of Ag- riculture, Zagazig University, Cairo, Cairo. [4] Abd El-Maksoud, A.M.S. (1990) Protein solubility and degradability of some treated feedstuff fed to ruminants. Ph. D. Thesis, Faculty of Agriculture, Cairo University, Cairo. [5] Ahmed, S.K.S (2003) Studies on energy and protein al- lowances in ration for pregnant and milk producing buf- faloes. Ph.D. Thesis, Faculty of Agriculture, Ain Shams University, Cairo. [6] Albertini, A. (1982) Free Hormones in Blood. Elsevier Biomedical Press, Amsterdam. [7] Aly, M.T.A., (2005) Effect of rumen-protected amino acids supplementation to the diets on dairy animals per- formance. Ph.D. Thesis, Faculty of Agriculture, Ain Shams University, Cairo. [8] Ammann, H.M. (1991) Influence of protected fat and protected protein given separately or together on physi- ology of digestion in the rumen, abomasum and feces of sheep. Institute Fur Tierernahrung, Tierarztiche Hoch- schule Hannover, Germany. [9] A. O. A. C., (1995) Official method of analysis. 15th Edition, Association of Official Analytical Chemists, Washington D.C. [10] Bates, H.M. (1974) Clin. Lab. Prod: 16. Ultiger R.D. Serum triiodothyronine in man. Annual Reviews. [11] Beauchemin, K.A, MccLand, L.A., Jones, S.D.M. and Ckozub, G. (1995) Effect of crude protein content, pro- tein degradability and energy concentration of the diet on growth and carcass characteristics of lambs fed high concentrate. Canadian Journal of Animal Science, 5, 386. [12] Beever, D.E. (1984) Utilization of the energy and protein components of forage by ruminants-A United kingdom perspective. In: Horn, G.W., Ed., National Wheat Pasture Symposium, Proc. Oklahoma Agric. Exp. Sta., USA, 65. [13] Bruckental, I., Tagari, H., Arieli, A., Zamwell, S., Aha- roni, Y. and Genizi, A. (1996) The effect of undegradable crude protein supplementation on milk production and composition and reproduction of early lactation of cows. The Journal of Animal Science, 5, 95-. [14] Cole, N.A., Gallavan, R.H., Rodiguez, S.L. and Purdy, C.W. (1994) Influence of triiodothyronine injections on calf immune response to an infectious bovine rhinotra- cheitis virus challenge and nitrogen balance of lambs. The Journal of Animal Science, 72, 1263-1273. [15] Daura, M.T. and Reid, R.L. (1991) Energy and protected protein supplements to lambs fed on endophyte-infected tall fescue pasture. The Journal of Animal Science, 69, 358-368. [16] Duncan, D.B. (1955) Multiple range and Multiple F-test. Biometrics, 11, 1-42. [17] El-Ayek, M.Y., Mehrez, A.Z., El-Ayouty, S.A. and El-Shabrawy, H.M. (1999 a) Influence of source of pro- tein and protection methods on the performance of lacta- tion Friesian cows. Mansoura University Journal of Ag- ricultural Scienc e , 24, 3891-3903. [18] El-Ayek, M.Y., El-Ayouty, S.A., Zaki, A.A., Abou- Ammo, F.F. and El-Reweny, A.M. (1999 b) Response of growing lambs to feeding on total mixed rations contain- ing formaldehyde treated soybean meal and linseed meal. Mansoura University Journal of Agricultural Science, 24, 3904-3916. [19] El-Sherbieny, M.A.S. (2000) Effect of feeding protected protein diets on reproductive performance of Friesian bulls. M. Sc. Thesis, Faculty of Agriculture, Mansoura University, Mansoura. [20] El-Reweny, A.M.S. (2006) Effect of protected protein on production and reproduction performance in sheep. Ph. D. Thesis, Faculty of Agriculture, Tanta University, Tanta. [21] El-Reweny, A.M.S. (1999) Studies on evaluation of feed- stuffs Performance of lambs fed on total mixed ration containing formaldehyde treated soybean meal or linseed meal. M. Sc. Thesis, Faculty of Agriculture, Mansoura University, Mansoura. [22] El-Shabrawy, H.M. (2000) Effect of protected proteins on the milk yield. Ph. D. Thesis, Faculty of Agriculture, Mansoura University, Mansoura. [23] El-Shabrawy, H.M. (2006) Performance of goats fed protected protein during gestation and lactation. Egyptian Journal of Sheep, Goat and Desert Animals Science, 1, 213-232. [24] Ferguson, K.A., Henslely, J.A. and Reis, P.J. (1967) Nu- trition on wool growth: The effect of protecting dietary protein from microbial degradation in the rumen. Austra- lian Journal of Science, 30, 215-222. [25] Guillaume, B., Otterby, D.E., Stern, M.D., Linn, J.G. and Johnson, D.G. (1991) Raw or extruded soybean and ru- men-protected methionine and lysine in alfalfa-based di- ets for dairy cows. Journal of Dairy Science, 74, 1912-1922. [26] Hadley, M.E. (1984) Pancreatic hormones and metabolic regulation, thyroid hormones and hormones of males re- productive physiology. In: Endocrinology Ed., Pren- tice-Hall, Inc., Englewood Cliffs, New Jersy, 235-263, 292-317, 402-420. [27] Grodsky, G.M. (1979) Chemistry and function of hor- mones thyroid, pancreas and gastrointestinal tract, In: Haper, H.A., Rodwell, V.W. and Mayes, P.H. Eds., Re- view of Physical Chemistry, 7th Edition, Langer Medical Publication, Los Altos, 34, 511. [28] Hayder, M. (1996) Growth performance and some phy- siological parameters of suckling lambs fed ascorbic acid. M. Sc. Thesis, Faculty of Agriculture, Assiut University, Asyut. [29] Hayder, M. (2004) Performance of ewes fed sugarcane bagasse silage treated with different level of urea. Ph.D. Thesis, Faculty of Agriculture, Assiut University, Asyut. [30] Hussein, H. (1991) Evaluation of some prodctive and reproductive-related hormones in Egyptain male buffalo  A. A. Abdel-Ghani et al. / Open Journal of Animal Sciences 1 (2011) 24-32 Copyright © 2011 SciRes. Openly accessible at http://www.scirp.org/journal/OJAS/ 32 calves as affected by lactobacillus inoculation. Egyptian Journal of Animal Production, 28, 113-118. [31] Khalafalla, M.M.E. (2004) Performance of lambs fed on rations containing soybean meal treated with formalde- hyde and probiotics. Ph.D. Thesis, Faculty of Agriculture, Tanta University, Tanta. [32] KrÖber, T.F., Kreuzer, M., Senn, M., Langhans, W. and Sutter, F. (2000) Effect of rumen-protected methionine in a low protein ration on metabolic traits and performance of early lactating cows as opposed to rations with ele- vated crude protein content. Journal of Animal Physiol- ogy and Animal Nutrition, 84, 148-164. [33] Mir, Z., Macleod, G.K., Buchanan-Smith, J.G., Grieve, D.G. and Grovum, W.L. (1984) Methods for protecting soybean and canola proteins from degradation in the ru- men. Canadian Journal of Animal Science, 64, 853-865. [34] N R C, (1985) Nutrient requirements of sheep. 6th Edi- tion, National Academy of Sciences, National Research Council, Washington, D.C. [35] Rezaei-Roodbari, A. and Zamiri, M.J. (2003). Relation- ship between blood physiologic parameters and carcass characteristics in Iranian fat tailed sheep. Proceedings of IX World Conference on Animal Production, Proto Alegre, 26-31 October 2003. [36] Rodriguez, L.A., Stallings, C.C., Herbein, J.H. and McGilliard, M.L. (1997) Diurnal variation in milk and plasma urea nitrogen in Holstein and Jersey cows in re- sponse to degradable dietary protein and added fat. Journal of Dairy Science, 80, 3368-3376. [37] Saleem, A.M (2006) Some productive and physiological responses of buffaloes fed maize or sorghum silage under hot conditions. M. Sc. Thesis, Faculty of Agriculture, El-Minia University, Minia. [38] SAS, (1998) SAS User ś guide: Statistics, SAS Institute Inc., Cary. [39] Shaban, S.A.K. (2000) Effect of some natural additives on meat production from buffaloes. Ph. D. Thesis, Fac- ulty of Agriculture, Cairo University, Cairo. [40] Shahen, G.F., Zaki, A.A. and Yousef, H.M. (2004) Effect of feeding level on growth nutrient digestibility and feed efficiency for buffalo calves. Egyptian Journal of Nutri- tion and Feeds, 7, 11-. [41] Shalaby, T.H. and Shehata, E.I. (1995) Effect of dietary energy level and heat stress on the physiological re- sponses of Finn crossbred ewes. Process of 5th Scientific Conference on Animal Nutrition, Suez Canal University Ismalia, 1, 87-93. [42] Stern, M.D., Stantos, K.A. and Satter, L.D. (1985) Pro- tein degradation in rumen and amino acids absorption in small intestine of lactating dairy cattle fed heat treated whole soybeans. Journal of Dairy Science, 68, 45-56. [43] Taie, H.T. (1998) Effect of dietary levels of protein and fiber on digestion, performance and carcass traits of sheep. Egypti an J ou rn al of Nutrition and Feeds, 1, 23-. [44] Tiirates, T. (1997) Thyroxin, triiodothyronine and reserve triiodothyronine concentration blood plasma in relation to lactation stage, milk yield, energy and dietary intake in Estonia dairy cows. Acta Ve terinaria, 38, 339-. [45] Tomllinson, D.L., Janes, R.E., Bethared, G.L. and Mc- Gilliard M.L. (1997) Influence of undergradability of protein in the diet on intake, daily gain, feed efficiency, and body composition of Holstein Heifers. Journal of Dairy Science, 80, 943-948. [46] Van Keulen, J. and Young B.A. (1977) Evaluation of acid insoluble ash as a natural marker in ruminant digestibility studies. Journal of Animal Science, 47, 282-287. [47] Virk, A.S., Khatta, V.K., Tewatia, B.O. and Gupta, P.C. (1994) Effect of formaldehyde treated faba beans on nu- trient utilization and growth performance of goat kids. Small Ruminant Research, 14, 19-23. [48] Waltz, D.M. and Loerch, S.C. (1986) Effect of acid and alkali treatment of soybean meal on nitrogen utilization by ruminants. Journal of Animal Science, 63, 879-887. [49] Yousef, H.M. and Zaki, A.A. (2001) Effect of barley radical feeding on body weight gain and some physio- logical parameters of growing Friesian crossbred calves. Egyptian Journal of Nutrition and Feeds, 6 (Special Is- sue), 465-. [50] Yousef, M.M.M. (1992) Growth patterns of buffalo calves in relation to rumen development growth parame- ters treatment. Ph.D. Thesis, Faculty of Agriculture, Cairo University, Cairo. |