Paper Menu >>
Journal Menu >>
 Vol.1, No.2, 17-23 (2011) Open Journal of Animal Sciences doi:10.4236/ojas.2011.12003 Copyright © 2011 SciRes. Openly accessible at http://www.scirp.org/journal/OJAS/ Comparison of free fatty acid composition between low-fat and full-fat goat milk cheeses stored for 3 months under refrigeration W ass im No uira1, Young W. Park1*, Zehra Guler2, Thomas Terrill1 1Georgia Small Ruminant Research & Extension Center, Fort Valley State University, Fort Valley, USA; 2Department of Food Engineering, Mustafa Kemal University, Antakya, Turkey; parky@fvsu.edu Received 17 May 2011, revised 12 June 2011, accepted 20 June 2011. ABSTRACT Differences i n free fatty acid (FFA) co mpositions between low-fat (LF) a nd ful l-fa t ( FF: whol e m ilk) goat chees es were ev aluated d uring 3 mon ths at 4˚C refriger ation. T he t wo types of che eses were manufactured using a bulk milk from the mixed herd of Saanen, Alpine, and Nubian goat bree ds. LF cheeses were made using LF milk after cream separation. FFAs of all cheeses were ex- tracted in diisoprophyl ether using polypropyl- ene chromatography column, and FFA concen- trations were quantified using a gas chromato- graph equipped with a fused silica capillary column. Moisture, fat, protein contents (%) and pH of fresh LF and FF cheeses were: 55.1, 52.3; 1.30, 25.6; 35.7, 22.5; 5.40, 5.42, respectively. The FFA contents (mg/g cheese) of fresh FF and LF cheeses prior to storage treatments for C4:0, C6:0, C8:0, C10:0, C12:0, C14:0, C16:0, C18:0, C18:1, and C18:2 were: 0. 020, 0.0 72; 0. 070, 0. 035; 0.061, 0.055; 0.181, 0.167; 0.073, 0.047; 0.174, 0.112; 0.579, 0.152; 0.308, 0.202; 0.521, 0.174; and 0.057, 0.026, respectively. The respective FFA to total fatty acid ratios for 0, 1 and 3 months aged FF and LF cheeses were 8.44, 12.4; 6.31, 16.91; 12.03, 14.19. The LF cheeses gener- ated more FFA than FF cheeses, while actual FFA content in FF cheese was significantly higher than in LF cheese. The FFA contents of LF cheese at 0, 1 and 3 months storage were 48.0, 96.8 and 36.4% of those of FF cheese, re- spectively. It was concluded LF cheese gener- ated higher amount of FFA than FF cheese, al- though total FFA content was significantly (P<0.05) lower in LF cheese than in FF chees e. Keywords: Low Fat; Full Fat; Goat Milk Cheese; Storage, Free Fatty Acid, Lipolysis 1. INTRODUCTION Dietary fat has been implicated with coronary heart diseases, atherosclerosis, diabetes and other health pro- blems. Consumption of reduced or low fat dairy prod- ucts has been increasingly popular among health-con- scientious consumers in recent years [1]. Fat reduction, however, presents a challenging prob- lem because fat is important for texture and flavor of dairy products such as cheeses [2,3]. Fat reduction in hard and semi-hard cheeses results in undesirable rub- bery texture, lack of flavor, and/or presence of off-flavors [3,4]. Reduced-fat (RF) and low-fat (LF) cheeses which possess the characteristics of traditional full-fat (FF) cheeses have been in demand [5]. Many manufacturing procedures, therefore, have been sug- gested and investigated to maximize sensory quality of RF cheeses [6-8]. A myriad of biochemical and physical changes can occur in goat milk cheeses after manufacture due to rip- ening and degradation of nutrients in the products [9-11]. Positive correlations have been found between lipolyzed flavor, fat acidity and short chain free fatty acid contents [6,8,12]. The flavor intensity of Kasar cheese, a hard cheese, was closely related to C4 - C10 free fatty acids [13]. The presence of large amounts of free fatty acids (FFA) can facilitate the rate of lipid oxidation, and free fatty acids oxidize slightly greater rate than esterified to glycerol. Even-numbered fatty acids from butyric to lauric accounted for the major contribution to rancid flavor [11,14]. Flavor deterioration from lipid oxidation (reaction of milk lipids with oxygen) and/or lipolysis in dairy products creates serious problems in storage stabil- ity of the products [8,11,15,16]. The amount of FFA accumulated during ripening may be an overall measure of lipolysis, and is quite variable  W. Nouira et al. / Open Journal of Animal Sciences 1 (2011) 17-23 Copyright © 2011 SciRes. Openly accessible at http://www.scirp.org/journal/OJAS/ 18 depending on the type of cheese, lactic and secondary starters, rennet type used, ripening time, and manufac- turing methods and other factors [10,12,17]. The in- digenous milk lipase, rennet preparation and microbes entered intentionally or unintentionally during cheese processing and ripening are primarily responsible for the extent of lipolysis [12,17]. Although the effect of storage on levels of free fatty acids in low-fat and reduced-fat dairy cow products have been studied extensively, there is little information on such dairy goat products with respect to effect of storage, free fatty acid concentration and extent of lipolysis. Therefore, the objectives of this study were to: 1) deter- mine free fatty acid (FFA) concentrations of low-fat (LF) and full-fat (FF) goat milk cheeses stored for three months under refrigeration, and 2) compare FFA con- tents between the two types of goat milk cheeses as well as between different storage periods in relation to lipoly- sis of the products. 2. MATERIALS AND METHODS 2.1. Preparation of Goat Milk Goat milk used in this study was the bulk tank milk collected from the milking goat herd consisted of Saanen, Alpine and Nubian breeds at the Georgia Small Rumi- nant Research and Extension Center, Fort Valley State University, Fort valley, GA, USA. All goats were ma- chine milked, and the experimental milks were pasteur- ized at 63˚C (145˚F) for 30 minutes before manufacture of the FF and LF experimental goat milk cheeses. 2.2. Manufacture of Low-Fat (LF) and Full-Fat (FF) Goat Milk Cheeses Three batches of LF and 3 batches of FF semi-soft Cheddar-type caprine cheeses were manufactured at the University dairy plant, according to the modified proce- dures of Kosikowski [18] and Le Jaouen [19]. After pas- teurization, the whole (FF) milk was cooled to 32˚C in a 227 L cheese vat. Lyophilized mesophilic direct vat set starter culture (R704, 50 units, Chr. Hansen, Inc., Mil- waukee, WI) and single strength rennet (10.6 mL of rennet per 100 L milk; Chymax; Chr. Hansen, Inc., Mil- waukee, WI) were added to the milk and then allowed to coagulate for 30 minutes. The curd was cut using 1.6 cm wire knives and allowed to heal for 10 minutes. The temperature was gradually raised to 39˚C over 30 min- utes and the curd was cooked for 45 minutes, assuring for a firm curd. After draining whey, curds were salted at a rate of 2.5% of original milk weight and placed into150 × 150 mm cylindrical plastic molds and pressed at 40 psi overnight at room temperature in a vertical cheese press (Pneumatic Press, Kusel Equip. Co., Wa- tertown, WI). Cheeses were removed from the molds and vacuum packed in plastic pouches (FreshPak 500 vacuum pouches, Koch Supply, Kansas City, MO) using a vacuum packager (Koch Ultravac 250, Koch Supply, Kansas City, MO). For LF cheese manufacture, cream was separated from the pasteurized whole goat milk by a cream sepa- rator (Model 17584, Clair Co., Althofen, Austria), and then the LF cheese was made from the low-fat milk ac- cording to the same procedure used for FF cheese. 2.3. Experimental Design The experiment was conducted in a 2 × 3 × 3 factorial arrangement. Two types (LF and FF) of goat milk cheeses were manufactured in three batches, and the experimental caprine cheeses were stored for 3 different storage (aging) periods (0, 1 and 3 months). All treated cheese samples were analyzed for basic chemical compositions, pH, acid degree value (ADV) and free fatty acid and total fatty acid concentrations to determine the differences in the parameters between the two types of caprine milk cheeses. 2.4. Chemical Analysis 2.4.1. Analyses of Basic Nutrient Composition Percents of fat, protein, ash and total solids contents were analyzed according to the procedures of A. O. A. C. [20] and Richardson [21]. 2.4.2. pH Analysi s A 10 g cheese sample and 20 ml deionized water were homogenized in a Waring blender (Waring Products, Inc., New Hartford, CT). The pH of the cheeses were deter- mined using an Accumet model pH meter (No. 910; Fisher Scientific, Pittsburgh, PA). 2.4.3. Acid Degr ee Value (ADV) The ADV refers to measure of the amount of free fatty acids present in a fat sample, which is a quantitative in- dex of hydrolytic lipolysis in dairy products. ADV was determined by the Standard Methods for the Examina- tion of Dairy Products [21]. Approximately 10 g of sam- ple were grated, homogenized, and placed into a Bab- cock cheese bottle for fat extraction; 1 ml of the final extracted fat was titrated against the standard alcoholic 0.02N KOH solution. Calculation of ADV was per- formed using the following formula: ml KOH for sampleml KOH for blank N100 ADV= Weight of fatg where N = normality of KOH solution in methanol.  W. Nouira et al. / Open Journal of Animal Sciences 1 (2011) 17-23 Copyright © 2011 SciRes. Openly accessible at http://www.scirp.org/journal/OJAS/ 1919 2.4.4. Extraction of Free Fatty Acids in Cheese Samples Extraction of free fatty acids (FFA) was performed using the modified procedures of Deeth et al. [22]. A 1.5 g cheese sample was shredded and placed in a screw-capped test tube, and the internal standard (5 mL) C5 and C17 in diethyl ether, 0.3 mL 4 N H2SO4, 2.5 g Na2SO4, and hexane (5 mL) were added to the tube. The tube mixture was shaken for 1 min using a vortex mixer. Samples were allowed to stand for two hours. Then lipid extract was applied to a polypropylene column (Biorad, Los Angeles, CA, USA), which was conditioned with 5 mL hexane/diethyl ether (1:1, v/v) and the extract passed through the column a second time. This was followed by 2x5 mL hexane/diethyl ether (1:1, v/v) to remove all triacylglycerols. FFAs were eluted with 2 mL diisopro- pyl ether containing 6% formic acid (Merck, Darmstadt, Germany) and centrifuged at 2000 × g for 5 min. A 2 mL aliquot of the supernatant was used for gas chroma- tographic analysis. For each sample, two extractions of FFAs were carried out, and two chromatographic injec- tions made for each extract. 2.4.5. Quantification of Free Fatty Acids in Cheeses FFA concentrations of cheese samples were quantified using a gas chromatograph (17A-GC, Shimadzu Co., Japan) equipped with a fused silica capillary column (DB-FFAP; 30 m × 0.25 mm i.d. × 0.25 μm, Agilent Technologies, Wilmington, DE). Injector and detector temperature were 250 and 280˚C, respectively. Oven temperature was programmed from 50˚C to 230˚C at a rate of 5˚C per minute, with initial and final hold times of 5 and 20 min, respectively, and run time was 61 min- utes. The injection mode was splittless for 1 min, and the injection volume was 2 µL, with helium as carrier gas for 1 mL/min. Analyses were carried out in triplicate. 2.4.6. Extraction and Quantification of Total Fatty Acids (TFA) in Cheeses The extraction and quantification of all fatty acids were performed using fatty acids methyl esters (FAME) according to A. O. C. S. procedure [23] with some modi- fications. Total fatty acid compositions were determined by us- ing a gas chromatograph (17A-GC, Shimadzu Co., Japan) equipped with a fused silica capillary column (60 m length × 0.25 mm i.d. × 0.2 μm; SP 2380, Supelco Inc., Bellfonate, PA) with a flame ionization detector (FID). Oven temperature was programmed from 50˚C to 250˚C at a rate of 4˚C /min, with initial and final hold times of 2 and 10 min. Injector and detector temperatures were 220 and 250˚C, respectively. The injection mode was split injection, and injection volume was one µL. The carrier gas was helium at a rate of 2 mL/min. 2.5. Statistical Analysis The experimental data were analyzed for analysis of variance, correlation coefficients and Duncan’s multiple mean comparison as described by Steel and Torrie [24]. All data for unbalanced data were also analyzed by the general liner models procedure of SAS program [25]. 3. RESULTS AND DIS CUSSION Basic nutrient compositions of experimental LF and FF goat milk and their respective cheeses are shown in Tab le 1 . The respective fat contents (%) of LF and FF goat milk were 0.41 and 3.66, while those of LF and FF cheeses were 1.30 and 25.6, indicating substantial dif- ferences (P < 0.01) in fat contents in LF and FF milk and cheeses. The protein contents of LF and FF milk were slightly different, whereas those of LF and FF cheeses were significantly (P < 0.01) different because fat was removed in the LF cheese which had more dense protein matrix than FF cheese. When the acid degree values (ADV) were tested for the experimental cheeses, LF cheese regardless of the storage treatment did not have any detectable levels of ADV due to the original very low contents of fat in the cheeses (Table 2). However, the FF goat cheese showed continuous increase in ADV as the storage period ad- vanced from 0 month to 3 months, indicating that no detectable lipolysis occurred in LF cheese while gradual increase in lipolysis occurred in FF cheese (Table 2). However, there were no differences in pH values be- tween the FF and LF cheeses, nor between 0, 1 and 3 moths storage periods as shown in (Table 2). In a previ- ous report, pH of hard type goat cheeses were increased as the aging time advanced up to 6 months due to the formation of NH3 by catabolism of cheese proteins [16]. The FFA profiles of both FF and LF cheeses are shown in Ta bl e 3. Among all the detected free fatty ac- ids, only C6:0, C10:0 and C12:0 showed significant (P < 0.05) differences between the two cheeses during the 3 months storage period. The FF cheese contained the highest concentration of all these three free fatty acids after 3 months storage, indicating that FF cheese showed greater lipolysis evidenced by higher FFA level (Tables 2 and 3). All other free fatty acids except these 3 fatty acids did not show any statistically significant differ- ences between treatments, even if a few values appeared to be a little high but not different due to the higher variations in concentration between samples. It was also observed that the relative abundance of FFA after 3 months refrigerated aging of FF goat cheese in the de- scending order of our cheese samples were: C18:0, \\ 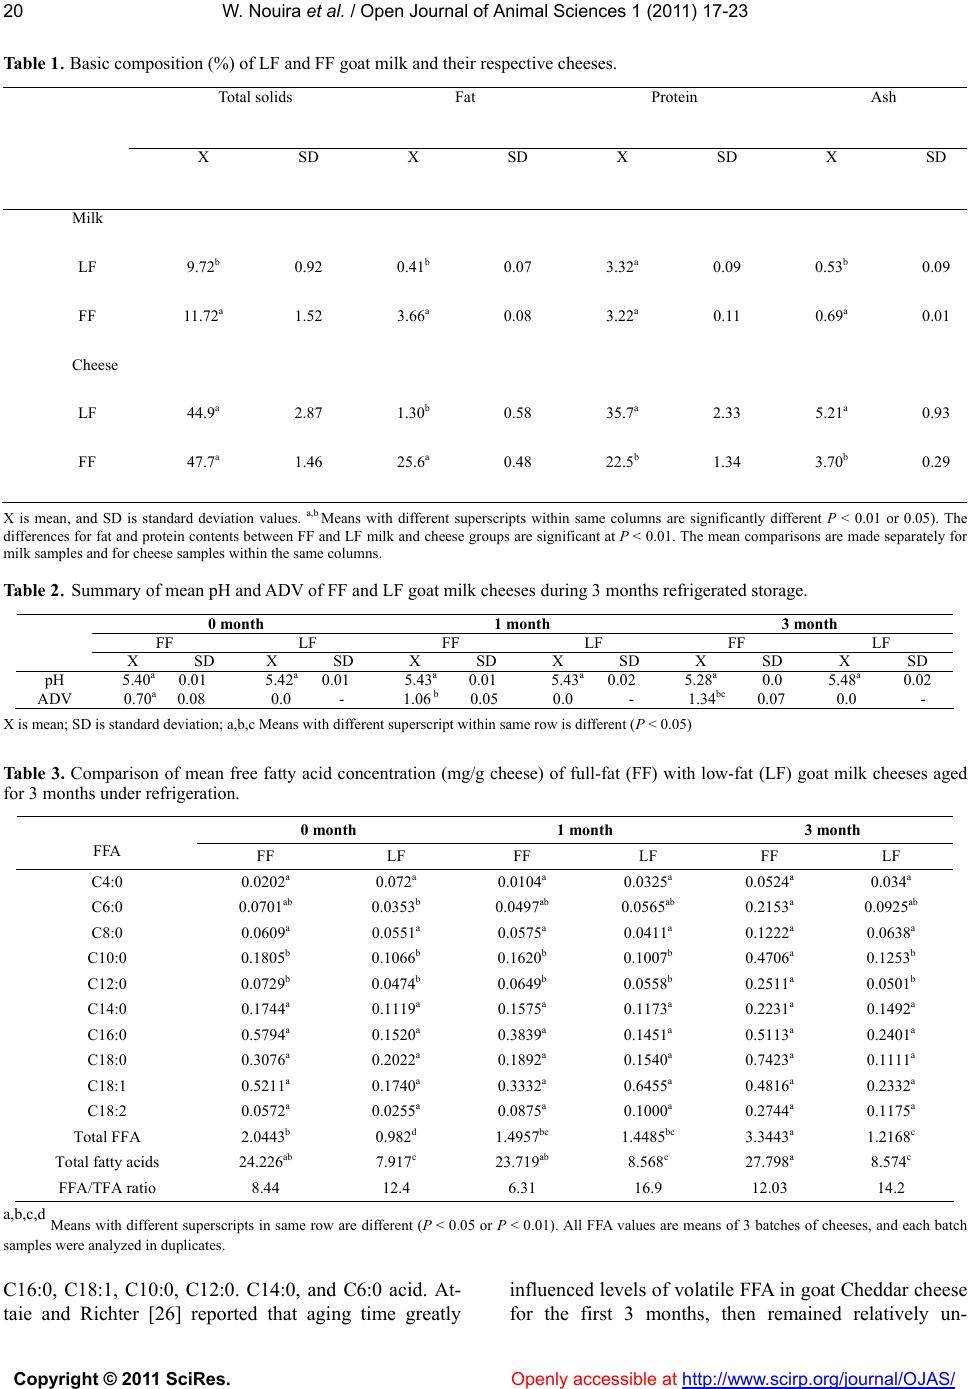 W. Nouira et al. / Open Journal of Animal Sciences 1 (2011) 17-23 Copyright © 2011 SciRes. Openly accessible at http://www.scirp.org/journal/OJAS/ 20 Table 1. Basic composition (%) of LF and FF goat milk and their respective cheeses. Total solids Fat Protein Ash X SD X SD X SD X SD Milk LF 9.72b 0.92 0.41b 0.07 3.32a 0.09 0.53b 0.09 FF 11.72a 1.52 3.66a0.08 3.22a0.11 0.69a 0.01 Cheese LF 44.9a 2.87 1.30b 0.58 35.7a 2.33 5.21a 0.93 FF 47.7a 1.46 25.6a0.48 22.5b1.34 3.70b 0.29 X is mean, and SD is standard deviation values. a,b Means with different superscripts within same columns are significantly different P < 0.01 or 0.05). The differences for fat and protein contents between FF and LF milk and cheese groups are significant at P < 0.01. The mean comparisons are made separately for milk samples and for cheese samples within the same columns. Table 2. Summary of mean pH and ADV of FF and LF goat milk cheeses during 3 months refrigerated storage. 0 month 1 month 3 month FF LF FF LF FF LF X SD X SD X SD X SD X SD X SD pH 5.40a 0.01 5.42a 0.01 5.43a 0.01 5.43a 0.02 5.28a 0.0 5.48a 0.02 ADV 0.70a 0.08 0.0 - 1.06 b 0.05 0.0 - 1.34bc 0.07 0.0 - X is mean; SD is standard deviation; a,b,c Means with different superscript within same row is different (P < 0.05) Table 3. Comparison of mean free fatty acid concentration (mg/g cheese) of full-fat (FF) with low-fat (LF) goat milk cheeses aged for 3 months under refrigeration. 0 month 1 month 3 month FFA FF LF FF LF FF LF C4:0 0.0202a 0.072a 0.0104a 0.0325a 0.0524a 0.034a C6:0 0.0701ab 0.0353b 0.0497ab 0.0565ab 0.2153a 0.0925ab C8:0 0.0609a 0.0551a 0.0575a 0.0411a 0.1222a 0.0638a C10:0 0.1805b 0.1066b 0.1620b 0.1007b 0.4706a 0.1253b C12:0 0.0729b 0.0474b 0.0649b 0.0558b 0.2511a 0.0501b C14:0 0.1744a 0.1119a 0.1575a 0.1173a 0.2231a 0.1492a C16:0 0.5794a 0.1520a 0.3839a 0.1451a 0.5113a 0.2401a C18:0 0.3076a 0.2022a 0.1892a 0.1540a 0.7423a 0.1111a C18:1 0.5211a 0.1740a 0.3332a 0.6455a 0.4816a 0.2332a C18:2 0.0572a 0.0255a 0.0875a 0.1000a 0.2744a 0.1175a Total FFA 2.0443b 0.982d 1.4957bc 1.4485bc 3.3443a 1.2168c Total fatty acids 24.226ab 7.917c 23.719ab 8.568c 27.798a 8.574c FFA/TFA ratio 8.44 12.4 6.31 16.9 12.03 14.2 a,b,c,d Means with different superscripts in same row are different (P < 0.05 or P < 0.01). All FFA values are means of 3 batches of cheeses, and each batch samples were analyzed in duplicates. C16:0, C18:1, C10:0, C12:0. C14:0, and C6:0 acid. At- taie and Richter [26] reported that aging time greatly influenced levels of volatile FFA in goat Cheddar cheese for the first 3 months, then remained relatively un- 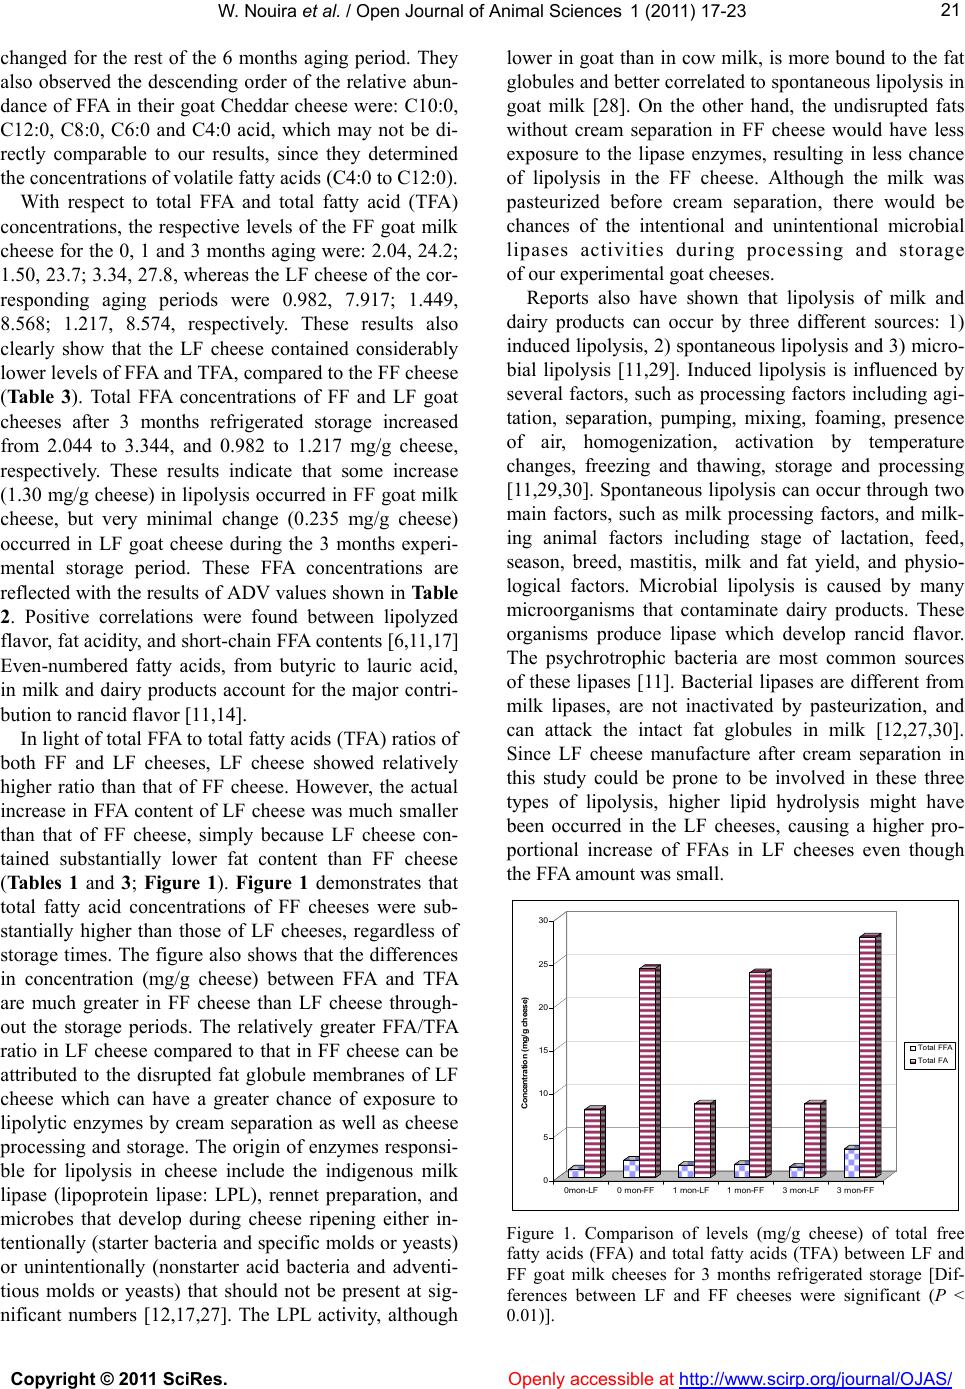 W. Nouira et al. / Open Journal of Animal Sciences 1 (2011) 17-23 Copyright © 2011 SciRes. Openly accessible at http://www.scirp.org/journal/OJAS/ 2121 changed for the rest of the 6 months aging period. They also observed the descending order of the relative abun- dance of FFA in their goat Cheddar cheese were: C10:0, C12:0, C8:0, C6:0 and C4:0 acid, which may not be di- rectly comparable to our results, since they determined the concentrations of volatile fatty acids (C4:0 to C12:0). With respect to total FFA and total fatty acid (TFA) concentrations, the respective levels of the FF goat milk cheese for the 0, 1 and 3 months aging were: 2.04, 24.2; 1.50, 23.7; 3.34, 27.8, whereas the LF cheese of the cor- responding aging periods were 0.982, 7.917; 1.449, 8.568; 1.217, 8.574, respectively. These results also clearly show that the LF cheese contained considerably lower levels of FFA and TFA, compared to the FF cheese (Tab le 3). Total FFA concentrations of FF and LF goat cheeses after 3 months refrigerated storage increased from 2.044 to 3.344, and 0.982 to 1.217 mg/g cheese, respectively. These results indicate that some increase (1.30 mg/g cheese) in lipolysis occurred in FF goat milk cheese, but very minimal change (0.235 mg/g cheese) occurred in LF goat cheese during the 3 months experi- mental storage period. These FFA concentrations are reflected with the results of ADV values shown in Table 2. Positive correlations were found between lipolyzed flavor, fat acidity, and short-chain FFA contents [6,11,17] Even-numbered fatty acids, from butyric to lauric acid, in milk and dairy products account for the major contri- bution to rancid flavor [11,14]. In light of total FFA to total fatty acids (TFA) ratios of both FF and LF cheeses, LF cheese showed relatively higher ratio than that of FF cheese. However, the actual increase in FFA content of LF cheese was much smaller than that of FF cheese, simply because LF cheese con- tained substantially lower fat content than FF cheese (Ta b l es 1 and 3; Figure 1). Figure 1 demonstrates that total fatty acid concentrations of FF cheeses were sub- stantially higher than those of LF cheeses, regardless of storage times. The figure also shows that the differences in concentration (mg/g cheese) between FFA and TFA are much greater in FF cheese than LF cheese through- out the storage periods. The relatively greater FFA/TFA ratio in LF cheese compared to that in FF cheese can be attributed to the disrupted fat globule membranes of LF cheese which can have a greater chance of exposure to lipolytic enzymes by cream separation as well as cheese processing and storage. The origin of enzymes responsi- ble for lipolysis in cheese include the indigenous milk lipase (lipoprotein lipase: LPL), rennet preparation, and microbes that develop during cheese ripening either in- tentionally (starter bacteria and specific molds or yeasts) or unintentionally (nonstarter acid bacteria and adventi- tious molds or yeasts) that should not be present at sig- nificant numbers [12,17,27]. The LPL activity, although lower in goat than in cow milk, is more bound to the fat globules and better correlated to spontaneous lipolysis in goat milk [28]. On the other hand, the undisrupted fats without cream separation in FF cheese would have less exposure to the lipase enzymes, resulting in less chance of lipolysis in the FF cheese. Although the milk was pasteurized before cream separation, there would be chances of the intentional and unintentional microbial lipases activities during processing and storage of our experimental goat cheeses. Reports also have shown that lipolysis of milk and dairy products can occur by three different sources: 1) induced lipolysis, 2) spontaneous lipolysis and 3) micro- bial lipolysis [11,29]. Induced lipolysis is influenced by several factors, such as processing factors including agi- tation, separation, pumping, mixing, foaming, presence of air, homogenization, activation by temperature changes, freezing and thawing, storage and processing [11,29,30]. Spontaneous lipolysis can occur through two main factors, such as milk processing factors, and milk- ing animal factors including stage of lactation, feed, season, breed, mastitis, milk and fat yield, and physio- logical factors. Microbial lipolysis is caused by many microorganisms that contaminate dairy products. These organisms produce lipase which develop rancid flavor. The psychrotrophic bacteria are most common sources of these lipases [11]. Bacterial lipases are different from milk lipases, are not inactivated by pasteurization, and can attack the intact fat globules in milk [12,27,30]. Since LF cheese manufacture after cream separation in this study could be prone to be involved in these three types of lipolysis, higher lipid hydrolysis might have been occurred in the LF cheeses, causing a higher pro- portional increase of FFAs in LF cheeses even though the FFA amount was small. 0 5 10 15 20 25 30 Concentration (mg/ g cheese) 0mon-LF0 mon-FF1 m on-LF1 mon-FF3 mon-LF3 mon-FF Total FFA Total FA Figure 1. Comparison of levels (mg/g cheese) of total free fatty acids (FFA) and total fatty acids (TFA) between LF and FF goat milk cheeses for 3 months refrigerated storage [Dif- ferences between LF and FF cheeses were significant (P < 0.01)].  W. Nouira et al. / Open Journal of Animal Sciences 1 (2011) 17-23 Copyright © 2011 SciRes. Openly accessible at http://www.scirp.org/journal/OJAS/ 22 4. CONCLUSIONS The profiles of free fatty acid compositions of the 0 to 3 months aged FF and LF caprine cheeses revealed that FF cheeses contained higher levels of all types of free fatty acids, except for the butyric acid in the initial cheeses. The total FFA contents of LF cheese were 48.0, 96.8 and 36.4 % of FF cheeses for 0, 1 and 3 months aging, indi- cating that the 1 month aged cheeses contained higher FFA than the 0 and 3 month stored ones. The LF cheese revealed more proportional increase in FFA compared to the FF cheese, although the actual amount of FFA in LF cheese was much lower than that in FF cheese. This re- sult may account for the higher lipolytic enzyme activi- ties in LF cheese by the indigenous milk enzymes, or microbial enzymes of intentional and unintentional mi- croorganisms which can have a greater access to the dis- rupted fat globule membranes by cream separation and subsequent cheese processing and storage. Further stud- ies may be necessary to ascertain what exact sources or mechanisms are involved in the elevation of FFA in LF caprine cheeses in order to prevent the increased lipoly- sis which may deteriorate the quality of low-fat goat milk cheeses. 5. ACKNOWLEDGEMENTS This study was supported by USDA 1890 Capacity Building Grant, Award No. 2007-38814-18518. The authors greatly appreciate Mr. Schauston Miller and Carlton Green for collection of goat milk and processing, and Ms. Ruby Ragan for her assistance in cheese manufac- ture. Dr. Zehra Güler was supported by the Scientific and Technological Research Council of Turkey, with 2219-postdoctoral research fellow- ships (TÜBİTAK-TURKEY, 2008) for a visiting scientist at Fort Valley State University, Fort Valley, GA, USA. REFERENCES [1] Thayer, A.M. (1992) Food Additives. Chemical Engi- neering News, 70, 26.doi:10.1021/cen-v070n024.p026 [2] Jameson, G.W. (1990) Cheese with less fat. Australian Journal of Dairy Technology, 11, 93. [3] Mistry, V.V. (2001) Low fat cheese technology. Interna- tional Dairy Journal, 11 , 413-422. doi:10.1016/S0958-6946(01)00077-2 [4] Olson, N.F. and Johnson, M.E. (1990) Light cheese prod- ucts: characteristics and economics. Food Technology, 44, 93-96. [5] Honer, C. (January 1993). Second thoughts. Dairy Field. Skokie. [6] Drake, M.A., Herrett, W., Boylston, T.D. and Swanson, B.G. (1995) Sensory evaluation of reduced fat cheeses. Journal of Food Science, 60, 898-901. doi:10.1111/j.1365-2621.1995.tb06256.x [7] Ashfield, M.A., Ma, L., Drake, M.A., Barbosa-Canovas, G.V. and Swanson, B.G. (1997) Rheology of full-fat and low-fat Cheddar cheeses as related to type of fat mimetic. [8] Carunchia Whetstine, M.E., Karagul-Yuceer, Y., Avsar, Y. and Drake, M.A. (2003) Identification and quantification of character aroma components in fresh Chevre-style goat cheese. Journal of Food Science, 68, 2441-2447. doi:10.1111/j.1365-2621.2003.tb07043.x [9] Fox, P.F. (1989) Proteolysis during cheese manufacture and ripening. Journal of Dairy Science, 72, 1379-1400. doi:10.3168/jds.S0022-0302(89)79246-8 [10] McSweeney, P. and Sousa, M. (2000). Biochemical path- ways for the production of flavor compounds in cheese during ripening: A review. Lait, 80, 293-324. doi:10.1051/lait:2000127 [11] Park, Y.W. (2001) Proteolysis and lipolysis of goat milk cheese. Journal of Dairy Science, 84 (E. Suppl.), E84-E92. [12] Velez, M.A., Perotti, M.C., Wolf, I.V., Hynes, E.R. and Zalazar, C.A. (2010) Influence of milk pretreatment on production of free fatty acids and volatile compounds in hard cheeses: Heat treatment and mechanical agitation. Journal of Dairy Science, 93, 4545-4554. doi:10.3168/jds.2010-3352 [13] Guler, Z. (2005) Quantification of free fatty acids and flavor characteristics of Kasar cheeses. Journal of Food Lipids, 12, 209-221. doi:10.1111/j.1745-4522.2005.00018.x [14] Ha, J.K. and Lindsay, R.C. (1991) Contributions of cow, sheep, and goat milks to characterizing branched-chain fatty acid and phenolic flavors in varietal cheeses. Jour- nal of Dairy Science, 74, 3267-3274. doi:10.3168/jds.S0022-0302(91)78512-3 [15] Day, E.A. (1960) Autoxidation of milk lipids. Journal of Dairy Science, 43, 1064. doi:10.3168/jds.S0022-0302(60)90329-5 [16] Jin, Y.K. and Park, Y.W. (1995) Effects of aging time and temperature on proteolysis of commercial goat cheeses in the US. Journal of Dairy Science, 78, 2598-2608. doi:10.3168/jds.S0022-0302(95)76888-6 [17] Collins, Y., McSweeney, P.L.H. and Wilkinson, M. (2003) Lipolysis and free fatty acid catabolism in cheese: A re- view of current knowledge. International Dairy Journal, 13, 841-846.doi:10.1016/S0958-6946(03)00109-2 [18] Kosikowski, F.V. (1977) Cheese and fermented milk foods, 2nd Edition, Edwards Brothers, Inc., Ann Arbor, 437-440. [19] Le Jaouen, J.-C. (1987) The fabrication of farmstead goat cheese. Cheesemaker’s Journal,Ashfield,MA 01330, 45. [20] AOAC. (1985) Official methods of analysis. 14th Edition, The Association of Official Analytical Chemists, Wash- ngton, D.C. No. 43.292. 7.001, 7.009, 7.006. [21] Case, R.A., Bradley, R.L. Jr. and Williams, R.R. (1985) Chemical and physical methods. In: Richardson, G.H. Ed., Standard Methods for the Examination of Dairy Prod- ucts.15th Edition, American Public Health Association, Washington, D.C., 327. [22] Deeth, H.C., Fitz-Gerald, C.H. and Snow, A.J. (1983) A GC method for the quantitative assay of free fatty acids. New Zealand Journal of Science and Technology, 18, 13-20. [23] AOCS. (1975) Official methods and recommended prac- tices of the american oil chemists’ society. American Oil Chemists’ Society, Champaign, No. 1, 3A and 6, 7-15. [24] Steel, R.G.D. and Torrie, J.H. (1960) Principles and Pro-  W. Nouira et al. / Open Journal of Animal Sciences 1 (2011) 17-23 Copyright © 2011 SciRes. Openly accessible at http://www.scirp.org/journal/OJAS/ 2323 cedures of statistics. McGraw-Hill, New York, 190. [25] SAS Institute. (1999) User’s guide: statistics, 8th Edition. SAS Institute, Inc., Cary. [26] Attaie, R. and Richter, R.L. (1996) Formation of volatile free fatty acids during ripening of Cheddar-like hard goat cheese. Journal of Dairy Science, 79, 717-724. doi:10.3168/jds.S0022-0302(96)76418-4 [27] Hickey, D.K., Kilcawley, K.N., Beresford, T.P. and Wil- kinson, M.G. (2007) Lipolysis in cheddar cheese made from raw, thermized, and pasteurized milks. Journal of Dairy Science, 90, 47-56. doi:10.3168/jds.S0022-0302(07)72607-3 [28] Chilliard, Y., Ferlay, A., Rouel, J. and Lamberet, G. (2003) A review of nutritional and physiological factors affecting goat milk lipid synthesis and lipolysis. Journal of Dairy Science, 86, 1751-1770. doi:10.3168/jds.S0022-0302(03)73761-8 [29] Deeth, H.C. and Fitz-Gerald, C.H. (1976) Lipolysis in dairy products: A review. Australian Journal of Dairy Technology, 31, 53-64.doi:10.1016/j.idairyj.2004.01.005 [30] Evers, J.M. (2004) The milkfat globule mem- brane-Compositional and structural changes post secre- tion by the mammary secretory cell. International Dairy Journal, 14, 661-674. |