Paper Menu >>
Journal Menu >>
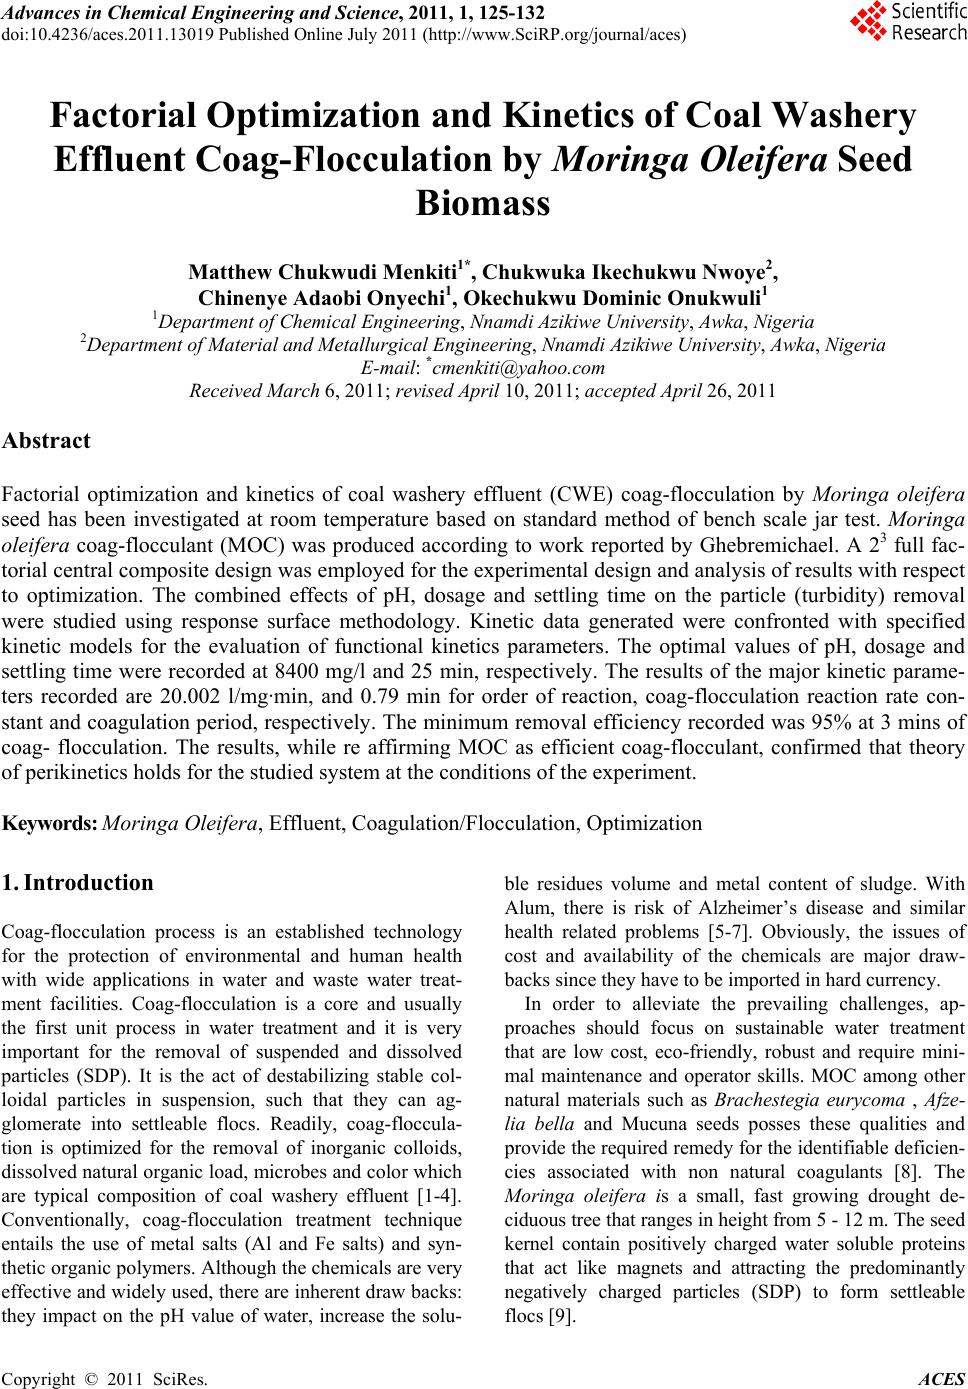 Advances in Chemical Engi neering and Science , 2011, 1, 125-132 doi:10.4236/aces.2011.13019 Published Online July 2011 (http://www.SciRP.org/journal/aces) Copyright © 2011 SciRes. ACES Factorial Optimization and Kinetics of Coal Washery Effluent Coag-Flocculation by Moringa Oleifera Seed Biomass Matthew Chukwudi Menkiti1*, Chukwuka Ikechukwu Nwoye2, Chinenye Adaobi Onyechi1, Okechukwu Dominic Onukwuli1 1Department of Chemical Engineering, Nnamdi Azikiwe University, Awka, Nigeria 2Department of Material and Metallurgical Engineering, Nnamdi Azikiwe University, Awka, Nigeria E-mail: *cmenkiti@yahoo.com Received March 6, 2011; revised April 10, 2011; accepted April 26, 2011 Abstract Factorial optimization and kinetics of coal washery effluent (CWE) coag-flocculation by Moringa oleifera seed has been investigated at room temperature based on standard method of bench scale jar test. Moringa oleifera coag-flocculant (MOC) was produced according to work reported by Ghebremichael. A 23 full fac- torial central composite design was employed for the experimental design and analysis of results with respect to optimization. The combined effects of pH, dosage and settling time on the particle (turbidity) removal were studied using response surface methodology. Kinetic data generated were confronted with specified kinetic models for the evaluation of functional kinetics parameters. The optimal values of pH, dosage and settling time were recorded at 8400 mg/l and 25 min, respectively. The results of the major kinetic parame- ters recorded are 20.002 l/mg·min, and 0.79 min for order of reaction, coag-flocculation reaction rate con- stant and coagulation period, respectively. The minimum removal efficiency recorded was 95% at 3 mins of coag- flocculation. The results, while re affirming MOC as efficient coag-flocculant, confirmed that theory of perikinetics holds for the studied system at the conditions of the experiment. Keywords: Moringa Oleifera, Effluent, Coagulation/Flocculation, Optimization 1. Introduction Coag-flocculation process is an established technology for the protection of environmental and human health with wide applications in water and waste water treat- ment facilities. Coag-flocculation is a core and usually the first unit process in water treatment and it is very important for the removal of suspended and dissolved particles (SDP). It is the act of destabilizing stable col- loidal particles in suspension, such that they can ag- glomerate into settleable flocs. Readily, coag-floccula- tion is optimized for the removal of inorganic colloids, dissolved natural organic load, microbes and color which are typical composition of coal washery effluent [1-4]. Conventionally, coag-flocculation treatment technique entails the use of metal salts (Al and Fe salts) and syn- thetic organic polymers. Although the chemicals are very effective and widely used, there are inherent draw backs: they impact on the pH value of water, increase the solu- ble residues volume and metal content of sludge. With Alum, there is risk of Alzheimer’s disease and similar health related problems [5-7]. Obviously, the issues of cost and availability of the chemicals are major draw- backs since they have to be imported in hard currency. In order to alleviate the prevailing challenges, ap- proaches should focus on sustainable water treatment that are low cost, eco-friendly, robust and require mini- mal maintenance and operator skills. MOC among other natural materials such as Brachestegia eurycoma , Afze- lia bella and Mucuna seeds posses these qualities and provide the required remedy for the identifiable deficien- cies associated with non natural coagulants [8]. The Moringa oleifera is a small, fast growing drought de- ciduous tree that ranges in height from 5 - 12 m. The seed kernel contain positively charged water soluble proteins that act like magnets and attracting the predominantly negatively charged particles (SDP) to form settleable flocs [9]. 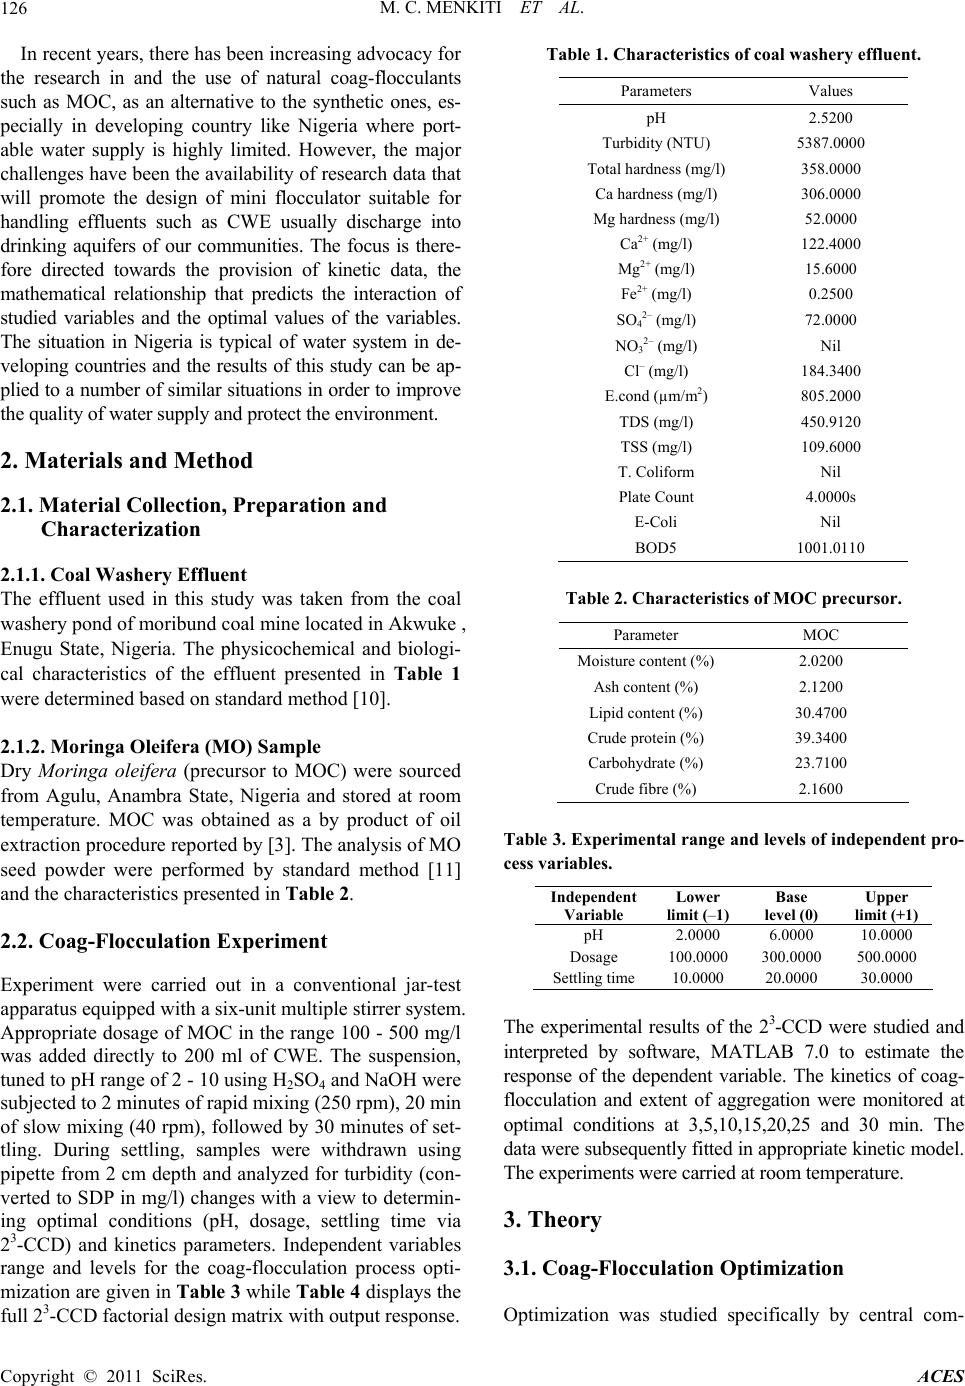 M. C. MENKITI ET AL. Copyright © 2011 SciRes. ACES 126 In recent years, there has been increasing advocacy for the research in and the use of natural coag-flocculants such as MOC, as an alternative to the synthetic ones, es- pecially in developing country like Nigeria where port- able water supply is highly limited. However, the major challenges have been the availability of research data that will promote the design of mini flocculator suitable for handling effluents such as CWE usually discharge into drinking aquifers of our communities. The focus is there- fore directed towards the provision of kinetic data, the mathematical relationship that predicts the interaction of studied variables and the optimal values of the variables. The situation in Nigeria is typical of water system in de- veloping countries and the results of this study can be ap- plied to a number of similar situations in order to improve the quality of water supply and protect the environment. 2. Materials and Method 2.1. Material Collection, Preparation and Characterization 2.1.1. Coal Washery Effluent The effluent used in this study was taken from the coal washery pond of moribund coal mine located in Akwuke , Enugu State, Nigeria. The physicochemical and biologi- cal characteristics of the effluent presented in Table 1 were determined based on standard method [10]. 2.1.2. Moringa Olei fera (MO) Sample Dry Moringa oleifera (precursor to MOC) were sourced from Agulu, Anambra State, Nigeria and stored at room temperature. MOC was obtained as a by product of oil extraction procedure reported by [3]. The analysis of MO seed powder were performed by standard method [11] and the characteristics presented in Table 2. 2.2. Coag-Flocculation Experiment Experiment were carried out in a conventional jar-test apparatus equipped with a six-unit multiple stirrer system. Appropriate dosage of MOC in the range 100 - 500 mg/l was added directly to 200 ml of CWE. The suspension, tuned to pH range of 2 - 10 using H2SO4 and NaOH were subjected to 2 minutes of rapid mixing (250 rpm), 20 min of slow mixing (40 rpm), followed by 30 minutes of set- tling. During settling, samples were withdrawn using pipette from 2 cm depth and analyzed for turbidity (con- verted to SDP in mg/l) changes with a view to determin- ing optimal conditions (pH, dosage, settling time via 23-CCD) and kinetics parameters. Independent variables range and levels for the coag-flocculation process opti- mization are given in Table 3 while Table 4 displays the full 23-CCD factorial design matrix with output response. Table 1. Characteristics of coal washery effluent. Parameters Values pH 2.5200 Turbidity (NTU) 5387.0000 Total hardness (mg/l) 358.0000 Ca hardness (mg/l) 306.0000 Mg hardness (mg/l) 52.0000 Ca2+ (mg/l) 122.4000 Mg2+ (mg/l) 15.6000 Fe2+ (mg/l) 0.2500 SO42– (mg/l) 72.0000 NO32– (mg/l) Nil Cl– (mg/l) 184.3400 E.cond (µm/m2) 805.2000 TDS (mg/l) 450.9120 TSS (mg/l) 109.6000 T. Coliform Nil Plate Count 4.0000s E-Coli Nil BOD5 1001.0110 Table 2. Characteristics of MOC precursor. Parameter MOC Moisture content (%) 2.0200 Ash content (%) 2.1200 Lipid content (%) 30.4700 Crude protein (%) 39.3400 Carbohydrate (%) 23.7100 Crude fibre (%) 2.1600 Table 3. Experimental range and le vels of independent pro- cess variables. Independent Variable Lower limit (–1) Base level (0) Upper limit (+1) pH 2.0000 6.0000 10.0000 Dosage 100.0000 300.0000 500.0000 Settling time 10.0000 20.0000 30.0000 The experimental results of the 23-CCD were studied and interpreted by software, MATLAB 7.0 to estimate the response of the dependent variable. The kinetics of coag- flocculation and extent of aggregation were monitored at optimal conditions at 3,5,10,15,20,25 and 30 min. The data were subsequently fitted in appropriate kinetic model. The experiments were carried at room temperature. 3. Theory 3.1. Coag-Flocculation Optimization Optimization was studied specifically by central com- 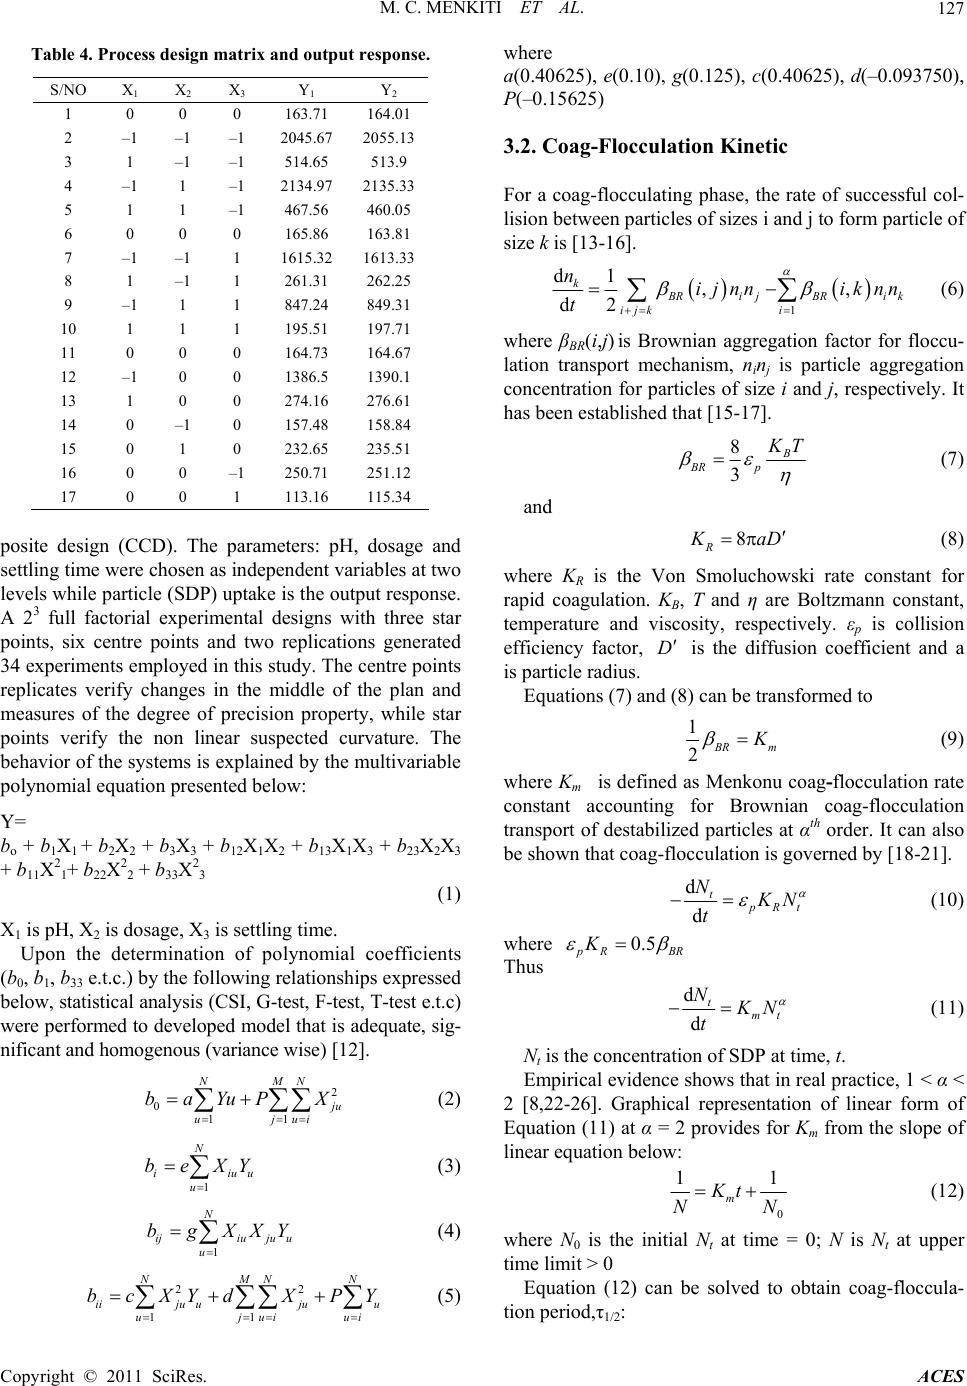 M. C. MENKITI ET AL. Copyright © 2011 SciRes. ACES 127 Table 4. Process design matrix and output response. S/NO X1 X 2 X 3 Y 1 Y 2 1 0 0 0 163.71 164.01 2 –1 –1 –1 2045.67 2055.13 3 1 –1 –1 514.65 513.9 4 –1 1 –1 2134.97 2135.33 5 1 1 –1 467.56 460.05 6 0 0 0 165.86 163.81 7 –1 –1 1 1615.32 1613.33 8 1 –1 1 261.31 262.25 9 –1 1 1 847.24 849.31 10 1 1 1 195.51 197.71 11 0 0 0 164.73 164.67 12 –1 0 0 1386.5 1390.1 13 1 0 0 274.16 276.61 14 0 –1 0 157.48 158.84 15 0 1 0 232.65 235.51 16 0 0 –1 250.71 251.12 17 0 0 1 113.16 115.34 posite design (CCD). The parameters: pH, dosage and settling time were chosen as independent variables at two levels while particle (SDP) uptake is the output response. A 23 full factorial experimental designs with three star points, six centre points and two replications generated 34 experiments employed in this study. The centre points replicates verify changes in the middle of the plan and measures of the degree of precision property, while star points verify the non linear suspected curvature. The behavior of the systems is explained by the multivariable polynomial equation presented below: Y= bo + b1X1 + b2X2 + b3X3 + b12X1X2 + b13X1X3 + b23X2X3 + b11X2 1+ b22X2 2 + b33X2 3 (1) X1 is pH, X2 is dosage, X3 is settling time. Upon the determination of polynomial coefficients (b0, b1, b33 e.t.c.) by the following relationships expressed below, statistical analysis (CSI, G-test, F-test, T-test e.t.c) were performed to developed model that is adequate, sig- nificant and homogenous (variance wise) [12]. 2 0 11 NMN j u ujui baYuPX (2) 1 N iiuu u beXY (3) 1 N ijiuju u u bgXXY (4) 22 11 NMNN iiju ujuu uj uiui bcXYdX PY (5) where a(0.40625), e(0.10), g(0.125), c(0.40625), d(–0.093750), P(–0.15625) 3.2. Coag-Flocculation Kinetic For a coag-flocculating phase, the rate of successful col- lision between particles of sizes i and j to form particle of size k is [13-16]. 1 d1,, d2 k B RijBRik ijk i nijnn iknn t (6) where βBR(i,j) is Brownian aggregation factor for floccu- lation transport mechanism, n inj is particle aggregation concentration for particles of size i and j, respectively. It has been established that [15-17]. 8 3 B BR p K T (7) and 8 R K aD (8) where KR is the Von Smoluchowski rate constant for rapid coagulation. KB, T and η are Boltzmann constant, temperature and viscosity, respectively. εp is collision efficiency factor, D is the diffusion coefficient and a is particle radius. Equations (7) and (8) can be transformed to 1 2 B Rm K (9) where Km is defined as Menkonu coag-flocculatio n rate constant accounting for Brownian coag-flocculation transport of destabilized particles at αth order. It can also be shown that coag-flocculation is governed by [18-21]. d d t p Rt N K N t (10) where 0.5 p RBR K Thus d d t mt N K N t (11) Nt is the concentration of SDP at time, t. Empirical evidence shows that in real practice, 1 < α < 2 [8,22-26]. Graphical representation of linear form of Equation (11) at α = 2 provides for Km from the slope of linear equation below: 0 11 m Kt NN (12) where N0 is the initial Nt at time = 0; N is Nt at upper time limit > 0 Equation (12) can be solved to obtain coag-floccula- tion period,τ1/2: 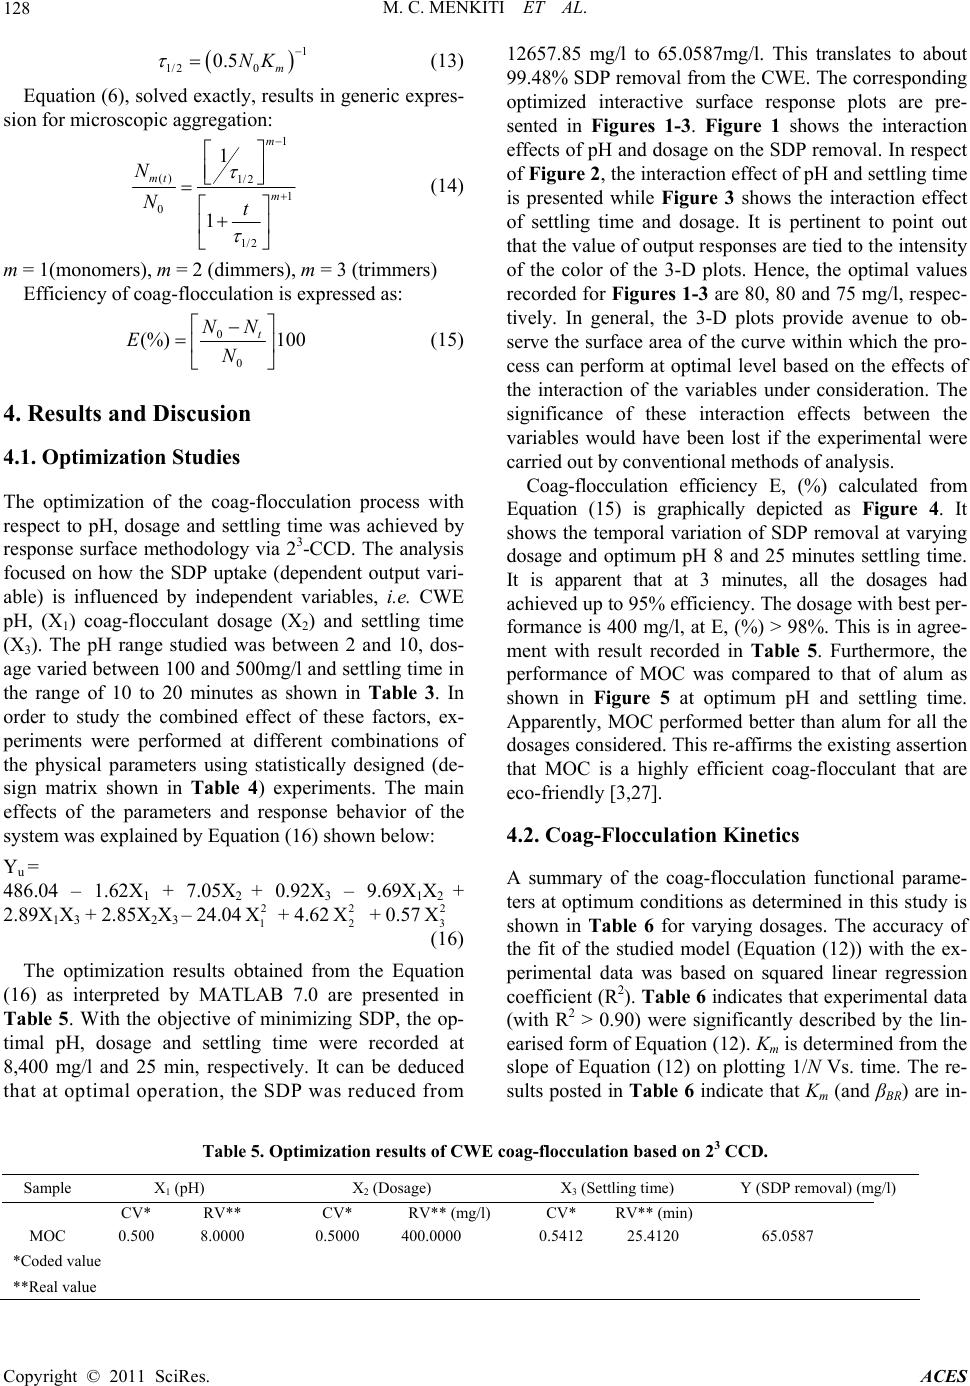 M. C. MENKITI ET AL. Copyright © 2011 SciRes. ACES 128 1 1/2 0 0.5 m NK (13) Equation (6), solved exactly, results in generic expres- sion for microscopic aggregation: 1 () 1/2 1 0 1/2 1 1 m mt m N Nt (14) m = 1(monomers), m = 2 (dimmers), m = 3 (trimmers) Efficiency of coag-flocculation is expressed as: 0 0 (%) 100 t NN EN (15) 4. Results and Discusion 4.1. Optimization Studies The optimization of the coag-flocculation process with respect to pH, dosage and settling time was achieved by response surface methodology via 23-CCD. The analysis focused on how the SDP uptake (dependent output vari- able) is influenced by independent variables, i.e. CWE pH, (X1) coag-flocculant dosage (X2) and settling time (X3). The pH range studied was between 2 and 10, dos- age varied between 100 and 500mg/l and settling time in the range of 10 to 20 minutes as shown in Table 3. In order to study the combined effect of these factors, ex- periments were performed at different combinations of the physical parameters using statistically designed (de- sign matrix shown in Table 4) experiments. The main effects of the parameters and response behavior of the system was explained by Equation (16) shown below: Yu = 486.04 – 1.62X1 + 7.05X2 + 0.92X3 – 9.69X1X2 + 2.89X1X3 + 2.85X2X3 – 24.042 1 X + 4.622 2 X + 0.572 3 X (16) The optimization results obtained from the Equation (16) as interpreted by MATLAB 7.0 are presented in Table 5. With the objective of minimizing SDP, the op- timal pH, dosage and settling time were recorded at 8,400 mg/l and 25 min, respectively. It can be deduced that at optimal operation, the SDP was reduced from 12657.85 mg/l to 65.0587mg/l. This translates to about 99.48% SDP removal from the CWE. The corresponding optimized interactive surface response plots are pre- sented in Figures 1-3. Figure 1 shows the interaction effects of pH and dosage on the SDP removal. In respect of Figure 2, the interaction effect of pH and settling time is presented while Figure 3 shows the interaction effect of settling time and dosage. It is pertinent to point out that the value of output responses are tied to the intensity of the color of the 3-D plots. Hence, the optimal values recorded for Figures 1-3 are 80, 80 and 75 mg/l, respec- tively. In general, the 3-D plots provide avenue to ob- serve the surface area of the curve within which the pro- cess can perform at optimal level based on the effects of the interaction of the variables under consideration. The significance of these interaction effects between the variables would have been lost if the experimental were carried out by conventional methods of analysis. Coag-flocculation efficiency E, (%) calculated from Equation (15) is graphically depicted as Figure 4. It shows the temporal variation of SDP removal at varying dosage and optimum pH 8 and 25 minutes settling time. It is apparent that at 3 minutes, all the dosages had achieved up to 95% efficiency. The dosage with best per- formance is 400 mg/l, at E, (%) > 98%. This is in agree- ment with result recorded in Table 5. Furthermore, the performance of MOC was compared to that of alum as shown in Figure 5 at optimum pH and settling time. Apparently, MOC performed better than alum for all the dosages considered. This re-affirms the existing assertion that MOC is a highly efficient coag-flocculant that are eco-friendly [3,27]. 4.2. Coag-Flocculation Kinetics A summary of the coag-flocculation functional parame- ters at optimum conditions as determined in this study is shown in Table 6 for varying dosages. The accuracy of the fit of the studied model (Equation (12)) with the ex- perimental data was based on squared linear regression coefficient (R2). Ta ble 6 indicates that experimental data (with R2 > 0.90) were significantly described by the lin- earised form of Equation (12). Km is determined from the slope of Equation (12) on plotting 1/N Vs. time. The re- sults posted in Table 6 indicate that Km (and βBR) are in- Table 5. Optimization results of CWE coag-flocculation based on 23 CCD. Sample X1 (pH) X2 (Dosage) X3 (Settling time) Y (SDP removal) (mg/l) CV* RV** CV* RV** (mg/l) CV* RV** (min) MOC 0.500 8.0000 0.5000 400.0000 0.5412 25.4120 65.0587 *Coded value **Real value 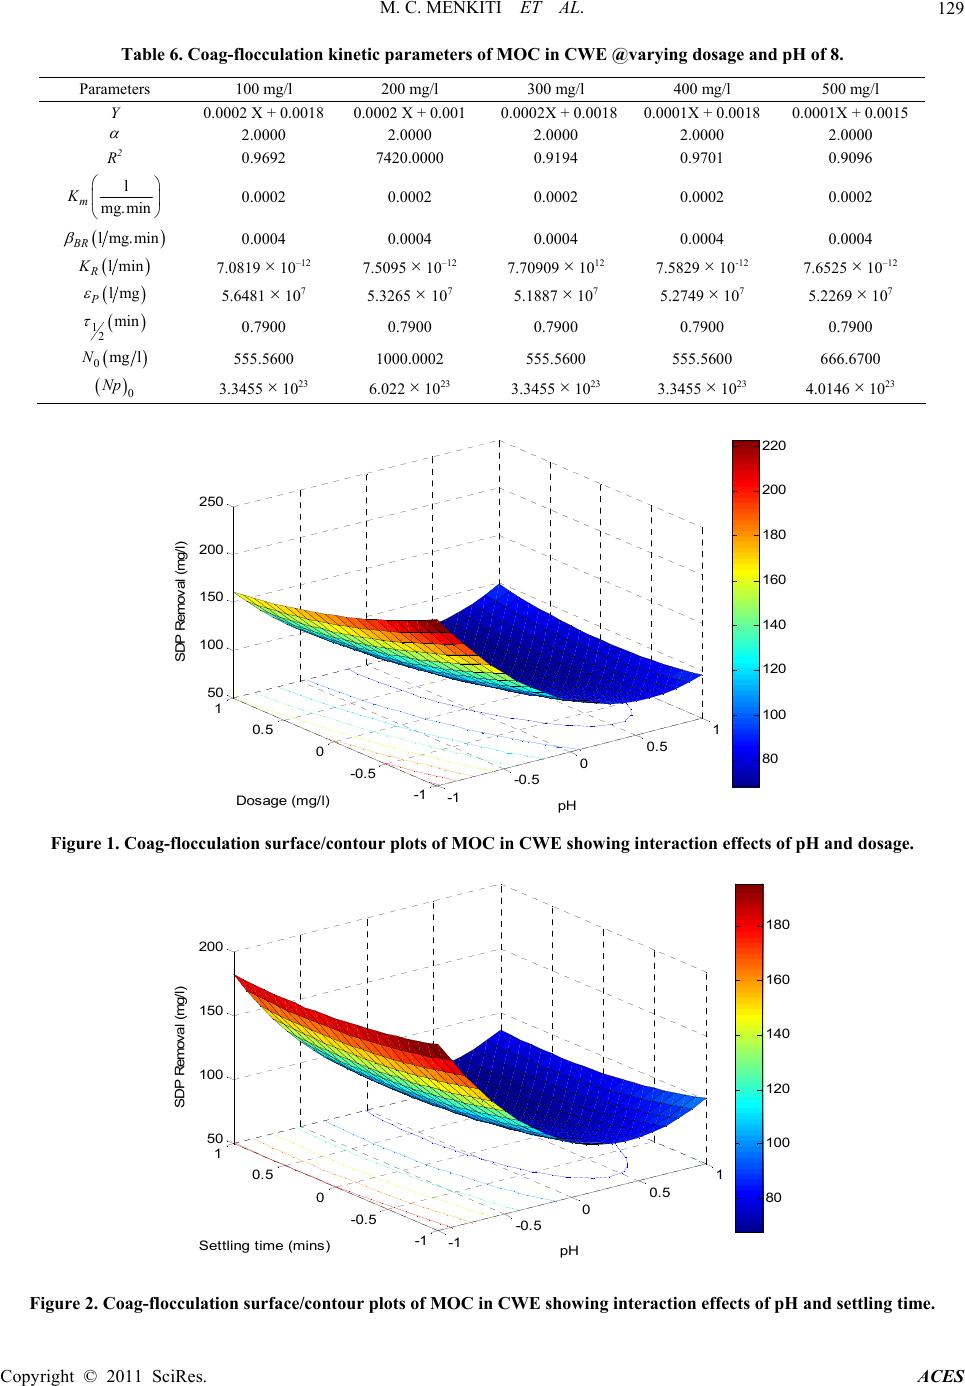 M. C. MENKITI ET AL. Copyright © 2011 SciRes. ACES 129 Table 6. Coag-flocculation kinetic parameters of MOC in CWE @varying dosage and pH of 8. Parameters 100 mg/l 200 mg/l 300 mg/l 400 mg/l 500 mg/l Y 0.0002 X + 0.0018 0.0002 X + 0.001 0.0002X + 0.00180.0001X + 0.0018 0.0001X + 0.0015 2.0000 2.0000 2.0000 2.0000 2.0000 R2 0.9692 7420.0000 0.9194 0.9701 0.9096 l mg.min m K 0.0002 0.0002 0.0002 0.0002 0.0002 lmg.min BR 0.0004 0.0004 0.0004 0.0004 0.0004 lmin R K 7.0819 × 10⁻¹² 7.5095 × 10⁻¹² 7.70909 × 10¹² 7.5829 × 10⁻¹² 7.6525 × 10⁻¹² lmg P 5.6481 × 10⁷ 5.3265 × 10⁷ 5.1887 × 10⁷ 5.2749 × 10⁷ 5.2269 × 10⁷ 12 min 0.7900 0.7900 0.7900 0.7900 0.7900 0mg lN 555.5600 1000.0002 555.5600 555.5600 666.6700 0 Np 3.3455 × 10²³ 6.022 × 10²³ 3.3455 × 10²³ 3.3455 × 10²³ 4.0146 × 10²³ -1 -0.5 00.5 1 -1 -0. 5 0 0.5 1 50 100 150 200 250 pH Dos age (m g / l) SDP Remo val (mg/l) 80 100 120 140 160 180 200 220 Figure 1. Coag-flocculation surface/contour plots of MOC in CWE showing interaction effects of pH and dosage. -1 -0.5 00.5 1 -1 -0. 5 0 0.5 1 50 100 150 200 pH Sett ling time (mins) SDP Re moval (mg/l) 80 100 120 140 160 180 Figure 2. Coag-flocculation surface/contour plots of MOC in CWE showing interaction effects of pH and settling time. 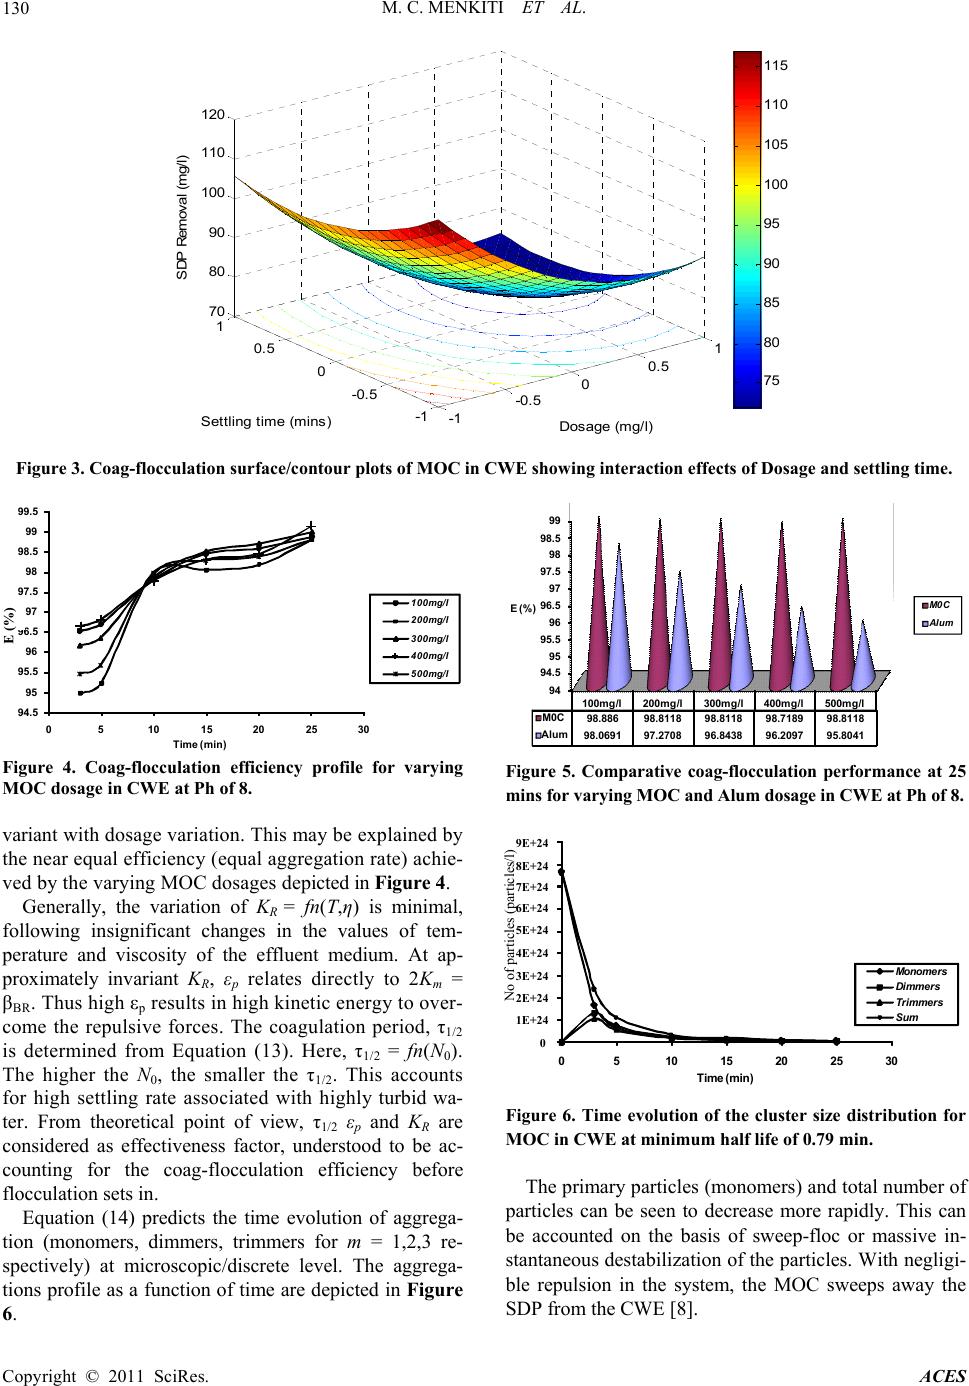 M. C. MENKITI ET AL. Copyright © 2011 SciRes. ACES 130 -1 -0.5 00.5 1 -1 -0. 5 0 0. 5 1 70 80 90 100 110 120 Dos age (m g/ l ) Settling time (mins) SDP Removal (mg/l) 75 80 85 90 95 100 105 110 115 Figure 3. Coag-flocculation surface/contour plots of MOC in CWE showing interaction effects of Dosage and settling time. 94.5 95 95.5 96 96.5 97 97.5 98 98.5 99 99.5 051015 20 25 30 E ( % ) Time (min) 100mg/l 200mg/l 300mg/l 400mg/l 500mg/l Figure 4. Coag-flocculation efficiency profile for varying MOC dosage in CWE at Ph of 8. variant with dosage variation. This may be explained by the near equal efficiency (equal aggregation rate) achie- ved by the varying MOC dosages depicted in Figure 4. Generally, the variation of KR = fn(T,η) is minimal, following insignificant changes in the values of tem- perature and viscosity of the effluent medium. At ap- proximately invariant KR, εp relates directly to 2Km = βBR. Thus high εp results in high kinetic energy to over- come the repulsive forces. The coagulation period, τ1/2 is determined from Equation (13). Here, τ1/2 = fn(N0). The higher the N0, the smaller the τ1/2. This accounts for high settling rate associated with highly turbid wa- ter. From theoretical point of view, τ1/2 εp and KR are considered as effectiveness factor, understood to be ac- counting for the coag-flocculation efficiency before flocculation sets in. Equation (14) predicts the time evolution of aggrega- tion (monomers, dimmers, trimmers for m = 1,2,3 re- spectively) at microscopic/discrete level. The aggrega- tions profile as a function of time are depicted in Figure 6. 94 94.5 95 95.5 96 96.5 97 97.5 98 98.5 99 100mg/l 200mg/l 300mg/l400mg/l 500mg/l M0C 98.88698.811898.8118 98.7189 98.8118 A lum 98.069197.2708 96.8438 96.2097 95.8041 E (%)M0 C Alum Figure 5. Comparative coag-flocculation performance at 25 mins for varying MOC and Alum dosage in CWE at Ph of 8. 0 1E+24 2E+24 3E+24 4E+24 5E+24 6E+24 7E+24 8E+24 9E+24 0510 15 20 25 30 N o o p a c e s p e e Time (min) Monomer s Dim mers Trimmer s Sum Figure 6. Time evolution of the cluster size distribution for MOC in CWE at minimum half life of 0.79 min. The primary particles (monomers) and total number of particles can be seen to decrease more rapidly. This can be accounted on the basis of sweep-floc or massive in- stantaneous destabilization of the particles. With negligi- ble repulsion in the system, the MOC sweeps away the SDP from the CWE [8]. E (%) 9E+24 8E+24 7E+24 6E+24 5E+24 4E+24 3E+24 2E+24 1E+24 0 No of particles (particles/l) 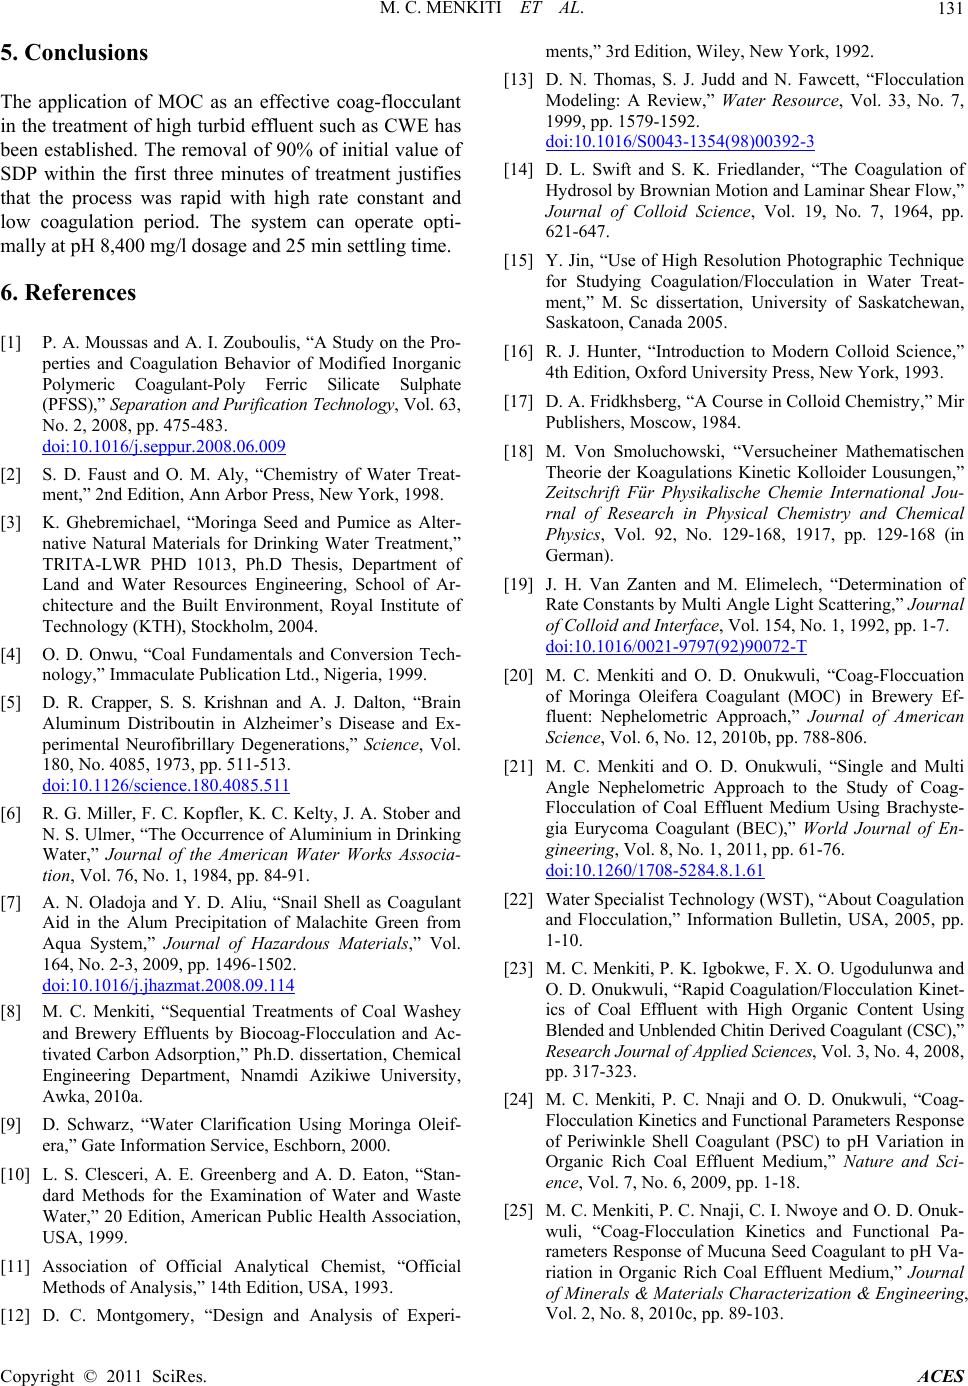 M. C. MENKITI ET AL. Copyright © 2011 SciRes. ACES 131 5. Conclusions The application of MOC as an effective coag-flocculant in the treatment of high turbid effluent such as CWE has been established. The removal of 90% of initial value of SDP within the first three minutes of treatment justifies that the process was rapid with high rate constant and low coagulation period. The system can operate opti- mally at pH 8,400 mg/l dosage and 25 min settling time. 6. References [1] P. A. Moussas and A. I. Zouboulis, “A Study on the Pro- perties and Coagulation Behavior of Modified Inorganic Polymeric Coagulant-Poly Ferric Silicate Sulphate (PFSS),” Separation and Purification Technology, Vol. 63, No. 2, 2008, pp. 475-483. doi:10.1016/j.seppur.2008.06.009 [2] S. D. Faust and O. M. Aly, “Chemistry of Water Treat- ment,” 2nd Edition, Ann Arbor Press, New York, 1998. [3] K. Ghebremichael, “Moringa Seed and Pumice as Alter- native Natural Materials for Drinking Water Treatment,” TRITA-LWR PHD 1013, Ph.D Thesis, Department of Land and Water Resources Engineering, School of Ar- chitecture and the Built Environment, Royal Institute of Technology (KTH), Stockholm, 2004. [4] O. D. Onwu, “Coal Fundamentals and Conversion Tech- nology,” Immaculate Publication Ltd., Nigeria, 1999. [5] D. R. Crapper, S. S. Krishnan and A. J. Dalton, “Brain Aluminum Distriboutin in Alzheimer’s Disease and Ex- perimental Neurofibrillary Degenerations,” Science, Vol. 180, No. 4085, 1973, pp. 511-513. doi:10.1126/science.180.4085.511 [6] R. G. Miller, F. C. Kopfler, K. C. Kelty, J. A. Stober and N. S. Ulmer, “The Occurrence of Aluminium in Drinking Water,” Journal of the American Water Works Associa- tion, Vol. 76, No. 1, 1984, pp. 84-91. [7] A. N. Oladoja and Y. D. Aliu, “Snail Shell as Coagulant Aid in the Alum Precipitation of Malachite Green from Aqua System,” Journal of Hazardous Materials,” Vol. 164, No. 2-3, 2009, pp. 1496-1502. doi:10.1016/j.jhazmat.2008.09.114 [8] M. C. Menkiti, “Sequential Treatments of Coal Washey and Brewery Effluents by Biocoag-Flocculation and Ac- tivated Carbon Adsorption,” Ph.D. dissertation, Chemical Engineering Department, Nnamdi Azikiwe University, Awka, 2010a. [9] D. Schwarz, “Water Clarification Using Moringa Oleif- era,” Gate Information Service, Eschborn, 2000. [10] L. S. Clesceri, A. E. Greenberg and A. D. Eaton, “Stan- dard Methods for the Examination of Water and Waste Water,” 20 Edition, American Public Health Association, USA, 1999. [11] Association of Official Analytical Chemist, “Official Methods of Analysis,” 14th Edition, USA, 1993. [12] D. C. Montgomery, “Design and Analysis of Experi- ments,” 3rd Edition, Wiley, New York, 1992. [13] D. N. Thomas, S. J. Judd and N. Fawcett, “Flocculation Modeling: A Review,” Water Resource, Vol. 33, No. 7, 1999, pp. 1579-1592. doi:10.1016/S0043-1354(98)00392-3 [14] D. L. Swift and S. K. Friedlander, “The Coagulation of Hydrosol by Brownian Motion and Laminar Shear Flow,” Journal of Colloid Science, Vol. 19, No. 7, 1964, pp. 621-647. [15] Y. Jin, “Use of High Resolution Photographic Technique for Studying Coagulation/Flocculation in Water Treat- ment,” M. Sc dissertation, University of Saskatchewan, Saskatoon, Canada 2005. [16] R. J. Hunter, “Introduction to Modern Colloid Science,” 4th Edition, Oxford University Press, New York, 1993. [17] D. A. Fridkhsberg, “A Course in Colloid Chemistry,” Mir Publishers, Moscow, 1984. [18] M. Von Smoluchowski, “Versucheiner Mathematischen Theorie der Koagulations Kinetic Kolloider Lousungen,” Zeitschrift Für Physikalische Chemie International Jou- rnal of Research in Physical Chemistry and Chemical Physics, Vol. 92, No. 129-168, 1917, pp. 129-168 (in German). [19] J. H. Van Zanten and M. Elimelech, “Determination of Rate Constants by Multi Angle Light Scattering,” Journal of Colloid and Interface, Vol. 154, No. 1, 1992, pp. 1-7. doi:10.1016/0021-9797(92)90072-T [20] M. C. Menkiti and O. D. Onukwuli, “Coag-Floccuation of Moringa Oleifera Coagulant (MOC) in Brewery Ef- fluent: Nephelometric Approach,” Journal of American Science, Vol. 6, No. 12, 2010b, pp. 788-806. [21] M. C. Menkiti and O. D. Onukwuli, “Single and Multi Angle Nephelometric Approach to the Study of Coag- Flocculation of Coal Effluent Medium Using Brachyste- gia Eurycoma Coagulant (BEC),” World Journal of En- gineering, Vol. 8, No. 1, 2011, pp. 61-76. doi:10.1260/1708-5284.8.1.61 [22] Water Specialist Technology (WST), “About Coagulation and Flocculation,” Information Bulletin, USA, 2005, pp. 1-10. [23] M. C. Menkiti, P. K. Igbokwe, F. X. O. Ugodulunwa and O. D. Onukwuli, “Rapid Coagulation/Flocculation Kinet- ics of Coal Effluent with High Organic Content Using Blended and Unblended Chitin Derived Coagulant (CSC),” Research Journal of Applied Sciences, Vol. 3, No. 4, 2008, pp. 317-323. [24] M. C. Menkiti, P. C. Nnaji and O. D. Onukwuli, “Coag- Flocculation Kinetics and Functional Parameters Response of Periwinkle Shell Coagulant (PSC) to pH Variation in Organic Rich Coal Effluent Medium,” Nature and Sci- ence, Vol. 7, No. 6, 2009, pp. 1-18. [25] M. C. Menkiti, P. C. Nnaji, C. I. Nwoye and O. D. Onuk- wuli, “Coag-Flocculation Kinetics and Functional Pa- rameters Response of Mucuna Seed Coagulant to pH Va- riation in Organic Rich Coal Effluent Medium,” Journal of Minerals & Materials Characterization & Engineering, Vol. 2, No. 8, 2010c, pp. 89-103. 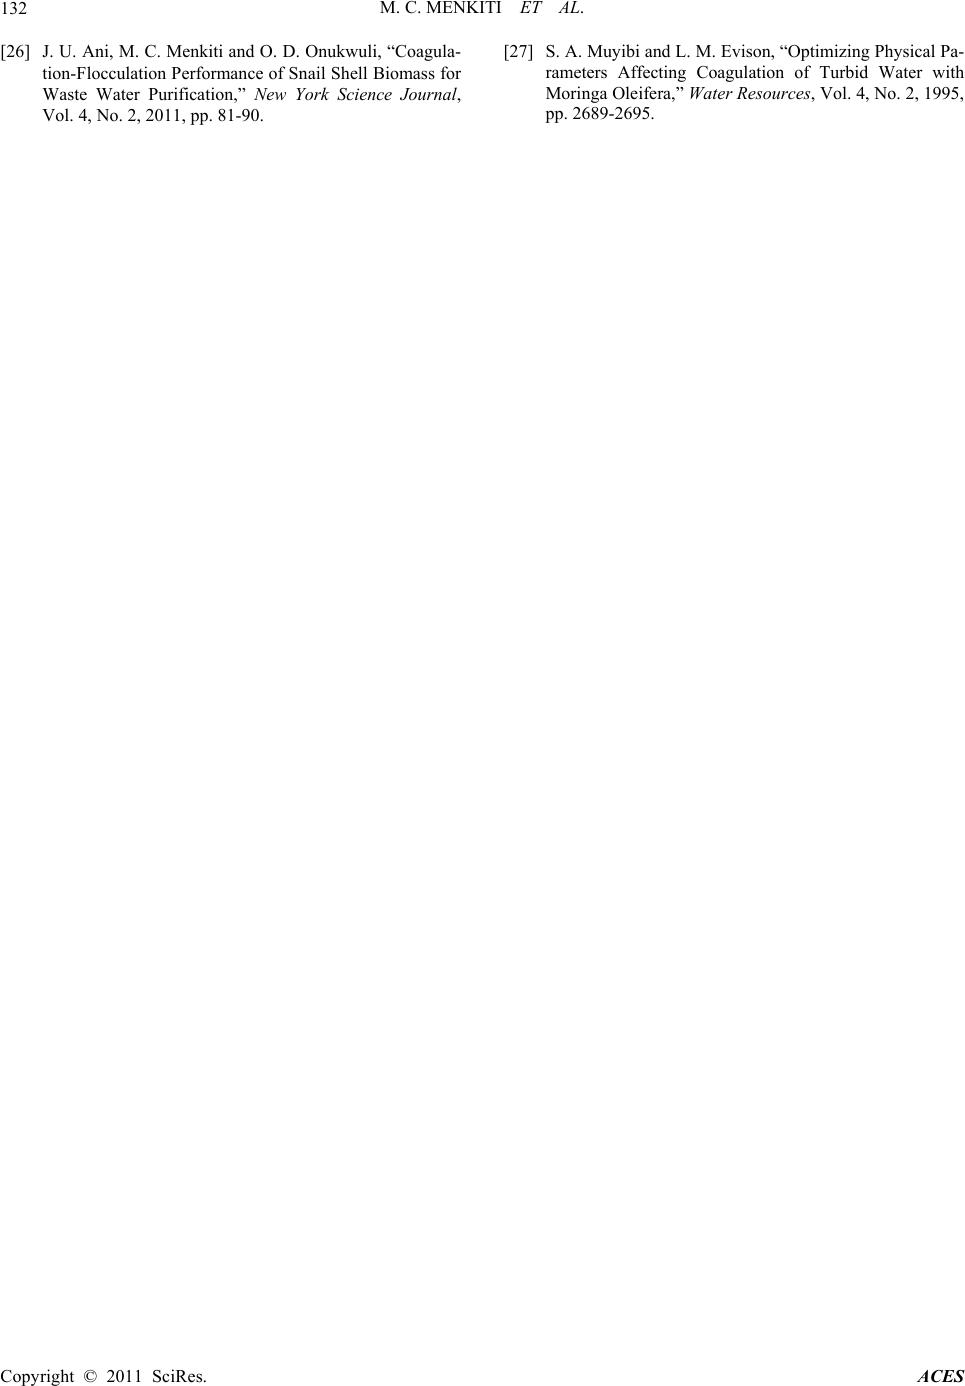 M. C. MENKITI ET AL. Copyright © 2011 SciRes. ACES 132 [26] J. U. Ani, M. C. Menkiti and O. D. Onukwuli, “Coagula- tion-Flocculation Performance of Snail Shell Biomass for Waste Water Purification,” New York Science Journal, Vol. 4, No. 2, 2011, pp. 81-90. [27] S. A. Muyibi and L. M. Evison, “Optimizing Physical Pa- rameters Affecting Coagulation of Turbid Water with Moringa Oleifera,” Water Resources, Vol. 4, No. 2, 1995, pp. 2689-2695. |