World Journal of Engineering and Technology
Vol.03 No.03(2015), Article ID:60491,8 pages
10.4236/wjet.2015.33C014
Calculation of the Two High Voltage Transmission Line Conductors’ Minimum Distance
Wenjie Huang1, Jinglin Zhu1, Zhihang Du1, Zheng Zhang2
1Shanghai Electric Power Design Institute co., LTD, Shanghai, China
2Economic and Technology Research Institute of Shanghai Electric Power Company, Shanghai, China
Email: huangwj@sepd.com.cn, 424510732@qq.com


Received 9 August 2015; accepted 15 October 2015; published 22 October 2015

ABSTRACT
In the design of high voltage transmission lines inevitably needed to change the arrangement of wires, and the distance between the wires directly affected by changing the arrangement of the wires. The distance between the wires is difficult to judge by experiences. Therefore, it is urgently to develop a way to accurately calculating the minimum distance between the wires when changing the arrangement between the two wires, and determine the minimum distance can meet the requirements of standards and regulations or not. Through the thinking, based on the balance equation and the space curve wire calculus method, a more accurate method of calculating the two wires in a variety of conditions the minimum spacing was derivated, and the sensitivity of the minimum distance was analysized based on the method.
Keywords:
Overhead Transmission Lines, Distance of Two Lines, Equation of Wire Balance, Wire Sag

1. Introduction
When the high voltage transmission lines are designed, it is inevitably needed to intersect across, change the arrangement modes of wires, and etc., for example, 500 kV line spans the 220 kV line, get-in gantry span of overhead lines, and etc. When the above situations happen, it is inevitably needed to check the minimum distance between two wires so as to determine whether it satisfies the requirement of regulation [1]. However, the difficulties of validation lie in (1) the intersection situation, which needed to be checked, is often very complex, and the two wires to be checked face the situations such as different types, different safety coefficients, and so on. (2) Both the establishment and solution of the space curve equation are difficult, and relying on a simple artificial modeling calculation cannot obtain the exact solution. (3) The spacings of wires are different due to the different sags under different working conditions, so it is difficult to judge the working condition for the minimum spacing, and etc. There are much calculating study achievement concerning the phase spacing of wires in our country. In the Reference [2], the three-dimensional CAD is used to establish the three-dimensional model of phase spacing of lead-in span wire, and a kind of method to calculate the phase spacing of wires by using the interactive three-dimensional CAD according to the theory of oblique parabola and three-dimensional left conversion calculation is proposed. Reference [3] studied the computing method of minimum phase spacing of wires under considering the windage and without considering the windage, and analyzed the calculation examples of relevant projects. According to the above difficulties and the current status, space curve equation [4]-[6] of wires was precisely established and the minimum distance between two wires was calculated by using the integral-differential method of space curve and Matlab tool in consideration of the sag of wires under different working conditions based on the equation of wire balance. Simultaneously, the accuracy of the calculation method was analyzed, and the sensitivity of minimum distance between two wires with the change of tower height difference, the change of safety coefficient, the change of span, and so on was systematically calculated by taking the energy-saving wire (aluminum alloy core aluminum stranded conductor) as an example.
2. Calculation Method of Spatial Minimum Distance between Two Wires
2.1. Establishment of Space Curve Equation of Wires
The emphasis of calculating the minimum distance between two wires in space is to establish the calculation model of space curve of wires. First of all, the three-dimensional rectangular coordinate system is established by taking the tower center as the original point, the extension direction of beam as X axis, upward extension direction of tower as Z axis, and the extension line direction of wire as Y axis, as shown in Figure 1.
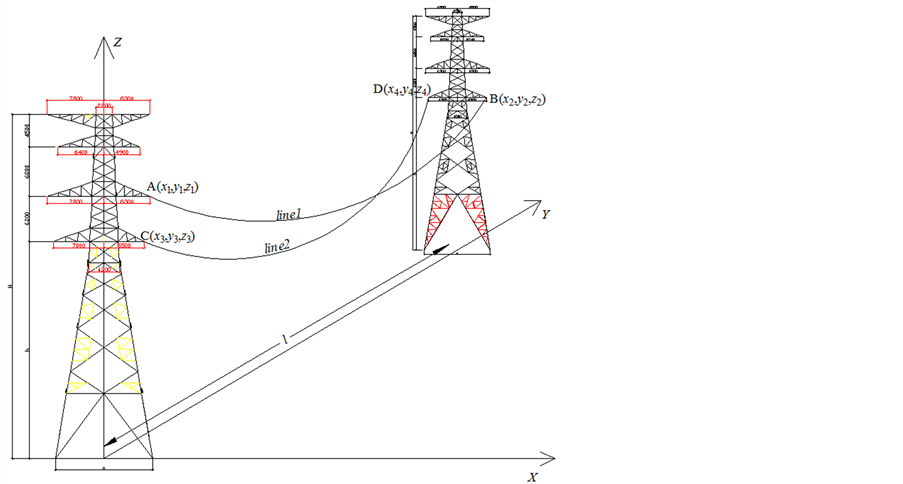
Figure 1. Case diagram of modeling calculation.
The space curve equation was established by taking wire 1 as an example. It is assumed that hanging points coordinates in the T1 and T2 tower of the wire are (x1, y1, z1) and (x2, y2, z2), respectively, and then the space curve parameter equation of wire 1 between the two suspension points is as follows [5].

where t is the spatial location parameters.
The wire sag was also considered, and the sag formula of inclined parabola of wire was  according to reference [4], then the sag of any point in the space wire is

where f is the wire sag with the unit m. γ is the comprehensive relative load of wire with the unit N/mm2・m. l is the horizontal distance of wire between two hanging points with a unit m.  is the distance from any point of wire to suspension point (x1, y1, z1) with a unit m. β is the angle of elevation difference with a unit. Then the calculation method of the above various parameters can be determined according to the model.
The calculated simplified formula of the above parameters are introduced into the sag formula, then

2.2. Correction of Spatial Wire Equation in Consideration of Windage
There appears a certain windage for the wire under the action of breeze, and its angle of windage is![]() , then
, then ![]() and
and ![]() can be obtained. After the windage of wire, the change of sag in Z axis is
can be obtained. After the windage of wire, the change of sag in Z axis is![]() , and the change of sag on the horizontal plane is
, and the change of sag on the horizontal plane is![]() . It is assumed that the straight line linking with the suspension points of wire and the X axis in XY plane constitutes an angle
. It is assumed that the straight line linking with the suspension points of wire and the X axis in XY plane constitutes an angle![]() , and then
, and then
![]() ,
, ![]() ,
, ![]()
Due to the windage direction of wire along X axis unfixed, when the directions of windage are different, the variable quantity in X and Y axis of the line between two hanging points caused by wire sag are shown in Table 1 in consideration of synchronous windage.
Hence, when the wire has the windage along positive direction of X axis, the space equation of wire can be expressed as:
![]()
While the wire has the windage along negative direction of X axis, the space equation of wire can be obtained

Table 1. Variation in X and Y axis caused by sag under different directions of windage.
by exchanging the plus-minus sign of above sag correction formula.
2.3. Electrical Distance between Two Wires in Space
The parameter equation of space wire has been obtained in consideration of the sag and windage according to the above analysis. It is assumed that the two wires in space are line1 and line2, respectively, the hanging points coordinates of line1 are A (x1, y1, z1) and B (x2, y2, z2), respectively, and the hanging points coordinates of line2 are C (x3, y3, z3) and D (x4, y4, z4), respectively. Then the distance between any points in two wires can be calculated according to the distance formula between two points in space.

Visibly, d2 is the binary quartic equation, and the minimum of d2 needs to be resolved. According to the differential method, let , and then the binary cubic equation set concerning the position function t1 and t2 is obtained. Subsequently, the Matlab platform can be used to solve d2, thus the minimum of d is obtained. The binary cubic equation has multiple sets of solutions, so the range of function values
 ,
,  needs to be defined. Moreover, t1 and t2 appear in pairs, d has a unique solution after the definition of function values, and it can be quickly solved in Matlab environment.
3. Sensitivity Analysis of Minimum of Spatial Two Wires
When the arrangement mode of high voltage overhead lines changes, the electrical spacing of wire must be verified. Especially, it is commonly seen that the get-in gantry span wire is converted from the horizontal layout of gantry to the vertical arrangement form outside of a station. It is analyzed that the sensibility of minimum distance between two wires with the change of distance between terminal tower and gantry, the change of height difference between terminal tower and gantry, change of safety coefficient of relaxation span, and so on by taking the get-in gantry span of 220 kV lines engineering and adopting the JL1/LHA1-465/210 (aluminum alloy core aluminium conductor).
3.1. Model Analysis
The model of sensitivity analysis is shown in Figure 2 [2].
Where the type of the wire is JL1/LHA1-465/210, and the parameters are shown in Table 2.
3.2. Change Law of Minimum Distance between Two Wires under Different Spans
1) Change law of distance with the span under different working conditions
According to the stipulations of GB 50545-2010, the minimum phase spacings in span under the action of interphase operating overvoltage at 500 kV and the voltage grade below 500 kV are shown in Table 3.
The regulation only stipulates the minimum distance of phase spacing of wire under operating conditions, and the minimum phase spacing of wire is 2.00 m under 220 kV. But the minimum distance between wires does not necessarily happen under operating conditions. Hence, it is necessary to compare the distance between wires under high temperature to that under operating conditions, as shown in Figure 3.
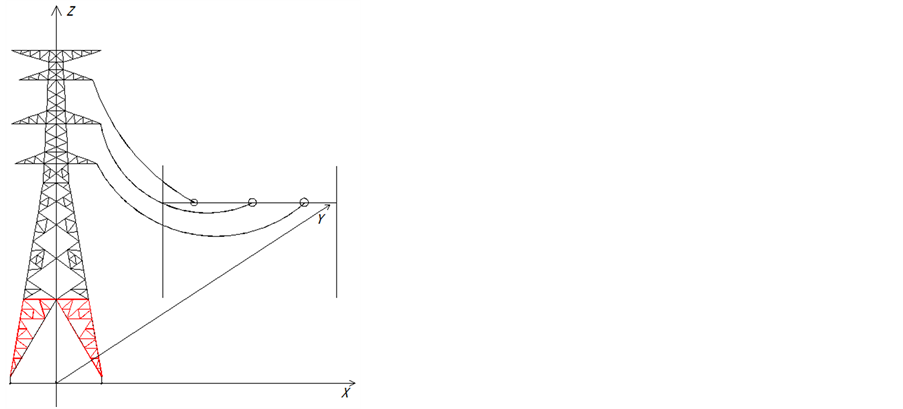
Figure 2. Model of sensitivity analysis.
Table 2. Parameters of energy-saving wire.
Table 3. The minimum interphase intervals in span under the action of interphase operating overvoltage.

Figure 3. Comparison of distances between wires under different working conditions.
As shown in Figure 3, the minimum distance of wire under the operating conditions is obviously greater than the minimum distance under the high temperature conditions. Moreover, when the minimum span is 20 m, the minimum phase spacings under both operating conditions and high temperature conditions can meet the requirements of regulation. But the minimum distance of wires under the operating conditions cannot represent other conditions to study the minimum distance of wires. Therefore, it is likely to use the minimum distance of wire under high temperature conditions to study the minimum distance of wires.
2) Change law of distance with span under the high temperature
In the calculation model, the two hanging points coordinates of wire 1 are (7, 0, 27) and (3.5, y2, 14), respectively, as well as the hanging points coordinates of wire 2 are (7.8, 0, 33.5) and (0, y4, 14), respectively. In
addition, the difference of hanging points distance between wire 1 and wire 2 in the terminal tower is 6.5 m.

Figure 4. Change law of minimum spacing between two wires under different spans and different safety coefficients.
It is clearly observed that
(1) Under the identical safety coefficient, the distance between two wires in space increases with the increase of the span. However, the amplitude of increase continuously decreases as well as the distance tends to be smooth and steady. Taking k = 15 as an example, when the span is in 20 - 30 m, the rate of change of the increase of the shortest distance is about 5.5%. When the span is in 110 - 120 m, the change rate is only 0.27%. Namely, the greater the span is, the weaker the control of minimum distance between two wires in space by the wire tension is.
(2) With the increase of safety coefficient, the change law of the shortest distance between two wires in space with the span becomes more and more obvious, as well as the rate of change is greater. As k = 3.4, the change rate of span in 20 - 120 m is 3.8%, while k = 15, the rate of change is 15.3% with the same span. So when designing the change of the arrangement mode for wires, it is quite necessary to check whether the space distance between two wires meet the requirements.
(3) Under the identical span and different safety coefficients, it is observed that the wires relax and the sag of wires increases with the increase of security coefficients. These make the minimum distance between two wires continuously reduce.
(4) It is required in the regulation that the interphase distance of 220 kV wires is not less than 2 m. But only considering the operation status in the engineering is not enough, it is still considered to meet the requirement of 2 m for the phase spacing under the high temperature, moreover, the phase spacing should be increased by 20% under the allowable conditions. In this case, the phase spacing should not be less than 2.4 m. When the wires are relaxing, the safety coefficient and the span should be simultaneously controlled, for example, as k = 15, the span should not be less than 30 m, while k = 20, the span should not be less than 50 m.
3.3. Change Law of Minimum Distance with the Span under Different Height Differences
When designing the get-in/out gantry span, it is often encountered that the difference between the nominal height of terminal tower and the height of gantry is greater. Hence, the change of the minimum distance of two wires in space with different height differences needs to be studied. So when k = 15, the change of the minimum distance in space between two wires of get-in gantry span needs to be initially accounted by designing Δh = 13 m, 20 m, 30 m, 40 m and etc.

Figure 5. Change law of minimum distance between two wires in space with the span under different height differences.
As can be seen that:
(1) With the increase of the height difference between the terminal tower and gantry, the minimum spacing between two wires are continuously reducing, and the greater the height difference is, the greater the shortened amplitude is. Moreover, when Δh is in 13 m - 20 m, 20 m - 30 m, and 30 m - 40 m, the corresponding rate of change is −0.80%, −1.50%, and −1.94%, respectively, with the span of 60 m.
(2) Within the identical span, the minimum distance between two wires are continuously shortening with the increase of the height difference. However, as the span becomes greater, the shortest distance between two wires tends to be consistent. Namely, the greater the span is, the weaker the control of the shortest distance between the two wires by height difference is.
4. Conclusions
Based on the equation of wire balance, space curve equation of wires was precisely established and the minimum distance between two wires in space was calculated by using the integral-differential method of space curve and Matlab tool in consideration of the sag of wires under different working conditions. Simultaneously, the sensitivity of minimum distance between two wires with the change of tower height difference, the change of safety coefficient, the change of span, and so on was systematically calculated by taking the energy-saving wire (aluminum alloy core aluminium conductor) as an example. Moreover, the conclusions are obtained as follows.
(1) Under the same safety coefficient, the distance between two wires in space increases with the increase of span, but the increase amplitude gradually decreases as well as the distance tends to be stable. Moreover, the greater the span is, the weaker the control of the minimum distance between the two wires in space by the change of wire tension caused by the change of security coefficient of wire is.
(2) Under the same span, the sag of the wire increases with the increase of the safety coefficient, which makes the minimum distance between the two wires continuously decrease.
(3) With the increase of tower height difference between both sides, the minimum spacing between two wires gradually decreases, and the greater the height difference is, the greater the shortened amplitude is.
(4) Within the same span, the minimum distance between two wires gradually shortens with the increase of the height difference. But the greater the span is, the weaker the control of the shortest distance between two wires by the height difference is.
Cite this paper
Wenjie Huang,Jinglin Zhu,Zhihang Du,Zheng Zhang, (2015) Calculation of the Two High Voltage Transmission Line Conductors’ Minimum Distance. World Journal of Engineering and Technology,03,89-96. doi: 10.4236/wjet.2015.33C014
References
- 1. GB 50545-2010. Code for Design of 110kV - 750kV Overhead Transmission Line.
- 2. Yang, X.M., Feng, N. and Wu, S.P. (2012) Precise Calibration for Phase Distance of Approach Span Based on Three- Dimensional Space Technology. Electric Power Construction, 33, 46-48.
- 3. Bai, X.L., Ge, Q.L. and Yu, W.W. (2010) Analysis of Least Phase Distance of Overhead Transmission Line. Electric Power Science and Engineering, 26, 37-43.
- 4. Zhang, D.S. (2003) Design Handbook for Electric Power Transmission Line. China Power Press, Beijing.
- 5. Gong, Y.Q., Liang, N.C. and Gong, Y.G. (2009) A Formula Method for Conductor Electric Clearance of Overhead Transmission Line. Electric Power Construction, 30, 24-27.
- 6. Rohlfs, A.F. and Schneider, H.M. (1983) Switching Impulse Strength of Compacted Trans-mission Line Flat and Delta Configurations. IEEE Transactions on Power Apparatus and Systems, 102, 822-831.