Technology and Investment
Vol.3 No.3(2012), Article ID:22078,10 pages DOI:10.4236/ti.2012.33022
The Size, Structure and Characteristics of Finland’s ITS Industry
VTT Technical Research Centre of Finland, Oulu, Finland
Email: zulkarnain@vtt.fi
Received June 6, 2012; revised June 25, 2012; accepted July 2, 2012
Keywords: Intelligent Transport Systems; Market; Growth; Industry; Industry Structure; Finland
ABSTRACT
Intelligent transport systems (ITS) are seen as a high-growth segment within the transport sector, as information and communication technologies (ICT) push their way through different industries. ITS products and services has been developed, and its myriad benefits has been introduced which are promising for new business opportunities and investors. Its economic importance has also been recognised as well and many analyst reports show significant growth projections for the ITS market as a whole. This paper attempts to make the first quantitative and empirical analysis of the ITS industry in Finland. The Finnish ITS market had a significant growth in 2007 but has since then been very slowly been turning upwards from the negative growth observed in 2008 and 2009. The fast growing firms have clearly been showing good growth, whereas the weakest performers seem to have a continuous declining trend. The Finnish ITS supply market had an aggregate turnover of approximately EUR300 million and around 1700 employees in 2010.
1. Introduction
Rapid development of information and communication technologies (ICT) has introduced many changes to various sectors. It has transformed most industries as well as public sector from education to health care, and is now in the early stages of transforming transport systems [1]. Intelligent transport systems (ITS) are the systems that utilize ICT in the transport system, covering all modes of transport for both passengers and goods. ITS brings significant improvement in transport system performance, including reduced congestion, increased safety, and traveller convenience through products and services such as navigation devices and services, automatic warning systems and communications services between drivers and the environment, just to name a few of the typical.
ITS is regarded as a tool for transportation system designers to improve the aforementioned characteristics of the system. It has also been introduced as a mean to reduce emissions from the transportation system, hence greening the system. The benefits of ITS have been studied widely. Kristensen [2] pointed out the ITS could reduce as much as 50% of the congestion societal costs 3 billion EUR per year in the EU, equaling about 1% of the region’s GDP. Moreover, there are about 800 fatal accidents per year in the Netherlands (total EU about 40,000) yielding to ca. EUR9 billion cost to the Dutch society (about 3% of GDP)—with the help of ITS even 25% decrease in these costs could achieved [2]. There are about 200,000 premature deaths per year in the EU because of poor air quality, since transport generates about 25% - 30% of greenhouse gases. These harmful effects can be reduced by ITS by about 15%. Ferreira [3] showed about potential of ITS for road transport. ITS could make reduction of congestion by 5% - 15%; 5% - 15% less fatalities and 5% - 10% less injuries; and possible savings of 10% - 20% CO2 emissions. In Leviäkangas and Hietajärvi [4] the weather-related ITS services were listed with almost equally impressive impacts.
The benefits of ITS can be realised only after there are services that are delivered to and utilised by transport system users, regardless of the mode and whether private, corporate or institutional users of the services are considered. The service supply chains from observation to dissemination need to be constructed appropriately and it is not self-evident that these service supply chains can be built easily [5]. Neither is it obvious that service supply chains are emerging even when the demand for services is evident.
But without question, ITS has already rightfully taken its place in the tool box of decision makers and transport system engineers and there is in fact little doubt that the best of ITS can deliver significant benefits. Its economic importance has been recognised as well and many analyst reports show significant growth projections for the ITS market as a whole. Most importantly, the stronger and more competitive the ITS industry from the supply side is, the more there is potential for benefits.
The ITS market growth has seen to possess great potential for the years to come. Based on BCC research [6], there will be strong growth for ITS device market. The worldwide market is valued at 24 billion US$ in 2010, and it is expected to increase at a 22.2% compound annual growth rate during the forecast period to reach a value of 65 billion US$ in 2015. Besides, according to Kristensen [2], between years of 2000 to 2010, EU market for ITS equipment and services increase from 1 to 21 billion EUR per year. These aforementioned projections are based on market researches, the data of which are not transparent nor explained thoroughly, however, and hence they should be viewed critically. Yet, ITS is regarded as a fast growing sector with lots of promises—and not only concerning the benefits it is expected to deliver but also in terms of pure economic growth.
There is a solid justification for the use of ITS and it is been widely adopted globally and furthermore, the ITS cluster has been recognised as an industry of its own right. However, the size and the structure of the market vary from region to region, and from country to country, as the technological advancement and purchasing powers of the countries/regions differ significantly from each other.
This paper attempts to make the first quantitative and empirical analysis of the ITS industry in Finland, known as one of the high-tech societies in the world, ranked sixth by the World Economic Forum [7]. The home nest of Nokia has been seeking new “Nokias”—as the old one moves towards more mature phase of its evolution path— to boost national economy and to create new seeds of growth. Our paper aims to deliver critical, yet analytical information for several stakeholders. First, the Finnish industry policy makers and ITS business developers will hopefully view the data with a keen eye and build their perception of the ITS industry in Finland. Secondly, the analysis tools and approaches presented in this paper should be of generic interest to ITS community. ITS has long been the “wishing well” for both business developers and transport policy makers. This paper attempts to quantify the foundation of the expectations and hence bring in a more realistic view on the industry.
An early version of this paper is to be presented in ITS World Congress 2012 in Vienna, Austria.
2. Purpose and Scope
The first purpose of this paper is to describe the ITS market structure from the supply side. The demand side of the market, i.e. those consumers, corporate customers and authorities that demand ITS services and products for their own and for public good is not within the scope of this analysis although it clearly is more than tightly connected to the supply side. The supply side consists of companies that deliver these services and products. Supply side represents the “true” size of the market as it is observed since it can be assumed that the aggregate turnover these companies also meets the minimum demand: if there would not be true demand, there would not be any turnover, obviously. The observed supply, however, does not reveal whether there is any unsatisfied demand for ITS products and services. The first logical assumption is that there is always to some extent this type of unmet demand. The structure of the market will be described by positioning the companies that supply ITS in an industry value chain constructed particularly for this study. The value chain structure follows the traditional principles that of Porter [8].
The size of the market is simply the summed turnover of the companies since this figure represent the total value of ITS goods and services provided after demand. The companies’ selection—which companies can be regarded as “ITS companies”—is then not an equally straight-forward question. We created a set of criteria to select the companies but some important firms were still left out from the included group. This definition is identical to the definition “the total market size is the total value of sales”. The aggregate supply, i.e. the sales, of the sector representing the size of the market relies on traditional microeconomics concepts (see any standard microeconomics text book, e.g. Eaton et al. [9] or Pindyck and Rubinfeld [10]).
Thirdly, the growth trend of the ITS market is approximated with the help of a smaller sample of companies which can be considered as 100% ITS focused entities. By selecting this kind of sample we try to exclude the noise of other growth trends than that of ITS as those companies that have several other business segments alongside ITS would distort the ITS growth trend.
Fourth, the Finnish ITS market characteristics are qualitatively explained from several perspectives, yet basing the explanations on the quantifiable parameters of the companies belonging to the ITS cluster. We will assess characteristics like completeness of the industry value chain, concentration ratios (how scattered or concentrated the cluster is), and employment effects. Finally, we will provide an estimate of the ITS market in relation to GDP in Finland and point out how significant the industry is now and what is its prospective importance in the future economy.
Our analysis excludes the “intermediate” roles in the service supply chain as explained in Leviäkangas [5]. Thus the role of network operators is left out. These companies do develop also ITS related services but in reality we could not detect these offered in the market to any significant extent in Finland and hence we stuck to our exclusion decision. Their role in the future is, however, discussed in the concluding chapter. Moreover, even if these services existed, their value would be extremely difficult to extract from other revenue sources.
In this paper, the definition of “ITS industry” is holistic and somewhat subjective since ITS in itself does not have definite boundaries. What we have explicitly excluded from our sample are the operators’ services related to ITS and consultancy related to supply chain management. The latter also represents somewhat significant consultancy business segment that could be considered as ITS. We follow the loose definition of ITS given by the Intelligent Transportation Society of America [11]:
“ITS is the collective term for the use of electronics, communications, and information processing technology to improve all aspects of transportation—including public transportation.”
The choice how to define an industry and how to aggregate (or disaggregate) industry data is always subjective and done on a pragmatic and/or ad hoc basis. For example, the industry definitions of Statistics Finland and Eurostat vary from time to time, depending on the purpose of use and usability. What is relevant is the continuation of uninterrupted time series if one wants to see how industries and company clusters are developing over time. Hence, our decision on aggregation of company data is purely a pragmatic choice, which may be rightfully criticised, but which provides uniform time series and hence best foundation for conclusions and prospective policy decisions.
3. Methods and Data
The methodological foundation lies in microeconomics basic concepts and tools. The paper relies on empirical data and applies the standard metrics of market and industry structure analysis. The merit of the paper is in its empirical material and its handling. This is the very first ITS quantitative, empirical supply side market analysis that has been carried out in Finland and published for wider audience. Based on our review of literature in the field, we claim that it is one of the few public analyses in the world.
The first set of companies were selected by our own organization’s (VTT) business intelligence unit whenever it was found from public documents or text media (press, internet) that “intelligent transport systems” was associated with the company in question. The sample was reduced when the internet sites and annual statements of the companies were individually studied and if the ITS aspect was found to be relevant enough, i.e. the company obviously delivered ITS products and/or services to its customers, the company was included in the sample. If there was still uncertainty whether the company entitles an “ITS” label the company was contacted directly and senior management was asked if the company had any ITS-related business.
Some of the companies could be explicitly regarded as “100% ITS focused” meaning that all its business was about ITS product and/or service delivery. For multisegment companies there were several methods to assess the volume of ITS-related business: 1) the ITS related business segments were reported in terms of volume in the company’s annual statement reports; 2) ITS-related business volume was also gathered from public databases providing company’s financial statements; 3) a direct question was placed to the senior managers of the company in question asking how big a share of their business was about ITS; 4) if none of the abovementioned methods were working, the authors made their own assessment based mainly on number of identifiable business segments and headcounts. For the last case, for example, if the company reported five main business segments of which ITS or transportation was one and if this segment seemed to include 10% of the work force, the obvious conclusion was that the ITS business volume as a percentage of turnover was likely to be somewhere between 10% and 20%. In some individual cases the assessment was on an unstable foundation which affects mainly the market size estimate. A brief sensitivity analysis was performed to tackle the most obvious uncertainties.
The turnover figures were picked from annual statements which were available from several sources as well. The first was the companies’ web sites. If the sites did not present annual statements, the public databases that collect information from the National Board of Patents and Registers of Finland (www.prh.fi) were used. These data bases included free-of-charge services provided to analysts, such as Fonecta Finder (www.finder.fi) and Yritystele (www.yritystele.fi). Third source was economics and finance journals that provided corporate analyses for business and investor community, such as Kauppalehti (www.kauppalehti.fi). Many times the data was cross-checked using two or three sources for the same company but since the original data came from Patents and Registers there were no grave errors we could detect. In few cases we could detect different figures that deviated a few percent units from each other but we consider biases of this magnitude insignificant, especially when thinking of other much more probable sources of errors, such as the uncertain estimates on the shares of ITS business in multi-segment firms.
The market size was estimated from the turnover figures from year 2010. The growth trend was approximated based on data for 2006-2010. The data periods were used for other purposes like employment effects of the sector. For industry and market structure, the 2010 data is used. The concentration of the industry is done both visually and using modified Herfindahl indexes (see e.g. US Department of Justice and the Federal Trade Commission, [12]).
The nationality, or rather the origin country, of the companies was decided based on the location of headquarters. Those headquartered in Finland were regarded as Finnish companies although the ownership could be anywhere. The large corporations’ national subsidiaries, such as Siemens Finland Ltd., were considered as nonFinnish, international companies. The same logic positioned e.g. Vaisala Ltd. as a Finnish company although the great majority of the company’s activities are elsewhere, including the ownership. This division was made thinking of the industrial policy recommendations we decided to draft based on the results of the study.
4. Results
4.1. ITS Supply Industry Structure and Size
There are three important, simplistic roles in supplying ITS products and services. First, the role of equipment and hardware providers that supply infrastructure or vehicle associated physical components or personal devices. Second group consists of systems and applications providers who supply entire or sub-sets of ITS systems which combine and integrate the products and services of systems and applications providers, sometimes including the services of the last group of suppliers, the service suppliers. The last mentioned category of the supply side provides consultancy, design, installing, and operating ITS services. These supply function groups meet the demands coming from the public, corporate customers, and consumers. In efficient market, they all meet in a stage of equilibrium (Figure 1).
The categorization follows that of presented also Yu et al. [13], who considered five key categories for Chinese ICT industry: the equipment provider (EP), application provider (AP), service provider (SP), content provider (CP), and operator, which are attributed to as supply chain members within the ICT industry. As stated previously, the operator role was excluded first because of its intermediating role and secondly because there were no significant services delivered by the operator group. Even if they had, the revenue estimation would have been extremely difficult. Content provider role is merged to systems and applications provider role in our analysis and we do not attempt to draw clear role boundaries between the supplier segments. In many cases, there were two, even three, roles present within one company and we selected the one that we considered to be the dominant one. Figure 2 and Table 1 summarize the categorization and their relationship of ITS industry that has been used in this study.
The ITS supplier group comprised altogether 72 companies, of which 72% were local (Finnish) companies. Some industry structure metrics are shown in Figure 3. Service providers (SP) have a relatively dominant position 47% of total number of companies and 56% market share of ITS supply in Finland measured as turnover in year 2010. Equipment and hardware providers (EP) were the second largest group of companies measured by number of firms (30%) and with 33% market share. Systems and applications provider firms represented were more than fifth (23%) of the industry but yielded only to about 11% of the market.
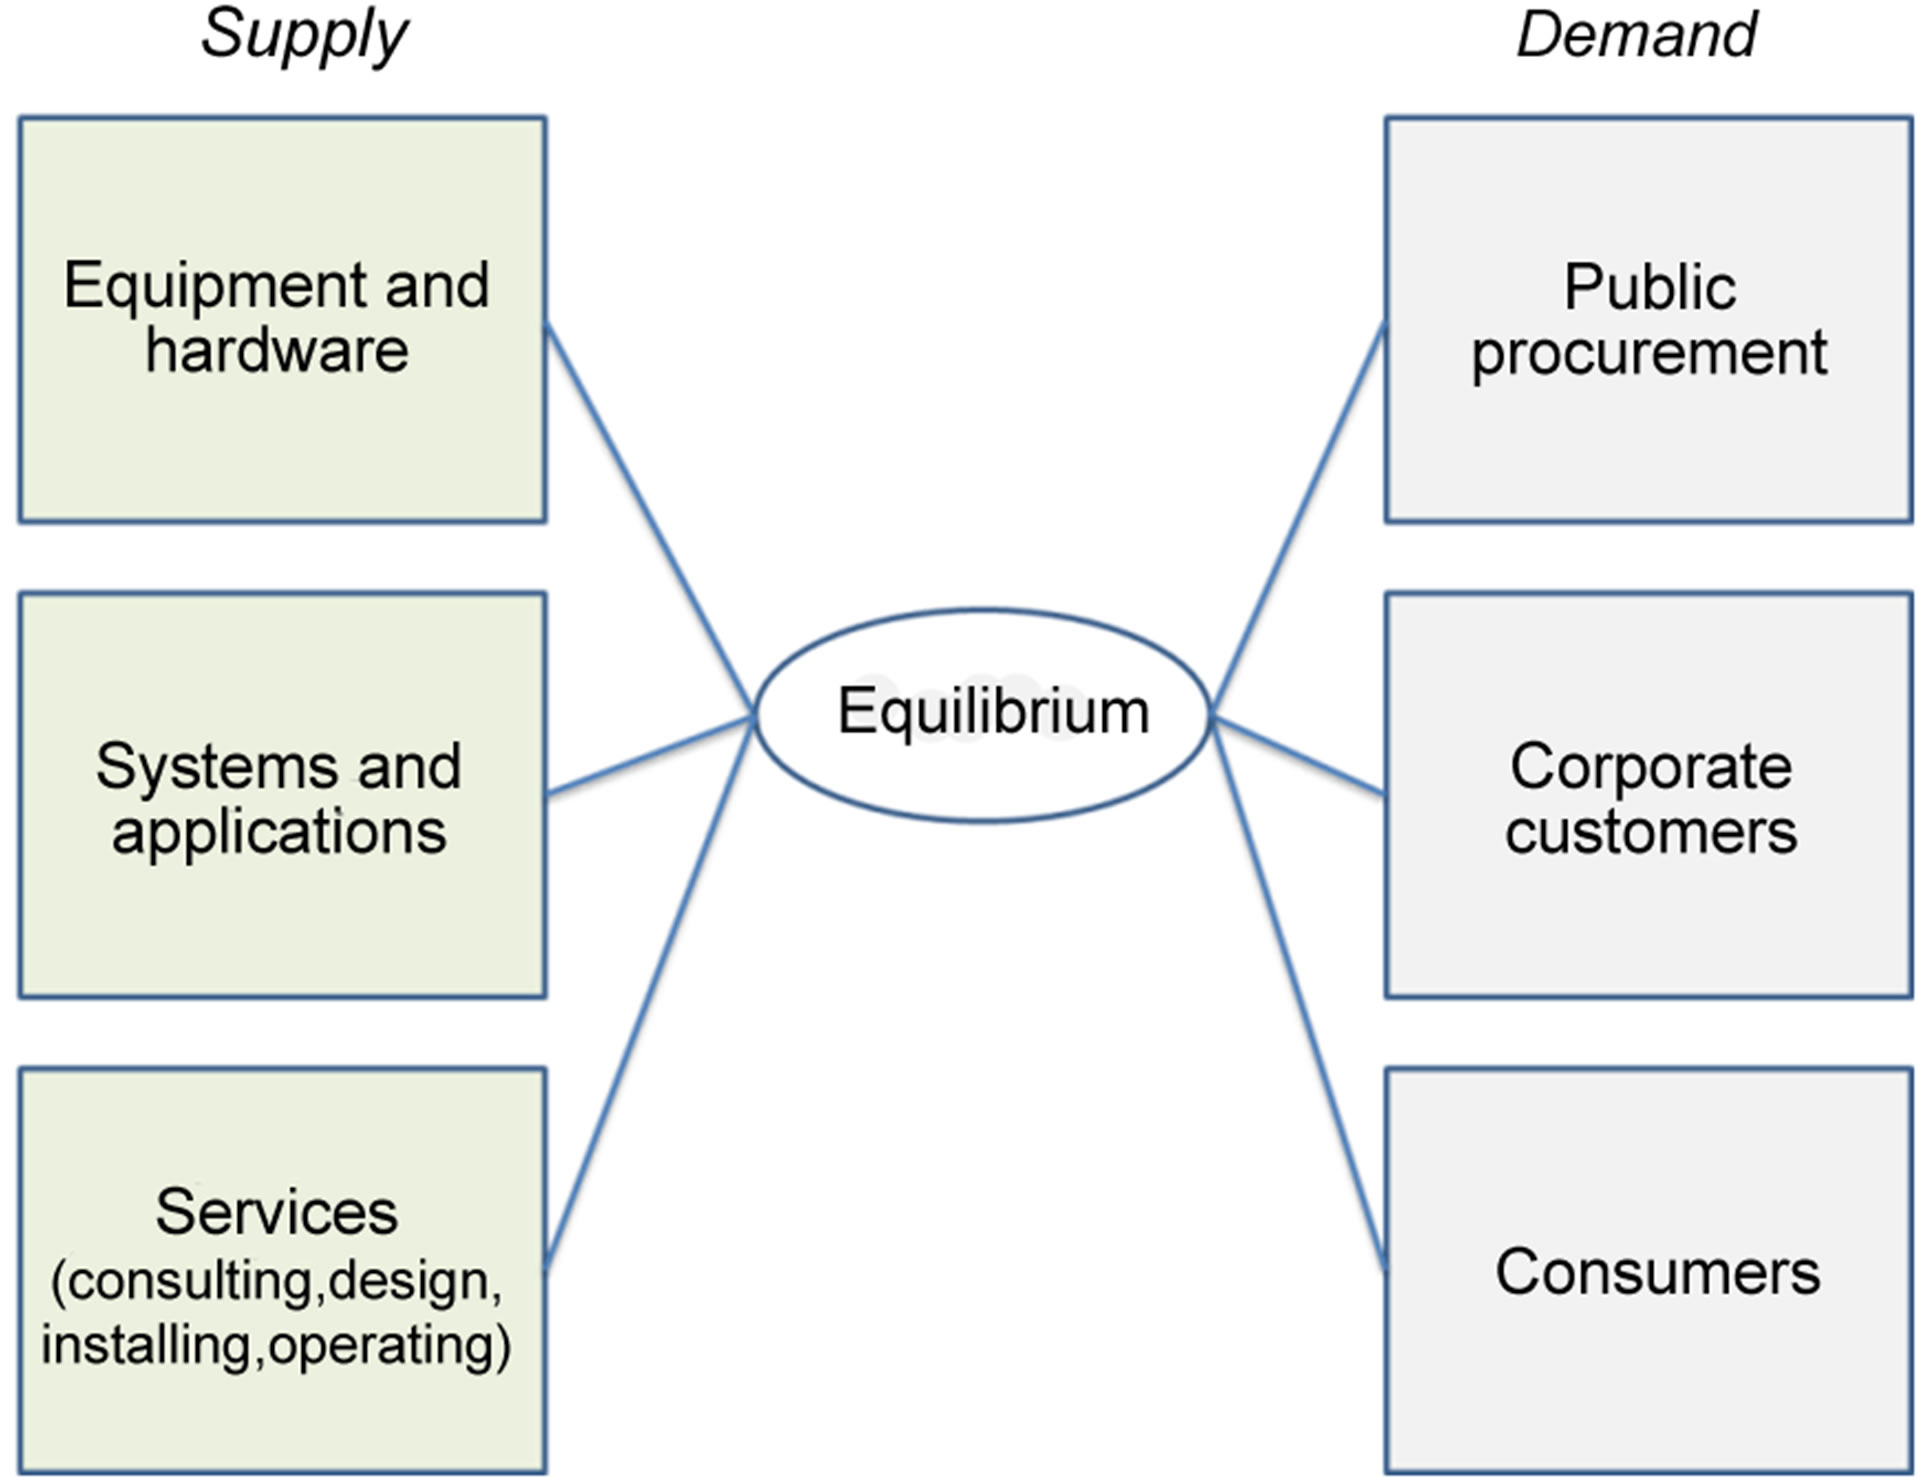
Figure 1. ITS industry structure—the supply and demand.
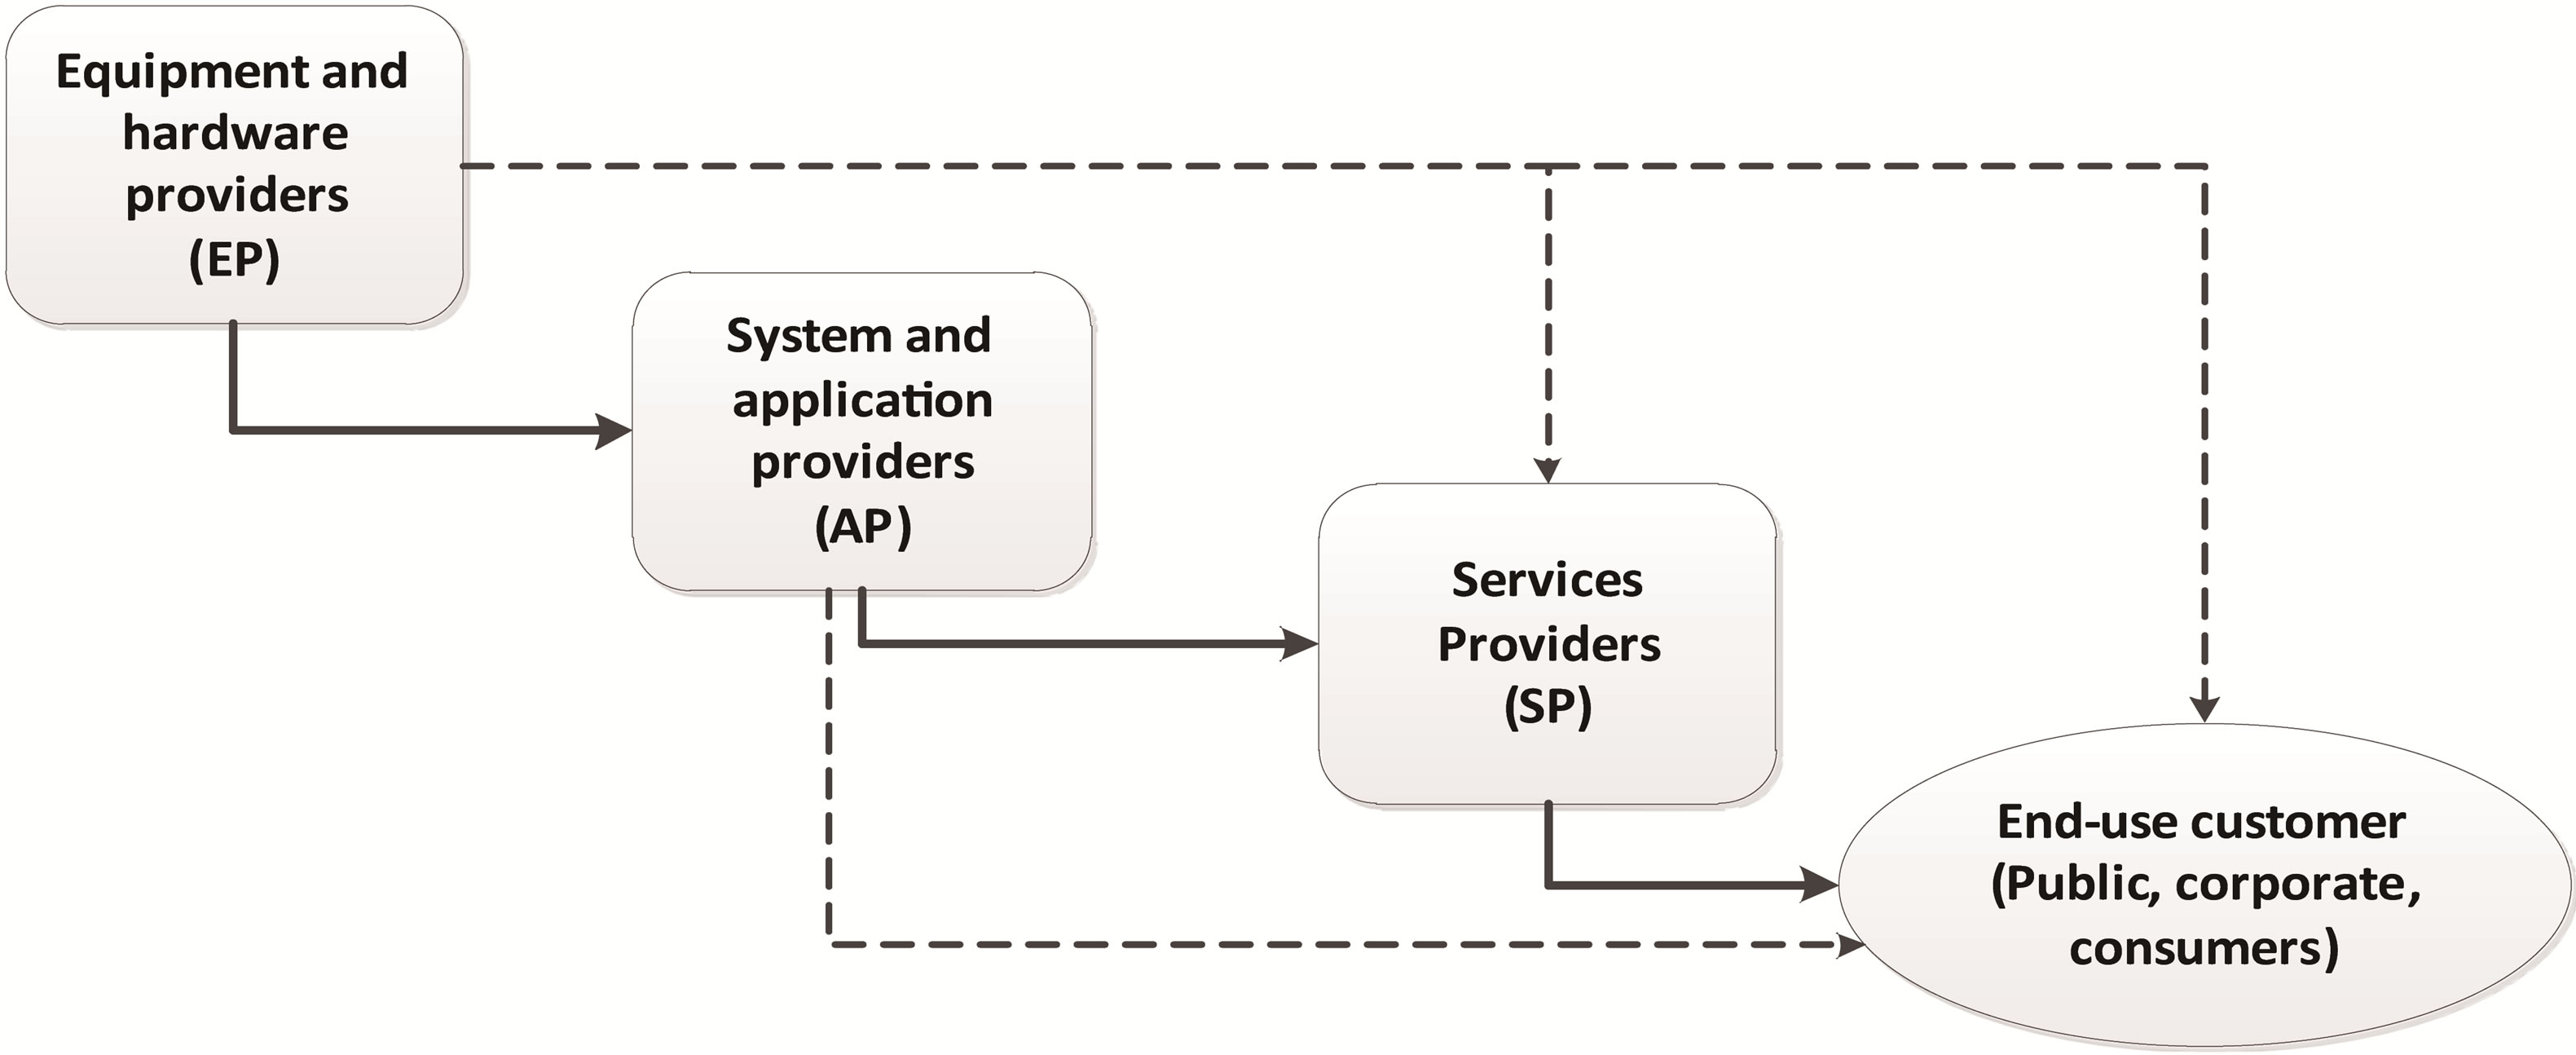
Figure 2. Simplified ITS industry supply chain.
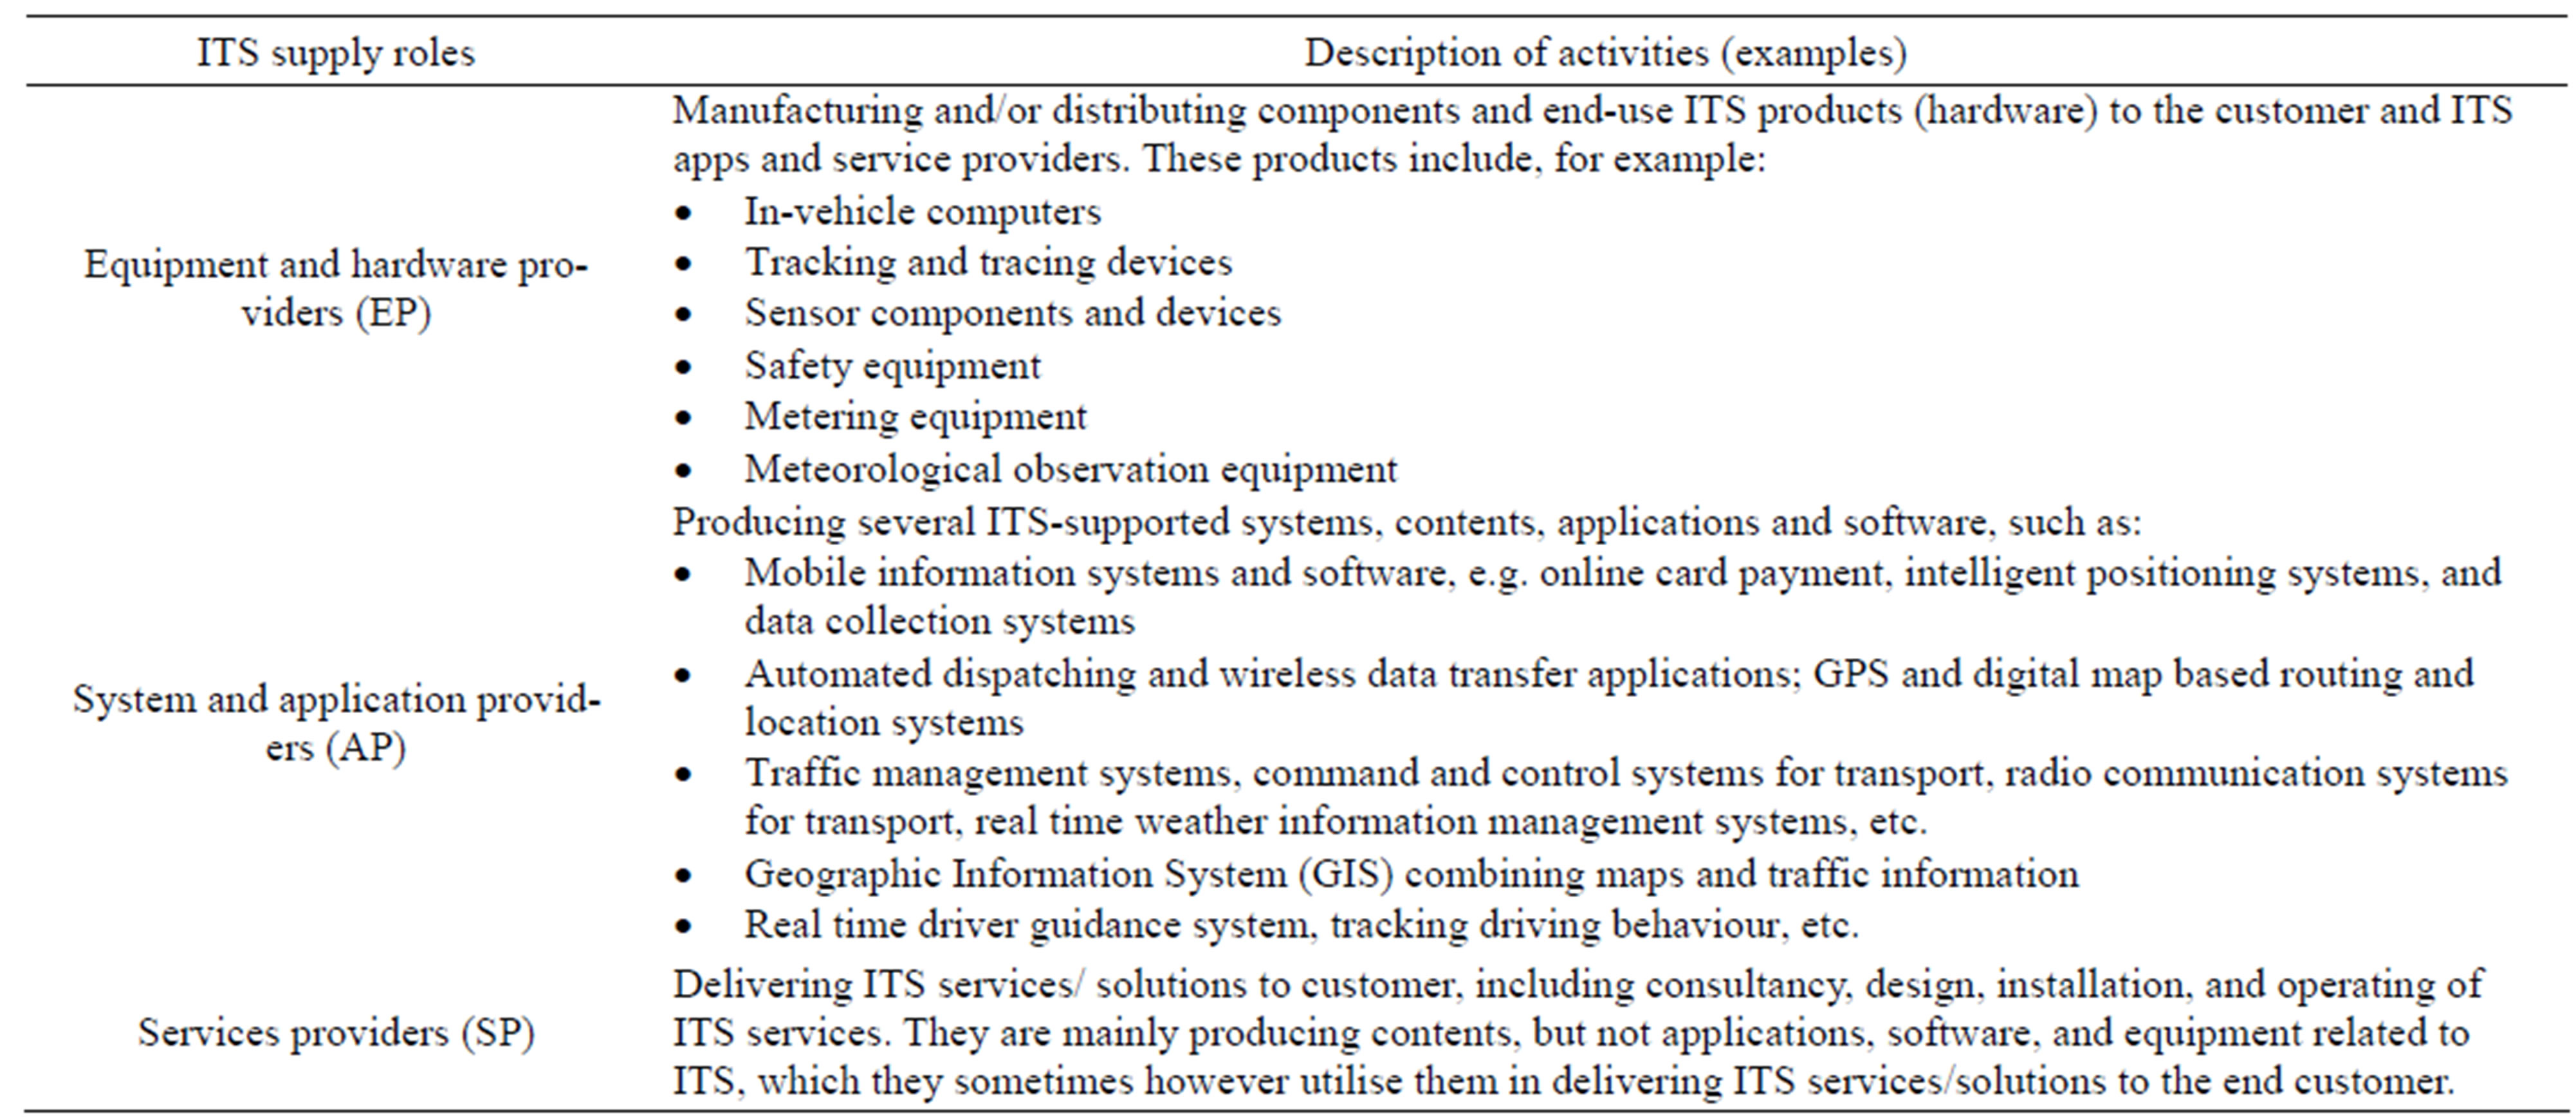
Table 1. ITS industry categorization.
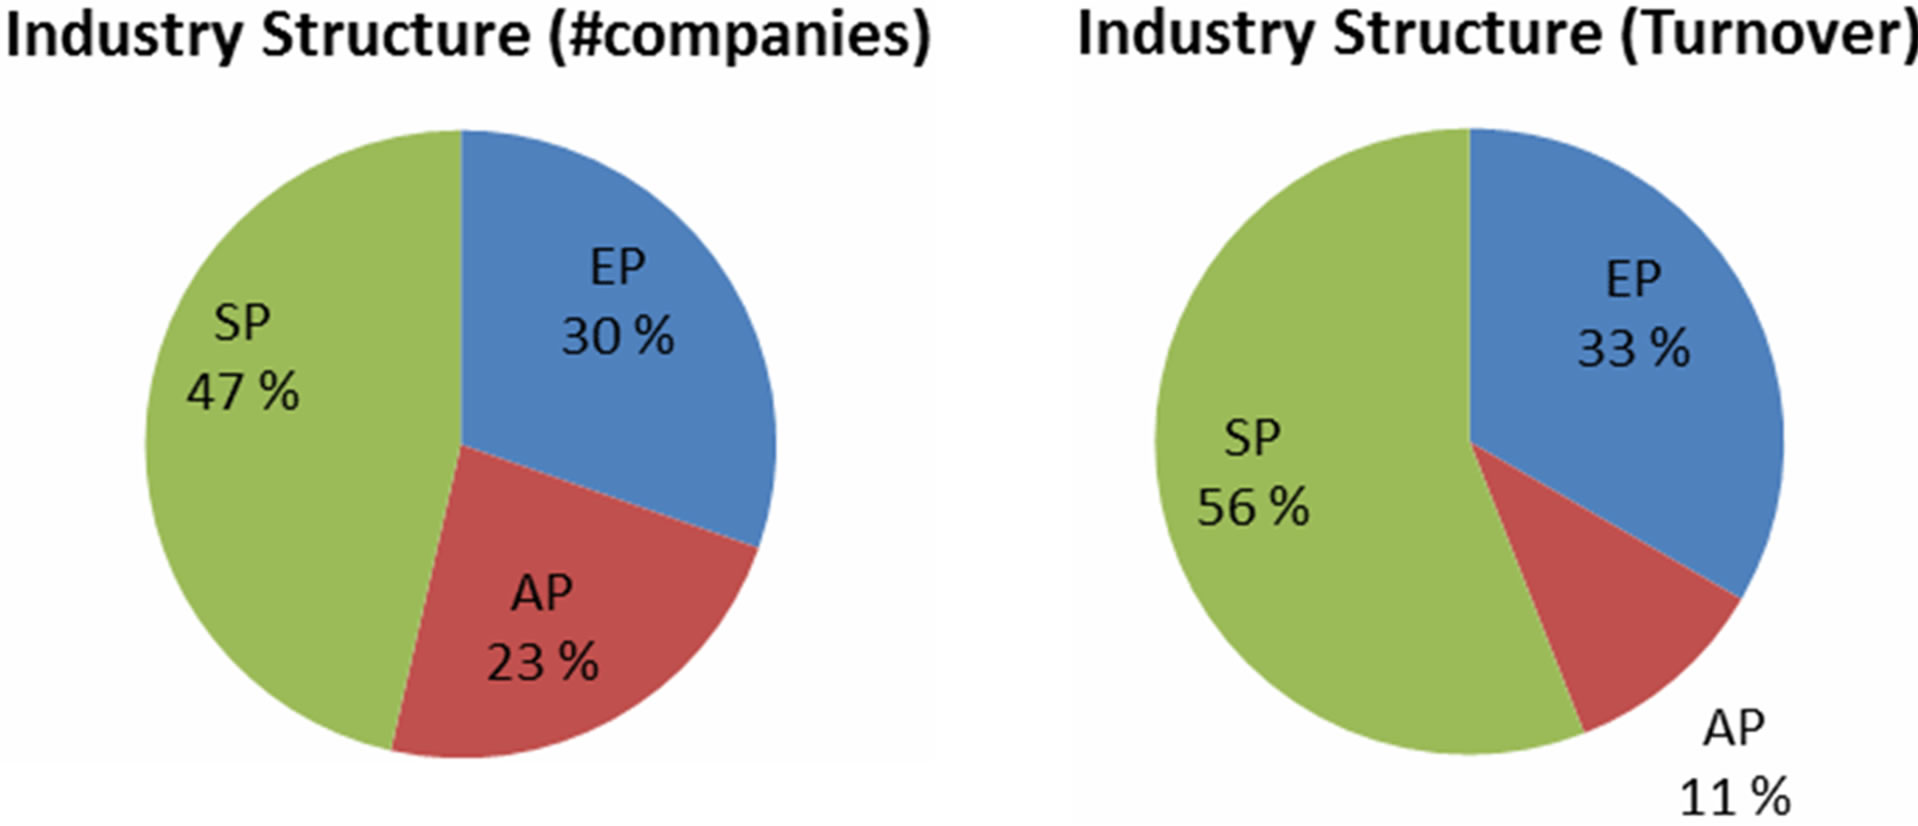
Figure 3. ITS Industry compositions.
The size of the market is simply approximated as the summed turnover of the companies. This sum represents the total value of ITS goods and services supplied. Based on cautious calculation of turnover data provided by trusted sources (as explained in chapter 3) of financial information, it can be roughly estimated that the total ITS market size in Finland valued around 300 million in 2010. This means a figure that is approximately 0.17% of total GDP in Finland in 2010.
In the categorisation of firm size, the Eurostat standard (The new SME definition user guide and model declaration [14]) was applied when dividing the companies into micro, small, medium-sized, and large companies:
1) Micro company: annual turnover less than 2 million EUR;
2) Small company: turnover between 2 to 10 million EUR;
3) Medium-sized company: turnover between 10 to 50 million EUR;
4) Large company: more than 50 million EUR turnover.
It should be noted that the turnover value used is only the ITS business related turnover—not directly the company’s turnover itself as shown in its financial statement. Hence, a multi-national giant corporation can be a smalltime ITS player in Finland. For some companies, the authors estimated the share of the turnover by themselves based on analyst reports, annual reports and website information given by the company. These companies were, however, a clear minority. Figure 4 shows the industry structure in terms of firm sizes.
It is observable that medium-sized and small companies dominate in the market, or at least, the big players do not have a dominating position. The medium sizedcompanies reached in sum a turnover of around EUR140 million, followed by small companies with a turnover of about EUR80 million in 2010. However, a closer examination revealed that there is a restricted group of medium-sized companies (5 companies) and one large company that hold a significant share of the ITS market. We did not however, analyse how dominant these positions were and how they showed in different groups (EP, AP, SP). This would certainly be a case for further analysis.
ITS market concentration was also evaluated by using a modified Herfindahl index. It is calculated by summing of square of the individual firms’ market shares. Equation (1) is the formula for calculating the Herfindahl index.
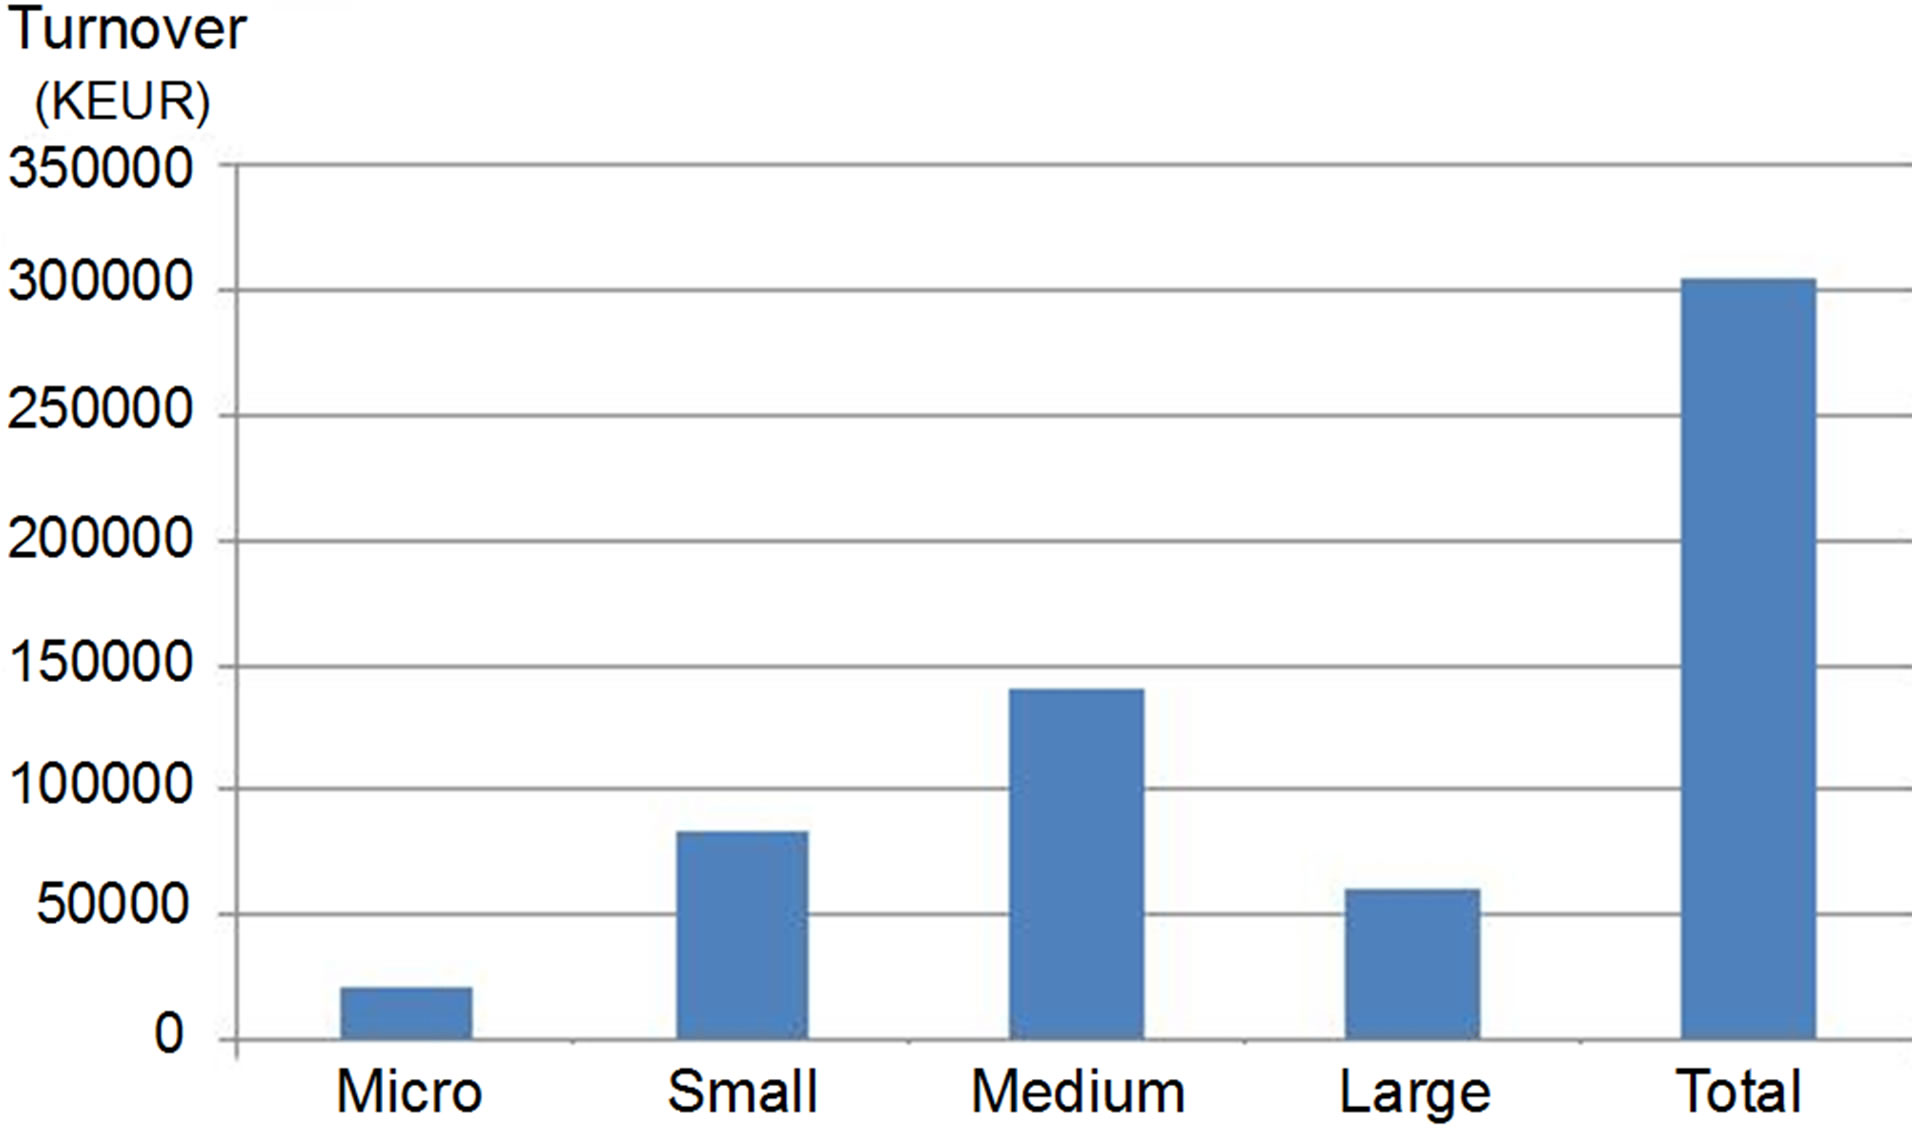
Figure 4. ITS supply market size and firm sizes.
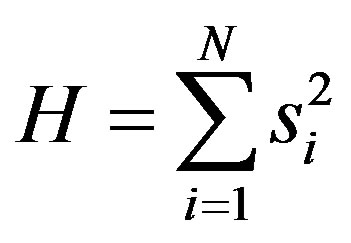 (1)
(1)
where si is the market share of firm i in the market, and N is the total number of firms in the sample.
The Herfindahl index of ITS industry in Finland in 2010 was 0.092. The text book interpretation is that the market is unconcentrated (below 0.15) and no monopolistic or even oligopolistic features can be witnessed at first sight. This is followed with an obvious notation that the market seems to be fairly competitive. Although the moderate concentration do exist within the same segment of the industry value chain, especially for AP and SP. Otherwise, EP seems to have a high concentration indeed, because of a large EP company has contributed a significant market among others. Furthermore, Table 2 presents descriptive information regarding to ITS market concentration from other approach.
The employment numbers of ITS industry was also checked. The Finnish ITS supply market had around 1700 employees in 2010. Figure 5 shows the scatter diagram of number of employees compared to the turnover of each company. Only a handful of companies employ more than 100 employees and the firm sizes look very modest from this perspective. Again, the share of ITS business related turnover was used as a proxy for ITS related employees.
It goes without saying that the whole ITS market, if the demand side is calculated in, will be somewhat bigger in terms of employment. The authors doubt, though, that the employment factor is not one-to-one but much smaller than that. The number of people working in the field of ITS in government sector is read in dozens, not in hundreds.
4.2. ITS Market Growth and Other Characteristics
ITS market growth in Finland was also examined. As stated earlier, the market growth was calculated using only those companies that were considered as 100% focused on ITS business. Altogether, 24 such companies (one third of total number of analysed companies) were included in growth analysis. The annual growth was taken from annual turnover changes for 2006-2010. Ten on average fastest grown and five weakest grown companies were analysed separately to capture the dispersion between fast and slow growing entities. Furthermore, the growth figures were compared to general economic growth, namely annual changes in GDP (provided by OECD [15]). Nominal values were used for growth calculation, meaning that the face values of each year turnover were used as such with no inflation or any other value of time adjustment. Using nominal values throughout the line makes the figures comparable. (If inflation adjustments would have been used, also GDP growth would have needed to be stated in real terms). Figure 6 shows the trend comparison graph.
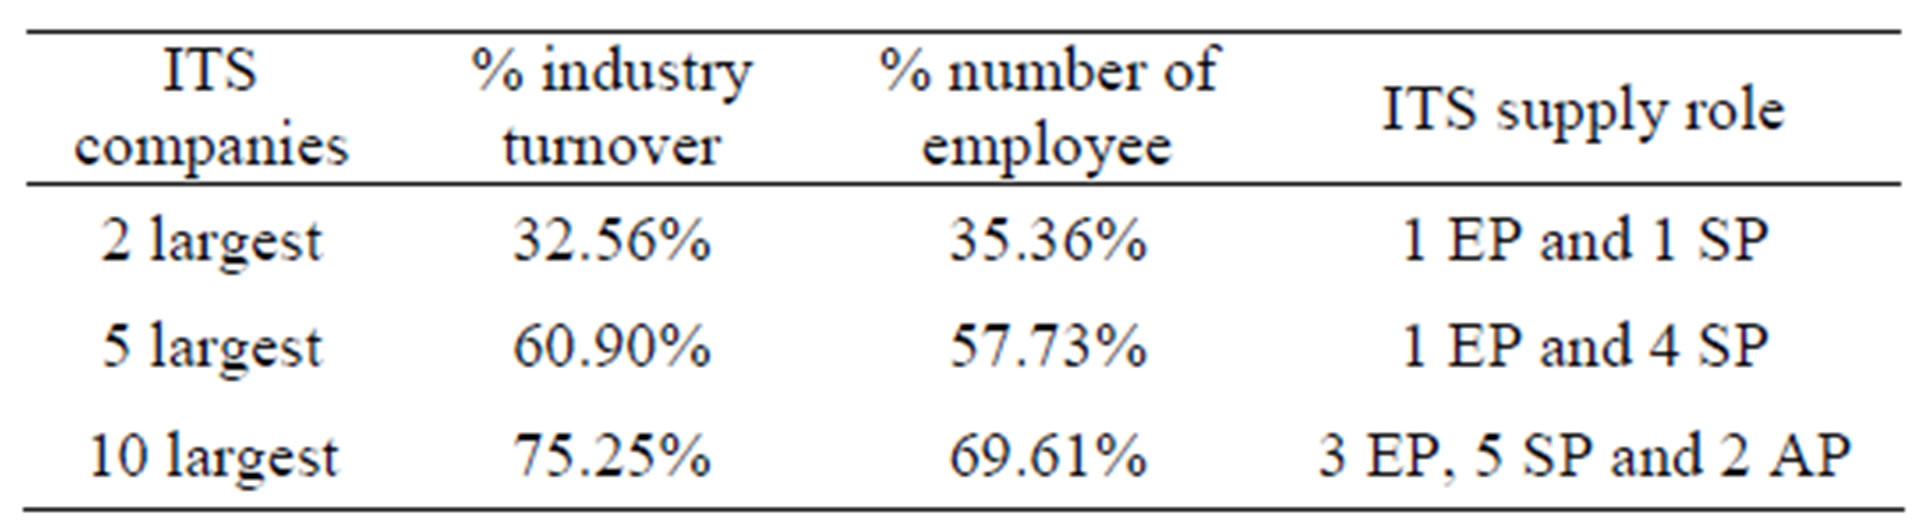
Table 2. ITS market concentration.
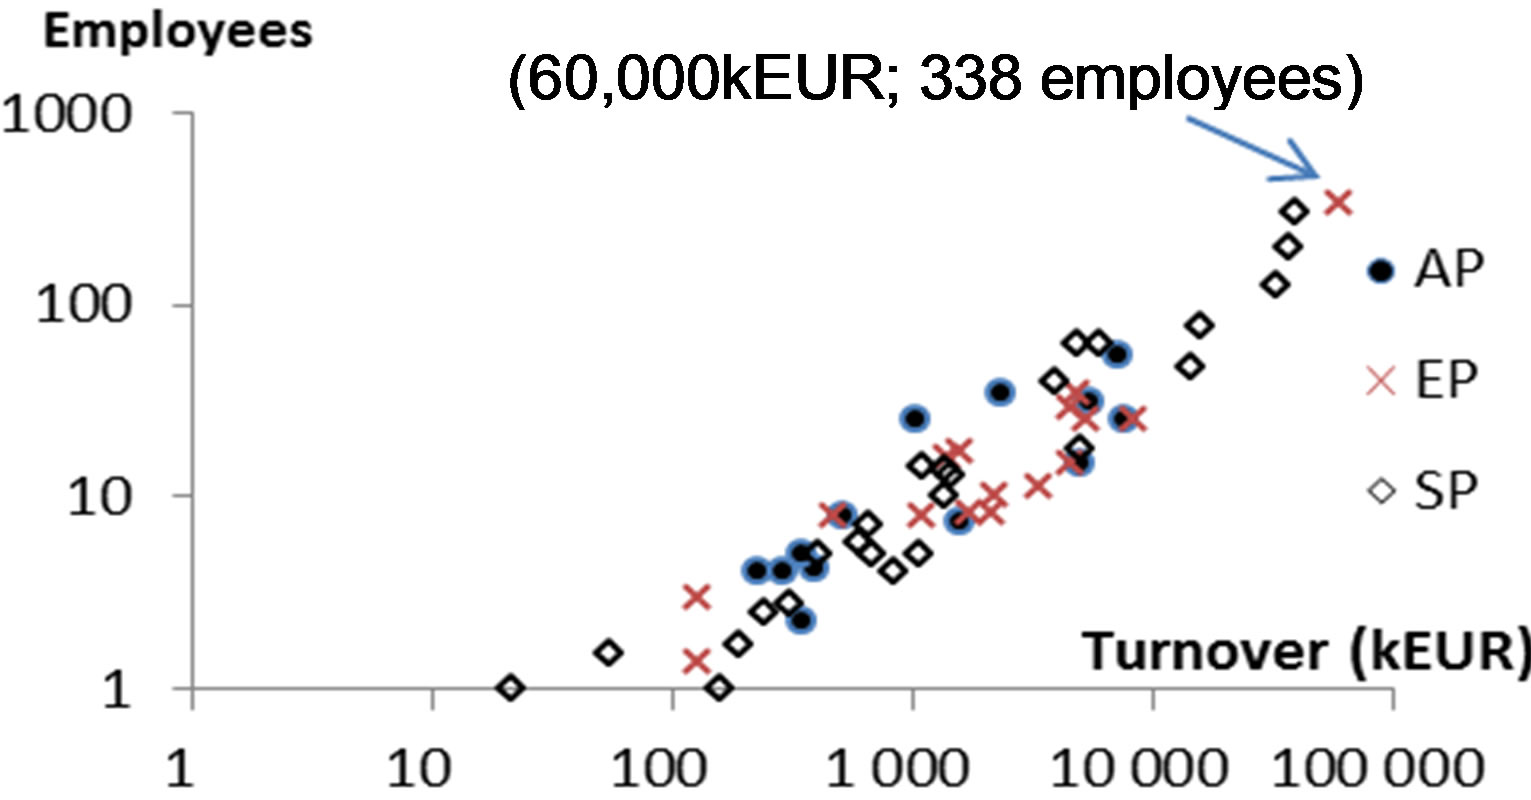
Figure 5. Number of employees-turnover scattered diagram.
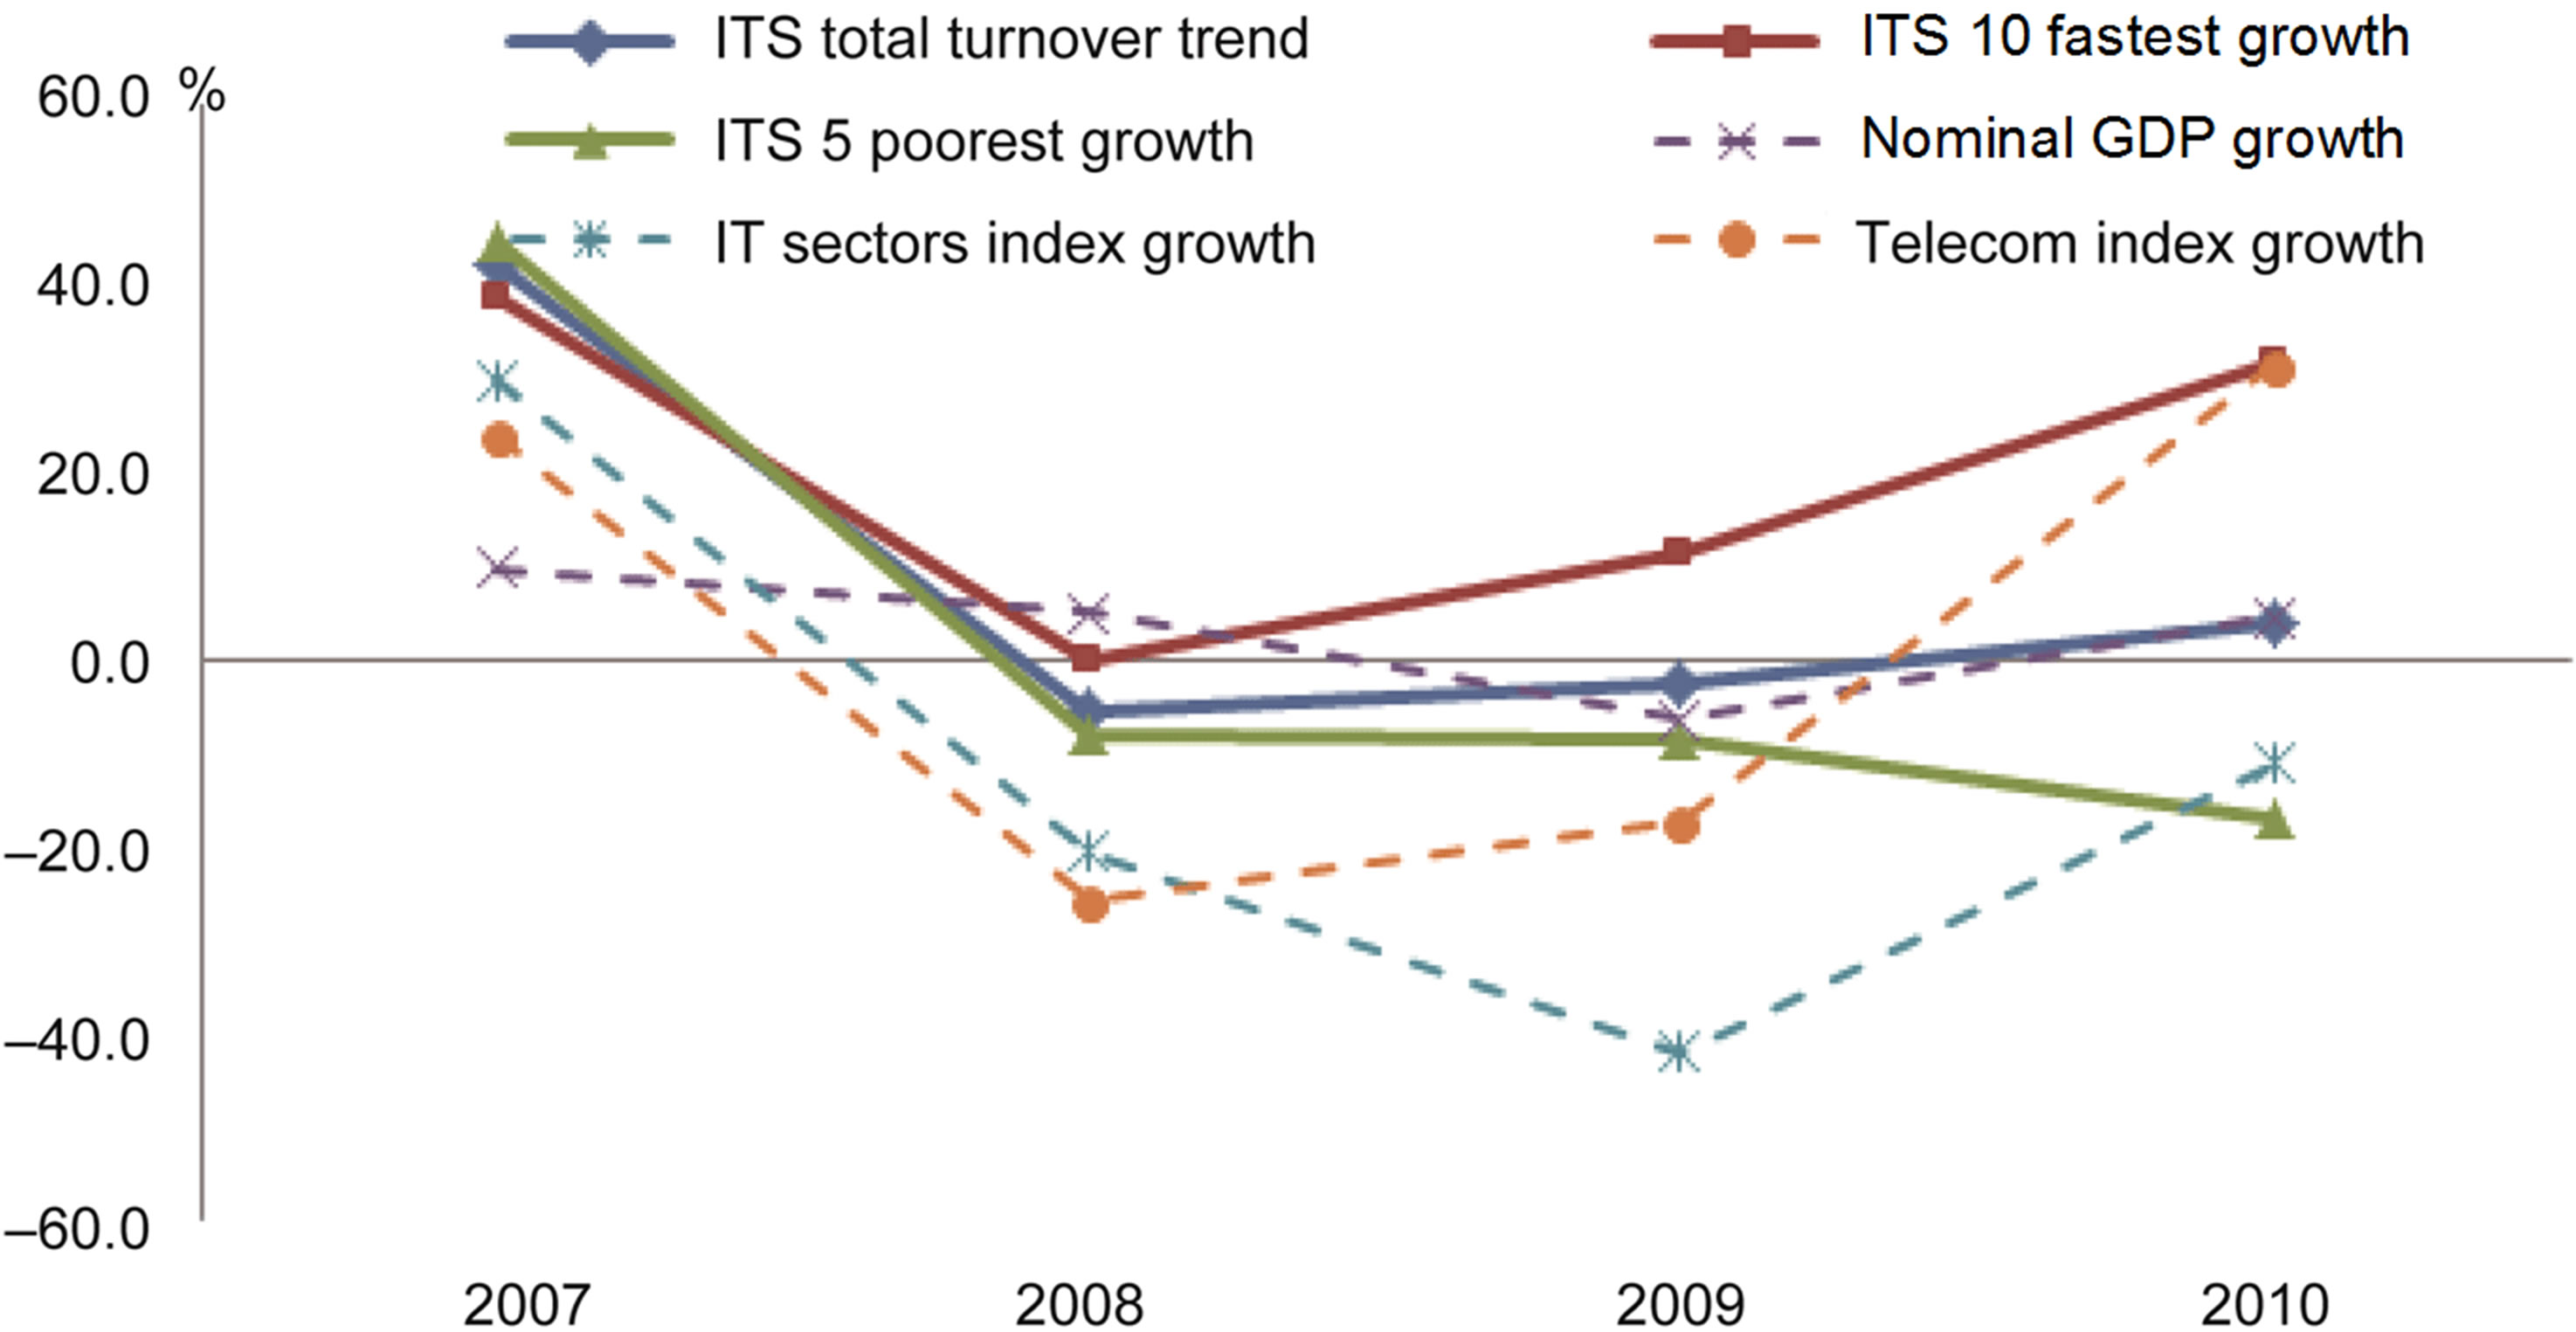
Figure 6. ITS market growth and economic growth.
From the graph it is visible that ITS market had a significant growth in 2007 but has since then been very slowly been turning upwards from the negative growth observed in 2008 and 2009. However, the growth of the market based on firm sample is yet promising when compared to GDP growth. The fast growing firms have clearly been doing well whereas the weakest performers seem to have a continuous declining trend.
Besides comparing ITS market growth with GDP growth, also other benchmarking indicators were looked at. The Finnish Share Indices for Information Technology sector index, and Telecommunication Services sector index, provided by Bank of Finland [16]. Table 3 shows those indices.
Since ITS by definition is expected to have a strong correlation with IT and telecommunication services, it is interesting to witness what has happened in the eyes of the investors during the same time period. The IT sector share prices have declined as investors have moved to other sectors, whereas the telecomm services sector has been gaining IT and surpassed it in terms of growth. Much of this is due to Nokia’s dive which is doubtlessly visible in the IT sector index curve. Nokia weighs still quite much in the Finnish stock market list although the relative share of the composite indices has reduced during recent years. ITS companies’ turnover has followed quite closely to GDP figures. This is a fact to recognise and we will take this up later.
What was left out from this analysis (and saved for later) was the correlation analysis between the returns of ITS companies and share indices. With this information, the industry beta (see e.g. Leviäkangas [17] for detailed beta calculation methods and Nokkala et al. [18] for sectoral betas) could be derived describing how systematic was the risk of ITS industry.
5. Evaluation and Discussion-Reliability and Validity
To evaluate the reliability of the results the most significant sources of possible bias comes from the authors’ own estimates concerning the ITS business segment size of the supplying side of the industry. 18 out of 72 companies were assessed by the authors with only very limited amount of financial information. For 12 companies out of 72 the size of ITS business segment was deemed to be almost zero because these companies did not have too many significant extent identifiable services or products related to ITS. Still, these companies were active in the
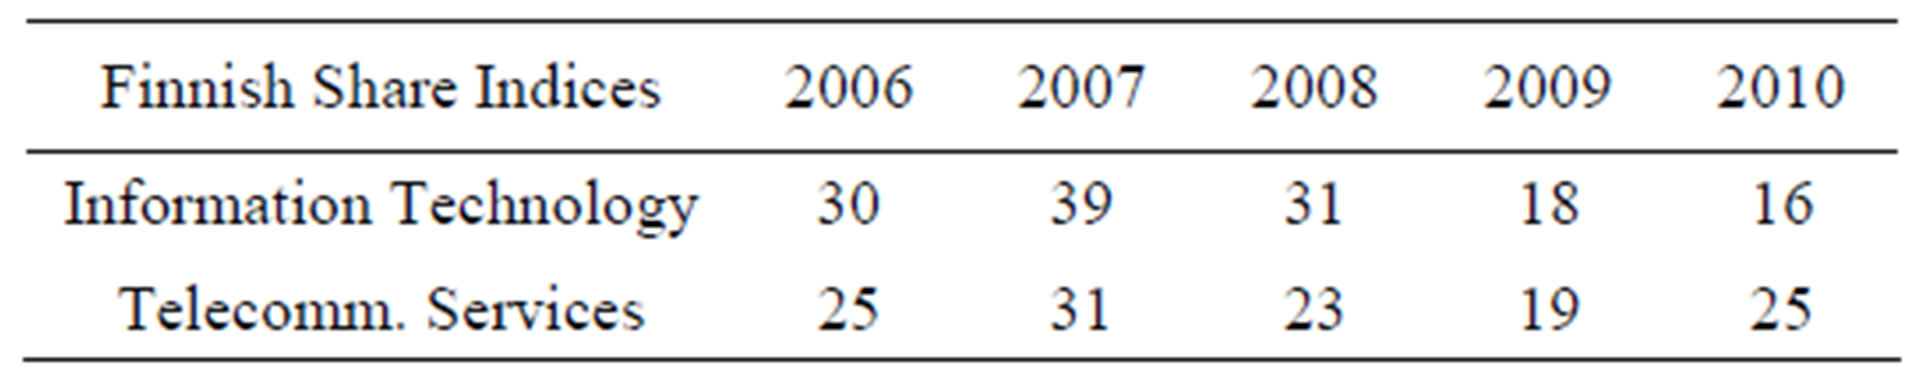
Table 3. Finnish share indices.
field and e.g. participating the activities organised by ITS Finland, the national ITS lobby group (www.its-finland.fi). These activities were considered to be actions of business development rather than actually having direct association with existing business offering, not to mention revenues. For three (3) companies we managed not to make any kind of assessment so they are certainly a possible source of bias. However, out these three, only one was considered to have a significant amount of ITS business as it was defined in this paper. This could impact influence the results with less than one percent unit.
The second source of bias which we must consider is the actual definition of what is regarded as ITS. However, this is a systematic error and is contingent, that is depending on the dimensions and contents of definition of ITS. For all the market studies used as a reference and starting point of this research this source of error is more than obvious. Hence the conclusion is that this paper delivers so far the most reliable supply market estimate for Finland where the sources of errors have been acknowledged. The estimate of ITS contributing to approximately 0.17% of GDP is considered to be of correct magnitude. It is certainly serving well enough the industrial policy making if such policies are considered with regard to ITS. To compare this result, although the methods are not most likely coherent, Ezell [1] reported that South Korea and Japan invested some 0.016% of their GDP in ITS, whereas US did 0.008%.
As to growth estimates, the only companies included to the sample were those that were assessed as 100% ITS companies. As the fastest growing and the weakest growing ranges were analysed the spectrum should be visible enough. It is clear that ITS industry as such is not a growing or fast growth business. Some companies are just the promising ones and some not so much so. This is an important finding, although looking quite self-evident. What seems to be quite visible is that ITS is still as an industry growing faster than the total economy during the last few years. This is an equally important notification. Exclusion or inclusion of the few missing companies with their data is not likely to change this picture at all. However, the authors suggest that a more realistic picture concerning ITS should be taken and too high expectations should be avoided.
For next steps to continue this research the following is proposed: 1) splitting the supply side of the industry into more detailed value chains and considering what the growth potential could be in different parts of chain; 2) analysis on changes in the industry structure over time— are the big players getting an ever bigger slice of the market or vice versa? Is service providers’ role getting any different or is it the hardware providers than then dominate the market? 3) how is the employment changing over time and what is the labour productivity developing? This follows somewhat also to other structural changes of the industry: services usually always employ more people than manufacturing; 4) further analysis of the prospective role of telecom operators as service providers. If they are successful in building financially viable consumer or B2B services, this could have a radical impact on the market size. On the other hand, equipment manufacturers, especially mobile personal devices manufacturers are already today trying to package various type of services package in their products. This would imply that the services market is somewhat the follower of the equipment market.
6. Implications to Industrial Policy, Investments and Business Strategies
Since the analysis is about one country’s one industry segment, the findings and their implications inevitability must touch the national industry policies and how policy makers should view the industry as a prospective source of economic growth and employment. Below we reflect our own conclusions which were formed during the undertaking of this research.
Our first concern regarding the ITS industry was the sluggish growth of ITS focused companies. As we looked closely at that group, we noticed that many of those could be regarded as consultancies. Consultancy in Finland is traditionally offered more to the public sector due to public sector’s strong role also in the ITS development. There is even a national ITS strategy issued by the Ministry of Transport and Communications Finland [19] which states as one its goals to have a strong ITS domestic industry.
Another point that caught our eye was the close relationship between GDP and 100% ITS firms’ turnover development. There is a risk that much of the ITS service segment, which is the dominant segment, is associated with consultancy to the public sector. From industrial policy point of view this is not a good signal thinking of the building of the industrial basis for the country, not at least from ITS building blocks. Hence our analysis provides a weak warning signal concerning the long-term effects and employment capacity of the domestic ITS industry. This signal is strengthened by the fact that there are few real services out in the market, delivering the benefits expected from ITS.
Third, the servitization of industries, even the hightech ones, is enhancing the roles of traditional equipment and hardware providers. There are a number of reasons why this is happening, but the end result is that equipment manufacturers are integrating themselves vertically and downstream along the value chain [20-22]. A growing number of consumers are not buying a Samsung or Nokia phone, but the services these manufacturers have been able to package with the phones. There is no doubt that in the ITS industry this about to happen as well. Unless there is a strong equipment and hardware manufacturing base in the country, there will be less chances to create a domestic service sector along with manufacturing. In Finland’s case, this means the invasion of international conglomerates which will try to capture not only the equipment segment, but also a big chunk of the services. We see a weak signal also here, but acknowledge that such development is good for the companies and most likely for the end users. For political system, that is always looking at the world through lenses with “our flag’s colours” the development can be undesirable.
Dedicated application and service providers should have very competitive concepts to compete against horizontal integrators, particularly if the same integrators’ components or equipment must be used in applications and services. On the other hand, service business has so far been mostly local (overlooking the ownership issues), but even this logic seems to be changing. Public transport services, security services, not to mention more ICTintensive services, such as travel agency services, have become global businesses within a decade or so… and the actual list is very long. Even the employment impact can be locally insignificant.
Investors are naturally aware of the above signals and act accordingly. New start-ups will have it difficult to find capital investors unless they have something very unique to present which will survive the competition, first domestically and then internationally, or which are technologically so superior that competitors are forced either to ally with start-ups or buy them out. Services and applications can be lucrative investment objects only if the concepts are strong enough for international scope. Domestic concepts can be innovative and locally providing jobs, but for most part they can probably be copied and transferred to other markets with reasonable effort and tailoring. Investors do not really care whether the business then expands or is sold to a formidable bidder just as long as the returns are there.
To return to the question on industrial policy, we may ask the question how to build up an industry? Should we start from manufacturing and then move on to services? We claim that this is the more natural evolution path to take and a number of equipment manufacturer stories exist where they have successfully moved to cover also services. The opposite is harder to distinguish. This leads to the conclusion, that if a country wants to build a successful new industry, it would need to find a solid and tangible base for it, the companies that deliver hardware and equipment. However, there is an opposite trend in the industrial policy and public financing of technology and innovations. This thinking leans on business prospects and providing something straight to the markets, “time-to-market” is the magic word. We claim that this thinking is not without risks, particularly so if it lacks the industrial cornerstones. It may lead to innovation investments that are close to the market and end-user oriented, but lack the necessary building blocks for even a foetus of an industry.
ITS is already in its prime youth, though, but the trick for smaller players is to make exactly the right bets, because they cannot afford to lose their money in small-time efforts which do not foster real long-time growth.
7. Acknowledgements
Financial support from VTT (Graduate School and INTRANS Innovation Programme) and Ministry of Transport and Communications Finland are acknowledged.
REFERENCES
- S. Ezell, “Explaining International IT Application Leadership: Intelligent Transportation Systems,” ITIF Publication, Washington DC, 2010.
- J. N. P. Kristensen, “Why ITS Needs PCP,” P3ITS Webinar, ERTICO, 26 May 2011.
- F. Ferreira, “ITS Action Plan and Directive—Framework for the Deployment of Intelligent Transport Systems,” P3ITS Workshop, ERTICO, 2010.
- P. Leviäkangas and A.-M. Hietajärvi, “Weather Information for Transport—The Value Shift,” Value World, Vol. 33, No. 2, 2010, pp. 4-13.
- P. Leviäkangas, “Building Value in ITS Services by Analysing Information Service Supply Chains and Value Attributes,” International Journal of Intelligent Transport Systems Research, Vol. 9, No. 2, 2011, pp. 47-54.
- BCC Research, “2010 Intelligent Transport Systems Review,” 2010. http://www.bccresearch.com/report/2010-intelligent-transportation-systems-trn001d.html
- S. Dutta and I. Mia, Eds., “The Global Information Technology Report 2009-2010,” World Economic Forum, Cologny, 2010.
- M. E. Porter, “Competitive Advantage: Creating and Sustaining Superior Performance,” Free Press, New York, 1985.
- B. C. Eaton, D. F. Eaton and D. W. Allen, “Microeconomics,” 5th Edition, Prentice Hall, Toronto, 2002.
- R. S. Pindyck and D. L. Rubinfeld, “Microeconomics,” 7th Edition, Prentice Hall, Toronto, 2008.
- Intelligent Transportation Society of America, “Sizing the US and North American Intelligent Transportation Systems Market: Market Data Analysis of ITS Revenues and Employment,” 2011.
- US Department of Justice and the Federal Trade Commission, “Horizontal Merger Guidelines,” Washington DC, 2010.
- L. Yu, et al., “Chinese ICT Industry from Supply Chain Perspective—A Case Study of the Major Chinese ITS Players,” International Journal of Production Economics, Vol. 115, No. 2, 2008, pp. 374-387. doi:10.1016/j.ijpe.2008.03.011
- European Commission, “The New SME Definition— User Guide and Model Declaration,” Commission Recommendation 2003/361/EC, Official Journal of the European Union L, Vol. 124, 2003, p. 36.
- OECD, “Country Statistical Profile: Finland 2011-2012,” 2011.
- Bank of Finland, “Finnish Share Indices,” 2012. http://www.suomenpankki.fi/en/tilastot/arvopaperitilastot/Pages/tilastot_arvopaperimarkkinat_osakkeet_toimialaindeksit_en.aspx
- P. Leviäkangas, “Private Finance of Transport Infrastructure Projects—Value and Risk Analysis of a Finnish Shadow Toll Road Project,” VTT Publications, Espoo, 2007.
- M. Nokkala, K. Finnilä, J. Rönty and P. Leviäkangas, “Financial Performance of Finnish Technical Networks,” VTT Working Papers 163, 2011.
- Ministry of Transport and Communications Finland, “Intelligent Transport Systems and Services: Finnish Strategy,” Libris, Helsinki, 2005.
- T. S. Baines, H. W. Lightfoot, O. Benedettini and J. M. Kay, “The Servitization of Manufacturing: A Review of Literature and Reflection on Future Challenges,” Journal of Manufacturing Technology Management, Vol. 20, No. 5, 2009, pp. 547-567. doi:10.1108/17410380910960984
- T. Baines, H. Lightfoot, J. Peppard, M. Johnson, A. Tiwari, E. Shehab and M. Swink, “Towards an Operations Strategy for Product-Centric Servitization,” International Journal of Operations & Production Management, Vol. 29, No. 5, 2009, pp. 494-519. doi:10.1108/01443570910953603
- A. Neely, “Exploring the Financial Consequences of the Servitization of Manufacturing,” Operations Management Research, Vol. 1, No. 2, 2008, pp. 103-118. doi:10.1007/s12063-009-0015-5
Appendix
List of analysed companies with financial information directly and/or from financial statements: Aplicom Oy, Corenet Oy, EC-Tools Oy, Elektrobit Oyj, Fara Oy, Havainne Oy, Idesco Oy, Indagon Oy, Infotripila Oy, Mattersoft Oy, Max Technologies Oy, Mediamobile Nordic Oy, Mitron Oy, Mobisoft Oy, Navielektro Ky, Peek Traffic Finland Oy, Sabik Ab Oy, Semel Oy, Sunit Oy, Suomen Fartskriver Oy, Swarco Finland Oy, Taipale Telematics Oy, Tietomekka Oy, Traficon Oy, Oy Matkahuolto Ab, Payway Oy, Aspicore Oy, Foreca Oy, Fifth Element Oy, Emtele Oy, Ebsolut Oy, Logica Suomi Oy, Trafix Oy, Tramigo Oy, Procomp Solutions Oy, Proactum Oy, Noptel Oy, Labkotec Oy, ESRI Finland Oy, Sarco Oy, Teconer Oy, YSP Oy, Pocum Oy, Strafica Oy, VTI Technologies Oy, Destia Oy, Seasam House Oy, Siemens Oy, Ramboll Finland Oy, Digia Finland Oy, Enfo Oyj, IBM Ab Oy, Vaisala Oyj, Jaakko Pöyry, Tieto Oyj, Navteq BV Finland.