Int'l J. of Communications, Network and System Sciences
Vol. 5 No. 1 (2012) , Article ID: 16693 , 7 pages DOI:10.4236/ijcns.2012.51006
Comparison of Kurtosis and Fourth Power Detectors with Applications to IR-UWB OOK Systems
Department of Telecommunications, School of Electrical Engineering, Iran University of Science and Technology (IUST), Tehran, Iran
Email: jtaghipour@elec.iust.ac.ir, vakily@iust.ac.ir, abbasi@ee.iust.ac.ir
Received October 22, 2011; revised December 5, 2011; accepted December 17, 2011
Keywords: Ultra-Wideband (UWB); Non-Coherent Receiver; OOK; Energy Detector; Kurtosis Detector; Fourth Power Detector
ABSTRACT
On-off keying (OOK) is one of the modulation schemes for non-coherent impulse radio Ultra-wideband systems. In this paper, the utilization of the kurtosis detector (KD) and fourth power detector (FD) receivers for OOK signaling is introduced. We investigate the effect of integration interval and the optimum threshold on the performance of energy detector (ED), KD and FD receivers. The semi analytic expression of BER is obtained by using generalized extreme value distribution function for KD and FD receivers. From performance point of view, the simulation results show that FD receiver outperforms KD and ED receivers. In contrast, the sensitivity to the optimum threshold is greatly reduced in KD receiver compared to ED and FD receivers.
1. Introduction
Impulse Radio Ultra-wideband (IR-UWB) systems are based on the transmission of pulses with very short duration [1,2]. Coherent and non-coherent receivers are commonly used in IR-UWB systems. The non-coherent receivers have low complexity implementation and are used in low cost applications. In this paper, non-coherent receivers are investigated for IR-UWB on-off keying (OOK) scheme.
Energy detector (ED) is one of the non-coherent receivers for the IR-UWB signal reception [3]. ED receivers usually are used for pulse position modulation (PPM) and OOK signaling in IR-UWB systems. The decision mechanism in PPM is made by sign detector, and in OOK scheme, by comparing the output of energy integrator with a threshold value. Threshold value in OOK signaling is investigated in [4-6]. Comparing the various transmission schemes in [3], it is confirmed that OOK modulation with ED outperforms the PPM scheme. So in this paper, OOK signaling is used for IR-UWB non-coherent system.
Kurtosis detector (KD) [7] and fourth power detector (FD) [8] are recently proposed non-coherent detectors to enhance the performance of energy detector. Simulation results in [7] and [8] show that the KD and FD receivers has a lower bit error rate than ED receiver for a IR-UWB PPM system using IEEE 802.15 CM1 channel model.
In this paper, we propose utilizing the KD and FD receivers for IR-UWB OOK signalling scheme. The approximation of optimum threshold value for symbol decision and the semi analytic BER expression are calculated from GEV distribution function for IR-UWB OOK scheme. We show that, FD receiver outperforms KD and ED receivers, and the KD receiver outperforms in high integration intervals compare to ED receiver. We also show that, KD receiver does not require optimizing integration interval, and the KD receiver has a very low sensitivity to the optimum threshold value variations compare to ED receiver.
The rest of the paper is organized as follows. In Section 2, the system model of IR-UWB OOK is presented. Sections 3 and 4 describe the conventional ED structure and the proposed KD and FD receivers’ structures for OOK scheme, respectively, for the detection of IR-UWB signals. The performance evaluation and the results are discussed in Section 5. Finally, concluding remarks are presented in Section 6.
2. System Model
The transmitted signal in OOK scheme can be expressed as follows
 (1)
(1)
where w(t) is the UWB pulse, Ew is the energy of w(t), Tb is the symbol time and bi{0,1} is the binary information bits.
Signal s(t) propagates through a multipath channel with impulse response
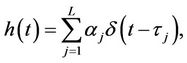 (2)
(2)
where L is the number of multipath components, αk and τk are the gain and delay associated with the kth multipath component according to IEEE802.15.4 channel model [9], and δ(.) is the Dirac delta function. Then the received signal can be expressed as
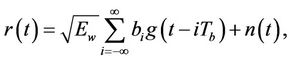 (3)
(3)
where n(t) is the white Gaussian noise with power spectral density N0/2, and g(t) = w(t) * h(t) is the channel response to w(t).
3. Energy Detector
An energy detector employs a square device, an energy integrator and a threshold decision mechanism which are shown in Figure 1. The decision variable in ED is obtained as follows
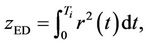 (4)
(4)
where Ti is the integration interval and r(t) is the received signal passing through a band pass filter.
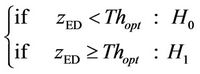
In OOK scheme, the demodulation stage has two hypotheses
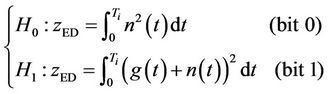 (5)
(5)
where g(t) and n(t) are the received desired signal and noise respectively. The symbol decision in receiver is made by comparing zED with a threshold value Th. If the received signal energy is lower than a threshold value, the detector decides that the transmission bit is 0. If the received signal energy is larger than a threshold value, the detector decides that the transmission bit is 1.
 (6)
(6)
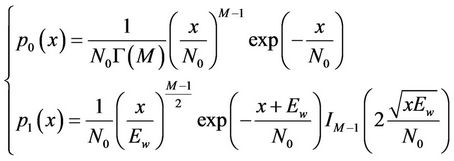
Hypotheses 0 and 1 have the probability density functions (PDF) p0(x) and p1(x), respectively. The optimum threshold value Thopt is obtained by the solution of p0(x) = p1(x). The PDFs of p0(x) and p1(x) are shown to be
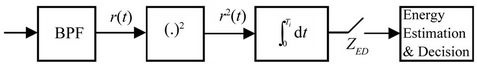
Figure 1. Energy detector (ED).
central and non-central chi square distribution (X2) respectively [4]:
 (7)
(7)
where M = BTi, Г(.) denote Euler function, B is the signal bandwidth and In is the nth Bessel function of the first kind.
4. Proposed Kurtosis Detector and Fourth Power Detector for OOK Scheme
In this section we propose two non-coherent receivers for IR-UWB OOK signalling scheme, by using the fourth order statistics of received signal.
4.1. Kurtosis Detector
The Kurtosis for random variable x is defined as
 (8)
(8)
where E{} denotes the expected value of the variable. If x is a Gaussian random variable, its kurtosis is zero. If x has a subgaussian distribution, it means that the distribution of x has flatness and shorter tails relative to Gaussian distribution, its kurtosis has a negative value. If x has a supergaussian distribution, it means that the distribution of x has peakedness and longer tails relative to the Gaussian distribution, its kurtosis has a positive value. In impulse radio UWB, the received signal has a supergaussian distribution in general; therefore, its kurtosis value is too larger than zero.
Kurtosis detector is based on kurtosis value of the received signal [7]. In [7] the KD receiver is proposed for PPM signaling scheme. The KD receiver structure is shown in Figure 2.
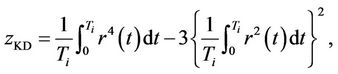
In this paper we used KD receiver for OOK signaling in IR-UWB systems. In this case, the kurtosis value of the received signal is calculated in receiver as follows
 (9)
(9)
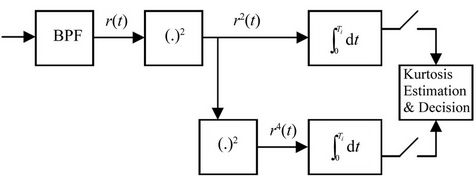
Figure 2. Kurtosis detector (KD) structure proposed in [7].
and then, two hypotheses in KD receiver are defined as follows
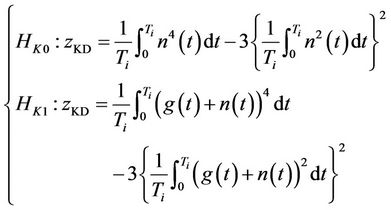 (10)
(10)
In KD receiver case similar to ED receiver, the symbol decision is made by comparing zKD with a threshold value ThK:
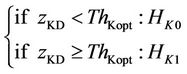 (11)
(11)
where the optimum threshold value ThKopt is obtained by the solution of pK0(x) = pK1(x), and the functions of pK0 (x) and pK1(x) are the probability density functions (PDF) of HK0 and HK1 respectively.
By using Maximum likelihood (ML) parameter estimation in simulations the PDFs of pK0(x) and pK1(x) can be fitted by Generalized Extreme Value (GEV) distribution density function. The GEV distribution function defined as follows
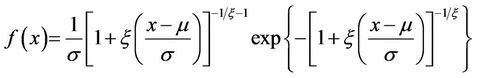 (12)
(12)
where ζ, σ, μ are the parameters of GEV distribution function that obtained from ML parameter estimation.
The semi analytic expression for BER is obtained by using GEV distribution parameters. The parameters of GEV distribution can be obtained from numerical methods in simulations. The approximation of threshold value is obtained by solving the following equation,
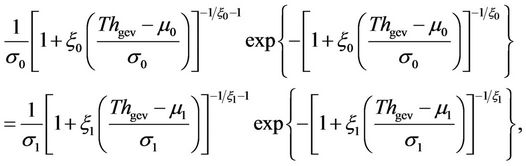 (13)
(13)
where (ζ0, σ0, μ0) and (ζ1, σ1, μ1) are the parameters of GEV distribution for hypothesis 0 and hypothesis 1 respectively. By using the approximation of threshold value (Thgev), the BER expression of bit 0 can be evaluated as
 (14)
(14)
and, the BER expression of bit 1 can be evaluated as
 (15)
(15)
Finally, the BER can be expressed as
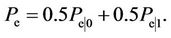 (16)
(16)
4.2. Fourth Power Detector
In [8], improved ED receiver is proposed by replacing the squaring operation in ED receiver with an arbitrary positive power operation. In this paper the fourth power operation is used for OOK IR-UWB signalling scheme, which has been called fourth power detector (FD). We used FD receiver because it is more practical and it has better performance.
The structure of FD receiver, which is shown in Figure 3, is similar to the ED receiver except that the FD receiver employs two square devices. The decision variable in FD is obtained using the following expression
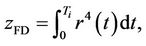 (17)
(17)
and the two hypotheses are defined as follow
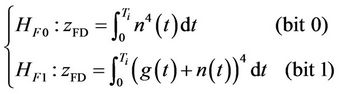 (18)
(18)
Similar to ED and KD receivers, the symbol decision in FD receiver is made by comparing zFD with a threshold value ThF:
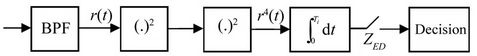
Figure 3. Fourth power detector (FD).
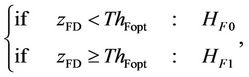 (19)
(19)
where the optimum threshold value ThFopt is obtained by solving pF0(x) = pF1(x). pF0(x) and pF1(x) are the probability density functions of HF0 and HF1, respectively.
In [8], the PDFs of pF0(x) and pF1(x) are approximated by using Gamma distribution function. In this paper, these PDFs are approximated by GEV distribution function which have the same relations as pK0(x) and pK1(x). Results of simulation in section V show that the GEV distribution function has higher accuracy than Gamma distribution function.
The semi analytic expression of BER for FD receiver can be calculated from Equation (16). In this equation, parameters of GEV distribution for HF0 and HF1 are obtained by ML parameter estimation.
5. Simulation Results
Simulations are done in IEEE 802.15.4a CM1 channel model [9] with maximum delay spread (Tmds) truncated to 200 nsec. The second derivative of Gaussian pulse is used with pulse duration Tp = 1.5 nsec, and the symbol duration is Tb = 400 nsec. The energy of the channel impulse response is normalized to have unit power gaini.e. . We also assume perfect synchronization.
Figures 4 and 5 show the accurate cumulative density functions (CDFs) and fitted GEV CDFs for HK0 and HK1. Figures 6 and 7 show the accurate CDFs, fitted GEV, and fitted Gamma CDFs of HF0 and HF1, respectively. The accurate CDFs are obtained by using the histogram method and GEV and Gamma approximate CDFs are obtained by using ML estimation of distribution parameters.
According to the above-mentioned figures, GEV CDFs fitted to HK0, HK1, HF0 and HF1 CDFs have high accuracy for different amounts of Eb/N0 and integration intervals. In FD receiver the fitted GEV and Gamma distributions of HF0 have almost the same accuracy, while in the case of HF1, the fitted GEV CDF has a better accuracy than the fitted Gamma CDF.
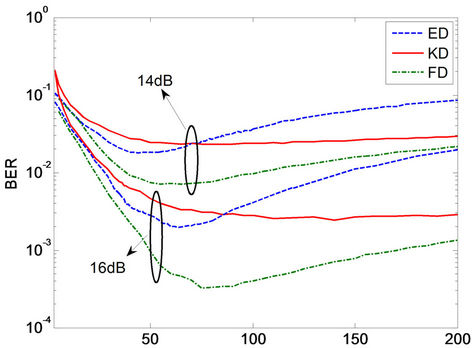
Figure 8 shows the bit error rate (BER) performance of ED, KD and FD receivers as a function of integration interval (Ti) for sample amounts of Eb/N0 = 14 dB and Eb/N0 = 16 dB. In ED and FD receivers, there is an optimum integration interval that minimizes the BER. Increasing the amount of Eb/N0 causes this optimum value
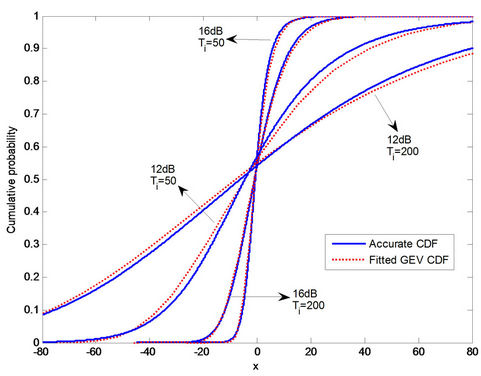
Figure 4. CDFs of hypothesis 0 in KD receiver (HK0) for Ti = 50 nsec, 200 nsec and Eb/N0 = 12 dB, 16 dB.
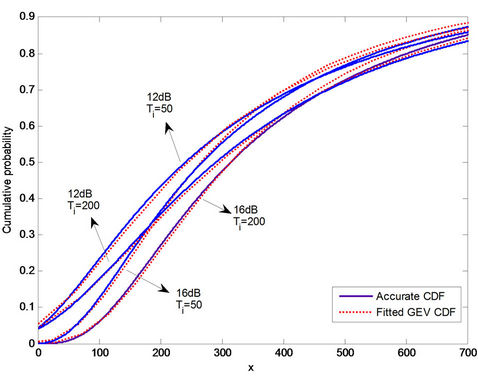
Figure 5. CDFs of hypothesis 1 in KD receiver (HK1) for Ti = 50nsec, 200 nsec and Eb/N0 = 12 dB, 16 dB.
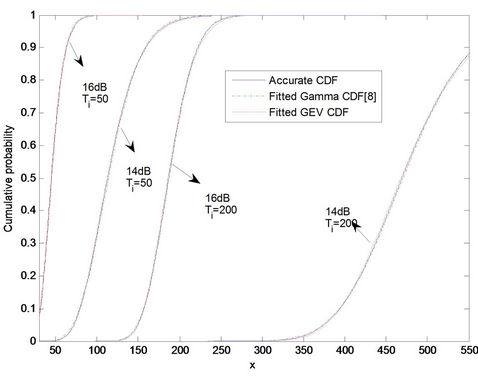
Figure 6. CDFs of hypothesis 0 in FD receiver (HF0) for Ti = 50 nsec, 200 nsec and Eb/N0 = 14 dB, 16 dB.
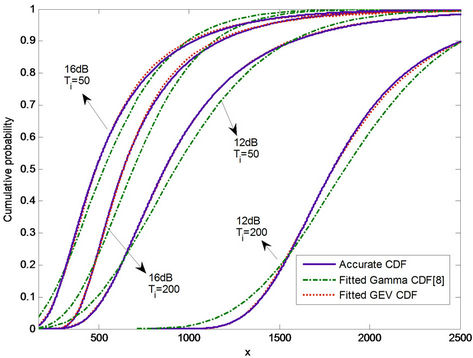
Figure 7. CDFs of hypothesis 1 in FD receiver (HF1) for Ti = 50 nsec, 200 nsec and Eb/N0 = 12 dB, 16 dB.
 Ti
Ti
Figure 8. BER vs integration interval (Tmds = 200 nsec).
to increase. In KD receiver, short integration intervals have a negative effect on the performance, and BER is almost constant for large values of integration intervals. For large integration intervals, the KD receiver does not require optimization of integration interval. The FD receiver outperforms ED and KD receivers for almost all amounts of integration intervals.
Figure 9 shows the BER performance of ED, FD and KD receivers for integration interval Ti = Tmds = 200 nsec. This figure also demonstrates the BER of ED and FD for optimum integration intervals. For Ti = 200 nsec and BER = 10–3, the KD receiver has a 1.4 dB better performance than the ED receiver and the FD receiver has a 2 dB better performance than the ED receiver. The ED receiver with optimized integration interval has a 0.2 dB better performance than the KD receiver for high values of Eb/N0. The FD receiver with the optimum integration intervals has a better performance than ED and KD receivers in all values of Eb/N0. For BER = 10–4, the FD
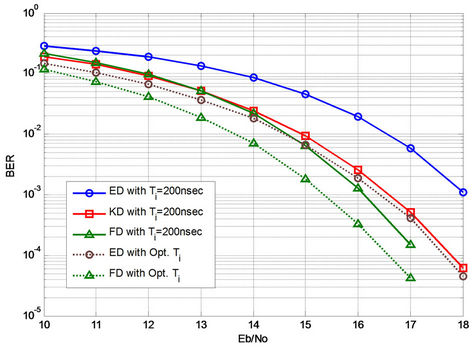
Figure 9. BER comparison of ED, FD and KD receivers.
receiver with optimized integration interval has a 1dB better performance than the ED receiver with optimized integration interval and 1.2 dB better performance than the KD receiver.
Since the integration interval depends on maximum delay spread of channel and SNR value, using the optimum integration intervals in the practical systems is difficult. Considering that for large integration intervals KD receiver does not require optimization of integration interval, therefore the KD receiver with large integration interval can be used for practical systems.
Figure 10 shows the BER performance of KD and FD receivers for integration interval of 50 nsec. In KD receiver, the BER using GEV approximation of threshold has a high accuracy for almost all amounts of Eb/N0, and for high values of Eb/N0, the BER using GEV approximation of threshold has a performance about 0.2 dB worse than the BER with optimum threshold. The semi analytic BER of KD receiver has great accuracy for medium and low Eb/N0, and for high values of Eb/N0 is 0.6 dB different from the BER simulation result. In FD receiver the BER using GEV approximation of threshold is highly accurate for all amounts of Eb/N0, and the semi analytic BER of FD receiver has a high accuracy for medium and low Eb/N0, and for high values of Eb/N0 is 0.5 dB different from BER simulation result.
The BER using optimum threshold and GEV approximation of threshold and the semi analytic BER of KD and FD receivers for integration interval of 200 nsec are shown in Figure 11. Similar to Ti = 50 nsec, for Ti = 200 nsec the BER using GEV approximation of threshold has high accuracy for all amounts of Eb/N0 for KD and FD receivers. For BER = 10–3, the semi analytic BER is 0.5 dB different from BER simulation result for KD and 0.3 dB different from BER simulation results for FD.
The results of Figures 10 and 11 show that the semi analytic BER and simulation BER have different values in high amounts of Eb/N0. This is because the GEV
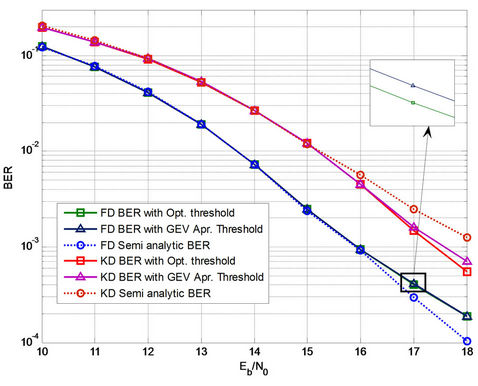
Figure 10. BER performances of KD and FD receivers with GEV approximation of threshold and semi analytic method in Ti = 50 nsec.
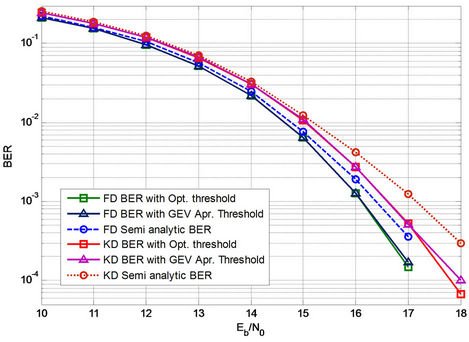
Figure 11. BER performances of KD and FD receivers with GEV approximation of threshold and semi analytic method in Ti = 200 nsec.
function has not high accuracy for tails of hypotheses PDFs and the BER in high values of Eb/N0 depends on tails of hypotheses PDFs.
In Figures 12 and 13, absolute variations of BER normalized to BER in optimum threshold versus the percent of optimum threshold variations are illustrated for sample amounts of Eb/N0 = 14 dB and Eb/N0 = 16 dB. Sensitivity of KD receiver to the optimum threshold variations is considerably lower than ED and KD receivers. This is because in KD the PDFs of HK0 and HK1 have low slopes in optimum threshold point (Figure 14). Therefore by changing optimum threshold value, the BER is not greatly increased. But in ED and FD receivers, the PDFs of hypotheses 0 and 1 have high slopes in the optimum threshold point (Figures 15 and 16); therefore small changes in the optimum threshold value cause a great increase in the BER.
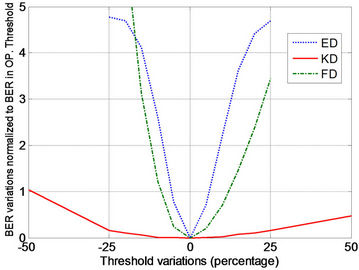
Figure 12. Absolute variations of BER normalized to BER in optimum threshold vs. optimum threshold variations (percentage) for Eb/N0 = 14 dB and Ti = 200 nsec.
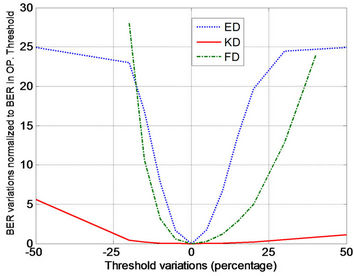
Figure 13. Absolute variations of BER normalized to BER in optimum threshold vs. optimum threshold variations (percentage) for Eb/N0 = 16 dB and Ti = 200 nsec.
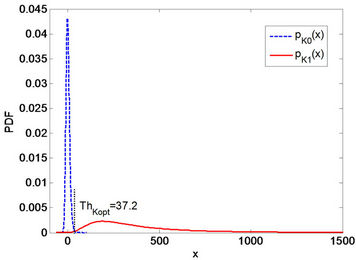
Figure 14. PDFs of two hypotheses in KD (Eb/N0 = 16 dB).
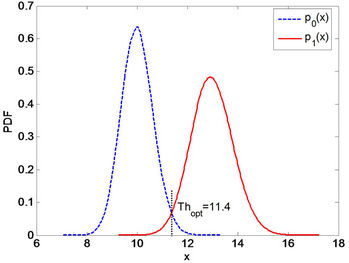
Figure 15. PDFs of two hypotheses in ED (Eb/N0 = 16 dB).
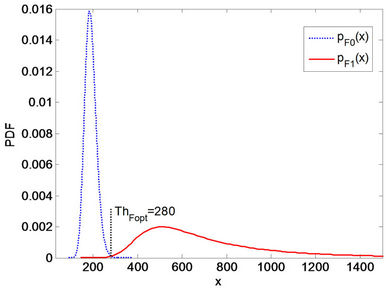
Figure 16. PDFs of two hypotheses in FD (Eb/N0 = 16 dB).
Since practical UWB systems are time varying and SNR values in these systems are variable, the optimum threshold value has variations. That’s why the KD receiver can be used in practical UWB systems due to its better robustness to optimum threshold variations than ED and FD receivers.
In this paper, we assume that the maximum delay spread of channel is truncated to 200nsec. For avoiding inter symbol interference, the symbol interval must be larger than 200 nsec. For all amounts of symbol interval that is greater than 200 nsec, the results of this paper do not change. Simulation results in [7] show that KD receiver has a better performance for low values of maximum delay spread.
6. Conclusion
In this paper, the KD and FD receivers were proposed for OOK modulation scheme. The FD receiver has a better performance than ED and KD receivers in almost all values of integration intervals. For high integration intervals the KD receiver outperforms ED receiver about 2 dB for low values of Eb/N0 and 1.4 dB for high values of Eb/N0. For high values of Eb/N0 the ED receiver using optimized integration interval outperforms KD receiver around 0.2 dB. The GEV distribution function is a good approximation for PDFs of hypotheses 0 and 1 in IR-UWB OOK scheme with KD and FD receivers. The approximation of optimum threshold value and the semi analytic BER expression can be calculated from GEV distribution function. The KD receiver does not require optimization of integration interval, and the sensitivity to the optimum threshold value in KD receiver is very low compared to ED and FD receivers. Therefore, KD receiver can be the better option for practical purposes.
7. Acknowledgements
The authors would like to thank the Iranian Institute of information and Communication Technology (the former ITRC) for the support of this work.
REFERENCES
- M. Z. Win and R. A. Scholtz, “Impulse Radio: How It Works,” IEEE Communication Letter, Vol. 2, No. 2, 1998, pp. 36-38. doi:10.1109/4234.660796
- L. Yang and G. Giannakis, “Ultra-Wideband Communications: An Idea Whose Time Has Come,” IEEE Signal Processing Magazine, Vol. 21, No. 6, 2004, pp. 26-54. doi:10.1109/MSP.2004.1359140
- K. Witrisal, G. Leus, G. Janssen, M. Pausini, F. Troesch, T. Zasowski and J. Romme, “Noncoherent Ultra-Wideband Systems,” IEEE Signal Processing Magazine, Vol. 26, No. 4, 2009, pp. 48-66. doi:10.1109/MSP.2009.932617
- P. A. Humblet and M. Azizoglu, “On the Bit-Error Rate of Lightwave Systems with Optical Amplifiers,” Journal of Lightwave Technology, Vol. 9, 1991, pp. 1576-1582.
- M. E. Sahin, I. Guvenc and H. Arslan, “Optimization of Energy Detector Receivers for UWB Systems,” Proceedings of IEEE Vehicular Technology Conference, Dallas, Vol. 2, 30 May-1 June 2005, pp. 1386-1390.
- X. T. Cheng, Y. L. Guan and Y. Gong, “Thresholdless Energy Detection for Ultra-Wideband Block-Coded OOK Signals” Electronics Letters, Vol. 44, No. 12, 2008, p. 755. doi:10.1049/el:20083565
- M. Khan, B. Sallberg, G. Nordberg and I. Claesson, “Noncoherent Detection of Impulse Radio UWB Signal Based on Fourth Order Statistics,” Proceedings of IEEE International Conference on Ultra-Wideband, Vancouver, 9- 11 September 2009, pp. 824-828.
- Y. F. Chen, “Improved Energy Detector for Random Signals in Gaussian Noise,” IEEE Transaction on Wireless Communication, Vol. 9, No. 2, 2010, pp. 558-563. doi:10.1109/TWC.2010.5403535
- A. F. Molisch, K. Balakrishnan, D. Cassioli, C.-C. Chong, S. Emami, A. Fort, J. Karedal, J. Kunisch, H. Schantz, U. Schuster and K. Siwiak, “Channel Model—Final Report,” IEEE 802.15.4a, 2004.