Journal of Intelligent Learning Systems and Applications
Vol.4 No.2(2012), Article ID:19261,9 pages DOI:10.4236/jilsa.2012.42013
Automated Colorization of Grayscale Images Using Texture Descriptors and a Modified Fuzzy C-Means Clustering
![]()
Department of Computer and Information Science, Gannon University, Erie, USA.
Email: gauge@ieee.org, sasi001@gannon.edu
Received May 31st, 2011; revised January 31st, 2012; accepted February 7th, 2012
Keywords: Image Processing; Pattern Recognition; Computer Vision; Fuzzy C-Means; Clustering; Gabor
ABSTRACT
A novel example-based process for Automated Colorization of grayscale images using Texture Descriptors (ACTD) without any human intervention is proposed. By analyzing a set of sample color images, coherent regions of homogeneous textures are extracted. A multi-channel filtering technique is used for texture-based image segmentation, combined with a modified Fuzzy C-means (FCM) clustering algorithm. This modified FCM clustering algorithm includes both the local spatial information from neighboring pixels, and the spatial Euclidian distance to the cluster’s center of gravity. For each area of interest, state-of-the-art texture descriptors are then computed and stored, along with corresponding color information. These texture descriptors and the color information are used for colorization of a grayscale image with similar textures. Given a grayscale image to be colorized, the segmentation and feature extraction processes are repeated. The texture descriptors are used to perform Content-Based Image Retrieval (CBIR). The colorization process is performed by Chroma replacement. This research finds numerous applications, ranging from classic film restoration and enhancement, to adding valuable information into medical and satellite imaging. Also, this can be used to enhance the detection of objects from x-ray images at the airports.
1. Introduction
Image colorization has been performed through various means since the early 20th century, as a very laborious, time-consuming, subjective and painstaking manual process. Its main purpose is to increase the visual appeal of old black and white photographs, motion pictures and illustrations.
Current methods of image colorization can be classified into two different groups depending on the approach being used. They are Scribble-based and Example-based approaches. Scribble-based colorization techniques require a user to scribble color information onto appropriate regions of the grayscale image [1]. The color information is then spread through the image via various algorithms. Scribbles however, need to be added manually, which, depending on the complexity of the image, represent a time-consuming task. Example-based colorization techniques automate this process by providing an example image from which to extract the color information [2-4]. This method can save a lot of time and requires little or no user interaction. However, the quality and accuracy of the results can vary considerably depending on the example image chosen. Most techniques still require user input in the form of swatches, and use simple (pixelbased) texture matching methods [2]. Other techniques require the sample images to be of the exact same location as the image to be colorized [3]. This may not always be practical, and may be pointless if a colored image of the same location is already available. The method suggested by Irony et al. [4] used a very robust monochrome texture matching method with spatial filtering. They suggested that better results could be obtained by using improved spatial coherence descriptors, such as the Gabor transform. Several other research papers also suggested that better segmentation could be achieved by using Gabor filters.
2. Previous Work
2.1. Texture-Based Image Segmentation
Accurately identifying the areas of homogeneous textures in an image is a key element of the colorization process. In order to effectively segment the image based on texture, Malik and Perona [5] suggested that a multichannel filtering approach could be used. Jain and Farrokhnia [6] accomplished this by using a bank of twodimensional Gabor filters.
2.2. Gabor Transform
A two-dimensional Gabor function consists of a sinusoiddal plane wave of some frequency and orientation, modulated by a two-dimensional Gaussian. The convolution of an image with a bank of Gabor filters creates a set of filtered images containing features that responded to the particulate filter. Jain and Farrokhnia [6] suggested that feature extraction can be obtained by using a nonlinear sigmoid function, and by calculating the average absolute deviation for each filtered image.
2.3. Clustering and Feature Extraction
Naotoshi [7] used Gaussian smoothing in order to remove the smaller areas, combined with a simple K-means clustering algorithm in order to extract regions from filtered images. The segmentation results were satisfactory but lacked accuracy. Texture-based segmentation was recently improved by Dong et al. [8] by using a Fuzzy C-Means (FCM) method to generate the index map and palette, and by using the Probabilistic Index Map (PIM) model to improve segmentation accuracy. Once a proper level of clustering has been obtained, smaller regions (with a number of pixels below a predefined threshold) contained inside of a larger region can be removed. Isolated small regions of unique texture are discarded, and the remaining regions are labeled.
Once each region is labeled, a sample area for each texture is extracted. This is done by finding the largest square that can be fitted into each identified contiguous region on unique texture. For each texture, the color descriptor (the dominant color as per the color histogram) and texture descriptors can be extracted and stored.
2.4. Content-Based Image Retrieval (CBIR)
Content-Based Image Retrieval (CBIR) is the ability to retrieve images by analyzing their content. This research area has gained a lot of attention in recent years. Gabor transforms are also the central part of the Homogenous Texture Descriptor (HTD), which offers a simple yet powerful method for storing texture information for retrieval. HTD is part of the “Multimedia Content Descriptor Interface” of the MPEG-7 standard, which has been successfully used in the fields of Image Classification and Content-based image retrieval [9].
The LIRe [10] and the img (Rummager) [11] image retrieval systems have implemented some additional MPEG-7 descriptors such as the Edge Histogram, along with a recently developed set of Compact Composite Descriptors (CCD) that can be used to retrieve images in various situations.
In this research, a new process for automated colorizetion is proposed by combining these techniques in a new and innovative way.
3. Automated Colorization Using Texture Descriptors (ACTD)
The first part of this process is to analyze several sample color images. The sample images need to be processed so that the different textures present in each image can be identified and extracted. In order to effectively segment the image based on texture, the multi-channel filtering approach suggested by Malik and Perona [5] is used. Gabor wavelet transforms have proven to be a very effective method for achieving accurate texture-based image segmentation. A clustering algorithm is then used in order to effectively and accurately segment the regions of homogeneous texture previously identified and extract a representative sample for each texture. The texture descriptors and color information are computed for each texture, and stored in a database.
The second part of the process takes a new grayscale image that needs to be colorized based on the texture and color information present in the database. The segmentation and feature extraction process takes place as previously described. For each texture identified, the texture descriptors are computed, and used to locate the best matching texture present in the sample database. Once the best matching texture is identified, the corresponding color information is extracted, and applied to the segmented region of the grayscale image. Figure 1 shows an overview of the ACTD process used in this research.
3.1. Texture-Based Image Segmentation
In order to obtain a good texture-based segmentation of an image, the multi-channel filtering approach suggested by Malik and Perona [5] is used. This is accomplished by using a bank of two-dimensional Gabor filters. The feature extraction process used for this research is described in Figure 2.
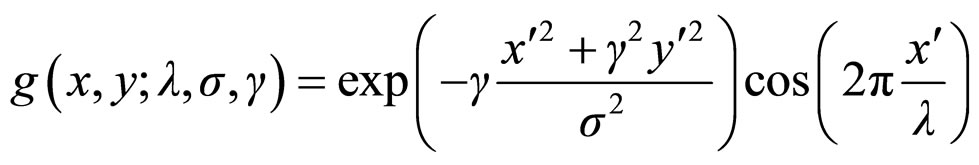
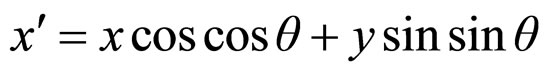
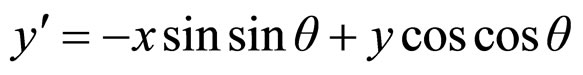
A two-dimensional Gabor function consists of a sinusoidal plane wave of a given frequency and orientation, modulated by a two-dimensional Gaussian envelope.
The Gabor filters are obtained by using the following method:
 (1)
(1)
 (2)
(2)
 (3)
(3)
Where:
σ is the width of the Gaussian envelope;
γ is the spatial aspect ratio;
λ is the wavelength of the filter;
θ is the orientation of the filter.
The pseudo-code is as follows:
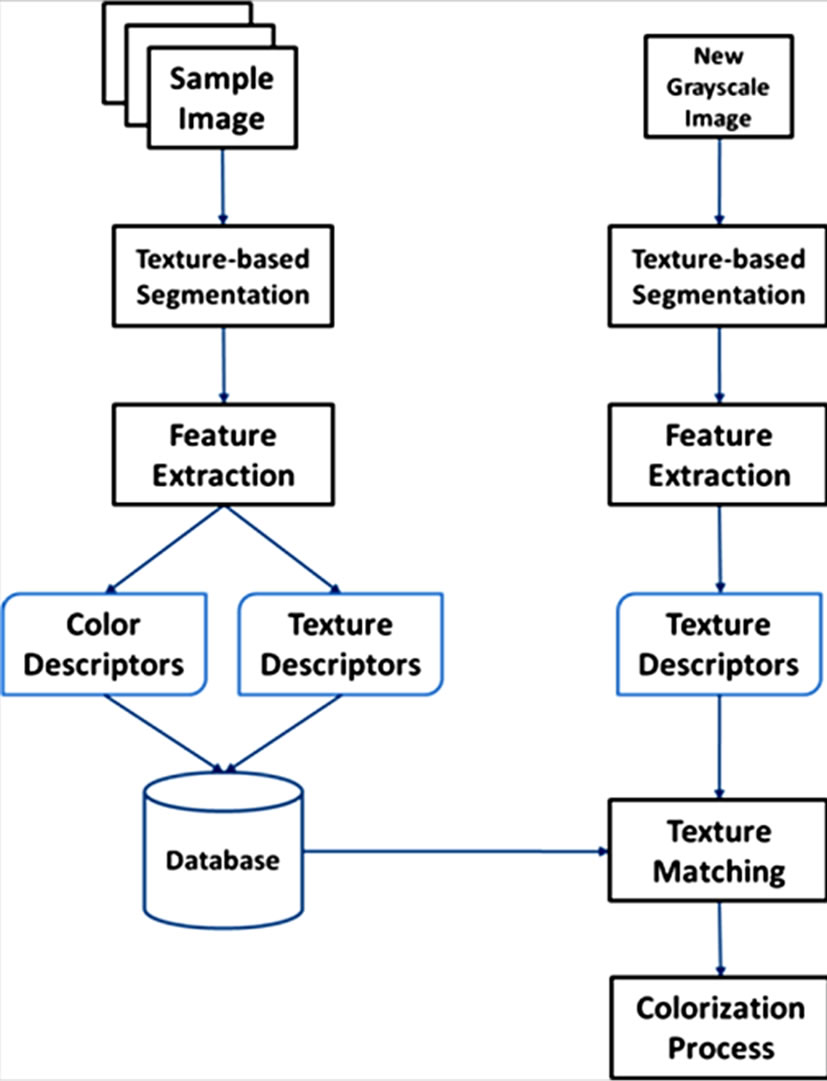
Figure 1. Architecture for ACTD.
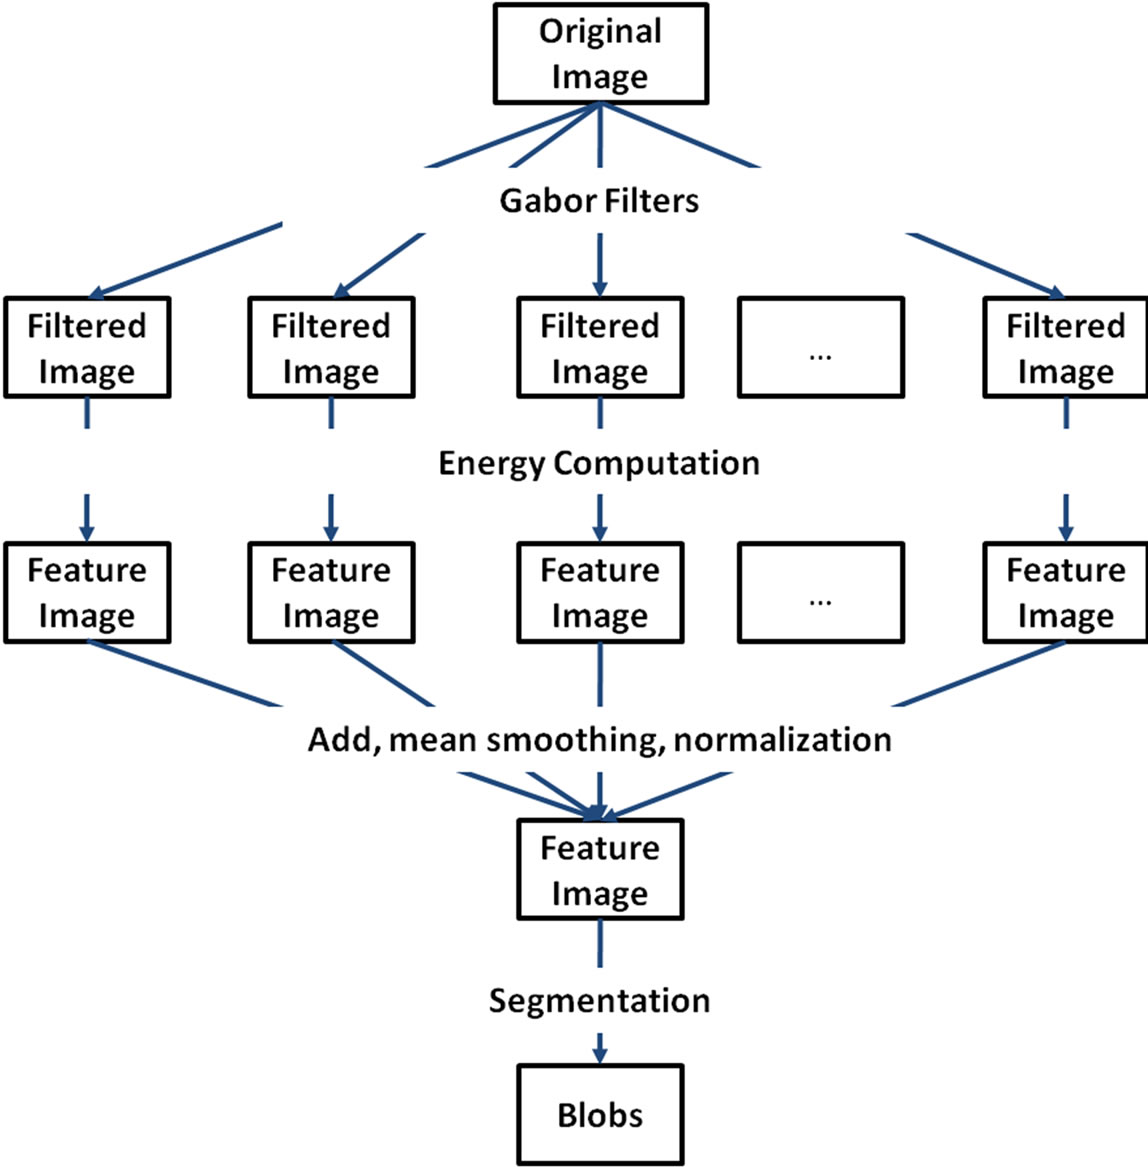
Figure 2. Feature extraction using Gabor filters.
Step 1 For orientation θ = 0 to θ = 3π/4 step π/4.
Step 2 For λ = 0.3 to 0.5 step 0.1.
Step 3 Calculate Gabor (4, 4, 1/λ, 0.56 * θ, 0.5).
Figure 3 shows the twelve Gabor filters generated by this algorithm for these three wavelengths and four orientations.
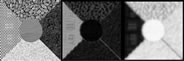
Figure 4(a) shows the composite test image used for this experiment. It is comprised of five different textures from the Brodatz texture database. Figures 4(b) and 4(c) sow the segmentation results obtained. Figure 5 shows the results of the convolution of the test image with each of the twelve Gabor filters.
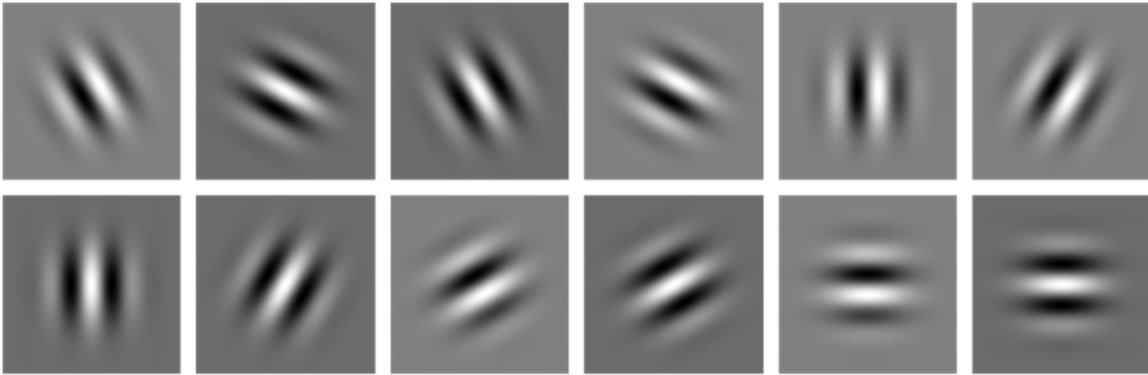
Figure 3. Gabor filters.
 (a) (b) (c)
Figure 4. (a) Composite texture test image; (b) Normalized sum of the Gabor responses; (c) Inversed, normalized sum of Gabor responses with mean smoothing.

Figure 5. Normalized Gabor responses of the composite texture test image.
Each resulting response highlights the texture elements from the source image that responded strongly to the filter’s particular wavelength and orientation.
In their research, Jain and Farrokhnia [6] achieved good feature extraction results by using a nonlinear sigmoid function and by calculating the average absolute deviation (AAD) for each filtered image. Gaussian smoothing was used in order to remove the smaller areas. In this research, smoothing is performed by calculating the mean values of the gray-level intensities between neighboring pixels. The Gabor response values for each pixel is added, and normalized.
This technique is very effective for identifying and segmenting areas of homogeneous textures in an image. This information can then be used for clustering.
3.2. Clustering
Jain and Farrokhnia used the K-means clustering algorithm to create and label the texture regions. Because the Gabor responses contain a lot of noise, Gaussian smoothing was also used in order to remove the smaller areas. However, the use of such smoothing methods results in a loss of the edge information that is needed for accurately segmenting the desired texture area.
3.3. K-Means Clustering
The first segmentation algorithm tested was a simple Kmeans clustering based on the color values of each pixel in the Red-Green-Blue (RGB) color space. One of the downsides of this algorithm is that the number of clusters must be set as an arbitrary value. The following results were obtained with five clusters; the cluster color was obtained by obtaining the mean RGB values of all the pixels in each cluster during each iteration. Figure 6 shows the results obtained on two sample images 6(a) and 6(c).
While these results demonstrate the effectiveness of this algorithm in clustering pixels of similar colors, they were not satisfactory for the purposes of performing texture-based segmentation. For instance, the results in Figure 6(d) shows that the sky and the trees were not part of the same homogeneous cluster, but were each divided into two separate clusters (dark blue and light blue; and dark green and light green). A more robust clustering algorithm can be obtained using the Fuzzy C-means clustering (FCM) algorithm. It uses the same general concepts as the K-means algorithm, but permits greater flexibility by allowing pixels to become members of more than one cluster.
3.4. Fuzzy C-Means Clustering
The concept of partial membership, in which an image pixel can belong to multiple clusters, is known as a “soft” clustering method. It allows for a more precise computation of the cluster membership, which in turn increases the accuracy of the results. It also increases the overall robustness of the algorithm to noise.
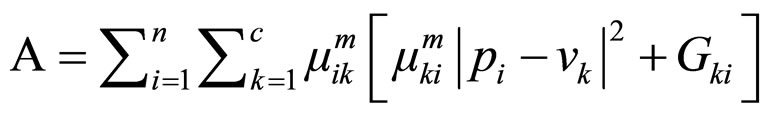
The FCM clustering is obtained by minimizing an objective function shown in equation (4):
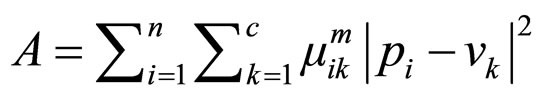 (4)
(4)
Where:
• A is the objective function.
• n is the number of pixels in the image E.
• c is the number of clusters.
• µ is the fuzzy membership value from table.
• m is a fuzziness factor (a value > 1).
• pi is the ith pixel in E.
• vk is the centroid of the kth cluster.
• |pi – vk| is the Euclidean distance between pi and vk defined by equation (5):
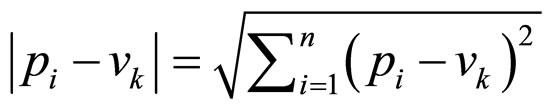 (5)
(5)
The calculation of the centroid of the kth cluster is achieved using equation (6):
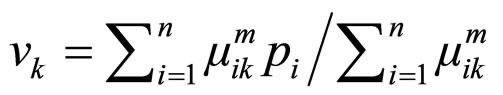 (6)
(6)
The fuzzy membership table is calculated using the original equation (7):
 (a)
(a) (b)
(b)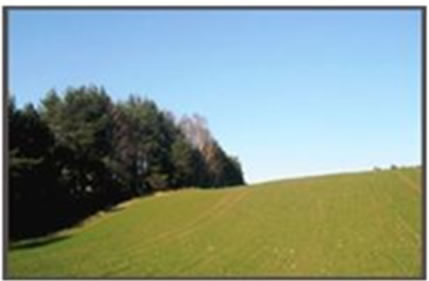 (c)
(c)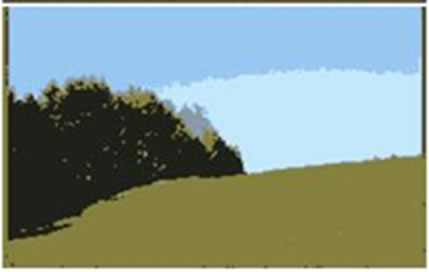 (d)
(d)
Figure 6. (a) sample image 1; (b) K-means clustering of sample image 1(a) with 5 clusters; (c) sample image 2; (d) K-means clustering of sample 2(c) image with 5 clusters.
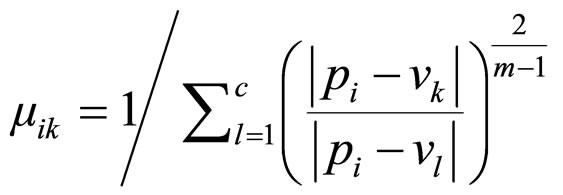 (7)
(7)
Step 1 Set the number c of clusters, the fuzzy parameter m, and the stopping condition ε.
Step 2 Initialize the fuzzy membership values µ.
Step 3 Set the loop counter b = 0.
Step 4 Calculate the cluster centroid values using (6).
Step 5 For each pixel, compute the membership values using (7) for each cluster.
Step 6 Compute the objective function A. If the value of A between consecutive iterations <ε then stop, otherwise set b = b + 1 and go to step 4.
The Fuzzy C-means clustering shows very good segmentation results, but is still sensitive to noise and is still unable to segment areas of homogeneous textures.
3.5. Modified Fuzzy C-Means Clustering with “Gki Factor”
In order to improve the tolerance to noise of the Fuzzy C-means clustering algorithm, Krinidis and Chatzis [12] have proposed a new method by introducing the novel Gki factor. The purpose of this algorithm is to adjust the fuzzy membership of each pixel by adding local information from the membership of neighboring pixels. It is obtained by using a sliding window of predefined dimensions used to compute the Gki factor.
The Gki factor is calculated by using equation (8):
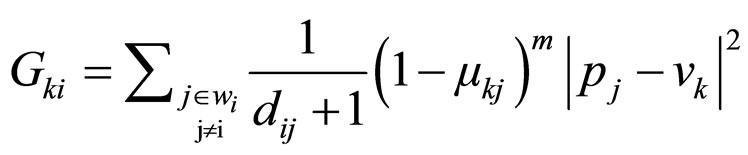 (8)
(8)
Where:
• the ith pixel is the center of the local window;
• the jth pixel belongs to the window around the ith pixel (wi);
• dij is the spatial Euclidian distance between pixels i and j;
• µkj is the degree of membership of the jth pixel in the kth cluster;
• vk is the centroid of cluster k;
• m is a fuzziness factor (a value > 1);
• pj is the jth pixel in wi;
• |pi - vk| is the Euclidean distance between pi and vk.
These ith pixel in a sliding window of size w = 1 is shown in Figure 1. The “size = 1” implies that one neighboring pixel in all directions from pixel i will be considered in order to determine the Gki factor for I, as illustrated in Figure 7.
The algorithm is formulated by minimizing the objective function shown in equation (9):
 (9)
(9)
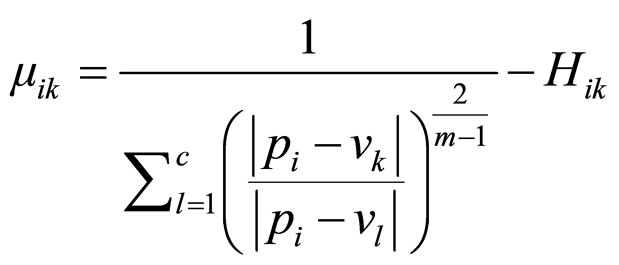
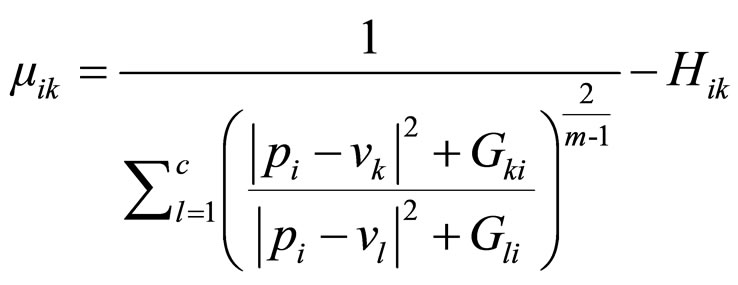
The fuzzy membership of each pixel to a cluster is calculated using equation (10):
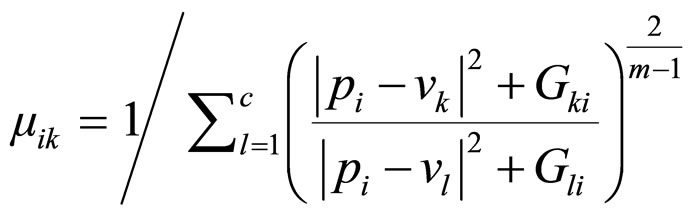 (10)
(10)
The Gki factor increases the robustness of the clustering by ignoring several types of noise. Since the neighboring pixel’s membership values are also considered for clustering, this algorithm provides a better segmentation. However, if larger window sizes are used for the computation of the Gki factor, then there will be signifycant increase in the number of calculations needed for each iteration. The number of computations required is also dependent upon the size of the window w and the number of clusters c, and is given by . For example, in order to compute Gki factor for a window size w = 1 and a number of clusters c = 3, 9 calculations have to be performed for updating the membership tables at any position. A window size w = 2 and a number of clusters c = 3 will result in 25 additional calculations for every pixel in the image.
This algorithm is further improved by including both the local spatial information from neighboring pixels and the spatial Euclidian distance of each pixel to the cluster’s center of gravity. In this research, the algorithm is also extended for clustering of color images in the RGB color space. Hence, the computation given in equation (2) to compute the Euclidean distance between the values pi and vk is modified to incorporate RGB colors, and is shown in equation (11):
 (11)
(11)
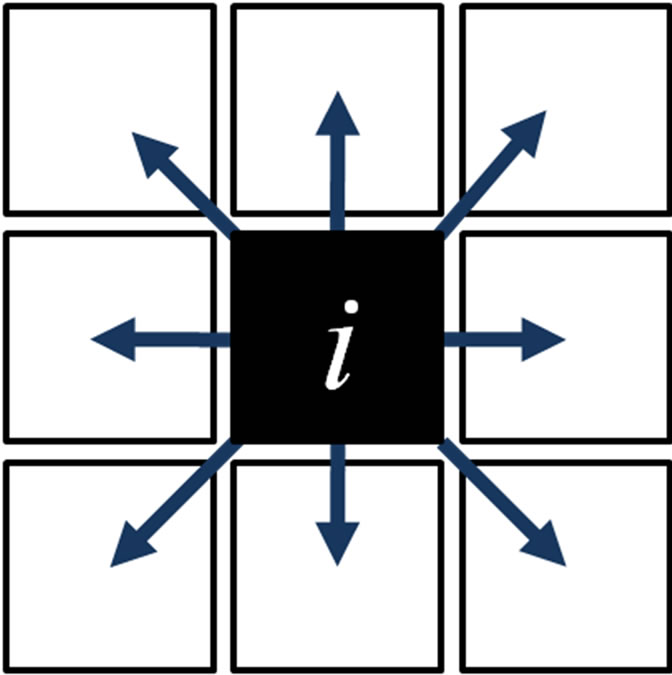
Figure 7. Sliding window of size 1 around the ith pixel.
3.6. Modified Fuzzy C-Means Clustering with Novel Hik Factor
In order to further improve the effectiveness of the Fuzzy C-means clustering algorithm, a new Hik factor is included in the equation for computing the membership value of each pixel in all clusters. The Hik factor is used to further adjust the fuzzy membership of each pixel. It is based on the spatial Euclidian distance to the center of gravity of each cluster, and is defined in equation (12):
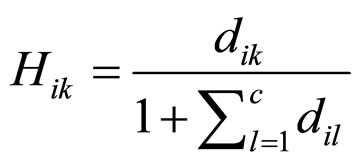 (12)
(12)
Where:
• dik is the spatial Euclidian distance between pixels i and the spatial center of gravity of cluster k.
The spatial coordinates kx and ky of the center of gravity of cluster k are calculated by finding the mean of the x and y coordinate values of all pixels in cluster k after defuzzification. Equation (9) is then modified with this Hik for computing the fuzzy membership of each pixel to a cluster. The resulting equation is given in (13):
 (13)
(13)
An illustration of the spatial Euclidean distance of pixel i is provided in Figure 8.
Let c1, c2 and c3 be 3 clusters identified in an image, and let pi be a pixel. di1, di2 and di3 denote the corresponding statial Euclideal distances of pi to clusters c1, c2 and c3 respectively, as calculated using equation (2).
By substracting the Hik factor from the Gki the algorithm converges faster. Also, since the segmentation is based on both the proximity of a pixel to a cluster and the RGB information, the clustering accuracy is improved. The architecture of this method is given in Figure 9.
The Hik factor is then combined with the Gki factor as given in equation (14):
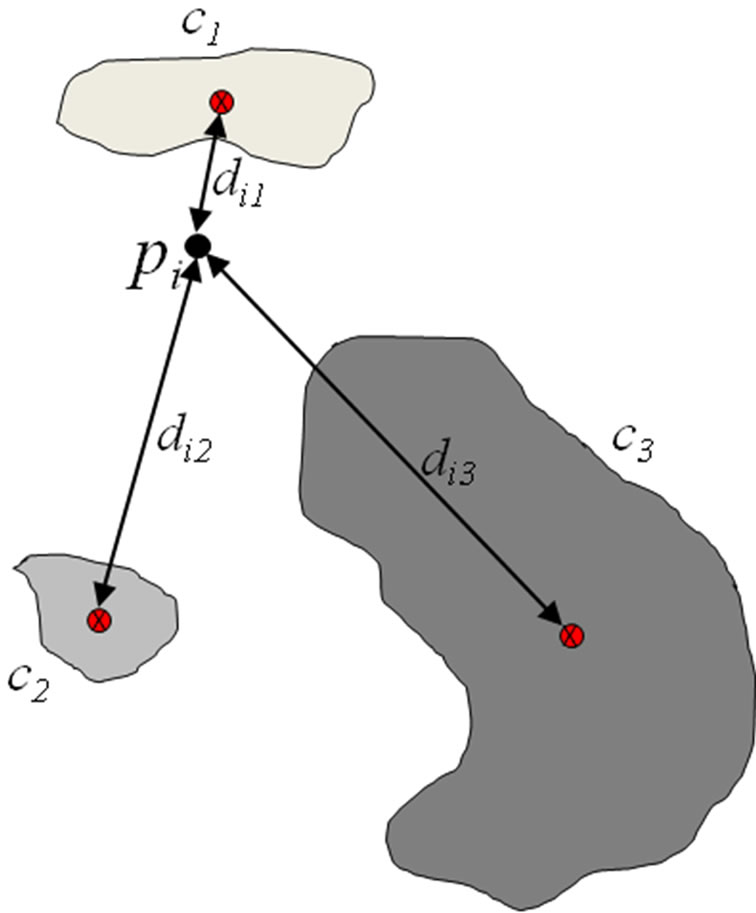
Figure 8. Illustration of the new Hik factor displaying the spatial Euclidian distance to the center of gravity of each cluster.
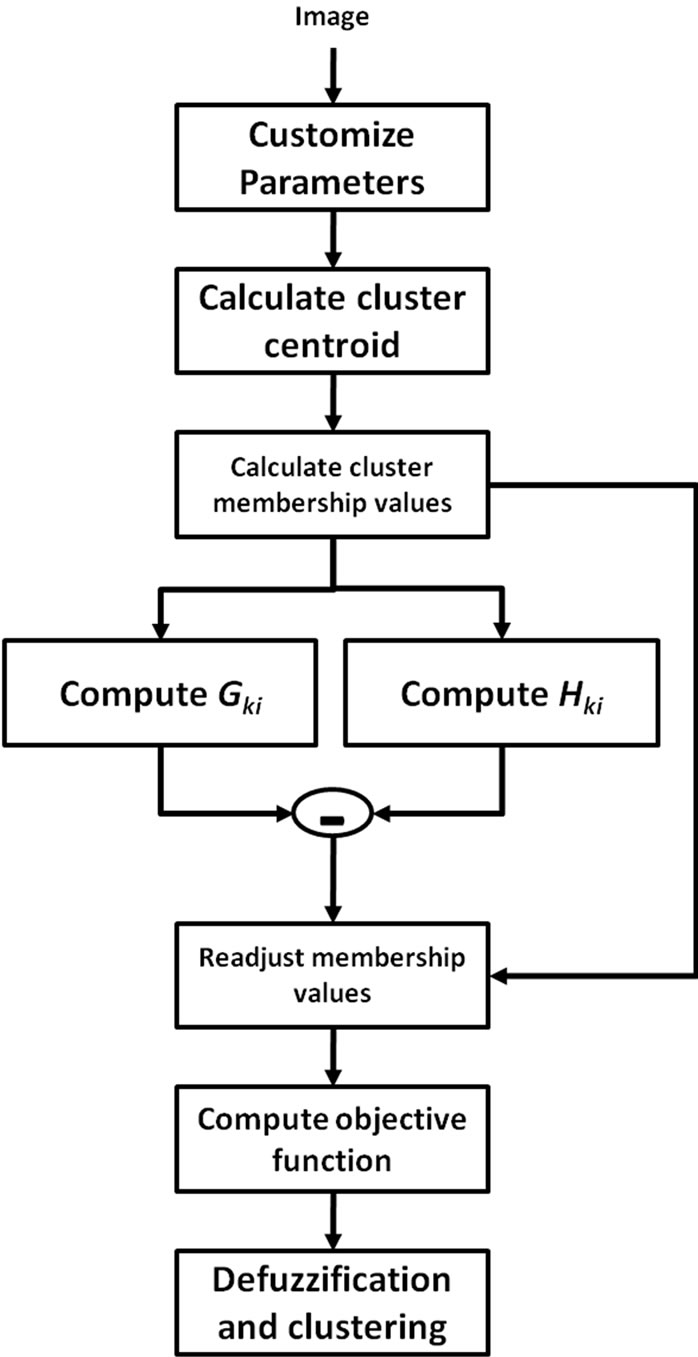
Figure 9. Architecture of the FCM clustering with the Hik factor.
 (14)
(14)
3.7. Feature Extraction
The contiguous region of unique texture enhanced by the Gabor filters and identified by the segmentation algorithm are then isolated and extracted. Blob filtering is used in order to remove the smaller clustered areas. The center of gravity of each blob is used to extract a sample image representative of that particular texture. The texture image is stored both in color for a reference to the color component (Chroma) of the texture and in grayscale for texture matching. This forms the library of textures and corresponding color information that can be used for the ECTD process.
3.8. Grayscale Image Processing
The segmentation and feature extraction processes are then repeated for the new grayscale image to be colorized. These processes are used exactly in the same manner, since no color information was used in order to perform the segmentation of the sample images.
3.9. Texture Matching
Compact Composite Descriptors (CCD) is a recently proposed set of descriptors combining several features descriptors. These Descriptors are part of the new Visual Multimedia Content Description Scheme (VICODEs), which is proposing a set of specialized descriptors tuned for different types of images. Testing of these descriptors was performed using the img (Rummager) [11] application, as well as with the DLLs provided by the authors. The following descriptors were used for this research:
• The MPEG-7 Edge Histogram Descriptor (EHD) represents the spatial distribution of five types of edges: four directional edges and one non-directional edge. Since edges play an important role for image perception, they can be used for image-to-image matching (by example or by sketch) to retrieve images with similar semantic meaning.
• The VICODEs (CCD) Fuzzy Spatial Based Scalable Composite Descriptor (BTDH) [13] was developed to be used for Medical Radiology Images. This descriptor uses brightness and texture characteristics as well as the spatial distribution of these characteristics in one compact 1D vector. To extract the brightness information, a fuzzy unit classifies the brightness values of the image’s pixels into clusters. The cluster centers are calculated using the Gustafson Kessel Fuzzy Classifier.
• The VICODEs (CCD) Auto Descriptor Selector (ADS) is a feature of the application that automatically selects the proper descriptor for each image.
3.10. Grayscale Image Colorization
Once the proper segmentation is obtained and appropriate colors are identified, placing the color in the correct areas of the test image can be achieved in the YCbCr color space. The advantage of this color space is that it separates the luminance (Y) component from the color components (Cb and Cr are the blue-difference and reddifference Chroma components). Thus, it is possible to replace the Chroma components while preserving the luminance information of the image. In this research, the Chroma component of the test image is replaced with the colors corresponding to the matching textures from the library of images.
4. Experimental Results
The different algorithms used in this research were implemented in C# using Microsoft Visual Studio 2008 [14]. The img (Rummager) application, as well as with the DLLs provided by the authors were used for CBIR.
Several synthetic and natural images were used for simulation purposes in order to test the proposed segmentation algorithm [15]. Salt and Pepper noise was added to test images in order to test the tolerance of the algorithm to noise. The spatial center of gravity of each cluster is marked by a red pixel on all the test images processed when the Hik factor is used. The initial values used to populate the cluster centroids were the top c colors present in the image as per the color histogram, and the initial kx and ky values were set randomly. Figure 10 shows the results obtained by performing a Fuzzy C-means clustering on a natural color image obtained from the web.
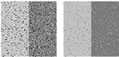
The Fuzzy C-means clustering shows very good segmentation results, but is still sensitive to noise and fails to segment areas of homogeneous textures. The test image shown in Figure 11(a), with added salt and pepper noise, was used in order to test the effectiveness of this method. Figures 11(b) to 11(h) display some of the results obtained by testing various configurations of this algorithm on the test image with 2 clusters.
These results demonstrate the ability of this algorithm for removing noise. Table 1 summarizes the percentage of misclassified pixels obtained by testing with various settings. Table 2 displays the number of iterations that were needed in order to achieve convergence.
Even though the use of the Hik demonstrated very good results, the best results were obtained by combining the, Gki and the Hik factors. The size of the window used in the Gki calculation does not appear to have much of an impact when used in combination with the Hik factor.
The results obtained with this test image demonstrate the added computation required when using the Gki factor in combination with a larger window size. This also resulted in a significant increase in the number of iterations that were required for the algorithm to achieve convergence. The number of iterations with regular FCM and with both factors was the same. But, the number of misclassified pixels was significantly lower, demonstrating the efficiency and effectiveness of the use of the combined
 (a) (b) (c)
Figure 10. (a) Natural test image; (b) FCM segmentation of the natural test image with 5 clusters; (c) FCM Segmentation of the natural test image using the modified FCM algorithm with 5 clusters, Gki window = 1 and Hik.
 (a)
(a)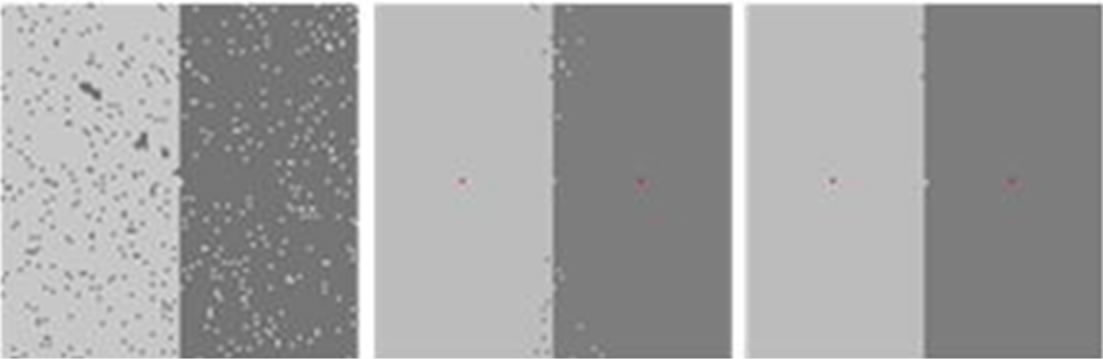 (b)
(b)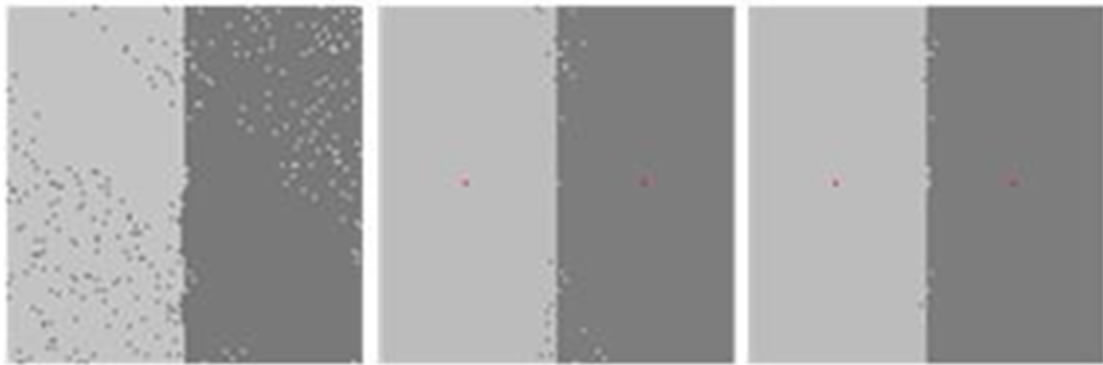 (c)
(c)
Figure 11. (a) Synthetic 2-color test image with salt and pepper noise; (b) FCM clustering of 11 (a) with 2 clusters; (c) FCM clustering with Gki window = 1; (d) with Hik; (e) with both (a) and (b); (f) FCM with Gki window = 5; (g) with Hik; (h) with both (a) and (b).
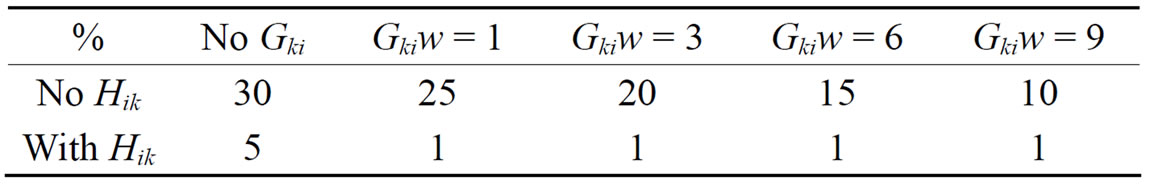
Table 1. Percentage of pixel misclassification using FCM clustering of image 9(a) with 2 clusters.
Table 2. Number of iterations required to achieve convergence using FCM clustering of image 9(a) with 2 clusters.
method. Additional testing of this algorithm was performed on a 4-color test image. The FCM clustering with 4 clusters with various options are displayed in Figure 12.
By combining the Gki and of the Hik factors, the tolerance to noise of the Fuzzy C-means algorithm is greatly increased. This leads to an improved capability to obtain coherent and contiguous segments from the original image. However, due to the radial nature of the spatial Euclidian distance factor, noise is still present in areas of the image that are equidistant to the cluster centers. Nonetheless, these results demonstrate the ability of this algorithm to remove noise when clustering an image.
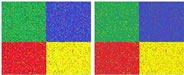
Figure 13 shows the different steps in the image segmentation and texture extraction process, starting with the normalized sum of the Gabor responses.
Figure 14 shows the various stages of the colorization of atest image through the ACTD process.
Figure 15 shows the several steps of the colorization process on another sample image.
5. Conclusions and Future Work
In this research, a new and innovative ACTD method for automating example-based colorization process is implemented. This process combines several state-of-the-art techniques from Digital Image Processing in order to improve the automation of the colorization process. This includes Gabor-based image segmentation combined with improved fuzzy C-means clustering, extraction and storage of the Texture and Color Descriptors, and a texture-based color retrieval technique.
 (a)
(a) (b)
(b)
Figure 12. (a) Synthetic 4-color test image with added salt and pepper noise; (b) FCM clustering of the test image; (c) FCM clustering of the image in figure 12(a) with Gki window = 1 and with Hik; (d) FCM clustering of the image in figure 12(a) with Gki window = 5 and with Hik.
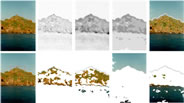
Figure 13. Feature extraction process on a sample image.
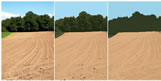
 (a)
(a)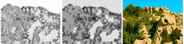 (b)
(b)
Figure 14. (a) Grayscale image; (b) Sum of Gabor responses; (c) Inversed, normalized sum of Gabor responses; (d) Mean smoothing of Gabor responses; (e) Segmented regions; and (f) Final colorized image.
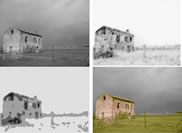
Figure 15. Colorization process for another test image.
The FCM with the Gki factor is modified using the Hik factor, and the algorithm is extended for the clustering of color images. The use of the sliding window in the Gki factor improves the segmentation results by incorporating local information about neighboring pixels in the membership function of the clusters. However this result in a significant increase in the number of calculations required during each iteration for each pixel as defined by . By combining the Gki and of the Hik factors, this modified FCM algorithm considerably reduces the number of iterations needed to achieve convergence. The tolerance to noise of the Fuzzy C-means algorithm is also greatly increased, allowing for an improved capability to obtain coherent and contiguous segments from the original image.
Colorization results in general are subjective and not easily quantifiable. Results obtained using this method are highly dependent on the number of textures present in the database and on the ability to find a suitable color match. However, reasonably accurate results were obtained with a limited number of sample images. Several of the steps require custom parameters that can be tuned for different types of images, such as the Gabor wavelength and orientation, and the number of clusters.
Since the textures extracted from each sample image have no preset size or shape, the Texture retrieval methods still need to be improved for scale and rotation invariance, which would lead to a better accuracy rate. This method could also be enhanced to store more complete color descriptors in order to accommodate more complex textures containing multiple colors. The use of techniques such as Anisotropic Diffusion could also be used to smooth the Gabor response images while preserving strong edge information. These improvements would most likely improve the accuracy of the colorized images. The testing conducted as part of this research proved that the ability to combine these techniques in order to automatically colorize grayscale images is a viable option.
REFERENCES
- A. Levin, D. Lischinski and Y. Weiss, “Colorization using optimization,” ACM Transactions on Graphics, Vol. 23, No. 3, 2004, pp. 689-694. doi:10.1145/1015706.1015780
- T. Welsh, M. Ashikhmin and K. Mueller, “Transferring Color to Greyscale Images,” ACM Transactions on Graphics, Vol. 21, No. 3, 2002, pp. 277-280. doi:10.1145/566570.566576
- X. Liu, L. Wan, Y. Qu, T. Wong, S. Lin, C. Leung and P. Heng, “Intrinsic colorization,” ACM Transactions on Graphics, Vol. 27, No. 5, 2008, p. 152. doi:10.1145/1457515.1409105
- R. Irony, D. Cohen-Or and D. Lischinski, “Colorization by example,” Proceedings of the Eurographics Symposium on Rendering, Konstanz, 29 June-1 July 2005, pp. 277-280.
- J. Malik and P. Perona, “Preattentive Texture Discrimination with Early Vision Mechanisms,” Journal of the Optical Society of America A, Vol. 7, No. 5, 1990, pp. 923-932. doi:10.1364/JOSAA.7.000923
- A. K. Jain and F. Farrokhnia, “Unsupervised Texture Segmentation Using Gabor Filters,” Pattern Recognition, Vol. 24, No. 12, 1991, pp. 1167-1186. doi:10.1016/0031-3203(91)90143-S
- S. Naotoshi, “Texture Segmentation using Gabor Filters,” University of Maryland, College Park, 2006.
- X. Hu, X. Dong, J. Wu and P. Z. J. Dong, “Texture Segmentation Based on Probabilistic Index Maps,” Proceedings of the International Conference on Education Technology and Computer, Singapore, 17-20 April 2009, pp. 35-39. doi:10.1109/ICETC.2009.41
- X. Zhan, S. Xingbo and L. Yuerong, “Comparison of Two Gabor Texture Descriptor for Texture Classification,” Proceedings of the WASE International Conference on Information Engineering, Taiyuan, 10-11 July 2009, pp. 52-56. doi:10.1109/ICIE.2009.20
- M. Lux and S. A. Chatzichristofis, “LIRe: Lucene Image Retrieval—An Extensible Java CBIR Library,” Proceedings of the ACM International Conference on Multimedia, Vancouver, 27-31 October 2008, pp. 1085-1088. doi:10.1145/1459359.1459577
- S. Α. Chatzichristofis, Y. S. Boutalis and M. Lux, “IMG (Rummager): An Interactive Content Based Image Retrieval System,” Proceedings of the 2nd International Workshop on Similarity Search and Applications (SISAP), Prague, 29-30 August 2009, pp. 151-153. doi:10.1109/SISAP.2009.16
- S. Krinidis and V. Chatzis, “A Robust Fuzzy Local Information C-means Clustering Algorithm,” IEEE Transactions on Image Processing, Vol. 19, No. 5, 2010, pp. 1328-1337. doi:10.1109/TIP.2010.2040763
- S. A. Chatzichristofis and Y. S.Boutalis, “Content Based Medical Image Indexing and Retrieval Using a Fuzzy Compact Composite Descriptor,” Proceedings of the 6th IASTED International Conference on Signal, Pattern Recognition and Applications, Innsbruck, 17-19 February 2009, pp. 1-6.
- C. Gauge and S. Sasi, “Automated Colorization of Grayscale Images Using Texture Descriptors,” Proceedings of the International Conference on Advances in Computer Science, Trivandrum, 21-22 December 2010, pp. 164- 166.
- C. Gauge and S. Sasi, “Modified Fuzzy C-Means Clustering Algorithm with Spatial Distance to Cluster Center of Gravity,” Proceedings of the 6th IEEE International Workshop on Multimedia Information and Retrieval, Taichung, 13-15 December 2010, pp. 308-313. doi:10.1109/ISM.2010.53