Journal of Water Resource and Protection
Vol.11 No.07(2019), Article ID:94107,40 pages
10.4236/jwarp.2019.117055
The Implication of Unreliable Urban Water Supply Service: The Case of Vendor Water Cost in Langata Sub County, Nairobi City, Kenya
E. A. Ochungo1*, G. O. Ouma2, J. P. O. Obiero3, N. A. Odero4
1Institute for Climate Change and Adaptation (ICCA), University of Nairobi, Nairobi, Kenya
2Department of Meteorology, University of Nairobi, Nairobi, Kenya
3Environmental and Biosystems Engineering, School of Engineering, University of Nairobi, Nairobi, Kenya
4Department of Electrical and Electronics Engineering, Machakos University, Machakos, Kenya

Copyright © 2019 by author(s) and Scientific Research Publishing Inc.
This work is licensed under the Creative Commons Attribution International License (CC BY 4.0).
http://creativecommons.org/licenses/by/4.0/


Received: June 13, 2019; Accepted: July 28, 2019; Published: July 31, 2019
ABSTRACT
Studies on urban water supply service improvements continue to draw interest across the world. The pressure on freshwater resources is increasing in every region in the face of an increasing demand and climate change dynamics. Langata sub County in Nairobi city, Kenya faces drought induced water shortage and households rely on water vending and bottled water purchases to augment the inadequate municipal water supplies. Little to our knowledge has been done to assess the cost implication of such a practice here. So the study used household survey method to collect monthly households’ water bills comprising; utility company, water tanker delivery and bottled water purchase from a randomly sampled 382 households spread within the five wards; Karen, South C, Mugumoini, Nairobi West and Nyayo Highrise. The gated communities identified are 57. Simple stochastic analysis of the data was done after data cleaning using MS Excel. It was found that the municipal water serves up to 91.15% of the total average household monthly water demand with a cost share of 27.91%. Water tanker delivery meets 8.61% of the household water demand with a cost share of 50.74%. The bottled water purchases serve 0.24% of a typical household water demand with a total cost share of 21.35%. The water supply deficit which is a mere 8.85% met by tanker deliveries and bottled water purchases has a total average cost share of 72.09%. The computed cost burden is 258%. This means that the households pay more than two and a half times extra above the utility bill per month. The study recommends a new water policy that will incorporate the role of water vendors operated on a cooperative model by the gated communities using standard guidelines.
Keywords:
Water, Vending, Cost and Burden

1. Introduction
1.1. Water Supply Reliability
In the past one hundred years, the population has tripled while the global demand for water use has increased six-fold. Today; more than 1 billion people lack safe drinking water [1] . Part of these victims are the 176,314 residents of Langata sub County within Nairobi; the capital city of Kenya. In this neighborhood, the municipal water from a monopoly-enjoying Nairobi City Water and Sewerage Company Limited (NCW & Co. Ltd.) is only available for one day each week just like it is in the other areas of the city [2] . On the other days, households here depend on water stored in tanks or on alternatives whose cost burden is deemed too heavy on them in the long run. Water supply insecurity in cities is attributed to two main stressors; climate change and population growth [3] . This means societies must work on water supply reliability to achieve equity by recognizing vendors formally. This could come in the form of public private partnership so that technical and financial support can be given, thus their activities and charges may be regulated [4] .
The reliability of a water supply system depends on its distributive efficiency [5] . A water distribution is system deemed reliable if it can withstand a predicted level of failure including against pressure surges [6] [7] [8] . In water works’ landscape, the three determinants of system reliability are; quantity of water delivered at the right pressure and time, its quality and its affordability to all consumers equitably [9] [10] . A lot has been done to investigate the water distribution networks’ reliability in terms of meeting its expected service levels [11] . In the olden days, the global climate system was somewhat stationary; and so the big headache then was for water engineers to identify a suitable source of water and its treatment method [12] [13] . For treated water distribution, the practice which followed was to transmit the clean treated water to an elevated storage reservoir to allow for final flow by gravity to consumers [14] .
To maintain the purity of the treated water, a monitored and surveyed piped network transmission system was, and remains the most preferred conveyancing method while keeping watch on; corrosion, deposition, biological after growths, taste and odor changes as discussed by worker in [15] as cited by [16] [17] [18] [19] . Pioneer reliability assessment studies were aimed at countering either the hydraulic performance or mechanical system failures of the water distribution system [20] [21] . Such studies always proposed reliability optimization remedies [22] [23] such as upgrades and/or expansions [24] transcending to subtle and extreme disaster scenarios [25] . Today however, consumers have been forced to innovate for themselves new sets of coping alternates following the increased vulnerability of public water supply systems to impacts of climate variability [26] [27] [28] .
Accordingly, households nowadays do supplement with vended water transported by one or a number of these methods: head-ported or hand-held water containers [29] , walking tractors, bicycles, hand-carts/donkey carts [30] [31] , motorbikes and owner-managed water access systems for a home or a community [32] . One other popular coping strategy is buying from neighbors; a practice found in Accra city, Ghana according to [33] . Such daily distressful struggles for water access service makes urban dualism concept real as the beneficiaries are known to be living in urban settings with on-site water utility infrastructure [34] [35] . Further, the selection of a choice of water source with a suitable quality is not easy [36] . Despite the prevailing choice quandary, water vendors serve about 10% - 69% of households in developing nations’ cities [37] . On the other hand, selling of water to customers is a very important economic activity to the vendors [38] . That is why they always choose to ignore repugnant waterscape labels like ‘mafias’ as in Bangalore city, India [39] .
Water vending trade is a very common trade in cities of the Global South where water tankers have become a ubiquitous feature of domestic water supply systems according to [40] [41] [42] [43] . The vendors are known to create ‘archipelagos’/‘fiefdoms’/‘enclaves’ to territorialize their service areas [44] [45] as they openly take the full advantage of the existing acute water crises in these cities as per the report by [46] on Kisumu city in Kenya. The averting expenditures associated with water shortage cover coping behaviors such as; collecting, pumping, treating, storing, and purchasing [9] [47] [48] . And in most cases, vended water rates are higher hence exhibiting elevated equity impacts like what [50] observed in the city of Cochabamba, Bolivia. This paper shares the same view advanced by [51] that solving water supply unreliability should be tied to drought risk preparedness plan; a position also supported by [52] .
Through such steps, the residents may rejoice instead of struggling as per the lessons learnt from irrigation districts’ experience in Spain and the United States on the water use preparedness [53] . This adds to the integrated prognostic and diagnostic decision support system frameworks discussed by [54] [55] for water supply systems. As we continue to witness the widening of the uncertainty of global drought risks, visitors to Global South cities in places like Africa will still get struck by the presence of countless small artisans going about their business to perform the most basic of public services: delivery of water [56] . So, as water vending trade continues to expand in these regions, there is a growing interest to analyze their implications. This comes at a time when the world’s population is fast growing and is predicted to approach 10 billion by 2050 [57] . In general, it is estimated that about one fifth of the world population live in areas of physical water scarcity all year round.
And two-thirds or about 4.0 billion people live under conditions of severe water scarcity at least 1 month in a year [58] . Additionally, records show that more than 50% of world population is living in urban areas, mostly in poor nations which are yet to attain universal water supply coverage [5] . It is approximated that more than 75 percent of the urban poor obtain domestic water from sources other than a direct-piped mains supply [59] . Given the growth of water demand and water shortage are in an unsolicited contest, water resource planners are abandoning massive engineering solutions for water problems for combined conventional and unconventional alternatives [13] in order to achieve a sustained supply [60] . And the key issue in this new thinking is the affordability aspect as per the thinking by [61] to bring down the price of water access even as we embrace alternatives.
The cost reduction requires dedicated efforts in learning and managing the risks together [62] . Unfortunately, such efforts are rare in the developing world and so the consumers are in a way left to face poverty penalty in urban water markets [63] [64] . Their water stress is soaring [65] which continues to yearn for a responsive economic regulation [66] . This paper argues that, reducing the cost of the vended water may remain a pipe dream unless the public positively approves of the water quality perceptually [67] . Currently, the vended water quality information rarely reaches the consumers [68] [69] . And usually, the vended water comes from different sources hence holding varying brand perceptions [70] . As a result, consumers do not trust such waters for drinking purpose, like the case of Ngamiland households in Botswana [71] . Instead, they use other sources such as bottled water or small home treatment systems.
In Kenya for example, a study by [72] found that the middle and poor household groups in Naivasha town spend more than the stipulated proportions of their income on alternative water access. This finding mirrored an earlier similar finding on the same issue for Nairobi city where some residents were found to spend up to about 11% of their monthly income [73] . A subsequent study by [74] and later by [75] found that Nairobi city has a huge unequal and inequitable consumption of the available conventional water hence forcing residents to rely on water vending. Further, a most recent revelation by [76] showed that only 50% of Nairobi residents receive clean piped water. He added further, that out of this, a mere 40% has a 24-hour access. This situation is likely to continue or get worse given that Kenya is a poor water resourced nation. The water supply deficit for Nairobi City was in 2018 quantified by [77] to be about 23% of its then prevailing demand in a study which proposed for adoption of rainwater harvesting.
1.2. Understanding the History of Urban Water Supply
1.2.1. Overview
Water supply system began in the City of Knossos (Minoan civilization) in around 1500BC where an aqueduct system was used to transport water [78] . Later the Romans constructed a community water supply aqueduct by around 312 BC [79] . To this date, the ancient Greek and Roman water technologies are the underpinning pillars of modern achievements in water engineering and management as told in the article by [80] titled “a brief history of urban water supply in antiquity”. The origin of America’s municipal water system as presented by [81] further indicated that the first municipal water utility was built in Boston in 1652 in a piped transmission system. This work added that such clean treated water was used in homes and the system received chlorine boosters at strategic locations to keep watch of chlorine decays [82] .
Further, an earlier paper by [83] that traced the history on supply of clean water reported that by 1860, a total of 136 water systems had been built across the United States of America. And in these persuits, wastewater treatment systems for sludge management were concurrently being built to manage possible biological risks [84] . From those early times, it is recorded that water supply and distribution was provided through a network of terracotta piping as technology advancement progressed to encompass use of other materials [85] . The water service developments especially the delivery near to consumers played a significant role in the reduction of instances of waterborne deaths [86] .
Delivering water close to the consumer saw a common-cup in public places in the United States of America [87] [88] [89] , a practice that got banned in 1962 through legislations and water laws. The idea got reincarnated in our today’s use of water dispensers and coolers in offices [90] . In availing water to the consumers, the central theme is the safety of drinking water, a matter that [91] has discussed extensively in his book titled ‘distribution systems handbook’. According to [92] water vending, a practice that delivers water to the consumer’s doorstep informally is probably as old as the human society. That is the reason scholars like [93] contend that although the expansion of networked piped systems is preferred, water vending is still important to communities facing water shortage. This situation is more pronounced in urban informal settlements [94] .
A poor method of clean water handling predisposes it to safety susceptibility [95] . Consequently, water vending phenomenon requires a proper regulatory environment, as we note that it is part of an emerging urban informal economy [96] . This sort of transition is so crucial since water vending may be the only source of clean water to some peri-urban households in developing countries [97] [98] . In these places, water tanker ferrying is the most common conveyance mode like the case of Chennai, India [99] . Because of poor quality perception for both tap water and vendor water, most households do purchase bottled water [71] . In a sense, the bottled water has been transformed from an elite niche product to a nearly ubiquitous consumer object in both the global North and South [100] .
In America, for example [101] report in a separate paper that seventy five percent of the households prefer bottled water as a more perfect commodity. Despite the universal adoption of bottled water commodity, its quality control is needed [102] . Unfortunately, the prevailing regulations over the same are still less stringent [103] . This loophole has enriched bottled water marketers [104] . As bottle water use diffusion driven by cleverly staged marketing strategies to hoodwink the public caused workers in [105] to raise ethical concerns on the trends. They pitched their argument on the finding by scholars like [106] [107] whose work had established bottled water contamination potentials. Besides, according to [108] , the single use type plastic used in water bottles is a big cause for global environmental degradation challenge like the one which has been noted at North Pacific Subtropical Gyre.
Most of the plastic bottles are made from polyethylene terephthalate (PET). Other bottles are made from polycarbonate, which may contain Bisphenol A (BPA). BPA is a manmade, industrial chemical used to make polycarbonate plastic and epoxy resins. Studies have shown that exposure to BPA early in life may have long-term effects, as it has been shown to interrupt the natural hormonal messaging system. It is common; we sometimes like the idea of reusing the PET #1 water bottle. This practice is however not recommended due to the chemical breakdown of the bottles, potentially causing the chemicals to leach into beverages [105] . Additionally, [109] has reported that even though the major determinants on choosing bottled water brand are; taste, quality and odor, most of the time the consumers use affordability factor. But as we know buying cheap may be expensive in the long run since it is possible that the consumers may be exposing themselves to more hidden costs [110] . New regulation on the use of water alternative is therefore needed to achieve equity through government targeted concessionary support [111] .
The target is to facilitate the meeting of basic water requirements for each activity in a household [112] [113] . By this rule, the human cost of lack of access to safe drinking water may be met in poor nations as has happened in the developed world [114] due to the strict adherence to drinking water quality controls. The controls follow three pillars; policy formulation, water law’s enactment and administrative guideline development. But their enforcement is usually the harder part to achieve [115] [116] . Despite this challenge, there is a growing urgent need for governments to step in to manage the equity impacts of informal water markets [117] .
1.2.2. Related Work on the Implication of Unreliable Water Supply
A lot has been done on assessment of implications of households’ drinking water access cost. To encourage universal access of piped water, pricing levels are always set so as not to discourage poor households from seeking connections with the single but most important aim of improving the latter’s wellbeing. So on the setting of the pricing structure, [118] discussed the cost recovery mode from water developments in the developing nations where it was proposed that a careful balance between the economics and governance policies targeting poor villagers be struck to achieve affordability. They took note of the role of politics in pricing as later confirmed by [119] [120] which usually hampers the implementation [121] even in stronger economies like in China. From the onset, increasing block tariff (IBT) was suggested as the best to provide equity [122] . The IBT method was later found to have a number of weaknesses by different scholars. First, according to [123] , IBT does not acknowledge that some poor families get water from their neighbors. Since it uses the volumetric measurement on its charges’ schedule, the donating and or the metered poor neighbors usually end up with high water bills.
Secondly, [124] noted that one of the unintended consequences of IBT is that it disregards poor households with large families whose water use volume is higher. For that reason, [125] devised a tariff structure setting mechanism based on uniform price with rebate (UPR) to manage the inefficiencies of IBT. Additionally, despite the widespread use of IBT, [126] on his part attributed the poor performance of water supply systems in poor nations to low tariffs thereby recommending reforms which [127] later affirmed as necessary to achieve a reasonable pricing that can support operation and maintenance costs under a properly functioning water institution. On this, [128] formulated a framework to guide on tariff and subsidies based on the assessment of the need for and the evaluation of subsidies for urban households. His inspiration stemmed from water network pricing work by [129] and discussion on water tariff subsidies in developing countries by [130] . This was based on taking water as an economic good as earlier asserted by [131] as per 1992 Dublin Water Principles.
In that context, municipal water pricing and tariff design should always be a spin off from a reasonable reform agenda [132] that is pro-poor in every respect. The conclusion recommended the following; the poor to receive connections, subsidies, public taps, and recognition of water vending including control of private operators. Recent scholars on the same issue like [133] [134] added their voice on the same theme by stating that the water tariff structure must contain, use volume, service level type, unit cost, waste service, tariff structure and socio-economic status of the user.
A glance through the ongoing thread of literature on water access pricing does suggest price subsidy for the poor is a major influencing factor; a situation which [135] had raised concerns on. And the concern was based on the fact that, the small-scale private service providers (SPSPs) of water supply do fund their investments mainly through their own earnings and savings, loans from friends and family, and money borrowed from formal and informal lenders. For that reason, this paper takes the suggestion by [136] on water cooperatives as a positive move to solving the price equity challenge in the informal water market.
Regarding the implications of quality and economic burden of water tankers on consumers [41] used field survey method to assess water vending wells and tankers coupled with a water quality sampling and analysis program in a pilot semi-arid urban area (Beirut, Lebanon). They established that Total Dissolved Solids (TDS), Chloride (Cl), and microbial loads exceeded drinking water quality standards mostly due to saltwater intrusion in the coastal wells. On the other hand, tankers were found to be a significant source of total coliforms. Delivered water costs varied depending on the tanker size, the quality of the distributed water, and pre-treatment used, with a markup of nearly 8 - 24 folds of the public water supply and an equivalent economic burden of 16% of the average household income excluding environmental externalities of water quality.
On cost burden assessment [47] deployed household survey method on 1500 randomly sampled households in Kathmandu, Nepal. They established that accessing water through; collecting, pumping, treating, storing, and purchasing of water did impose heavy coping costs on an average household of as much as 3 U.S. dollars per month or about 1% of their prevailing incomes, representing hidden but real costs of poor infrastructure service. In other words, the coping costs were twice the monthly bills but below the willingness to pay estimate for improved service. This same approach was deployed by [137] for the Kenya’s major urban centers which confirmed that for Nairobi and Mombasa, waste water cost is 75% of the water bills. Further, a review study titled ‘History of Water Supply and Governance in Kenya (1895-2005): Lessons and Futures state’ by [138] on the book authored by Nyanchanga stated that, the issue of water charges is a thorny one, especially as it conflicts with the person’s right to water. In the same book, Nyanchanga records that water charges in Nairobi began in 1908 as fixed flat rate before moving to IBT based on metered consumption.
In Cochabamba, Bolivia [35] assessed the implications of water vending using economic justice framework and found that the unionized vendors have superior service than their free operating counterparts. The role of informal markets in urban service provision, once considered lamentable and temporary, now is increasingly accepted and is unlikely to change. This the case found by [139] who observed in Maputo, Mozambique, that vendors were the only actors ensuring that water services were available to the peri-urban poor. Despite this promise, [140] on their part discouraged dependence on vendors stating that such alternative sources may be of lower water quality which could pose health risks on the consumers; a position maintained by [141] [142] . That is why scholars like [143] called for the understanding and incorporating of the vended water into an integrated drinking water platform to hasten attainment of universal water security; satchel water industry included. The integration move will enable consumers to gain from its known advantages that include; no upfront connection fees; demand-based and flexible to local conditions, and service to large populations without high costs of utility infrastructure according to [144] .
Regulating water vending business was also suggested by [33] who found that in Accra, Ghana utility rates were affordable noting that; tanker water cost 7 times, vending/neighbor’s sale cost 10 - 13 times, sachet water cost 150 times and bottled water cost was 900 times the Ghana Water Company rates. Many scholars have used survey method to assess implications of water supply unreliability in Nairobi; the local setting in this study. On privatization, [145] reported that attempts to privatize Nairobi city’s water supply flopped on its first attempt due to public fear on the likelihood of water price increment. Privatization was geared to improve water service by Vivendi’s subsidiary, Seureca Space/Generale de Seaux basing the reasoning from the successes registered by other utility companies like Veolia Water Technologies [146] .
Due to the flop, Nairobi city’s water supply service level is on a free fall and many households depend on vendors [2] . Further, the ongoing network improvement through the highly hailed northern collector (fourth phase) Nairobi water project [147] like its predecessors , may fail altogether to improve both equity and affordability as was noted by [148] after the third phase Nairobi water works were completed in the 1990s. This is the same concern that was recently raised by [134] particularly on tariff settings that can spur equitable and affordable access to water service in the city. This then means, water vending business presence is here for the long haul.
From the foregoing, it is very clear that very little if any has been done to assess the implication of water vending cost on Langata sub County households; a neighborhood facing a constant water shortage. Accordingly, this study aimed to analyze water shortage coping cost risk on the households which represents the coping cost burden of vended water in this area. The study site was chosen due to the familiarity of the researchers with the water supply situation as the lead researcher resides in this same neighborhood. The study contributes to water supply service improvement literature by way of plotting various themes of water access costs spatially on the area map to facilitate a collective decision making towards a communal solution. Practically, the results may influence the city authorities to formulate a new water security policy that recognizes in an effective manner, the role of water vendors. The rest of the sections are as follows: Section 3 presents methods; Section 4, presents results and discussions while Section 5, outlines conclusions.
2. Method
2.1. Study Area
Langata sub County (Figure 1) is one of the 17 administrative units of Nairobi City County (NCC) with an estimated population of 176,314 people living in 52,656 households (CBS, 2009) occupying an area of 196.80 km2. It is bounded to the North by Dagortti sub County, Kibra sub County, Starehe sub County, Embakasi sub County, Machakos Couty and to the South by KajiadoCounty. It is about 10km to the South of Central Business District. It is located at approximately 1˚22'0''S, 36˚44'0''E and with a topographical height range from 1600 m to 1850 m above mean sea level. It enjoys a tolerable temperate tropical climate throughout the year. It has five wards, namely; Karen, Mugomoini, Nairob-West, South C and Nyayo High-Rise.
The annual average rainfall ranges between 800 - 1200 mm. There is a constant 12 hours of daylight. Average daily temperature ranges from 29˚C in the dry season to 24˚C throughout the year. The study area is serviced by a monopoly-enjoying Nairobi City Water and Sewerage Company Limited (NCW & Co.Ltd) whose supply distribution is on rationing program. Accordingly, water vending business is booming as a complementary source of domestic water, which in this study referred to as the alternatives. It is also important to note, that Langata has a predominantly mixed development with all categories of households; from the most affluent in Karen neighborhood to the poor households groups sporadically spread within each ward. It prides itself to be the host of the famous Nairobi National Park. There are higher concentrations
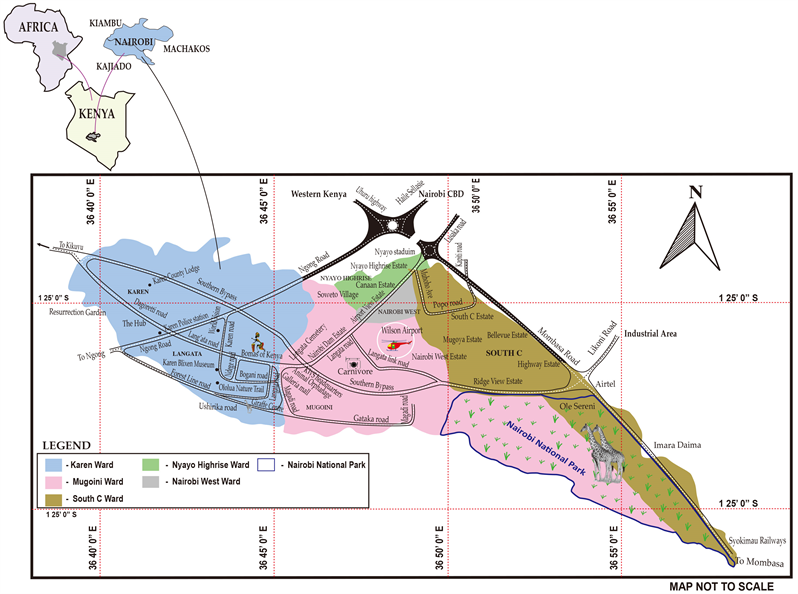
Figure 1. Location map (not to scale).
of private commercial boreholes in the area. It is important to note that for the purpose of this study, water vendors refer to all categories; tanker operators, cart pushers and other conveyance modes.
2.2. Methodology
2.2.1. Research Design
The research depended entirely on the collected data; therefore analytical computations, descriptive statistics, numerous charts and plotting of chroma-maps were employed to meet the stated objectives. MS Excel, SPSS Software and Surfer Software Version 6.0 were used for analysis. After listing the objectives of the project, a schedule of the data collection activities was drawn. The schedule included a preliminary data collection phase, the development of the questionnaire, a pre-trial (test) survey, and community entry workshop (induction seminar for familiarization), full survey itself following a laid down sampling procedure as explained below and final community workshop for result ratification by the community. The final questionnaire had 19 questions spread in 4 sections: Section 1, dealt with General Information; Date of survey, Name of respondent and Estate of residence. Section 2, dealt with Respondent’s Information; Gender, Age, Number of years of stay in the estate and Education level choices; none (zero level education), primary level, secondary level, college level and university level.
Section 3 had five parts: A, B, C, D and E. In Part A, a future perception of water shortage was assessed based on a likert scale as per guide by [149] . The scale had five score values, namely; 1, 2, 3, 4, and 5 where value 1 = Strongly Disagree that water shortage will worsen in the area and 5 = Strongly Agree that water shortage will worsen in the area. The intermediate values were in between those two extremes. Additionally, in this section 3, Part A, the respondent was again provided with three boxes to score his/her monthly household’s water bill; Water Company (Utility-U), Water vendor (Tanker-T) and Bottled water purchase (B). There was again another box to provide water vendor name, delivery type (cart or tanker) and contact.
In the information sheet, there was an important notice to the effect that, the survey targeted only household heads that are believed to be above 18 years of age. Section 3, Part B, dealt with scoring on a likert scale as A above on acceptance on community based sourcing of municipal and vendor water through a Blockchain enabled provenance tracking platform to facilitate water source quality verification. Part C, just as above, asked the respondents to agree or disagree that, the shift in B above will partly solve the ongoing water shortage in the area. Part D, as C above sought to confirm that the ability to confirm informal water’s quality before making a delivery order is likely to reduce water shortage stress in the study area. Part E; sought to confirm from the respondent using the same likert scale to confirm or disagree with the statement “water shortages are inevitable; therefore, there is nothing we can do about it”.
Section 4 dealt with “vendor water-blockchain enabled quality tracking system installation options in four parts; a, b, c and d”. Part b had two sub parts: 1) and 2). In part (a), the respondent was given choices “yes” and “no” and the question was, “does your estate/village/neighborhood experience water shortage?”. In part (b), the respondent was asked to confirm using “yes” or “no” answers whether when the municipal water supply failed, he/she sourced from a vendor. In part (b) sub Section (1), the respondent was asked to answer using “yes” or “no” choices whether, after sourcing from a vendor, she/he improved water quality by any means. In part (b) sub Section (2), in case the answer in part (b) above sub Section (1) is “no”, the respondent was asked to confirm using “yes” or “no” choices whether , he/she instead depended on bottled water on a dispenser for drinking purposes.
Finally in Part (c), the respondent was to state his/her agreement using “yes” or “no” to confirm the quality of vendor/municipal water on a blockchain provenance tracking system with a caveat caution that the answer given was to affect his/her response to part (d). Part (d) involved selection of only one option choice from a set of four option choices of quality tracking platform. Each had a likely effect on future monthly household water bill. Option (I), was based on individual household tracking platform with 15% municipal water tariff adjustment, Option (II), was a gated community water quality tracking and sourcing through estate water management company with a 12% effect on current municipal household monthly water bill, Option (III) was a blend of (I) and (II) as above described and finally, Option (IV) was no action (Status Quo). Each option was diagrammatically presented. Further; the survey team had a translated questionnaire in “Kiswahili language” for any respondent who had a challenge with the “English version”. For this paper, only the answers to monthly water bill have been analyzed from Part 3 (A).
2.2.2. Sampling
We used random sampling method; in which each unit included in the sample has the same chance of inclusion in the sample. This technique provides the unbiased and better estimate of the parameters as the population was assumed to be homogeneous [150] . The fact that the study area is well planned made distribution of questionnaires easy. To ensure randomness and wide coverage in the sampling process, the study followed the 57 gated communities spread within the five wards as explained in section 3.1 above and on map (Figure 1). Circular systematic sampling was used in this study to select a household within a gated community. Systematic sampling is a probability sample selection method in which the sample is obtained by selecting every kth element of the population, where k = N/n where N is population and n is the sample size. The first sampling unit is selected randomly within the first k units of the list. For instance, if k = 10, then a random number between 1 and 10 is selected first. Suppose the selected random number is 8. Then starting with the 8th house in the list of households in the gated community, every 10th house (8th, 18th, 28th∙∙∙) is sampled until the desired sample size is reached. We deployed the [151] formula in determining sample size as expression in Equation (1) below:
(1)
where: n = sample size required N = number of people in the population (52,656 households in our case, see Section 3.1 above) P = estimated variance in population, as a decimal: (0.5 for 50 - 50) A = Precision desired, expressed as a decimal (i.e. 0.05 for 5%) Z = Based on confidence level: 1.96 for 95% confidence, R = Estimated Response rate, as a decimal, in our case 100% which is 1.
2.2.3. Household Survey
The estimated target sample size was 382 households, computed from Equation (1) above. A total of 382 questionnaires were eventually distributed to 57 gated communities. For standardization of results, the questionnaire was based on several other studies on implications of vendor water in various countries [33] [41] [35] [47] [141] . The questionnaires were distributed to; Karen ward with 9467 households which received 69 copies into its 14 zones with 13 zones along major roads receiving 5 copies each and the last 1 zone receiving 4 copies of questionnaire. For South C ward with 13,637 households, 99 copies were distributed into its 12 gated communities with 11 receiving 8 copies each and 1 community receiving 11 copies. In Mugomoini ward with 12,867 households, 22 communities received 4 copies each and 1 community received 5 copies of questionnaire, making a total of 93. For Nairobi West ward with 8311 households, each of its 4 gated communities received 15 copies each making a total of 60.
Lastly, for Nyayo Highrise ward with 8374 households, 3 of its gated communities received 15 copies each and 1 received 16 copies making a total of 61. Questionnaires were administered to adult members of the family (household heads) by a group of two (male and female) researchers who explained every detail to the respondents. For the literate class, the researchers left the questionnaires with the respondents for a minimum of three days to allow adequate time for filling the questionnaires. In some cases, repeated visits were made before the questionnaires could be retrieved. For the illiterate and semi-literate group, the researchers guided the respondents through the filling process, using Kiswahili language version of the questionnaire. In some other cases, the researchers had to fill the questionnaires in accordance with responses from respondents. Note that the household survey had two objectives; one, to assess the implication of water vending in terms of cost burden to the households. And, two, to assess the determinants for adoption of new coping measure. This paper presents only the results of first objective.
2.2.4. Coping Cost Burden Computation
To assess the implication of water vending in terms of cost burden to the households, we began by estimating the exposure index factor of water shortage in the study area. Thi is the measure of risk avoidance costs among the households. The total cost of water access for a household is the sum of monthly water bill for Municipal delivery (Mp), Vendor delivery (Vp) and Bottled water purchase (Bp). The total cost of water access per household in a month is
(2)
And the cost of coping with water shortage per household when municipal water supply fails is:
(3)
The Exposure Index Factor (EI) is expressed as:
(4)
When EI is 1, then, households are absolutely dependent on municipal a supply which is the ideal condition.
Next, we computed the household vulnerability to water shortage, being the potential loss stemming from risk avoidance cost as per Equation (2) above. At an extremely dry period this cost will be high for each household. Mathematically, it is expressed as a ratio of total cost of coping to the overall cost of water access.
(5)
As the value approaches 1, then water shortage risk is at its peak. And the combined vulnerability index (VI) of all households to water shortage is expressed as:
(6)
Finally we computed the coping cost burden (CCB), being the index ration of total household monthly water bill less municipal monthly to municipal monthly bill, expressed as a percentage:
(7)
3. Results and Discussion
3.1. General
The household survey conducted between 20th February, 2019 and 23rd May, 2019 revealed that 99.7% of the 382 sampled homes confirmed they experience water shortage most of the months in a year. In the area, 91.1% of the households depend on vendor water to survive. Table 1 below has the synthesized details of the survey information.
3.2. Understanding the Unit Rates in Use
The utility’s unit rate is based on the Increasing Block Tariff as per Kenya Gazette Notice No.7335 dated 5th October, 2015 (The Kenya Gazette, p. 2372). Further, we have assumed that the household connection is half inch meter type hence the meter rent per month is taken as Kshs. 50. With that, the initial consumption from 0 up to 6 units is Kshs. 204. And the next consumption above 6 up to 60 units is priced at Kshs. 53 per meter cubed. On average, if we consider up to 60 units, the rate is (50 + 204 + (60 − 6) * 53)/60, which is Kshs. 51.93. We have taken 1 USD to be equivalent to Kenya Shillings (Kshs) 102.27.
Therefore one liter of utility water costs USD 0.0005078 (Kshs. 51.93) per litre. Based on the surveyed tanker delivery costs, one liter costs 0.00976 USD per liter in the area. And for the bottled water using same reasoning as that for tanker, one liter costs 0.1465 USD. Stemming from the above, the household survey data which were in cost form in term of Kshs, were converted to volumes in liters. The individual household consumption was converted to estates as averages both in costs and in volumes (see Table 1 above). From Table 1 and X, Y coordinates of estate centers, contour maps were drawn. The average cost and

Table 1. Cost in USD and consumption volumes in liters per estate and summary for wards.
average consumption volumes of each estate were taken as “Z” value when generating digital terrain model (DTM) in Surfer Software. The plots have chroma scales and values to help in direct interpretation as presented in the subsequent sections.
3.3. Cost Implications from the Estate Perspective
3.3.1. Water from Utility Company
The survey was conducted in 57 gated communities (estates) listed as “code” in the second column in Table 1 below. Using the unit rates and the survey results, it was established that Amana estate in South C ward spends most in utility followed by Ngei 1 estate in Mugumoini ward and Bogani road area residents in Karen ward. On the other hand, Kuwinda slums in Karen ward does not receive water from the company while Soweto village in Nyayo Highrise receives the least from the utility company; see Figures 2-4 together with Table 1.
3.3.2. Water from the Tankers
Water tanker dependency in the area has shown that Sun Valley 1 estate in Mugumoini ward (code 1 in Table 1 above) tops the list followed by Miotoni and Karen Muteero; both of which are from Karen ward. On the other hand, Canaan in Nyayo Highrise ward receives the least in tanker; see Figures 5-7 below.
3.3.3. Bottled Water Consumption
In terms of bottled water consumption, Amani court in Mugumoini ward is number one. But places like Canaan, Kuwinda and Southlands Kijiji; all of them being informal settlements in Highrise, Karen and Mugumoini wards respectively use zero bottled water. Jordan court (code 7) however, is the least user of bottled water; see Figures 8-10 below.
3.3.4. Combined Consumption of Utility and Tanker
The cost of combined use of utility and tanker is most prominent in Karen Muteero and least in KambiKisii both in Karen ward, see Figures 11-13 below.
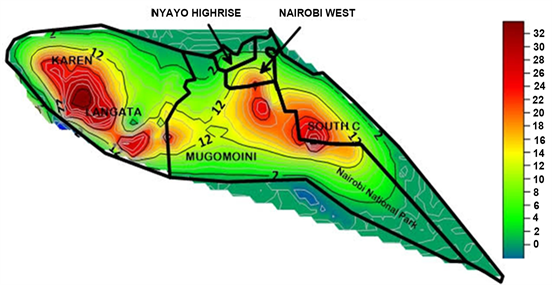
Figure 2. Contour map of cost of water from utility company in USD.

Figure 3. Contour map of water from utility company in litres.
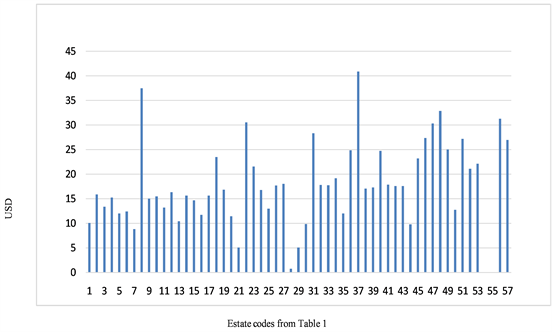
Figure 4. Average cost of water from utility company in USD per estate.
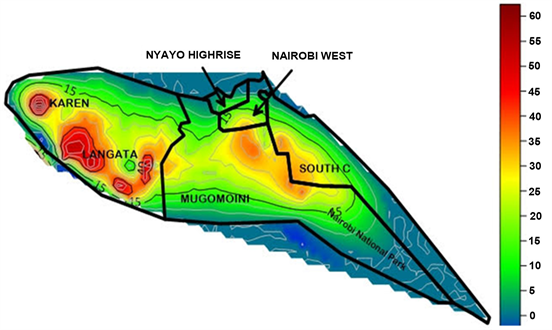
Figure 5. Contour map of cost of water from tankers in USD.
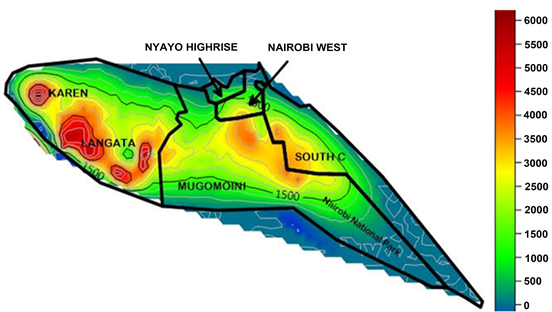
Figure 6. Contour map of water supply from tankers in litres.
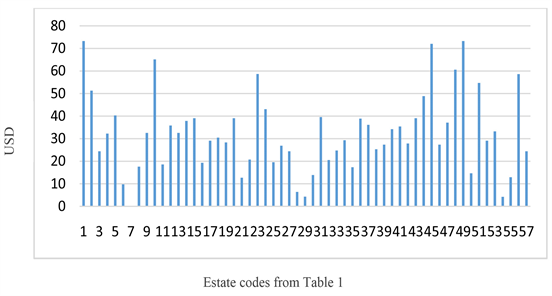
Figure 7. Average cost of water from tankers in USD per estate.
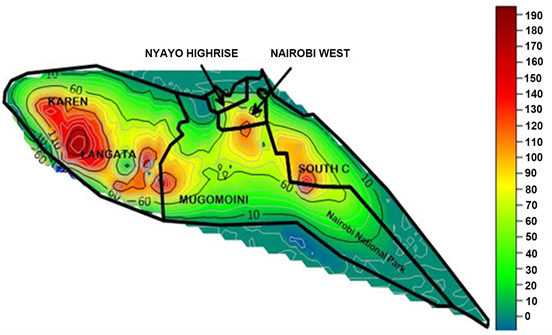
Figure 8. Contour map of water supply from bottled water market in litres.
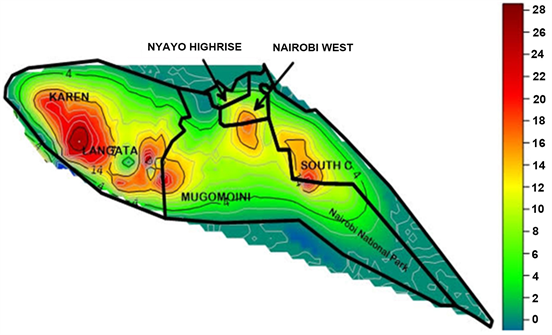
Figure 9. Contour map of cost of water supply from bottled water market in USD.
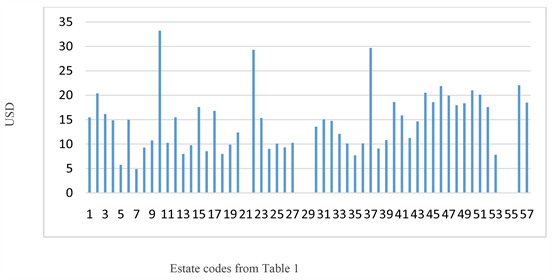
Figure 10. Average cost of water from bottled water market in USD per estate.
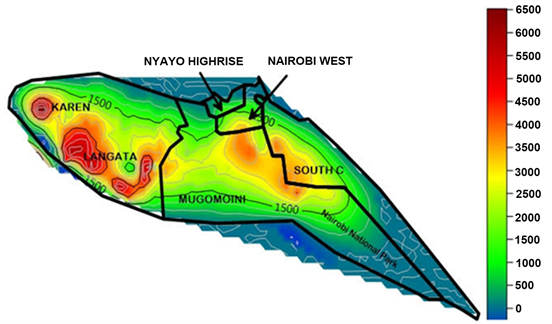
Figure 11. Contour map of combined water supply from tanker and utility company in litres.

Figure 12. Contour map of combined cost of water supply from tanker and utility company in USD.
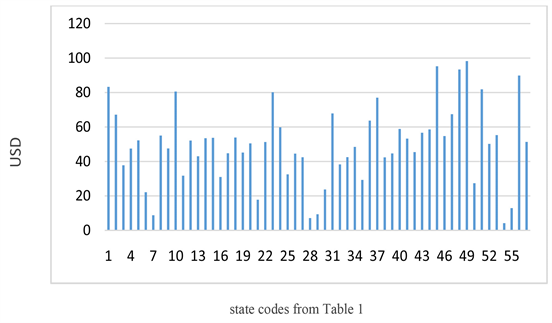
Figure 13. Average cost of combined water supply from tanker and utility company in USD per estate.
3.3.5. Combined Consumption of Tanker and Bottled Water
When it comes to combined use of Tanker and bottled water in the area, Amani court in Mugumoini ward is in the lead and KambiKisii in Karen ward is the least, see Figures 14-16 below.
3.3.6. Combined Consumption of Utility and Bottled Water
The combined consumption of utility and bottled is lead by Amana court in South C ward and is trailed by Soweto in Nyayo Highrise ward. Estates like Maasai court, Ngei 2, Sun Valley 2 in Mugumoini ward together with residences along Bogani road in Karen ward are also heavy users in this combination. KambiKisii in Karen ward, on the other hand, has zero use, see Figures 17-19.
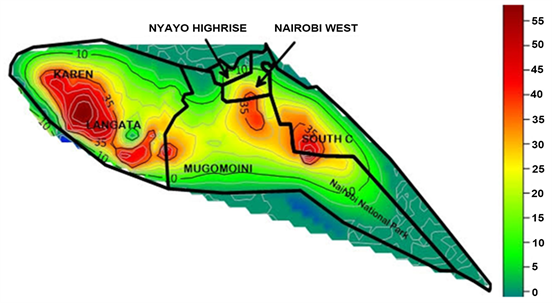
Figure 14. Contour map of combined cost in USD of water supply from tanker and bottled water market.
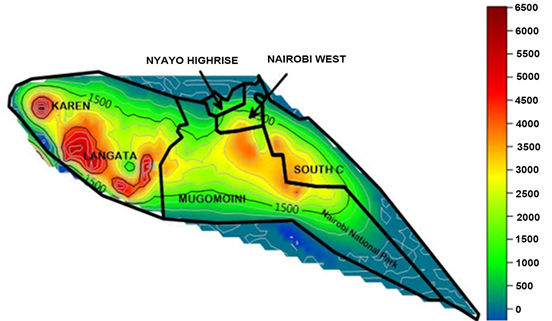
Figure 15. Contour map of combined water supply from tanker and bottled water market in litres.

Figure 16. Average cost of combined water supply from tanker and bottled water market in USD per estate.
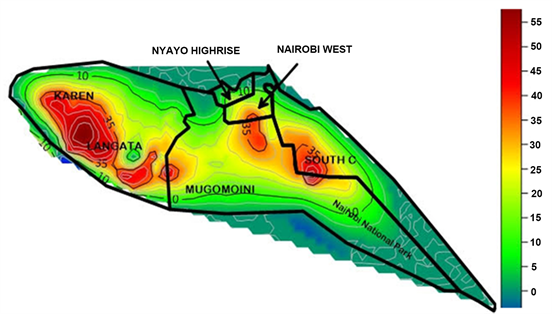
Figure 17. Contour map of combined cost in USD of water supply from utility company and bottled water market.
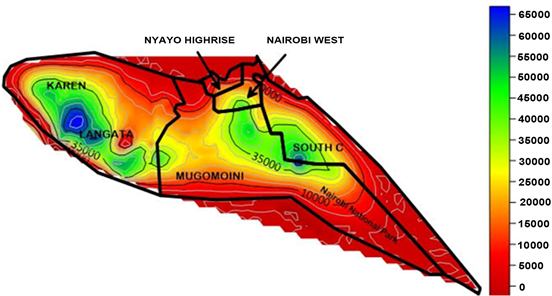
Figure 18. Contour map of combined water supply from utility company and bottled water market in litres.
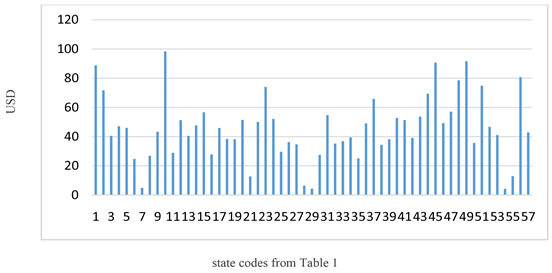
Figure 19. Average cost of combined water supply from utility company and bottled water market in USD per estate.
3.3.7. Combined Consumption of Utility, Bottled and Tanker Water
Amana court in South C ward is the heaviest consumer in the three categories combined while Jordan court in Mugumoini ward is the least user of water in the entire study area, see Figures 20-22 below.
3.3.8. Estates with Combined Monthly Water Bill over USD 100
The following estates have households who spend more than USD 100 per month on their water bills from the three sources combined; Amani court, Amana, Miotoni residents, Ojoshoa residents, and Karen Muteero, Karen Brooks and Bogani road residents. See Figure 23 below.
3.4. Cost Implications from the Ward Perspective
3.4.1. Cost Share for Each Water Source per Ward
Nyayo Highrise region pays the least for utility water on average. Karen region pays the most for utility water. Average cost across the region at USD 17.78 for utility water. This translates to approximately 35 units on average. Nyayo Highrise region pays the least for tanker water. The average cost of tanker delivery is USD 32.31 translating to about 3.3 units. Karen region pays the most for bottled water. The average cost of bottled water is USD 13.59 which translates to 0.092 units. See Figures 24-26 below.
3.4.2. Cost Share for Each Water Source per Ward in Aggregate
Karen ward spends the most on water from all sources while Highrise ward the least. Tanker water delivery accounts for the largest contribution to the water bill in all areas while bottled water the least. See figure below (note, “Karen + Langata” means Karen Ward), see Figure 27 below.
3.4.3. Volumetric Average Share as Percentage per Ward
In terms of volumetric share, South C ward receives the highest utility supply for its monthly demand at 93%. Similarly, Mugumoini ward leads in water tanker
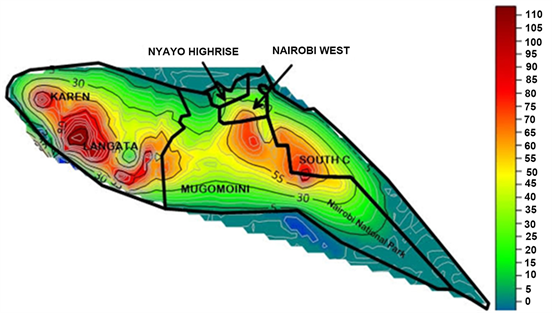
Figure 20. Contour map of combined cost in USD of water supply from utility company, bottled water market and tanker.
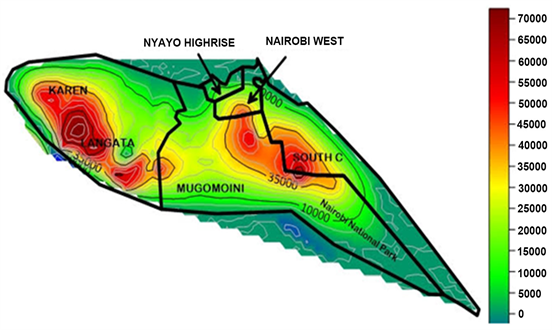
Figure 21. Contour map of combined water supply from utility company, bottled water market and tanker in litres.
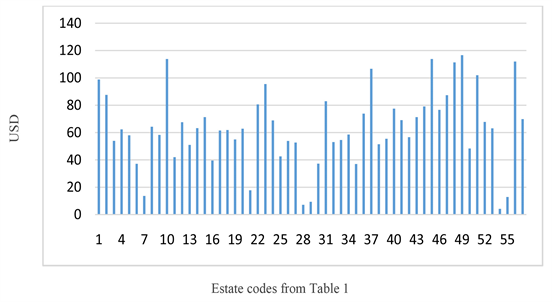
Figure 22. Average cost of combined water supply from utility company, bottled water market and tanker in USD per estate.
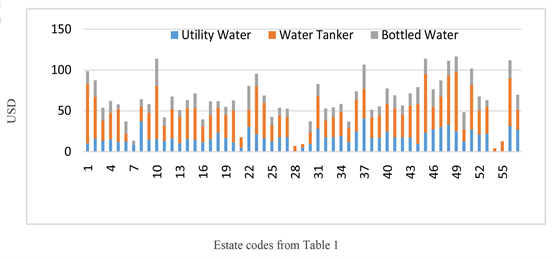
Figure 23. Average cost share of each water supply source per estate in USD.
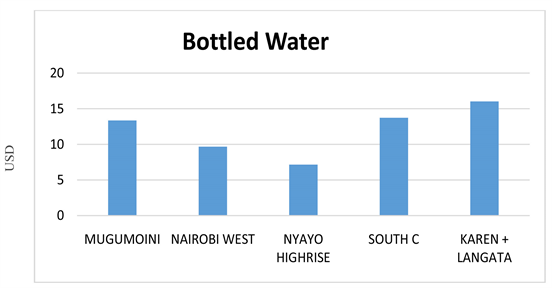
Figure 24. Average cost of bottled water supply for each ward in USD.
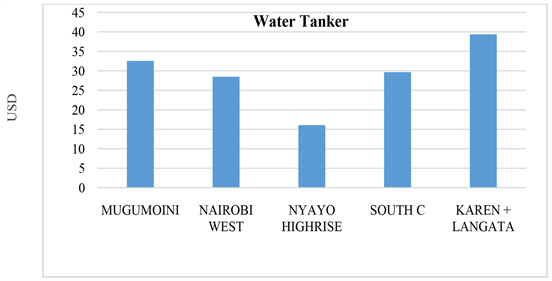
Figure 25. Average cost of tanker water supply for each ward in USD.
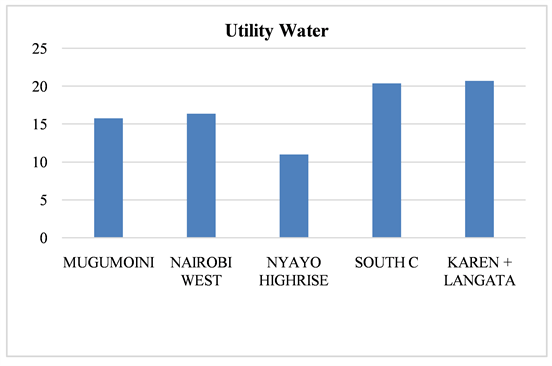
Figure 26. Average cost of water supply from utility company for each ward in USD.
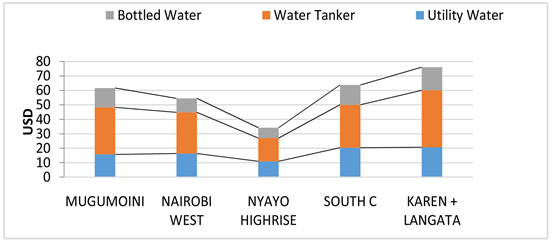
Figure 27. Average cost share of water supply source per ward in USD.
and bottled water at 9.56% and 0.27% respectively. Refer to Table 2 and figure to confirm.
Utility accounts for over 90% of the average water used across the study area. Water tanker accounts for between 7% - 9.6% and bottled water less than 0.3%, this shows that consumers due to unreliable water supply from the municipal system are suffering from the high water vendor costs. The demand gap filled by both tankers and bottled accounts for only 8.53% of the area’s water demand on average. In terms of cost, this cost is 72% of the average total water bill of each household (Total average bill is USD 63.68; utility is USD 17.78, tanker is USD32.31 and bottled water is USD 13.59). The most expensive of the three sources is bottled water accounting to 21.3% of the bill yet it only supplies 0.25% of the household water demand (see Figure 28).
From Equations (2) to (7) in section 2.2.4 above, the average Exposure Index factor (EI) is 0.29, the average Vulnerability Index (VI) is 0.29 and the average cost burden to a typical household is 258%. This means each household on average spends extra more than twice on accessing water (USD 45.9) what it should have spent if the utility supply was sufficient translating to 3.58 times the absolute average utility bill per month per family. In terms of expected standard per capita consumption [152] explains that in a day an average US family uses between 65 - 100 gallons.
This translates to approximately 246 - 378 liters per person per day. Further, for a household of 5, this would translate to 449 - 689 units per annum or 37 - 57 units of water per month. Take the average (47 units) of this range. Thus compared with the American scenario, the deficit in the study area is approximately 8.6 units per household given the average consumption are 38.4 units. The tankers only supply 3.4 units on average translating to 39.53% while bottled water fills 0.092 units on average or 1.07%. The alternatives leave out 59.4% of average household water demand unserviced if we are to go with the American reasoning. For Nairobi city, [77] had estimated a deficit of 23%. Only Karen ward and South C ward come close to the average monthly usage of 47 units getting slightly above 40 units on average i.e. 43.8 units and 45.7 units respectively, but at a huge cost.
Table 2. Volumetric average share as percentage per ward.
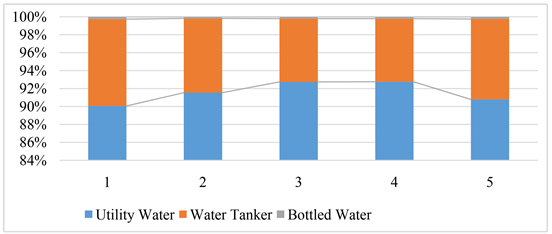
Figure 28. Percent of volumetric share of each water supply source as each ward’s average.
4. Conclusions
Urban water supply unreliability is a widespread problem particularly in the developing nations. In many places, the cost of coping is weighing quite heavily on the households. In the study area, for example, it has been established that the utility water company is the dominant source of households’ water needs at 90%. The deficit is forcing more than 90% of the residents to depend on both water tankers and bottled water supplies concurrently. The tankers deliver (9.7%) whose cost is 50.7% of the average household total monthly water bill. The bottled water which fills just 0.3% of the monthly water demand accounts to 21.3% hence grabbing for itself the trophy of being the most expensive source of water in this area. A part from the financial burden calculated at 258%, the single use plastic bottles are a hazard to the environment. In terms of equity and affordability, the situation of water security in this neighborhood is wanting.
This is in light of the fact that there are pockets of informal settlements whose residents are finding it hard to cope. These include; KwaNg’anga (Hardy area in Karen), Kuwinda and KambiKisii all in Karen ward. In Nyayo Highrise ward we have; Canaan and Soweto village. In conclusion, there is an urgent need to come up with new innovative coping measures that will improve water supply service and security in this area but which follows some laid down guidelines such as what [153] gives on the direction on cleaning and disinfection of tankers and [154] on the requisite safety practices during transportation of water in tanker trucks.
Worker in [155] also outlines sanitation rules for an emergency water supplies using tankers while [156] describes how to control microbial quality of water stored in underground tanks. Further, workers in [157] presented general regulations to govern water tankering just like [158] describes how to control dissolved chemicals in tanker water. And [159] gives a blueprint on water supply planning which is enhanced by [160] by suggestion on the monitoring of pathogenic bacteria in water storage tanks alongside [161] who explains on the management of emergency water tankering for public use. For blended water, like the case of Langata sub County where tanker delivery is stored in same tanks as water from the utility company, workers in [162] [163] [164] [165] give instructions on how to control quality. This paper hopes that the observance of these recommendations will reduce to a minimum the cost burden on consumers.
Acknowledgements
The authors are grateful for the moral support extended by the Institute for Climate Change and Adaptation (ICCA) during the research period. This study received no funding from any donor hence each of the authors has no interest attached.
Conflicts of Interest
The authors declare no conflicts of interest regarding the publication of this paper.
Cite this paper
Ochungo, E.A., Ouma, G.O., Obiero, J.P.O. and Odero, N.A. (2019) The Implication of Unreliable Urban Water Supply Service: The Case of Vendor Water Cost in Langata Sub County, Nairobi City, Kenya. Journal of Water Resource and Protection, 11, 896-935. https://doi.org/10.4236/jwarp.2019.117055
References
- 1. Scanlon, J., Casser, A. and Nemes, N. (2004) Water as a Human Right? IUCN, Gland, and Cambridge, 9, 53. https://doi.org/10.2305/IUCN.CH.2005.EPLP.51.en
- 2. Amos, et al. (2016) Economic Analysis and Feasibility of Rainwater Harvesting Systems in Urban and Peri-Urban Environments: A Review of the Global Situation with a Special Focus on Australia and Kenya. Water, 8, 149. https://doi.org/10.3390/w8040149
- 3. Buytaert, W. and De Bièvre, B. (2012) Water for Cities: The Impact of Climate Change and Demographic Growth in the Tropical Andes. Water Resources Research, 48, W08503. https://doi.org/10.1029/2011WR011755
- 4. Ahmad, M.T. (2016) The Role of Water Vendors in Water Service Delivery in Developing Countries: A Case of Dala Local Government, Kano, Nigeria. Applied Water Science, 7, 1191-1201. https://doi.org/10.1007/s13201-016-0507-z
- 5. Loucks, D.P. and van Beek, E. (2017) Urban Water Systems. In: Loucks, D.P. and van Beek, E., Eds., Water Resource Systems Planning and Management: An Introduction to Methods, Models, and Applications, Springer, Berlin, 527-565. https://doi.org/10.1007/978-3-319-44234-1_12
- 6. Pearce, R. and Evans, E. (1984) Surge Protection of Water Supply Pipelines for Jubail Industrial City. ICE Proceedings, 76, 249-268. https://doi.org/10.1680/iicep.1984.1331
- 7. Misiunas, D., Vítkovský, J., Olsson, G., Simpson, A. and Lambert, M. (2003) Pipeline Burst Detection and Location Using a Continuous Monitoring Technique. International Conference on Advances in Water Supply Management, London, 15-17 September 2003, 89-96.
- 8. Berardi, L., Ugarelli, R., Røstum, J. and Giustolisi, O. (2014) Assessing Mechanical Vulnerability in Water Distribution Networks under Multiple Failures. Water Resources Research, 50, 2586-2599. https://doi.org/10.1002/2013WR014770
- 9. Pentecost, F. (1974) Design Guidelines for Distribution Systems. Journal (American Water Works Association), 66, 332-334. http://www.jstor.org/stable/41267072 https://doi.org/10.1002/j.1551-8833.1974.tb02038.x
- 10. Gottipati, P.V.K.S.V. and Nanduri, U.V. (2013) Equity in Water Supply in Intermittent Water Distribution Networks. Water and Environment Journal, 28, 509-515. https://doi.org/10.1111/wej.12065
- 11. Hanke, S.H. (1972) Pricing Urban Water. In: Mushkin, S., Ed., Public Prices for Public Products, Urban Institute, Washington DC. https://ssrn.com/abstract=2176452
- 12. Milly, P., et al. (2008) Stationarity Is Dead: Whither Water Management? Science, 319, 573-574. https://doi.org/10.1126/science.1151915
- 13. Davis, R.K. and Hanke, S.H. (1973) Conventional and Unconventional Alternatives for Water Supply Management. Water Resources Research, 9, 861-870. https://doi.org/10.1029/WR009i004p00861
- 14. Kirmeyer, G., Friedman, M., Clement, J., Sandvig, A., Noran, P.F., Martel, K.D., Smith, D., LeChevallier, M., Volk, C., Dyksen, J. and Cushing, R. (2000) Guidance Manual for Maintaining Distribution System Water Quality. AwwaRF, Denver.
- 15. Burman, N.P. (1965) Taste and Odor Due to Stagnation and Local Warming in Long Lengths of Piping. Proceedings of the Society for Water Treatment and Examination, 14, 125-131.
- 16. Van der Kooij, D. (1990) Assimilable Organic Carbon (AOC) in Drinking Water. In: McFeters, G.A., Ed., Drinking Water Microbiology, Brock/Springer Series in Contemporary Bioscience, Springer, New York, 57-87. https://doi.org/10.1007/978-1-4612-4464-6_3
- 17. Victoreen, H.T. (1974) Control of Water Quality in Transmission and Distribution Mains. Journal of American Water Works Association, 66, 369-370. https://doi.org/10.1002/j.1551-8833.1974.tb02048.x
- 18. Khiari, D., Barrett, S., Chinn, R., Bruchet, A., Piriou, P., Matia, L., Ventura, F., Suffet, I., Gittelman, T. and Leutweiler, P. (2002) Distribution Generated Taste-and-Odor Phenomena. Water Science and Technology, 40, 129-133. https://doi.org/10.2166/wst.1999.0280
- 19. Lee, E. and Schwab, K.J. (2005) Deficiencies in Drinking Water Distribution Systems in Developing Countries. Journal of Water and Health, 3, 109-127. https://doi.org/10.2166/wh.2005.0012
- 20. Lansey, K., Mays, L.W. and Tung, Y.K. (2002) Reliability and Availability Analysis of Water Distribution. In: Mays, L.W., Ed., Urban Water Supply Handbook, McGraw Hill, New York, Chapter 10.
- 21. Trifunovic, N. (2006) Introduction to Urban Water Distribution. Unesco-IHE Lecture Note Series, Taylor and Francis Group, Abingdon-on-Thames. https://doi.org/10.1201/9780203964699
- 22. Zessler, U. and Shamir, U. (1989) Optimal Operation of Water Distribution Systems. Journal of Water Resources Planning and Management, 115, 735-752. https://doi.org/10.1061/(ASCE)0733-9496(1989)115:6(735)
- 23. Zhao, Y., Zhuang, B., Zhou, G. and Zhao, X. (2010) Study on Hydraulic Vulnerability and Risk Assessment of Water Distribution System. The 2nd Conference on Environmental Science and Information Application Technology, Wuhan, 17-18 July 2010, 576-579. https://doi.org/10.1109/ESIAT.2010.5568865
- 24. Neelakantan, T.R., Rammurthy, D., Smith, S.T. and Suribabu, C.R. (2014) Expansion and Upgradation of Intermittent Water Supply System. Asian Journal of Applied Sciences, 7, 470-485. https://doi.org/10.3923/ajaps.2014.470.485
- 25. Bagheri, A., Darijani, M., Asgary, A. and Morid, S. (2010) Crisis in Urban Water Systems during the Reconstruction Period: A System Dynamics Analysis of Alternative Policies after the 2003 Earthquake in Bam-Iran. Water Resources Management, 24, 2567-2596. https://doi.org/10.1007/s11269-009-9568-1
- 26. Alavian, V., Qaddumi, H., Dickson, E., Diez, S., Danilenko, A., Hirji, R., Puz, G., Pizarro, C., Jacobsen, M. and Blankespoor, B. (2009) Water and Climate Change: Understanding the Risks and Making Climate-Smart Investment Decisions. The World Bank, Washington DC, 47-48.
- 27. Strzepek, K., McCluskey, A., Boehlert, B., Jacobsen, M. and Fant, C. (2011) Climate Variability and Change: A Basin Scale Indicator Approach to Understanding the Risk to Water Resources Development and Management, Water Pap. 67338, World Bank, Washington DC.
- 28. Boehlert, B., Strzepek, K.M., Chapra, S.C., Fant, C., Gebretsadik, Y., Lickley, M., Martinich, J., et al. (2015) Climate Change Impacts and Greenhouse Gas Mitigation Effects on U.S. Water Quality. Journal of Advances in Modeling Earth Systems, 7, 1326-1338. https://doi.org/10.1002/2014MS000400
- 29. Yussif, A.B. (2006) Water Vending in Tamale: Water Scarcity and Its Domestic Implications. In: Studies in the Culture of Care, Vol. 3, IAS, Legon, 1-60.
- 30. Cairncross, S. and Kinnear, J. (1991) Water Vending in Urban Sudan. International Journal of Water Resources Development, 7, 267-273. https://doi.org/10.1080/07900629108722522
- 31. Kjellen, M. (2000) Complementary Water Systems in Dar es Salaam, Tanzania: The Case of Water Vending. International Journal of Water Resources Development, 16, 143-154. https://doi.org/10.1080/07900620048626
- 32. Okun, D.A. and Emst, W.R. (1987) Community Piped Water Supply Systems in Developing Countries. A Planning Manual. World Bank Technical Paper No. WTP60.
- 33. Nyarko, K.B., Odai, S.N., Owusu, P.A. and Quartey, E.K. (2008) Water Supply Coping Strategies in Accra. 33rd WEDC International Conference: Access to Sanitation and Safe Water: Global Partnerships and Local Actions, Accra, 417-420.
- 34. Tutu, R.A. and Stoler, J. (2016) Urban But off the Grid: The Struggle for Water in Two Urban Slums in Greater Accra, Ghana. African Geographical Review, 35, 212-226. https://doi.org/10.1080/19376812.2016.1168309
- 35. Wutich, et al. (2016) Can Informal Water Vendors Deliver on the Promise of a Human Right to Water? Results from Cochabamba, Bolivia. World Development, 79, 14-24. https://doi.org/10.1016/j.worlddev.2015.10.043
- 36. Abdul-Wahab, M. and Hussaini, B. (2015) Insights into Small Scale Commercial Water Services in Nigerian Urban Area. Jurnal Teknologi (Sciences & Engineering), 77, 77-84. https://doi.org/10.11113/jt.v77.6449
- 37. van Dijk, M.P. (2008) Role of Small-Scale Independent Providers in Water and Sanitation. International Journal of Water, 4, 275-289. https://doi.org/10.1504/IJW.2008.019498
- 38. Nyamekye, et al. (2016) Women’s Informal Water Vending as an Economic Activity and Its Effects on Household Bargaining Dynamics in Northern Ghana. Research on Humanities and Social Sciences, 6, 71-84. https://www.iiste.org/Journals/index.php/RHSS/article/view/28511
- 39. Ranganathan, M. (2014) “Mafias” in the Waterscape: Urban Informality and Everyday Public Authority in Bangalore. Water Alternatives, 7, 89-105.
- 40. Mustafa, D. and Talozi, S. (2018) Tankers, Wells, Pipes and Pumps: Agents and Mediators of Water Geographies in Amman, Jordan. Water Alternatives, 11, 916-932.
- 41. Constantine, K., Massoud, M., Alameddine, I. and El-Fadel, M. (2017) The Role of the Water Tankers Market in Water Stressed Semi-Arid Urban Areas: Implications on Water Quality and Economic Burden. Journal of Environmental Management, 188, 85-94. https://doi.org/10.1016/j.jenvman.2016.11.065
- 42. Dale, W., Lauria, D.T., Okun, D.A. and Mu, X. (1989) Water Vending Activities in Developing Countries. International Journal of Water Resources Development, 5, 158-168. https://doi.org/10.1080/07900628908722429
- 43. Zaroff, B. and Okun, D.A. (1984) Water Vending in Developing Countries. Aqua, 5, 289-295.
- 44. Bakker, K. (2003) Archipelagos and Networks: Urbanization and Water Privatization in the South. The Geographical Journal, 169, 328-341. https://doi.org/10.1111/j.0016-7398.2003.00097.x
- 45. Debomy, G.S. (2000) Study of Individual Water Vendors and Water Vendors Association at Teshi—Nungua and Nima, Ghana. Project 5, Water Utilities Partnership.
- 46. Ong’or, B. and Long Cang, S. (2007) Water-Supply Crisis and Mitigation Options in Kisumu City, Kenya. International Journal of Water Resources Development, 23, 485-500. https://doi.org/10.1080/07900620701488554
- 47. Pattanayak, S.K., Yang, J.-C., Whittington, D. and Bal Kumar, K.C. (2005) Coping with Unreliable Public Water Supplies: Averting Expenditures by Households in Kathmandu, Nepal. Water Resources Research, 41, W02012. https://doi.org/10.1029/2003WR002443
- 48. Baisa, B., Davis, L.W., Salant, S.W. and Wilcox, W. (2010) The Welfare Costs of Unreliable Water Service. Journal of Development Economics, 92, 1-12. https://doi.org/10.1016/j.jdeveco.2008.09.010
- 49. Zérah, M.-H. (2000) Household Strategies for Coping with Unreliable Water Supplies: The Case of Delhi. Habitat International, 24, 295e307. https://doi.org/10.1016/S0197-3975(99)00045-4
- 50. Israel, D.K. (2007) Impact of Increased Access and Price on Household Water Use in Urban Bolivia. The Journal of Environment & Development, 16, 58-83. https://doi.org/10.1177/1070496506298190
- 51. Dziegielewski, B. and Crews, J.E. (1986) Minimizing the Cost of Coping with Droughts: Spring-field, Illinois. Journal of Water Resources Planning and Management, 112, 419-438. https://doi.org/10.1061/(ASCE)0733-9496(1986)112:4(419)
- 52. Kudat, A., Bell, M., Boland, J., Humplick, F., Madanat, S. and Mukherjee, N. (1993) Reliability of Urban Water Supply in Developing Countries: The Emperor Has No Clothes. In: World Bank Research Observer, World Bank, Washington DC.
- 53. Maass, A. and Anderson, R. (1978) ... and the Desert Shall Rejoice: Conflict, Growth and Justice in Arid Environments. MIT Press, Cambridge.
- 54. Islam, M.S. (2012) Water Distribution System Failures: An Integrated Framework for Prognostic and Diagnostic Analyses. PhD Thesis, The University of British Columbia, Vancouver.
- 55. Walski, T.M., Chase, D.V., Savic, D.A., Grayman, W., Beckwith, S. and Koelle, E. (2003) Advanced Water Distribution Modeling and Management. Civil and Environmental Engineering and Engineering Mechanics Faculty Publications. 18.
- 56. Collignon, B. and Vezina, M. (2000) Independent Water and Sanitation Providers in African Cities: Full Report of a Ten-Country Study. Water and Sanitation Program, World Bank, Washington DC. http://documents.worldbank.org/curated/en/327341468280743783/Independ-ent-water-and-sanitation-providers-in-African-cities-full-report-of-a-ten-country-study
- 57. Vörösmarty, C.J., Green, P., Salisbury, J. and Lammers, R.B. (2000) Global Water Resources: Vulnerability from Climate Change and Population Growth. Science, 289, 284. https://doi.org/10.1126/science.289.5477.284
- 58. Mekonnen, M.M. and Hoekstra, A.Y. (2016) Four Billion People Facing Severe Water Scarcity. Science Advances, 2, e1500323. https://doi.org/10.1126/sciadv.1500323
- 59. Albu, M. and Njiru, C. (2002) The Role of Small-Scale Providers in Urban Areas. Waterlines, 20, 16-18. https://doi.org/10.3362/0262-8104.2002.007
- 60. Orr, S. and Cartwright, A. (2010) Water Scarcity Risks: Experience of the Private Sector. Chapter 10.
- 61. Molinos-Senante, M. and Donoso, G. (2016) Water Scarcity and Affordability in Urban Water Pricing: A Case Study of Chile. Utilities Policy, 43, 107-116. https://doi.org/10.1016/j.jup.2016.04.014
- 62. Cernesson, F., Echavarren, J.M., Enserink, B., Kranz, N., Maestu, J., et al. (2006) Learning Together to Manage Together: Improving Participation in Water Management. Harmonising Collaborative Planning (HarmoniCOP), 99.
- 63. Braimah, I., ObengNti, K. and Amponsah, O. (2017) Poverty Penalty in Urban Water Market in Ghana. Urban Forum, 29, 147-168. https://doi.org/10.1007/s12132-017-9328-x
- 64. Mendoza, R.U. (2008) Why Do the Poor Pay More? Exploring the Poverty Penalty Concept. Journal of International Development, 23, 1-28. https://doi.org/10.1002/jid.1504
- 65. Ablo, A.D. and Yekple, E.E. (2017) Urban Water Stress and Poor Sanitation in Ghana: Perception and Experiences of Residents in the Ashaiman Municipality. GeoJournal, 83, 583-594. https://doi.org/10.1007/s10708-017-9787-6
- 66. Gerlach, E. and Franceys, R. (2010) Regulating Water Services for All in Developing Economies. World Development, 38, 1229-1240. https://doi.org/10.1016/j.worlddev.2010.02.006
- 67. Jones, A.Q., Dewey, C.E., Doré, K., Majowicz, S.E., McEwen, S.A., Waltner-Toews, D., Mathews, E., et al. (2005) Public Perception of Drinking Water from Private Water Supplies: Focus Group Analyses. BMC Public Health, 5, 129. https://doi.org/10.1186/1471-2458-5-129
- 68. Celik, E. and Muhammetoglu, H. (2008) Improving Public Perception of Tap Water in Antalya City, Turkey. Journal of Water Supply: Research and Technology Aqua, 57, 109-113. https://doi.org/10.2166/aqua.2008.040
- 69. Dolnicar, S., Hurlimann, A. and Nghiem, L.D. (2010) The Effect of Information on Public Acceptance—The Case of Water from Alternative Sources. Journal of Environmental Management, 91, 1288-1293. https://doi.org/10.1016/j.jenvman.2010.02.003
- 70. Dolnicar, S., Hurlimann, A. and Grün, B. (2014) Branding Water. Water Research, 57, 325-338. https://doi.org/10.1016/j.watres.2014.03.056
- 71. Kujinga, et al. (2014) Short and Long Term Strategies for Household Water Insecurity in Ngamiland, Botswana. Journal of Sustainable Development, 7, 96. https://doi.org/10.5539/jsd.v7n3p96
- 72. Maurya, V.N., Misra, R.B., Anderson, P.K. and Vashist, S. (2016) A Case Study on Water Supply Access and Demand Using Descriptive Statistical Methods. American Journal of Biological and Environmental Statistics, 2, 7-12. https://doi.org/10.11648/j.ajbes.20160202.11
- 73. UNDP (2011) Small Scale Water Providers in Kenya: Pioneers or Predators. United Nations Development Programme, United Nations Plaza, New York, 1.
- 74. Ledant, M. (2013) Water in Nairobi: Unveiling Inequalities and Its Causes. Les Cahiers d’OutreMer, 263, 335-348. https://doi.org/10.4000/com.6951
- 75. Cherunya, et al. (2015) Sustainable Supply of Safe Drinking Water for Underserved Households in Kenya: Investigating the Viability of Decentralized Solutions. Water, 7, 5437-5457. https://doi.org/10.3390/w7105437
- 76. Guma, P.K. (2019) Smart Urbanism? ICTs for Water and Electricity Supply in Nairobi. Urban Studies Journal, 56, 2333-2352. https://doi.org/10.1177/0042098018813041
- 77. Ombuna, C., Mwetu, K. and Mochoge, B. (2018) The Adoption of Roof Catchment Rainwater Harvesting and Major Water Sources in Nairobi County, Kenya. Africa International Journal of Multidisciplinary Research, 2, 8-14.
- 78. Haestad Methods, I., Walski, T.M., Chase, D.V., Savic, D.A., Grayman, W., Beckwith, S. and Koelle, E. (2003) Advanced Water Distribution Modeling and Management. Haestad Methods Inc., Waterbury.
- 79. Ormsbee, L.E. (2006) The History of Water Distribution Network Analysis: The Computer Age. 8th Annual Water Distribution System Analysis Symposium, Cincinnati, 27-30 August 2006, 1-6.
- 80. Mays, L., Koutsoyiannis, D. and Angelakis, A. (2007) A Brief History of Urban Water Supply in Antiquity. Water Science & Technology: Water Supply, 7, 1-12. https://doi.org/10.2166/ws.2007.001
- 81. Hanke, S.H. and Wentworth, R.W. (1981) On the Marginal Cost of Wastewater Services. Land Economics, 57, 558-567.
- 82. Uber, J.G. and Summers, R.S. (2003) Maintaining Distribution System Residuals through Booster Chlorination. AwwaRF, Denver.
- 83. Baker, M.N. (1948) The Quest for Pure Water. American Water Works Association, New York.
- 84. Clark, C.S., Bjornson, J., Schwartz-Fulton, J.W., Holland, J.W. and Gatside, P.S. (1984) Biological Health Risks Associated with Composting of Wastewater Treatment Plant Sludge. Journal (Water Pollution Control Federation), 56, 1269-1276.
- 85. Evans, A. (1921-1935) The Palace of Minos at Knossos: A Comparative Account of the Successive Stages of the Early Cretan Civilization as Illustrated by the Discoveries. Vols. I-IV, Macmillan and Co., London.
- 86. National Academy of Sciences (2006) Drinking Water Distribution Systems: Assessing and Reducing Risks. National Academies Press, Washington DC. http://www.nap.edu
- 87. Clark, R.M., Ehreth, D.J. and Convery, J.J. (1991) Water Legislation in the U.S.: An Overview of the Safe Drinking Water Act. Toxicology and Industrial Health, 7, 43-52. https://doi.org/10.1177/074823379100700507
- 88. Clark, R.M. (1978) The Safe Drinking Water Act Implication for Planning. In: Holtz, D., Ed., Municipal Water and Systems—Scott The Challenge for Urban Resources Management, Sebastian, Holcomb Research Institute, Indiana University Press, Bloomington, 117-137.
- 89. Grindler, B.J. (1967) Water and Water Rights: A Treatise on the Laws of Water and Allied Problems: Eastern, Western, Federal. Vol. 3, The Allan Smith Company, Indianapolis.
- 90. Ermac, E.A. and Malabago, N.K. (2013) Water Dispenser: A Unique Innovative Design That Matters. European Scientific Journal, 11, 122-127.
- 91. Mays, L. (2004) Water Distribution Systems Handbook.
- 92. Kjellén, M. and McGranahan, G. (2006) Informal Water Vendors and the Urban Poor. International Institute for Environment and Development, London. https://www.iied.org/human-settlements-research-group
- 93. Foeken, et al. (2013) Urban Water Interventions and Livelihoods in Low-Income Neighbourhoods in Kisumu, Kenya. African Studies Centre, Oxford.
- 94. Ampadu-Boakye, J., Yeboah, C., Tetteh-Zomayi, F., Gimble, A., Crooks, H., Stea, B. and Hebert, R. (2016) Ghana Market Assessment: Market-Based Provision of Water at the Community Level. Executive Summary, Safe Water Network, New York.
- 95. Elala, D., Labhasetwar, P. and Tyrrel, S.F. (2011) Deterioration in Water Quality from Supply Chain to Household and Appropriate Storage in the Context of Intermittent Water Supplies. Water Science and Technology: Water Supply, 11, 400-408. https://doi.org/10.2166/ws.2011.064
- 96. McGranahan, G., Kasper, E. and Maestre, M. (2017) Market Systems Development in the Cities of Rapidly Urbanising Countries. The BEAM Exchange. http://www.beamexchange.org
- 97. Matsinhe, N.P., Juizo, D., Rietveld, L.C. and Persson, K.M. (2008) Water Services with Independent Providers in Periurban Maputo: Challenges and Opportunities for Long-Term Development. Water SA, 34, 411-420.
- 98. Ayalew, M., Chenoweth, J., Malcolm, R., Mulugetta, Y., Okotto, L.G. and Pedley, S. (2013) Small Independent Water Providers: Their Position in the Regulatory Framework for the Supply of Water in Kenya and Ethiopia. Journal of Environmental Law, 26, 105-128. https://doi.org/10.1093/jel/eqt028
- 99. Srinivasan, et al. (2010) Factors Determining Informal Tanker Water Markets in Chennai, India. Water International, 35, 254-269. https://doi.org/10.1080/02508060.2010.487931
- 100. Jaffee, D. and Newman, S. (2012) A Bottle Half Empty. A Bottle Half Empty: Bottled Water, Commodification, and Contestation. Organization & Environment, 26, 318-335. https://doi.org/10.1177/1086026612462378
- 101. Jaffee, D. and Newman, S. (2012) A More Perfect Commodity: Bottled Water, Global Accumulation, and Local Contestation. Rural Sociology, 78, 1-28. https://doi.org/10.1111/j.1549-0831.2012.00095.x
- 102. Khater, A.E.M., Al-Jaloud, A. and El-Taher, A. (2014) Quality Level of Bottled Drinking Water Consumed in Saudi Arabia. Journal of Environmental Science and Technology, 7, 90-106. https://doi.org/10.3923/jest.2014.90.106
- 103. Stephenson, J.B. (2009) Bottled Water: FDA Safety and Consumer Protections Are Often Less Stringent than Comparable EPA Protections for Tap Water. U.S. General Accounting Office, Washington DC.
- 104. Carlucci, et al. (2016) Competitive Strategies of Italian Bottled Water Industry: Evidence from a Hedonic Analysis. Rivista Di Economia Agraria, 71, 292-304.
- 105. Bartol, et al. (2011) Marketing of Bottled Water: Business and Ethical Issues. Insight: River Academic Journal, 7, 1-8.
- 106. Magda, et al. (2008) Quality of Bottled Water Brands in Egypt Part II: Biological Water Examination. Journal of the Egyptian Public Health Association, 83, 468-486.
- 107. Napier, G.L. and Kodner, C.M. (2008) Health Risks and Benefits of Bottled Water. Primary Care: Clinics in Office Practice, 35, 789-802. https://doi.org/10.1016/j.pop.2008.07.008
- 108. Hawkins, G. (2011) Packaging Water: Plastic Bottles as Market and Public Devices. Economy and Society, 40, 534-552. https://doi.org/10.1080/03085147.2011.602295
- 109. Njeru, J.M. (2016) Factors Influencing Customer Choice of Bottled Water Brands: A Case of Nairobi Central Business District. Master Degree Thesis, United States International University Africa, Nairobi.
- 110. Briest, P. and Krysta, P. (2011) Buying Cheap Is Expensive: Approximability of Combinatorial Pricing Problems. SIAM Journal on Computing, 40, 1554-1586. https://doi.org/10.1137/090752353
- 111. Asenso-Boadi, F.M. and Vondolia, G.K. (2013) Private Sector Participation in the Provision of Quality Drinking Water in Ghana’s Urban Areas: Are People Willing to Pay? AERC Research Paper 262, African Economic Research Consortium, Nairobi.
- 112. Gleick, P.H. (1996) Basic Water Requirements for Human Activities: Meeting Basic Needs. Water International, 21, 83-92. https://doi.org/10.1080/02508069608686494
- 113. Nnaji, C.C., Eluwa, C. and Nwoji, C. (2013) Dynamics of Domestic Water Supply and Consumption in a Semi-Urban Nigerian City. Habitat International, 40, 127-135. https://doi.org/10.1016/j.habitatint.2013.03.007
- 114. Craun, G.F., Brunkard, J.M., Yoder, J.S., Roberts, V.A., Carpenter, J., Wade, T., Roy, S.L., et al. (2010) Causes of Outbreaks Associated with Drinking Water in the United States from 1971 to 2006. Clinical Microbiology Reviews, 23, 507-528. https://doi.org/10.1128/CMR.00077-09
- 115. Shah, T. (2007) Issues in Reforming Informal Water Economies of Low-Income Countries: Examples from India and Elsewhere. International Water Management Institute, South Asia Program, Colombo.
- 116. Van Koppen, B., van der Zaag, P., Manzungu, E. and Tapela, B. (2013) Roman Water Law in Rural Africa: The Unfinished Business of Colonial Dispossession. Water International, 39, 49-62. https://doi.org/10.1080/02508060.2013.863636
- 117. Raina, A., Gurung, Y. and Suwal, B. (2018) Equity Impacts of Informal Private Water Markets: Case of Kathmandu Valley. Water Policy, wp2018138. https://doi.org/10.2166/wp.2018.138
- 118. Saunders, R.J. and Warford, J.J. (1976) Village Water Supply: Economics and Policy in the Developing World. A World Bank Research Publication. The Johns Hopkins University, Baltimore.
- 119. Harris, et al. (2012) The Political Economy of the Urban Water-Pricing Regime in Freetown, Sierra Leone. Working Paper 348, Overseas Development Institute, London.
- 120. Meran, G. and von Hirschhausen, C. (2014) Increasing Block Tariffs in the Water Sector: An Interpretation in Terms of Social Preferences. DIW Discussion Papers, No. 1434, Deutsches Institutfür Wirtschaftsforschung (DIW), Berlin. https://doi.org/10.2139/ssrn.2553084
- 121. Zhong, L. and Mol, A.P.J. (2010) Water Price Reforms in China: Policy-Making and Implementation. Water Resources Management, 24, 377-396. https://doi.org/10.1007/s11269-009-9451-0
- 122. Banerjee, S., Foster, V., Ying, Y., Skilling, H. and Wodon, Q. (2010) Cost Recovery, Equity, and Efficiency in Water Tariffs: Evidence from African Utilities. Policy Research Working Paper No. WPS 5384, World Bank, Washington DC.
- 123. Whittington, D. (1992) Possible Adverse Effects of Increasing Block Tariffs in Developing Countries. Economic Development and Cultural Change, 41, 75-87. https://doi.org/10.1086/451996
- 124. Dahan, M. and Nisan, U. (2007) Unintended Consequences of Increasing Block Tariffs Pricing Policy in Urban Water. Water Resources Research, 43. https://doi.org/10.1029/2005WR004493
- 125. Whittington, D. and Boland, J. (2000) Water Tariff Design in Developing Countries: Disadvantages of Increasing Block Tariffs and Advantages of Uniform Block Tariff with Rebate Designs. In: Dinar, A., Ed., The Political Economy of Water Pricing Reforms, Oxford University Press, Washington DC, 215-235.
- 126. Briscoe, J. (1997) Managing Water as an Economic Good: Rules for Reformers. The International Committee on Irrigation and Drainage Conference on Water as an Economic Good, Oxford.
- 127. Dinar, A. and Saleth, R.M. (2005) Issues in Water Pricing Reforms: From Getting Correct Prices to Setting Appropriate Institutions. In: Folmer, H. and Tietenberg, T., Eds., The International Yearbook of Environmental and Resource Economics, Edward Elgar, Cheltenham, Northampton.
- 128. Le Blanc, D. (2008) A Framework for Analyzing Tariffs and Subsidies in Water Provision to Urban Households in Developing Countries. DESA Working Paper No. 63, United Nations, Department of Economic and Social Affairs, New York.
- 129. Joskow, P. (2005) Regulation of Natural Monopolies. Center for Energy and Environmental Policy Research, 05-008 WP.
- 130. Komives, K., Foster, V., Halpern, J., Wodon, Q. with Abdullah, R. (2005) Water, Electricity, and the Poor—Who Benefits from Utility Subsidies? The World Bank, Washington DC. https://doi.org/10.1596/978-0-8213-6342-3
- 131. Rogers, P., de Silva, R. and Bhatia, R. (2002) Water Is an Economic Good: How to Use Prices to Promote Equity, Efficiency, and Sustainability. Water Policy, 4, 1-17. https://doi.org/10.1016/S1366-7017(02)00004-1
- 132. Whittington, D. (2003) Municipal Water Pricing and Tariff Design: A Reform Agenda for South Asia. Water Policy, 5, 61-76. https://doi.org/10.2166/wp.2003.0003
- 133. Letsoalo, et al. (2007) Triple Dividends of Water Consumption Charges in South Africa. Water Resources Research, 43, W05412. https://doi.org/10.1029/2005WR004076
- 134. Fuente, et al. (2015) Water and Sanitation Service Delivery, Pricing, and the Poor: An Empirical Estimate of Subsidy Incidence in Nairobi, Kenya. Environment for Development. EfD DP 15-17-Discussion Paper Series July 2015.
- 135. Kariuki, M. and Schwartz, J. (2005) Small-Scale Private Service Providers of Water Supply and Electricity: A Review of Incidence, Structure, Pricing, and Operating Characteristics, Energy and Water Department. World Bank, Washington DC. https://doi.org/10.1596/1813-9450-3727
- 136. Arvonen, V., Kibocha, S.N., Katko, T.S. and Pietilä, P. (2017) Features of Water Cooperatives: A Comparative Study of Finland and Kenya. Public Works Management & Policy, 22, 356-377. https://doi.org/10.1177/1087724X17715267
- 137. Mansour, G., Oyaya, C. and Owor, M. (2017) Situation Analysis of the Urban Sanitation Sector in Kenya. WSUP Water & Sanitation for the Urban Poor.
- 138. Sunman, H. (2017) History of Water Supply and Governance in Kenya (1895-2005): Lessons and Futures. Ezekiel Nyangeri Nyanchaga. 2016, p. 618. Tampere University Press, Finland. ISBN: 978-952-03-0060-9. Water Policy, 19, 788-790. https://doi.org/10.2166/wp.2017.000
- 139. Bhatt, J. (2013) Comparison of Small-Scale Providers’ and Utility Performance in Urban Water Supply: The Case of Maputo, Mozambique. Water Policy, 16, 102-123. https://doi.org/10.2166/wp.2013.083
- 140. Majuru, et al. (2016) How Do Households Respond to Unreliable Water Supplies? A Systematic Review. International Journal of Environmental Research and Public Health, 13, 1222. https://doi.org/10.3390/ijerph13121222
- 141. Nnaji, et al. (2019) Storage-Induced Deterioration of Domestic Water Quality. Journal of Water, Sanitation and Hygiene for Development, 9, 329-337. https://doi.org/10.2166/washdev.2019.151
- 142. Litwin, C.M., Asebiomo, B., Wilson, K., Hafez, M., Stevens, V., Fliermans, C.B., Fisher, J.F., et al. (2013) Recreational Vehicle Water Tanks as a Possible Source for Legionella Infections. Case Reports in Infectious Diseases, 2013, Article ID: 286347. https://doi.org/10.1155/2013/286347
- 143. Stoler, J. (2017) From Curiosity to Commodity: A Review of the Evolution of Sachet Drinking Water in West Africa. WIREs Water, 2017, e1206. https://doi.org/10.1002/wat2.1206
- 144. Opryszko, M.C., Guo, Y., Mac-Donald, L., MacDonald, L., Kiihl, S. and Schwab, K.J. (2013) Impact of Water Vending Kiosks and Hygiene Education on Household Drinking Water Quality in Rural Ghana. The American Journal of Tropical Medicine and Hygiene, 88, 651-660. https://doi.org/10.4269/ajtmh.12-0065
- 145. Wambua, S. (2004) Water Privatization in Kenya. Global Issue Papers No. 8, March 2004.
- 146. (2015) Veolia Water Technologies Undertakes Water Audit for Thai Paper Products Supplier. Pump Industry Analyst, 2015, 3. https://doi.org/10.1016/S1359-6128(15)30227-5
- 147. Blomkvist, P. and Nilsson, D. (2017) On the Need for System Alignment in Large Water Infrastructure: Understanding Infrastructure Dynamics in Nairobi, Kenya. Water Alternatives, 10, 283-302.
- 148. Munguti, K.-K. and Mcgranahan, G. (2002) Public Private Partnerships and the Poor: Small Enterprises and Water Provision in Kibera, Nairobi. WEDC, Loughborough University, Loughborough.
- 149. Allen, I.E. and Seaman, C.A. (2007) Likert Scales and Data Analyses. Quality Progress, 40, 64-65.
- 150. Singh, A.S. and Masuku, M.B. (2014) Sampling Techniques & Determination of Sample Size in Applied Statistics Research: An Overview. International Journal of Economics, Commerce and Management, 2, 1-22.
- 151. Watson, J. (2001) How to Determine a Sample Size. Tipsheet #60. Penn State Cooperative Extension, University Park.
- 152. Lee, M., Tansel, B. and Balbin, M. (2011) Influence of Residential Water Use Efficiency Measures on Household Water Demand: A Four Year Longitudinal Study. Resources, Conservation and Recycling, 56, 1-6. https://doi.org/10.1016/j.resconrec.2011.08.006
- 153. WHO (2005) Cleaning and Disinfecting Water Storage Tanks and Tankers. Technical Notes for Emergencies, Technical Note No. 3.
- 154. Falakh, F. and Setiani, O. (2018) Hazard Identification and Risk Assessment in Water Treatment Plant Considering Environmental Health and Safety Practice. E3S Web of Conferences, 31, Article ID: 06011. https://doi.org/10.1051/e3sconf/20183106011
- 155. Abu-Lohom, N.M., Konishi, Y., Mumssen, Y., Zabara, B. and Moore, S.M. (2018) Water Supply in a War Zone: A Preliminary Analysis of Two Urban Water Tanker Supply Systems in the Republic of Yemen. World Bank, Washington DC. https://doi.org/10.1596/30107
- 156. Singh, U., Jackson, S., Lutchmanariyan, R., Wright, J., Gounden, T., Knight, S., Langmark, J., Vosloo, D. and Rodda, N. (2013) Microbial Quality of Drinking Water from Groundtanks and Tankers at Source and Point-of-Use in eThekwini Municipality, South Africa, and Its Relationship to Health Outcomes. Water SA, 39. 663. https://doi.org/10.4314/wsa.v39i5.11
- 157. Regulation and Supervision Bureau-Arab Emirates Government (2017) Tankering Regulations and Guides Consultation. http://rsb.gov.ae/assets/documents/192316/consultationtankeringregulationsandguidesmay2017.pdf
- 158. Wadia, A. and Kataria, R. (2017) Study of Tanker Water in Mumbai for Its Role in Spreading Waterborne Diseases and Other Health Hazards Related to Dissolved Chemicals. International Journal of Current Research International Journal of Current Research, 9, 45018-45021.
- 159. U.S. Army Corps of Engineers (1998) Water Supply Handbook: A Handbook on Water Supply Planning and Resource Management. USACE Institute for Water Resources, Water Resource Support Center, Revised Report 96-PS-4.
- 160. Peter, A. and Routledge, E. (2018) Present-Day Monitoring Underestimates the Risk of Exposure to Pathogenic Bacteria from Cold Water Storage Tanks. PLoS ONE, 13, e0195635. https://doi.org/10.1371/journal.pone.0195635
- 161. Washington State Department of Health (WDOH) (2017) Truck Transportation—Emergency Water Supply for Public Use. Office of Drinking Water, Tumwater.
- 162. Kippin, S.J., Pet, J.R., Marshall, J.S. and Marshall, J.M. (2001) Water Quality Impacts from Blending Multiple Water Types. AWWA Research Foundation, Denver.
- 163. Taylor, J.S., Dietz, J.D., Randall, A.A., Hong, S.K., Norris, C.D., Mulford, L.A., Arevalo, J.M., Imran, S., Le Puil, M., Liu, S., Mutoti, I., Tang, J., Xiao, W., Cullen, C., Heaviside, R., Mehta, A., Patel, M., Vasquez, F. and Webb, D. (2005) Effects of Blending on Distribution System Water Quality. AWWA Research Foundation, Denver.
- 164. Edwards, J. and Maher, J. (2008) Water Quality Considerations for Distribution System Storage Facilities. Journal—American Water Works Association, 100, 60-65. https://doi.org/10.1002/j.1551-8833.2008.tb09676.x
- 165. Martel, K.D., Kirmeyer, G.J., Murphy, B.M., Noran, P.F., Kirby, L., Lund, T.W., Anderson, J.L., Medhurst, R. and Capara, M. (2002) Preventing Water Quality Deterioration in Finished Water Storage Facilities. Journal—American Water Works Association, 94, 139-148. https://doi.org/10.1002/j.1551-8833.2002.tb09458.x