Journal of Water Resource and Protection
Vol.6 No.6(2014), Article ID:45460,17 pages DOI:10.4236/jwarp.2014.66057
Assessment of the Impact of the Grand Ethiopian Renaissance Dam on the Performance of the High Aswan Dam
Asegdew G. Mulat, Semu A. Moges
School of Civil and Environmental Engineering, AAIT, Addis Ababa University, Addis Ababa, Ethiopia
Email: gasegdew@yahoo.com, semu_moges_2000@yahoo.com
Copyright © 2014 by authors and Scientific Research Publishing Inc.
This work is licensed under the Creative Commons Attribution International License (CC BY).
http://creativecommons.org/licenses/by/4.0/


Received 9 February 2014; revised 8 March 2014; accepted 5 April 2014
ABSTRACT
A Large scale hydropower dam known as Grand Ethiopian Renaissance Dam (GERD) is under construction on the Blue Nile River just upstream of the Ethiopian-Sudan border in Ethiopia. The GERD has an active storage capacity of more than 60,000 Mm3 and is anticipated to produce 6000 MW of hydropower energy. The aim of this study was to assess the potential impact of the dam on the performance of the High Aswan Dam (HAD) during filling and operation phases using a simulation model using Mike Basin river basin simulation model. The results indicate the planned 6 years filling period is sufficient to fill the reservoir with little impact on the current irrigation water demands from HAD in Egypt without additional management investment. There will be about 12% and 7% of reduction of annual energy output from High Aswan Dam during the filling and after filling stage of GERD respectively. Cumulative Energy production from the two dams will increase significantly Water loss at HAD due to evaporation will decreases by 22%. Overall performance of HAD during and after filling of the GERD remains at a reliability level of 96%. The study advises to utilize the results cautiously as it is based on only one historical realization of the many possible scenarios that may evolve in the future.
Keywords:Impounding Impact, Renaissance Dam, Abbay River Basin, Eastern Nile

1. Introduction
The Nile represents a crucial resource for the economy of eastern and north-eastern Africa. The basin has two important water supply sources and one important water user groups. The water supply sources are the Easter Nile (Ethiopia) which contributes almost 85% of the flow of the Nile and Eastern equatorial Nile (Nile Equatorial countries) which contributes 15% of the flow. Water is emerging as the critical resource in the entire basin due to population pressure, hydrological variability and the desire of the economic development of upstream countries.
The water resources availability and uses are unevenly distributed amongst the countries: Egypt and Sudan are the largest water consumers while this is negligible for Ethiopia, even though 85% of the Nile waters come from Ethiopian highlands. Both Egypt, and to a lesser extent Sudan, are almost wholly dependent on water that originates from the Nile with significant irrigation in both countries [1] . In contrast Ethiopia has developed less than 5% of the irrigable land in the basin and less than 3% of the hydropower potential [2] . Ethiopia possesses abundant water resources and hydropower potential, second only to the Democratic Republic of Congo in all of Africa [3] . Currently, 83% of Ethiopia’s population lacks access to electricity, with 94% still relying on fuel wood for daily cooking and heating [4] . The Ethiopian government is therefore pursuing ambitious plans and programs to develop hydropower in an effort to substantially reduce poverty and create an atmosphere for social change. This would be an impressive upgrade over the existing hydroelectric power within Ethiopia [5] .
The Grand Ethiopian Renaissance Dam is under-construction gravity dam on the Blue Nile River in Ethiopia. Renaissance dam located close to Ethiopia-Sudan boarder will form the largest hydropower producing dam in Africa with over 60,000 MCM of active reservoir storage. When completed, it is anticipated to produce maximum of 6000 MW of hydropower energy. The potential impacts of the dam have been the source of regional controversy. The Government of Egypt, a country which relies heavily on the waters of the Nile, protests the dam which it believes will reduce the amount of water that it gets from Nile.
The eventual site for the Grand Ethiopian Renaissance Dam was identified by the United States Bureau of Reclamation during a Blue Nile survey conducted between 1956 and 1964. The Ethiopian Government surveyed the site in October 2009 and August 2010. On 31 March 2011 the project was made public. The first two generators are expected to become operational after 44 months of construction.
The construction of the GERD dam hereafter is partly the result of the stalling of the cooperative framework agreement in the basin and partly the dire energy requirement of the emerging economic development of Ethiopia. Several hydro-economic modeling results indicate that hydropower development in the Blue Nile is not only attractive economically but also is also one of the Nile sub-basins with the largest hydropower potential [6] -[10] .
Furthermore, the anticipated Nile basin cooperative framework agreement which was toiled for more than a decade hasn’t produced a tangible result. Major components of the agreed upon joint multipurpose projects haven’t yet been realized or thought about to be realized. The major bottleneck for impasse was mainly the late introduction of a new concept of “water security” in the developed Cooperative Framework agreement (CFA) [11] . Consequently, all countries in the Nile basin are emerging to precede developing their resources unilaterally to improve their economy and alleviate poverty in their respective countries. The construction of the Renaissance dam can be considered the dire manifestation of the economic development needs of the riparian countries.
This study is probably the first attempt to study the impact of the GERD dam on the current water use of the downstream riparian countries mainly on High Aswan Dam (HAD). Other past simulation studies on future dams across the Blue Nile have mostly considered four cascaded large reservoirs which includes Karadobi, Beko Abo, Mendya and Border (USBR, 1964). On the basis of simulation studies, the construction of the series of dam across the Blue Nile enhances regional power as well as well as benefits Ethiopia economically. GERD is the enlarged form of the border dam. The impact of this enlarged dam on downstream riparian countries hasn’t been studied. We hope this study opens up research gate to further long term studies.
2. Description of the Eastern Nile
The Nile is the second largest basin in Africa next to Congo basin and traverses a total of eleven countries including Burundi, Democratic Congo, Egypt, Ethiopia, Eritrea Kenya, Rwanda, South Sudan, Sudan, Tanzania, and Uganda. The Nile has two important water supply sources. The Easter Nile (Ethiopia) which contributes almost 85% of the flow of the Nile and Eastern Equatorial Nile (Nile Equatorial countries) which contributes 15% of the flow. The Blue Nile contributes about 60% of the total flow at Aswan and remains an important river basin to the Eastern Nile countries.
The Blue Nile basin (BNB) is characterized by highly rugged topography and considerable variation in altitude. The elevation of the basin varies greatly from over 4000 m in headwaters of some tributaries to 700 m at the foot of plateau. This gives Blue Nile unique advantage to develop hydropower in the basin. The upper Blue Nile flow is contributed from a number of tributaries. Some of the major tributaries are Beshilo, Weleka, Jemma, Beles, Muger, Guder, Finchaa, and Didessa from the east and south; and the Birr, Fettam, and Dura from the north and Dabus from the west. Lake Tana, which has 16,500 km2 and 3600 km2 catchment and surface area respectively, contributions less than 10% of the Blue Nile annual flow.
3. Data Used
3.1. Stream Flow Data
The 6 years inflow series which is closer to the long term average inflow sequence. The normal case to analyze GERD impounding stage and its downstream impacts, especially on HAD operation, considers an average sequence of years regarding HAD inflows. To select the sequence, the 6-year average curve on HAD time-series is used. The period of 6 years which presents the closest mean value to the average HAD naturalized inflows value on the whole available period has been selected. This flow sequence is equivalent to the long term mean flow condition at the HAD and is represented by the 6 years flow series between 1973 and 1978.
Figure 1 depicts the annual, mean annual and selected mean flow of Abbay at border and Nile incremental flow from GERD to HAD (Sudanese irrigation demand deducted). Table 1 and Table 2 present the sequence of selected average flow of Abbay and Nile incremental flow from GERD to HAD (Sudanese irrigation demand deducted) for impounding period (1973-1978). The average value of HAD inflows during these 6 years is 0.5% higher than the mean value on the whole available time-series (1961-2002).Under normal scenario, the 6 years flow sequences average flow at HAD is about 85.5 BCM, which is nearly equivalent to the long term flow at HAD.
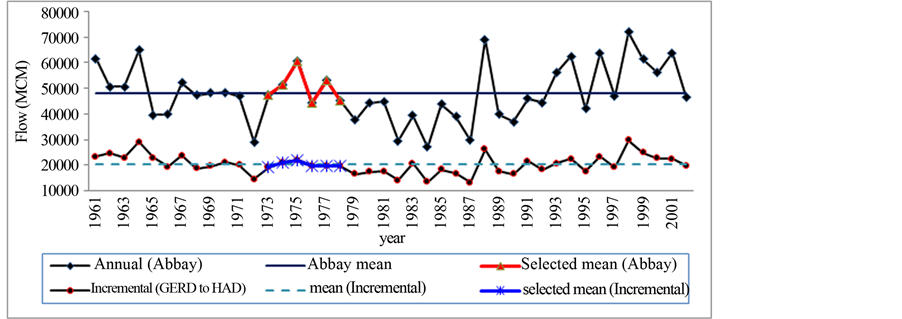
Figure 1. Mean annual and selected mean annual flow of Downstream Nile (incremental flow from GERD to HAD, Sudanese irrigation demand deducted) and Abbay.

Table 1. Average sequence of years—DS Nile flow (Sudanese irrigation deducted) (MCM/month).
Table 2. Average sequence of years—Abbay flows (MCM/month).
The reference case is based on a water management simulation modeled with a sequence of observed hydrological years representative of the inter-annual inflows both on HAD and GERD. From the sequence of average inflows, the normal case will consider that; 2011-2013 flows will be equal to 1970-1972 flows from the available time series. During these 3 years, GERD impounding stage will not start yet. 2014-2019 flows will be equal to 1973-1978 flows from the available series which corresponds to the sequence of average years.
For operation phase of GERD, the flow data is the monthly time series of Abbay and Nile incremental flow from GERD to HAD (Sudanese irrigation demand deducted) from 1961 to 2002.
3.2. Reservoir Evaporation
Losses/gains were placed at two locations within the basin to account for reservoirs gains due to precipitation and losses due to Evaporation. These losses represent the difference between gross precipitation on the reservoir and natural losses due to Evaporation. The water loss from reservoirs which is collected from ENTRO power toolkit and Coyne ET BELLIER and TRACTEBEL Engineeringis summarized as shown in (Table 3) [12] .
3.3. Reservoirs Data
Elevation Area Capacity curve and reservoir characteristics are input data for the simulation. Normal Water Level (NWL) and Minimum Operating Level (MOL) of HAD are 183 and 147 m.a.s.l. respectively. GERD water level is not constant during impounding it varies from 560 to 640 m.a.s.l but during operation NWL is 640 m.a.s.l and the MOL is 622 m.a.s.l.
3.4. Water Users Data
The most common water use in the lower Eastern Nile River Basin is irrigation water demand. In the current situation, the water system retained for the purpose of this study will assume water requirements for irrigation purposes associated to HAD. HAD outflows aim to satisfy Egyptian irrigation water demand as priority to energy generation. 55.5 BCM/year are allocated to Egyptian irrigation supply downstream of HAD. 16.5 BCM/year is allocated to Sudan for irrigation supply and evaporation loss from Sudanese reservoirs. Thus, the value of 16.5 BCM/year corresponds to the remaining water volume of the natural Nile flow arriving at HAD (85 BCM/year in average) once Egyptian waters use for irrigation (55.5 BCM/year) and HAD evaporation losses (10 BCM/year) are subtracted. The monthly irrigation demands at HAD, the Egyptian and Sudan allocation Agreement which is collected from ENTRO data sheet and [13] is shown in Table 4.
This 13.9 BCM/year of water are tapped at two different points upstream of HAD in the water system model. 9.8 BCM/year are deducted on the Blue Nile River to irrigate lands around Sennar; 4.1 BCM/year are deducted on the intermediary catchment (on the White Nile River and on the Atbara River) Water volumes for irrigation
Table 3. Monthly net reservoir evaporation (mm/day).
Table 4. 1959 water allocation agreement between Egypt and Sudan (BCM) and monthly HAD irrigation water demand (m3/sec).
in Sudan are deducted from the Nile upstream of HAD, and thus are prevented to enter in HAD reservoir in the proposed model. At HAD, as long as HAD water level is equal or greater than the Minimum Operating Level (147 m), water volumes for Egyptian irrigation are supplied at a monthly time-step according to the repartition presented in Table 4. The irrigation water demand in BCM will be changed to m3/s for model input with 10% return flow.
3.5. Hydropower Data
All input data which enables for running the simulation are from Ethiopian Electric Power Corporation Grand Ethiopian Renaissance Dam Project study [12] [14] . For power generation at GERD during impounding the input data is the water level and tail water level with the amount of water delivered to the turbine according to the power unit installed. So, amount of power generated will depend on these input data. But for operation time the power input is 6000 MW installed capacity and 33% firm energy, 500 m.a.s.l of tail water and 95% engine efficiency. Installed power at HAD is equal to 2100 MW with turbines efficiency equal to 95%.
4. River Basin Modelling and Setup
The natural river system of the Eastern Nile river basin was schematized in the Mike Basin model and represented with a node-branch structure (Figure 2). A total of 14 nodes and corresponding 16 reaches were established based on the river network configuration. Branches represent the main river and its main tributaries, and nodes represent major river confluences, reservoirs, and control points for off take. Off takesare to release water to cover downstream irrigation and hydropower water demands. In the simulation, only two major water demand sectors were considered: irrigation and hydropower.
There one irrigation site and two hydropower stations are considered within the basin for both filling and op-

Figure 2. Schematization of Eastern Nile for GERD Filling and operation phases.
eration phases. The major irrigation system in the basin is gravity flow (normally from reservoirs). The schemes were then allocated to the nearby nodes for their water withdrawals, and return flows from established schemes were directed to the immediate downstream nodes. The stream flows are lumped to two catchment flows. The catchments are Abbay river basin upstream of GERD and downstream Nile flow which is the incremental flow from GERD to HAD by deducting the irrigation water requirement of Sudan.
5. An Assessment of the Impact of the Filling Stage of (GERD) on the Performance of High Aswan Dam (HAD)
Simulations were undertaken to assess the impacts of GERD on HAD during impounding periods. Impacts and benefits are assessed based on the local situations and the considering the basin as a system for selected mean flow. The computed results of the sensitive analysis related to irrigation water demand coverage and Hydropower are synthesized. Comparative analysis of HAD operation results for the current situation and HAD with GERD has been conducted.
5.1. The GERD Dam Filling Strategies
According to the envisaged construction and first impounding schedule (Coyne ET BELLIER and TRACTEBEL Engineering) [12] it is considered that:
• GERD impounding stage will start in January 2014;
• Energy generation can start in September 2014, considering that 2 groups will be installed and once water level will reach 560 m.a.s.l;
• GERD will be completed in June 2016 and then, the water level will not decrease below 622 m.a.s.l, which is the minimum release level;
• The impounding stage will be considered complete when GERD water level will reach its Normal Water Level (640 m.a.s.l).
5.2. GERD Impounding Results
As shown in Figure 3, GERD water level will reach 560 m.a.s.l in August 2014 and can generate energy starting from this date. GERD will reach its dead storage Level (590 m.a.s.l) in September 2015 and will reach its Normal Water Level of 640 m.a.s.l at the end of year 2019 (Figure 3). Thus, 6 years may be required to fill GERD till its normal water level (NWL). Yearly GERD outflows during the impounding stage will never be lower than 28.9 BCM/year as shown in Table 5.
As shown in Figure 4, during the filling period, the mean monthly out flow from GERD will generally be more uniform and the dry season outflow to downstream countries is greater than the inflow to the GERD. There is maximum inflow to GERD during the wet months (July, August and September). The mean monthly out flow from GERD will be more uniform and the out flow during dry months is greater than the inflow to GERD during these months. If the coefficient of variance of the mean monthly inflow to GERD and outflow from GERD is compared, there is significant difference that is coefficient of variance is 1.22 and 0.8 for mean month inflow to GERD and mean monthly outflow from GERD respectively.
As shown in Table 5, the energy generation of GERD during impounding will be limited during the impounding stage, especially in 2014 and 2015 because of GERD water level is lower or close to the Minimum Operation Level. Power generation will presumably become higher than 7600 GWh/year starting from year 2016.The average 6 years flow reduction, the difference between mean inflow and mean outflow, from the Blue Nile reaches about 26% (13000 MCM). While the mean annual energy production during the filling, is boasted by over 6100 GWh.
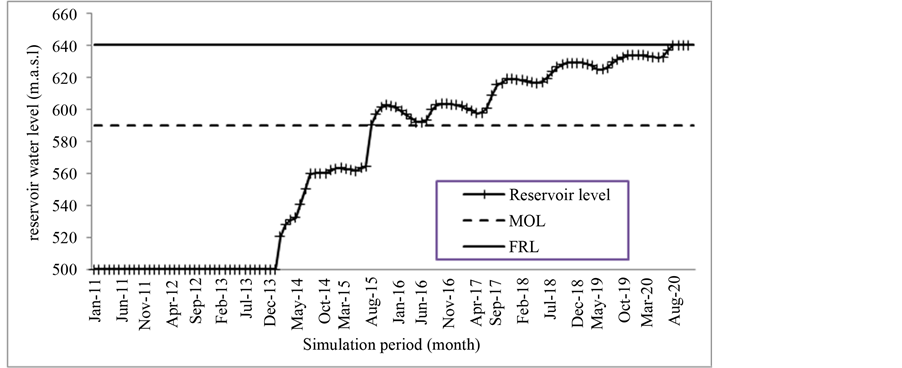
Figure 3. GERD water level during impounding with normal flow (m.a.s.l).
Table 5. GERD impounding stage with average sequence: yearly inflows, losses, outflows and energy generation.
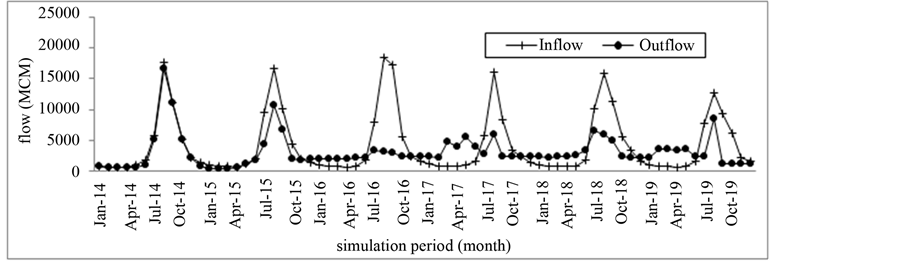
Figure 4. Monthly inflow and outflow of GERD during impounding with mean sequence (MCM).
The evaporation loss that GERD will incurs significantly lower than the amount of water that the GERD will save from evaporation loss. GERD will collect more water in wet (rainy) seasons. The maximum water loss due to evaporation is from December to April, the months with maximum temperature. The annual mean water loss is 905 MCM (Table 5). The water loss will increase as the reservoir water level increase and will reach its maximum level at the end of 2019. This is because, as the water level increase, the surface area also increases.
5.3. GERD Impounding Influence on HAD during Impounding
Figure 5 and Table 6 summarize HAD simulation results considering GERD upstream during its impounding period. In Table 6(b), columns named “Diff” represent the percentage of difference in water volume or energy between HAD with GERD impounding upstream and HAD alone. Between January 2011 and January 2014, stored water in GERD reservoir will not affect HAD operation conditions. From January 2014 to June 2015, HAD water level will be slightly affected because some amount of water is started to be stored in GERD. From July 2015 to December 2019, HAD water level will decrease significantly because of GERD impounding. As shown in the Figure 9, HAD Minimum Operating Level (147 m) will never be reached and there will be full coverage of HAD downstream water use for irrigation.
The flow condition in HAD decreases by about 19% or 13 BCM (Table 6(b)) during the filling period. Does this reduction have impact on the performance of HAD? This is presented the simulation results in terms of impact on the agriculture water withdrawal and hydropower generation at HAD.
1) Water withdrawal for Agricultural: water withdrawal from HAD during the 6 years filling period is not affected in Egypt. Despite the inflow reduction by about 19%, and reduced water level (Figure 9), the water requirement from HAD for agriculture is not affected. There is no sign of deficit in any one month during this
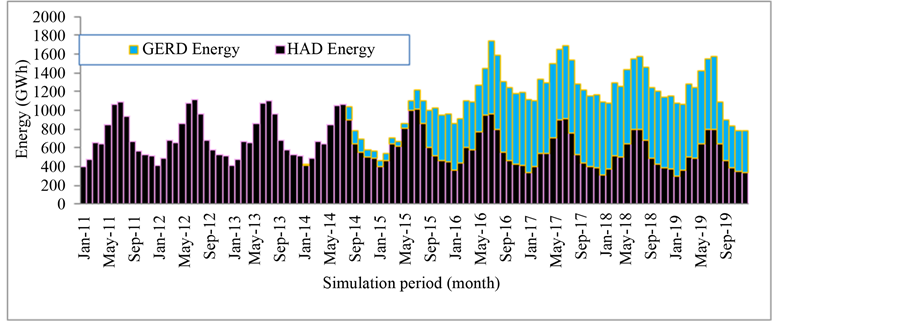
Figure 5. Monthly energy generation in the Eastern Nile during GERD filling (GWH).
Table 6 . (a) HAD yearly inflows, losses, outflows and energy generation for HAD alone scenario. (b) HAD yearly inflows, losses, outflows and energy generation for HAD influenced by GERD during impounding with mean flow and the difference in percentage from HAD alone.
phase of the project. The reduction in storage volume never reached the minimum operation level (147 m.a.s.l) under full withdrawal. This is mainly due to the combined benefit of the large multi-year stored water of HAD as well as water gained from evaporation due to reduced level at HAD.
2) Energy production: Energy production is related to the water level and water discharge amount. Due to the water level lowering at HAD, the mean manual energy production is affected by the order of 13% and HAD annual energy generation will decrease from 0.5% to 24% between 2015 and 2019 (Table 6(b)) over the filling period. The energy reduction of filling period requires proper joint planning and operation and management of the joint reservoir options.
When viewed from regional perspective, the overall energy benefits from joint operation of GERD and HAD increases tremendously even during the filling phase. Figure 5 demonstrates the cumulative monthly energy production of the two reservoirs during GERD filling. The total energy production from the joint operation of the two dams provides a gain of about 5112 GWh/year and which is more than 63% energy gain during the filling period than HAD alone situation.
3) Water gain from HAD: HAD evaporation losses will be reduced during GERD impounding. Annual water loss from HAD will be less as compared to the current situation.The overall 6 years average water loss due to evaporation at HAD has shown a gain of almost 22% from the past average losses. This means the water gain from lost evaporation over 6 years period reaches to 3.4 BCM (Table 6(b)). The cumulative loss from the two reservoirs will be less than the current situation’s loss. The mean annual loss from both reservoirs will be 12907 MCM which is 16% less than the loss from HAD alone operation.
This gained water from the evaporation effectively contributes to maintain HAD to fully withdraw irrigation water without being affected during the infilling phase of the GERD project. It is also a manifestation of how water be gained from Operating HAD at lower level in the future.
Figure 6 shows the inflow hydrographs of HAD during the impounding period of GERD. As shown in Figures, there is significant changes on the hydrology of HAD due to GERD filling. The flow during dry period will increase in the second scenario but there is maximum inflow variation to HAD in the baseline scenario. During the wet months (July, August and September), there is maximum flow at HAD in the baseline scenario but the dry months flow is too small. These is because of the regulating effects of GERD, i.e. mean monthly out flow from GERD will be more uniform and the outflow during dry months is greater than the inflow to GERD.
5.4. GERD Operation Simulations Results
It is therefore necessary to perform the present simulation study to assess the downstream impacts of GERD operation. The objective is to analyze potential impacts of GERD operation mainly on HAD’s based on the comparison of water resources management simulation between without and with GERD scenarios.
5.4.1. Simulations Results at GERD
GERD operation simulations are realized for monthly inflows time-series from January 1961 to December 2002, taken as possible future hydrologic pattern, and considering the GERD reservoir condition at the end of impounding stage in the reference case (sequence of average years) in December 2019. GERD water level is around 636 m.a.s.l and water volume stored in GERD reservoir is equal to 72 BCM.
On average, the reservoir water levels will rich its lowest level in June and the maximum water level will be in October and November. As shown in Figure 7, the maximum inflow and outflow of GERD is in the wet months (from July to October). However, the minimum percentage released from GERD is within these months (Figure 8).
The outflow from GERD is more regulated, that is the outflow is more than the inflow during dry months (Figure 7). For instance, the coefficient of variance is 0.2 and 1.2 for mean monthly outflow and inflow respectively. Average annual GERD losses are equal to 1.475 BCM. Mean GERD water levels during the operation simulation period are equal to 631 m.a.s.l. The minimum value (622 m.a.s.l) mostly occurs in the months from April to July and the maximum water level (640 m.a.s.l) will occur from September to November.
Mean annual energy generation is 15673. Minimum energy production is in months from April to June when the reservoir level is also at lower level. As compared to the installed capacity, there are 57 months of energy deficit throughout the simulation period. The maximum energy deficit is in May and June which is the end of dry season, whereas from July to November there is no energy deficit.
5.4.2. High Aswan Dam HAD Operation Simulations Results
Simulations are realized at HAD in future conditions (with GERD) and HAD alone based on historical monthly flows from January 1961 to December 2002. HAD initial conditions at the end of GERD impounding stage in the reference case (sequence of average years) is considered for simulation. Because of GERD filling impact the initial HAD water level is different for the two scenarios. Water levels for HAD alone and HAD with GERD conditions were 171 and 156 m.a.s.l. respectively on December 2019 (the end of GERD filling). Operation simulation was started with these water level for both the HAD alone and with GERD situations.

Figure 6. Monthly inflow to HAD during impounding with mean flow (MCM).
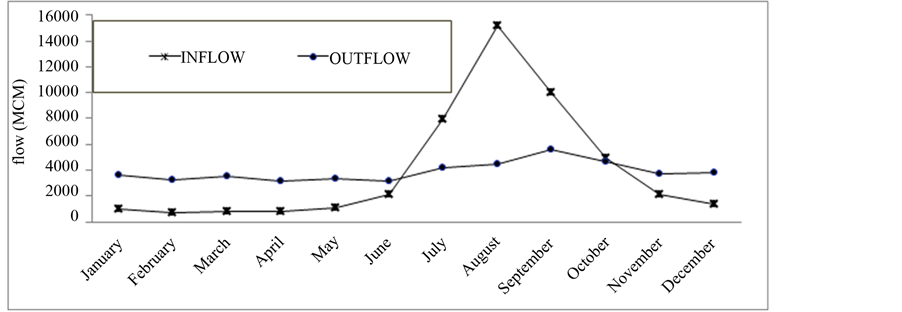
Figure 7. Inflow and out flow of GERD (MCM).
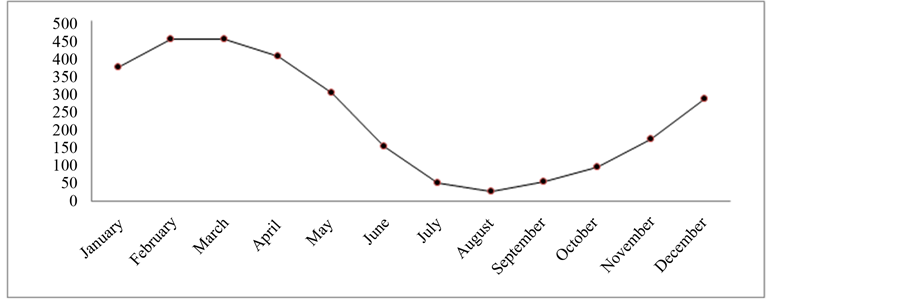
Figure 8. Percentage of water released from GERD.
As shown in the Table 7, there is slight difference in reservoir level. On average there is 3 m reservoir water level reduction as compared to the HAD alone case. The minimum HAD reservoir water level (147 m.a.s.l.) is reached reach for 19 and 23 months for HAD alone and with GERD scenarios respectively (Figure 10). This is the residual GERD filling impact that is the simulation stated with initial HAD reservoir level for with GERD case is 5 m less than that of without GERD case (Figure 9).
At the end of simulation period the reservoir levels will increase and will be 177 and 174 m.a.s.l for HAD alone and with GERD respectively (Figure 9). As shown in Table 7, reservoir water level difference between HAD alone and with GERD conditions in the dry months (from April to June) is less (1% reduction). The fluctuation of water level is reduced compared to HAD alone simulation results. This is a consequence of the seasonal inflows regime regulation: relatively more constant flows arrive at HAD all over the year.
Table 7. HAD Inflow, energy and reservoir pool level and the difference between the two scenarios (with GERD and without GERD) (%).
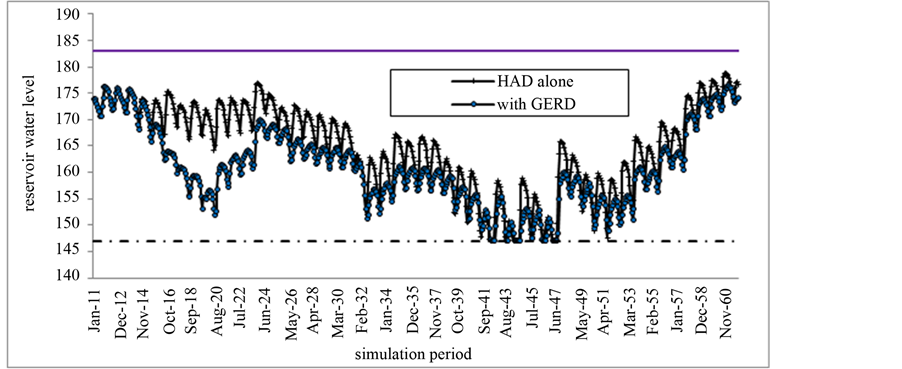
Figure 9. HAD reservoir water level during filling and operation phases of GERD.
The major modification will concern the seasonal Blue Nile flows distribution which will be more uniform along the year therefore beneficial to flood control downstream GERD. Figure 10 shows that HAD inflows will increase from November to June, and decrease from July to October, and will be more regular. The inflow to HAD is more uniform due to the presence of GERD. As shown in Table 7, the dry months’ inflow to HAD with GERD is more than the inflow to HAD without GERD. The mean annual inflow difference to HAD with and without GERD is 2% reduction.
There are months with the water level reaches its minimum operation level (147 m.a.s.l) and the amount of outflow is less. In these months there is also water demand deficit. Table 8 shows the number of months in water demand deficit at HAD. Mean monthly energy production will be decrease up to 7% as compared to baseline scenario (Table 7). This reduction is a consequence of the average reservoir water level reduction of HAD. Figure 11 shows mean monthly water loss at HAD. There is water loss reduction due to GERD by at least 11% on average.
5.4.3. Performance Analysis of the Reservoirs during Operation
It is useful to have an understanding of the uncertainties associated with the flow situations in the basin. Reservoir planning is concerned with determining the storage required in a reservoir for meeting a given yield with an acceptable level of performance. Performance measures often considered include reliability, resilience, vulnerability, and sustainability [15] .
Therefore evaluating the satisfaction of irrigation at HAD have been undertaken by considering both HAD alone and with GERD scenarios. Reliability can be described as the probability that a reservoir will be able to meet, within the simulation period, the target demand in any given interval of time. Time-based reliability considers the proportion of intervals during the simulation period that reservoir can meet the target demand. A general expression for estimating the time based reliability is using Equation (1):
 (1)
(1)
where• Rt = time based reliability.
• Ns = the numbers of interval that the target demand is fully meet.
• N = the total number of intervals covering the simulation analysis period, which is equal to 504 for this study.
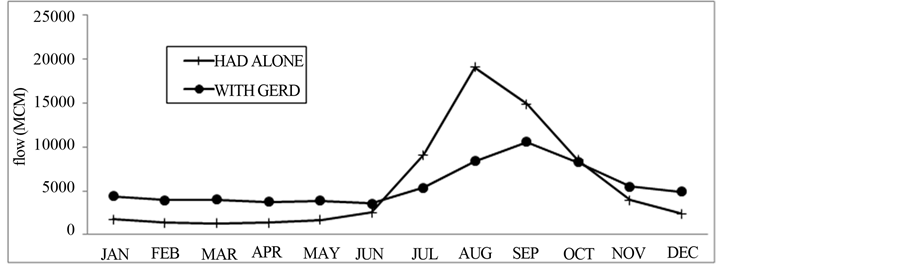
Figure 10. Mean monthly inflow to HAD during operation (MCM).
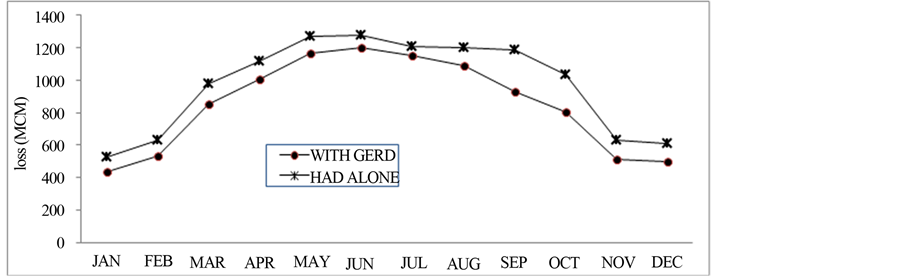
Figure 11. Mean monthly losses at HAD during operation (MCM).
Table 8. Number of months in water demand deficit.
*The other years has no water demand deficit.
Volumetric reliability is defined as the volume of water supplied to the demand center divides by the total target demand during the entire simulation period, i.e.
 (2)
(2)
where:
• Rv = Volumetric reliability;
• Di = the target demand during the ith period;
• Di = the volume of water actually supplied or available in the reservoir during the ith period;
• N = the number of time interval in simulation period.
Resilience is a metric defining how quickly a reservoir will recover from a failure. The resilience is the probability of a year of success following a year of failure and expressed by Equation (3) [16] .
 (3)
(3)
whereφ = is the resilience;
fs = is the number of individual continuous sequences of failure periods; and fd = the total duration of the failure.
Vulnerability measures the average volumetric severity of failure during a period and vulnerability by volume is defined as follows [16] ;
 (4)
(4)
• η' = Vulnerability;
• sj = the volumetric shortfall during the jth continuous failure sequence;
• fs = the number of continuous sequence of failure.
Because Equation (5) averages out the maximum shortfall over all the continuous failure periods, then a reduction in fs will cause η' to increase when the numerator in Equation (4), remains unchanged. Another point to note about Equation (4) is that η' is in volumetric units; a more useful expression of vulnerability is its dimensionless form given by Equation (5) [17] :
 (5)
(5)
where:
η = dimensionless Vulnerability;
Df = is the constant or average of all demand.
1) Performance analysis of HAD irrigation demand
The three system of assessment i.e. reliability, resilience and vulnerability could ensure a consistent assessment of reservoir system performance [17] . The values of the Performance Indices of the HAD reservoir in meeting irrigation demand for the simulated period is shown in the Table 9. It may be seen from the index volumetric reliability (Rv) that the percentages of success of the reservoir in meeting the irrigation requirement are, 97 for both conditions (HAD alone and with GERD).
The percentages of success in terms of metric reliability (Rt) are also above 96% for both scenarios. The recovery of the reservoir (resilience) is less in HAD alone scenario and HAD alone is more vulnerable as compared to with GERD scenario (Table 9). This is due to the flow variations for HAD alone scenario. While, with GERD, HAD will gain more regulated and uniform flow. The results indicate that the system is capable of meeting the demands for both scenarios.
2) Performance analysis of GERD Energy production
The values of the Performance Indices of the GERD reservoir in meeting target hydropower demands for the simulated period are shown in the Table 10. From the index volumetric reliability (Rv) that the percentages of
Table 9. Performance analysis for HAD irrigation demand.
Table 10. Performance analysis for GERD hydropower generation.
success of the reservoir in meeting the requirement is 95%. The percentages of success in terms of metric reliability (Rt) is 89%. The recovery of the reservoir (resilience) is 91%. The results indicate that the system is capable of meeting the demands for both scenarios.
6. Conclusions
Simulations were undertaken to assess the impacts and benefits of GERD on the performance of HAD forirrigation and hydropower energy during impounding and operation beyond the impounding stages. Five water resources variables with and without GERD were compared: The inflow to and outflow from the reservoirs, irrigation water demand deficit, energy generations and the annual water losses from the reservoirs.
• Using its planned 6 years impounding period, GERD will increase Ethiopian hydroelectric power generation by 6145 GWh/year in, which will also boost the energy generation of the eastern Nile by 33%. After filling, Ethiopia will be net beneficiary with an average increase of 300% of annual energy generation.
• If the mean inflow series to the GERD is around the long term mean value, the 6 years filling period is adequate enough to fill GERD without causing impact to HAD water availability.
• While GERD construction increases energy production to Ethiopia and regional market, energy production from HAD will decrease by about 12% during the filling period and 7% after filling stage of operation of the dam.
• The net evaporative water loss from the exposed surfaces of HAD and GERD reservoirs decreased by 16% due to operation of HAD at reduced water level enhancing water avaibaility to the two dams.
• In terms of performance efficiency, HAD operates with 96% reliability level.
References
- Waterbury, J. (2002) The Nile Basin: National Determinants of Collective Action. Yale University Press, New Haven.
- Block, P., Strzepek, K. and Rajagopalan, B. (2007) Integrated Management of the Blue Nile Basin in Ethiopia: Hydropower and Irrigation Modeling. IFPRI Discussion Paper No. 700, International Food Policy Research Institute, Washington DC.
- World Energy Council (2007) 2007 Survey of Energy Resources. World Energy Council, London, 586 p.
- Tegenu, A. (2006) Statement at the Fourteenth Commission on Sustainable Development. United Nations, New York.
- Thomson, G. (2006) Encyclopedia of the Nations-Africa. Thomson Corporation, Farmington Hills.
- Whittington, D., Wu, X. and Sadoff, C. (2005) Water Resources Management in the Nile Basin: The Economic Value of Cooperation. Water Policy, 7, 227-252.
- Wu, X. and Whittington, D. (2006) Incentive Compatibility and Conflict Resolution in International River Basins: A Case Study of the Nile Basin. Water Resources Research, 42, W02417.
- Blackmore, D. and Whittington, D. (2008) Opportunities for Cooperative Water Resources Development on the Eastern Nile: Risks and Rewards. Report to the Eastern Nile Council of Ministers, Nile Basin Initiative, Entebbe.
- Block, P. and Strzepek, K. (2010) Economic Analysis of Large-Scale Upstream River Basin Development on the Blue Nile in Ethiopia Considering Transient Conditions, Climate Variability, and Climate Change. Journal of Water Resources Planning and Management, 136, 156-166. http://dx.doi.org/10.1061/(ASCE)WR.1943-5452.0000022
- Goor, Q., Halleux, C., Mohamed, Y. and Tilmant, A. (2010) Optimal Operation of a Multipurpose Multi-Reservoir System in the Eastern Nile River Basin. Hydrological Earth System Science.
- Mekonnen, D. (2010) The Nile Basin Cooperative Framework Agreement Negotiations and the Adoption of a “Water Security” Paradigm: Flight into Obscurity or a Logical Cul-de-sac? The European Journal of International Law, 21, 421-440. http://dx.doi.org/10.1093/ejil/chq027
- Coyne ET BELLIER and TRACTEBEL Engineering (2011) Grand Ethiopian Renaissance Dam Project: Hydraulic and Reservoir Simulation Studies.
- Godana, B. (1985) Africa’s Shared Water Resources: Legal and Institutional Aspects of the Nile, Niger, and Senegal River Systems. Frances Pinter, Ltd., London.
- EEPCO (2010) 500 Hydroelectric Project: Basic Design. Main Report.
- Loucks, P. (1997) Quantifying Trends in System Sustainability. Hydrological Sciences Journal, 42, 513-530. http://dx.doi.org/10.1080/02626669709492051
- Hashimoto, T., Stendinger, R. and Loucks, P. (1982) Reliability, Resiliency, and Vulnerability Criteria for Water Resources System Performance Evaluation. Water Resources Research, 18, 14-20.
- Thomas, J., Krehbiel, R., Rison, W., Hunyady, J., Winn, P., Hamlin, T. and Harlin, J. (2004) Accuracy of the Lightning Mapping Array. Journal of Geophysical Research, 109, 34 p.