Journal of Water Resource and Protection
Vol.4 No.6(2012), Article ID:19897,7 pages DOI:10.4236/jwarp.2012.46041
Check Dams in an Ephemeral Stream in a Tropical Deciduous Forest Extend Water Period with Minimal Effect on Reptile Assemblage
1Biological Science Program, Faculty of Science, Chulalongkorn University, Bangkok, Thailand
2Department of Biology, Faculty of Science, Chulalongkorn University, Bangkok, Thailand
Email: *noppadon.k@chula.ac.th
Received March 12, 2012; revised March 30, 2012; accepted May 1, 2012
Keywords: Check Dam; Reptile; Diversity; Composition; Nonpermanent Stream
ABSTRACT
Although numerous check dams have been constructed in many countries, and its effect on physical factors were well documented, only a few reports were available on its effect on biotic component in adjacent area. This research aims to address effects of the check dam on reptile assemblage in an ephemeral stream based on an assumption that reptile live in the stream and adjacent area may be susceptible to prolonged hydroperiod after check dam construction. Ten stream transects and 40 terrestrial strip transects, including 5, 10, 25, and 50 m from the stream, were used to monitor reptile diversity and composition in a deciduous forest of northern Thailand during April 2009 to February 2011. Physical factors related to water pattern in the stream and the terrestrial habitats were also collected. Results on physical factors indicated that the water pattern and soil moisture in the stream, as well as leaf litter moisture in the terrestrial habitat were increased as a result of the check dam. However, rarefaction curve indicated that reptile diversity was not significantly different between preand post-check dam periods in every transect. Moreover, Morisita’s index of similarity indicated that reptile composition between preand post-check dam periods was approximately the same (86% - 100%). These results indicated that reptile assemblage was not affected by the check dam. It can be concluded based on data of one year after the check dam construction that check dam can effectively prolong water and moisture to the habitat with minimal effect on reptile assemblage in the area.
1. Introduction
Intergovernmental Panel on Climate Change (IPCC) has reported that many regions of the globe may become susceptible to prolonged period of drought due to the problem of climate change [1]. There are numerous management methods to solve this problem. Some methods, such as dam constructions, are well understood for their effects on environment. However, check dam or small dam constructed across a gully or stream is one of the drought management methods with less information on its effect on the environment, especially on biotic component.
Check dams are constructed in order to 1) reduce the velocity of water flows, 2) monitor and entrap sedimentation, 3) increase infiltration of water into the surrounded soil, 4) increase the vegetation, and 5) reduce the flood peak discharge [2]. Check dams were made from very diverse materials such as low price materials (bamboo, wood, log, clay, rock, etc.) or high cost concrete, making it varied in life span [3]. Check dams are constructed in many countries throughout the world [4-9]. In Thailand, check dam has been initially and successfully implemented in rural areas according to the advice of His Majesty the King of Thailand since it is regarded as a simple method for local people to construct by themselves with minimal investment, yet effective enough to prolong the surface water period. As a result, many governmental office and private sectors have participated in the check dam constructions throughout the country.
Although numerous check dams have been built, there are still few reports on the potential effect of the check dam on environment. At a river habitat, Shieh et al. [10] concluded that check dam not only changes the physical characteristics of the river but also have negative impacts on biodiversity of the river. However, most check dam construction in Thailand was at a non-permanent (ephemeral) primary order or secondary order stream [3], not a river. In this habitat type, the check dam can increase absorption rate of underground water and the stream hydroperiod [11]. Treepatanasuwan and Ploychareon [12] also reported that numbers of seedlings and saplings in the dry evergreen forest in the check dam construction area were higher than those in the area with no check dam. Since data on biotic factor is still limited, determination of the check dam effect on the biotic community is needed to be conducted.
Since reptile is an ectothermic animal that relies on environmental sources for heat gain, its daily activity is more restricted than an endothermic tetrapod [13]. In an ephemeral stream habitat, a less dense canopy cover and an availability of dry stream bed provide a perfect place for the reptile to gain heat from stream bed conduction and sun basking. In the presence of check dam, the prolonged water period in the ephemeral stream could reduce an occurrence of this dry stream bed and may affect the reptile assemblage in the check dam area. In this study, therefore, reptile assemblage (i.e. diversity and composition) was used as a monitoring parameter to detect effect of the check dam on biotic components between preand post-check dam construction periods.
2. Materials and Methods
2.1. Study Site
This study was conducted at the Chulalongkorn University Forest and Research Station [CFRS], a 300 hectare area located at Lai Nan sub-district, Wiang Sa district, Nan province in northern part of Thailand (UTM zone 47Q: N2051960-2054260 and E0688400-0690360) (Figure 1). An average total annual rainfall during 2000 - 2009 was 1159.6 mm, and mean air temperature and relative humidity in that duration were 26.5˚C and 76.2%, respectively. A deciduous forest is major vegetation in this area [14]. Most of the streams in this area are ephemeral streams that are filled only during the wet season. Even in the wet season, water in the stream is flowing only during a heavy rain, and become standing water and dries out only a few days later.
2.2. Study Period
This study was carried out for 2 years during April 2009 to April 2011. The study periods were divided into preand post-check dam periods. Each study period began at the onset of wet season or the start of check dam functioning period and ended at the end of dry season. Amount of rainfall and average air temperature were used to determine wet and dry seasons by plot into the climate diagram [15]. The month which has the total rainfall higher than twice of the average air temperature was indicated as the wet season. According to this data, the pre-check dam period was during April 2009 to March 2010 (12 months) and the post-check dam period was during May 2010 to February 2011 (10 months; Figure 2).
2.3. Check Dam Construction Scheme
In the study area, stream B has showed many characters suitable as reptile habitat. For example, it has a lot of rocks, leaf litters, and wood particles at the stream bed, the stream bank is not too high, and the stream slope is not too steep. Therefore, stream B was selected as the study stream. Ten check dams were constructed in the dry season during December 2009 to February 2010. The
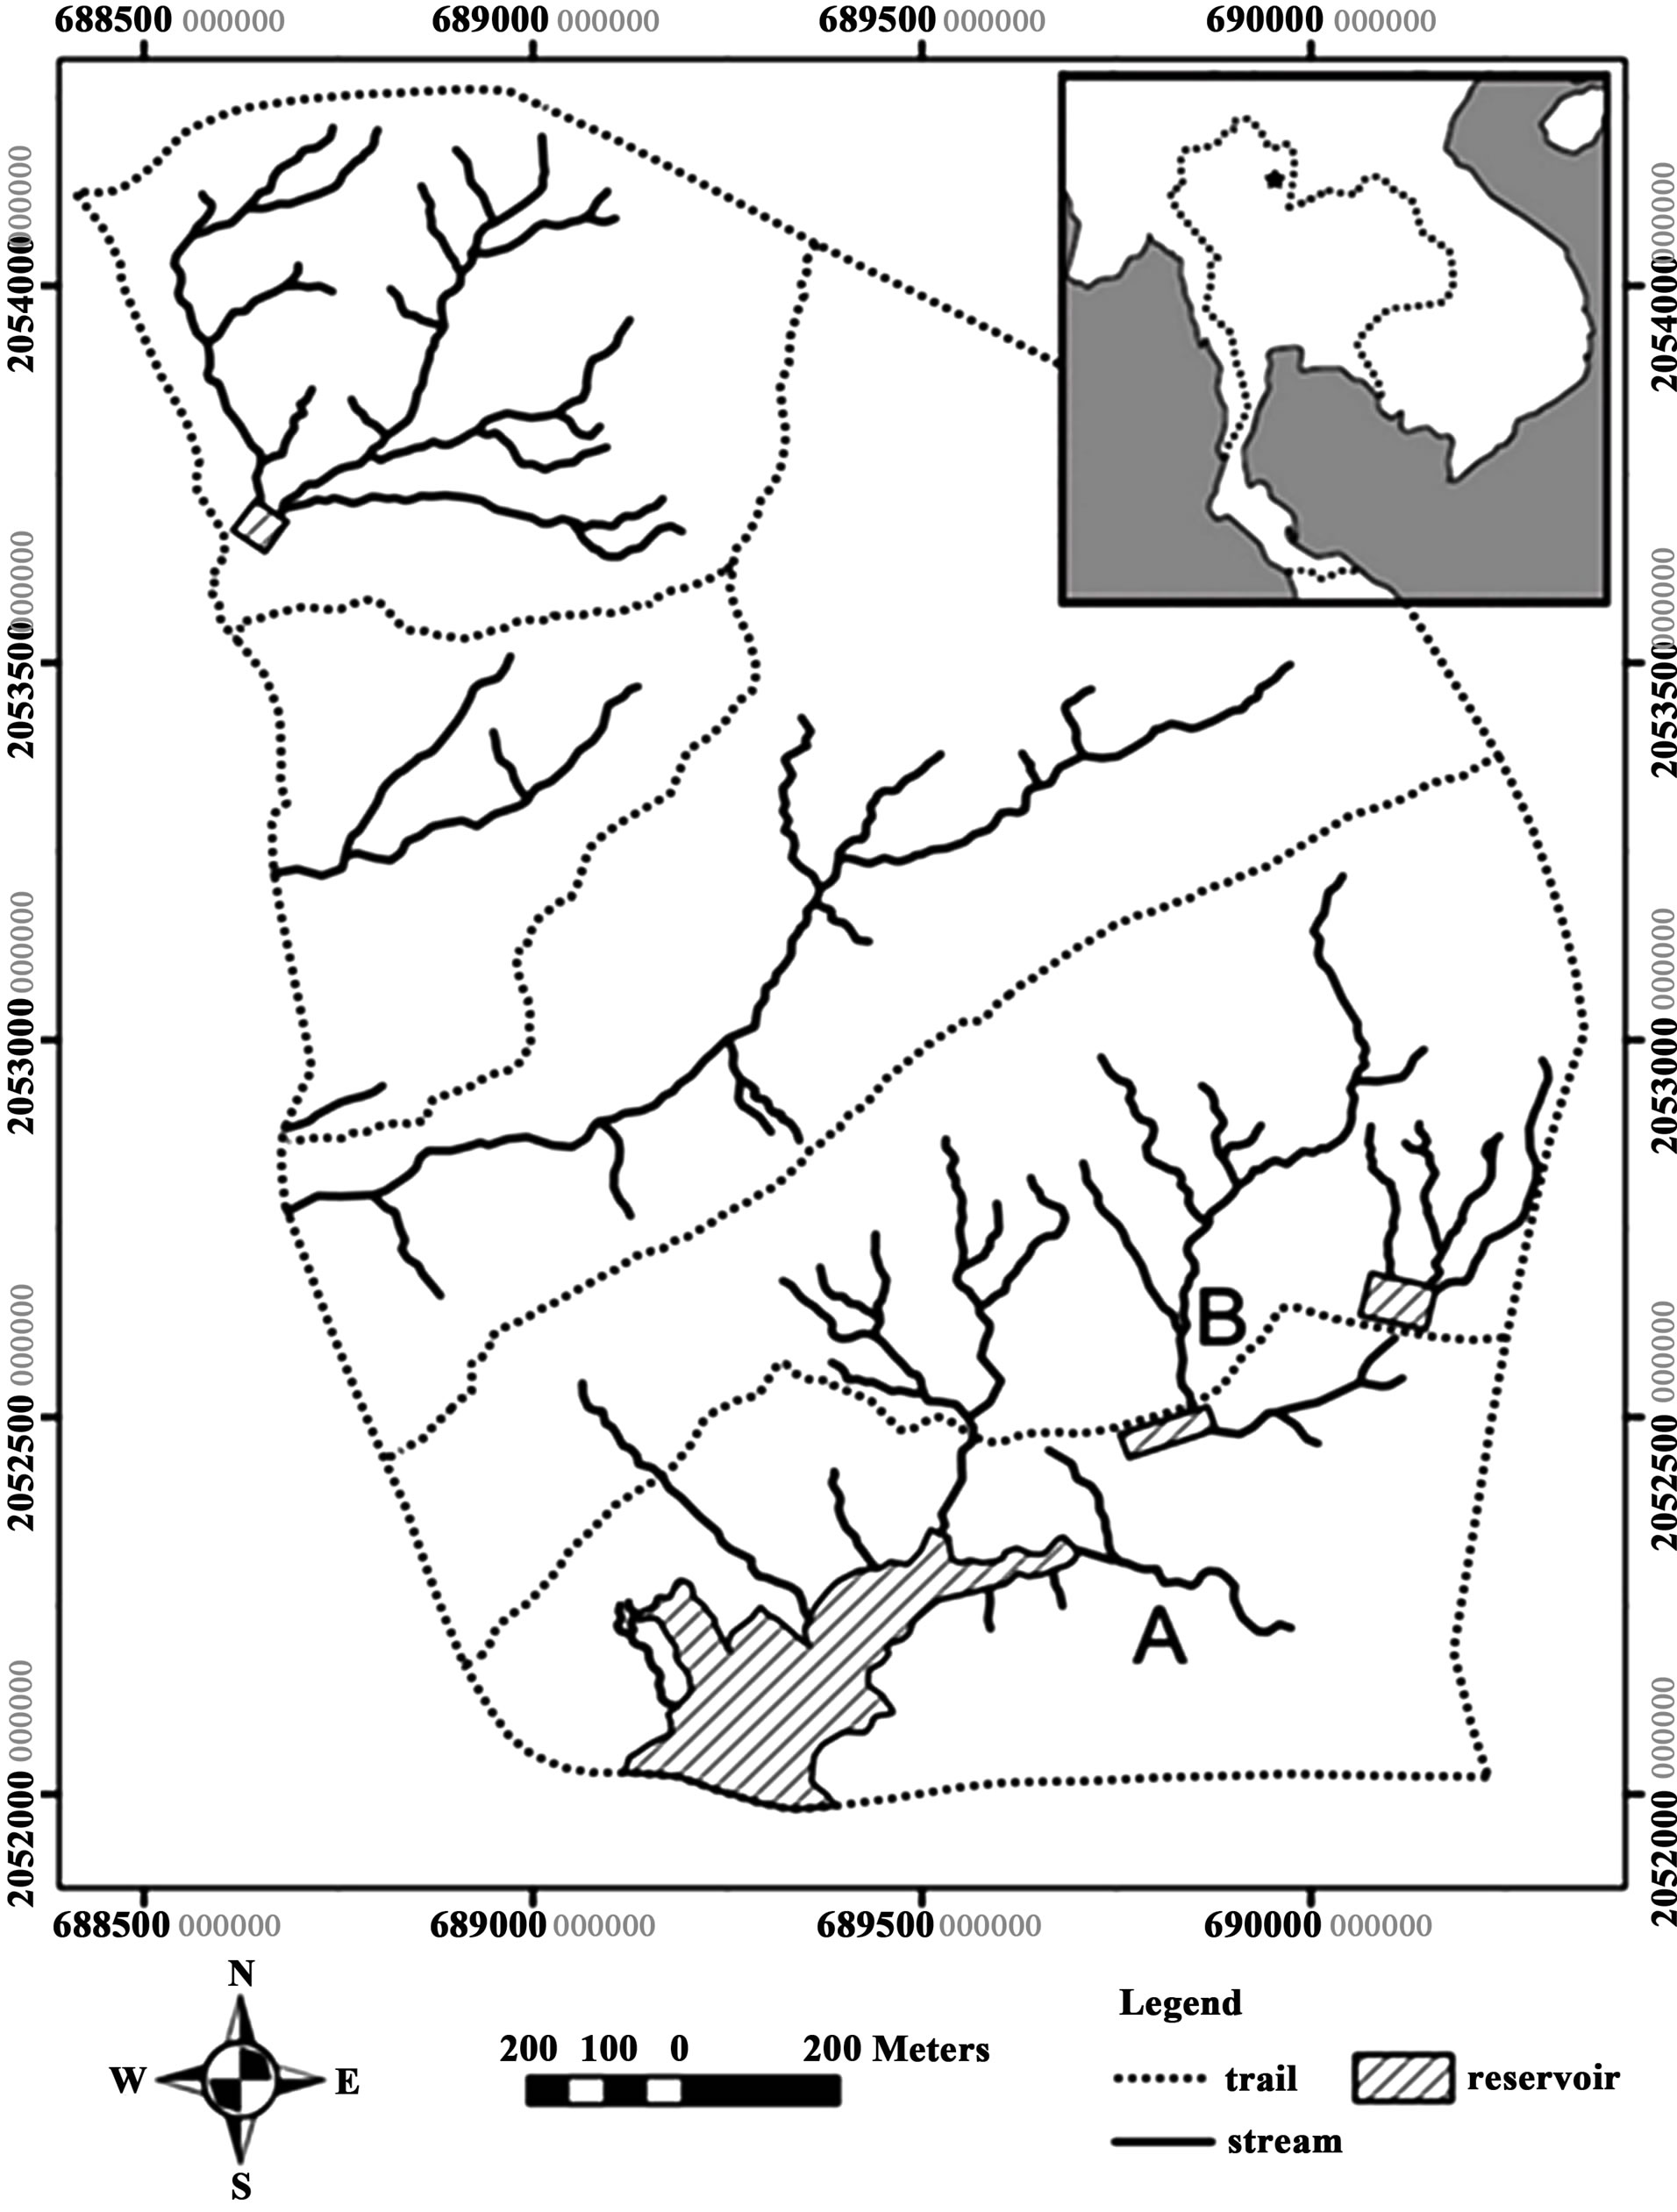
Figure 1. Map of the Chulalongkorn University Forest and Research Station, Nan province, northern Thailand (picture modified from [14]). B indicated the study stream.
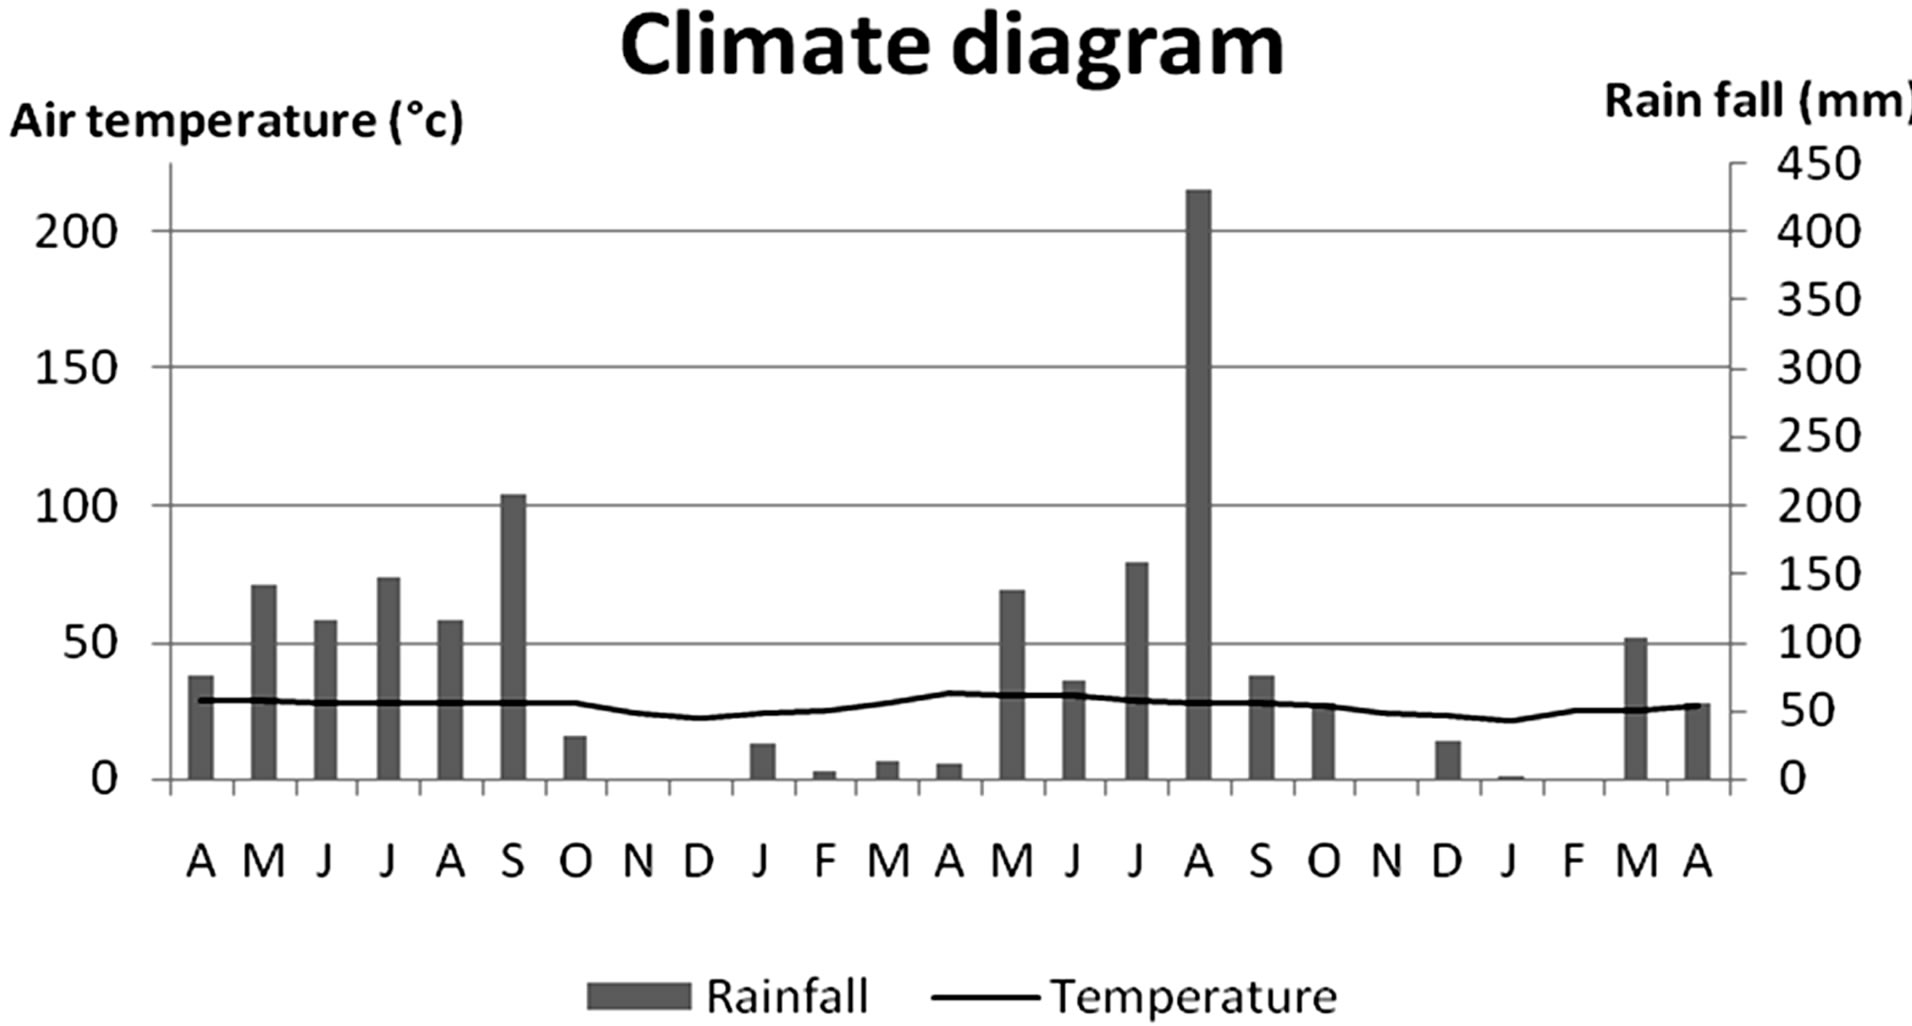
Figure 2. Climate diagram or climograph during the study period started from April 2009 to April 2011.
check dam height was designed to be similar to height of the stream bank (around 1 m) in order to trap the water at maximum level without flooding on the stream bank habitat. Location of the upstream check dam was determined by the maximum level of the down-stream check dam (Figure 3). Therefore, distance between 2 check dams depended on the stream slope. The check dams were constructed in continuously fashion until the end of the stream.
2.4. Physical Factor
Monthly total rainfall and average air temperature were collected from the nearest meteorological station. Numbers of days that water body was present in the stream were recorded to determine the hydroperiod and presented as percentage of the study period. Water depth was measured by measuring tape. Numbers of water body presented in the stream were also recorded. Leaf litter and soil were collected at each surveyed terrestrial transect. Their wet and dry weights were measured to determine the percentage of water content.
2.5. Reptile Survey
Reptile assemblages were surveyed in 2 periods including the preand the post-check dam construction periods. Two transect types were used for monitoring reptile assemblages including a stream transect and terrestrial strip transects.
Ten stream transects were designated in the stream B. Each stream transect started from one position of the planned check dam construction site (in pre-check dam period) or a check dam (in post-check dam period) to the next check dam (or the next check dam construction site). Width of the stream transect was similar to the stream width, or approximately 2 meters.
For each stream transect, there were 4 terrestrial strip transects paralleled to the stream transect with perpendicular distance of 5, 10, 25, and 50 meters from the stream transect. Therefore, there were 40 terrestrial strip transects grouped in to 4 groups according to the distance from the stream transect.
The active survey based on transect sampling [16] was used to detect reptile along both stream and terrestrial strip transects. Reptiles in the water, on the bare ground,
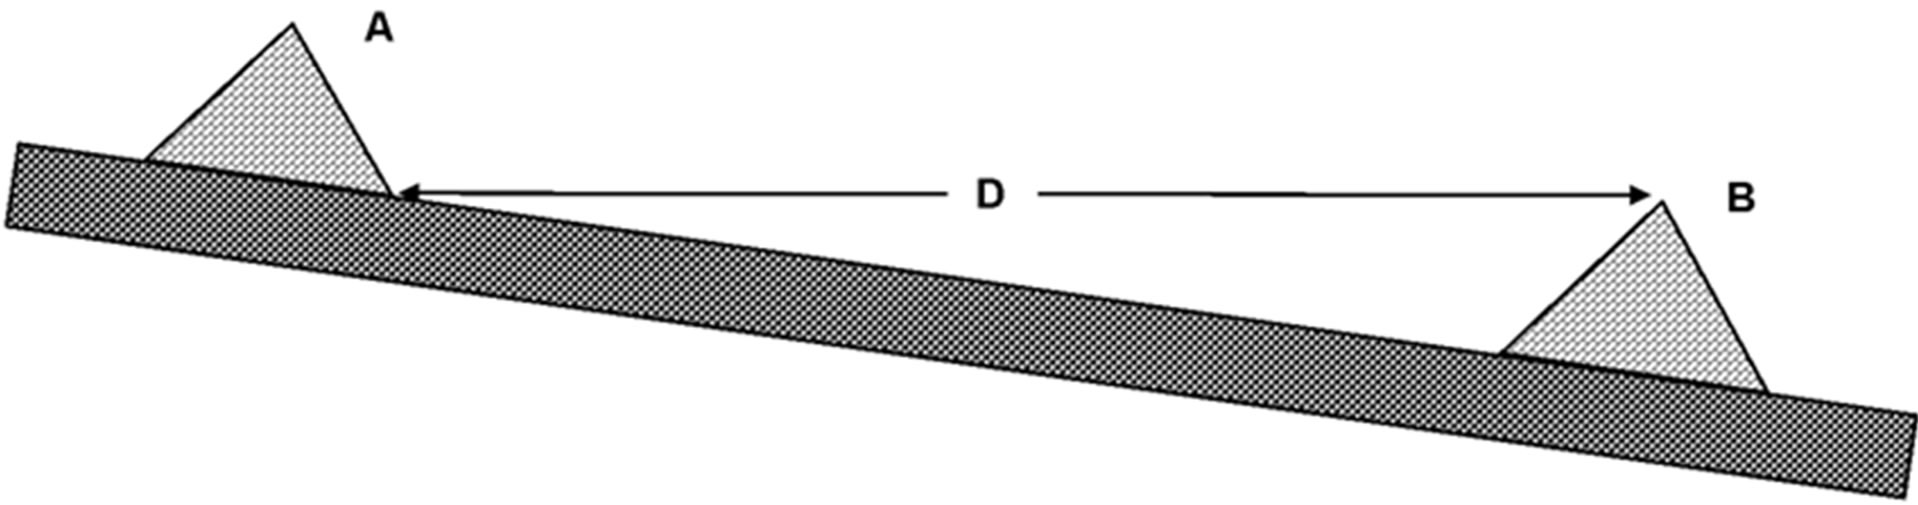
Figure 3. Diagram of check dam showing the distance between check dams. A: upstream check dam; B: downstream check dam; D: distance between check dam.
under the leaf litter and on the tree with height less than 1.5 meters were recorded from these transects. Reptiles were identified to species and numbers of individuals of each species were recorded. For each day, the total of 3 transects were surveyed during day time (9:00-12:00) and other 3 transects were surveyed during night time (19:00-22:00). The selection of these transects were on random basis. During each survey, special care was given to avoid habitat disturbance in the remaining transects. In each month, the surveys were conducted for 16 consecutive days until every transect was studied.
2.6. Data Analysis
Data were grouped according to type of transect and compared between preand post-check dam periods. Hydroperiod, water depth, and number of water body in the stream transect, and leaf litter and soil moisture contents in each terrestrial transect were compared between preand post-check dam periods by Mann-Whitney U-test (see [17] for review).
Reptile assemblage was divided into reptile diversity and composition. Since the survey durations were different between the pre-check dam (12 months) and postcheck dam (10 months) periods, a rarefaction model was used to compare reptile diversity between these periods. Rarefaction value and its 95% confidence interval were calculated by EstimateS 8.2 program [18]. Afterward, the values of preand post-check dam were plotted as a function of sampling efforts. With this plot, significant difference in species diversity is indicated by an absence of overlap in the confidence interval of rarefaction curves between preand post-check dam period at the maximum sampling effort [19].
Reptile composition between preand post-check dam periods was analyzed by Morisita’s index of similarity. According to Wolda [20], Morisita’s index of similarity is regarded as the best overall measure of similarity with minimal dependence on sample size (see [21] for review).
3. Results
3.1. Physical Factors
Several changes in physical factors were found after check dam construction. Table 1 shows that hydroperiod in the post-check dam period was longer than the precheck dam period, and numbers of water body and water depth in the post-check dam period were higher than the pre-check dam period. Overall data of both soil and leaf litter moisture content in the post-check dam period were significantly higher than those in the pre-check dam period (Tables 2 and 3). However, pair-wise comparison of each transect shows that the soil moisture content was significantly different between preand post-check dam period only at the stream transect. On the contrary, comparison on the leaf litter moisture content revealed significant difference only at terrestrial transects.
3.2. Reptile Assemblage
Ten species of reptile were found in both preand postcheck dam periods (Table 4). The number of species found in each transect ranged from 3 to 7 species with similar numbers of species between preand post-check dam periods.
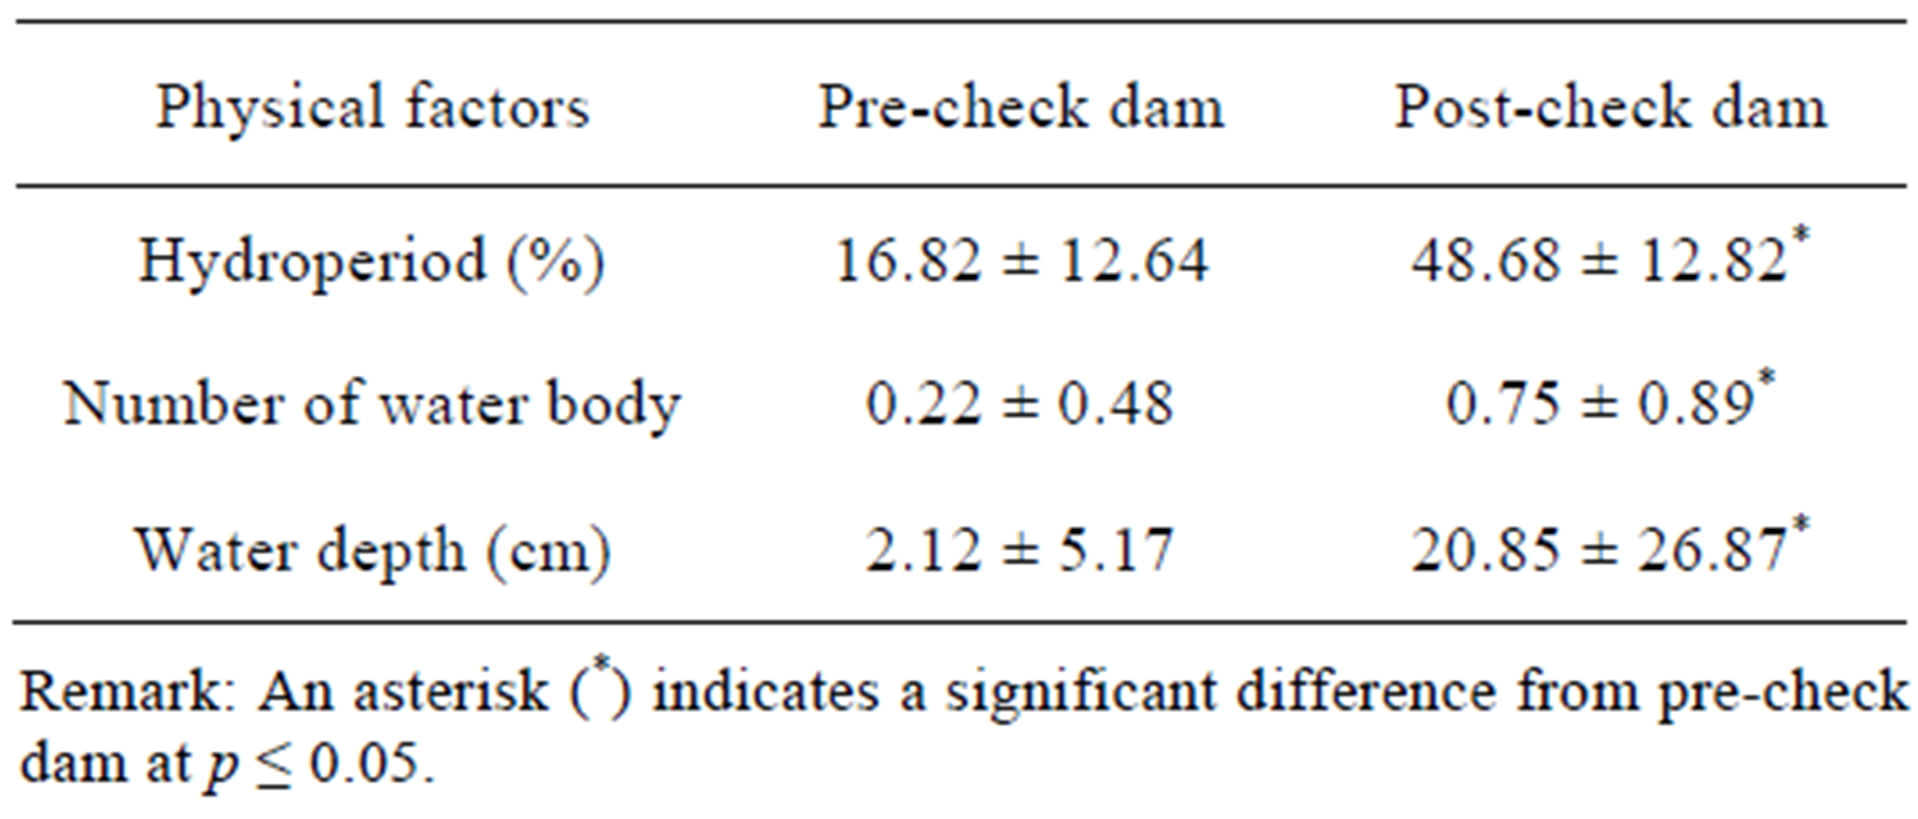
Table 1. Mean ± SD of hydroperiod, number of water body, and water depth comparing between preand post-check dam periods.
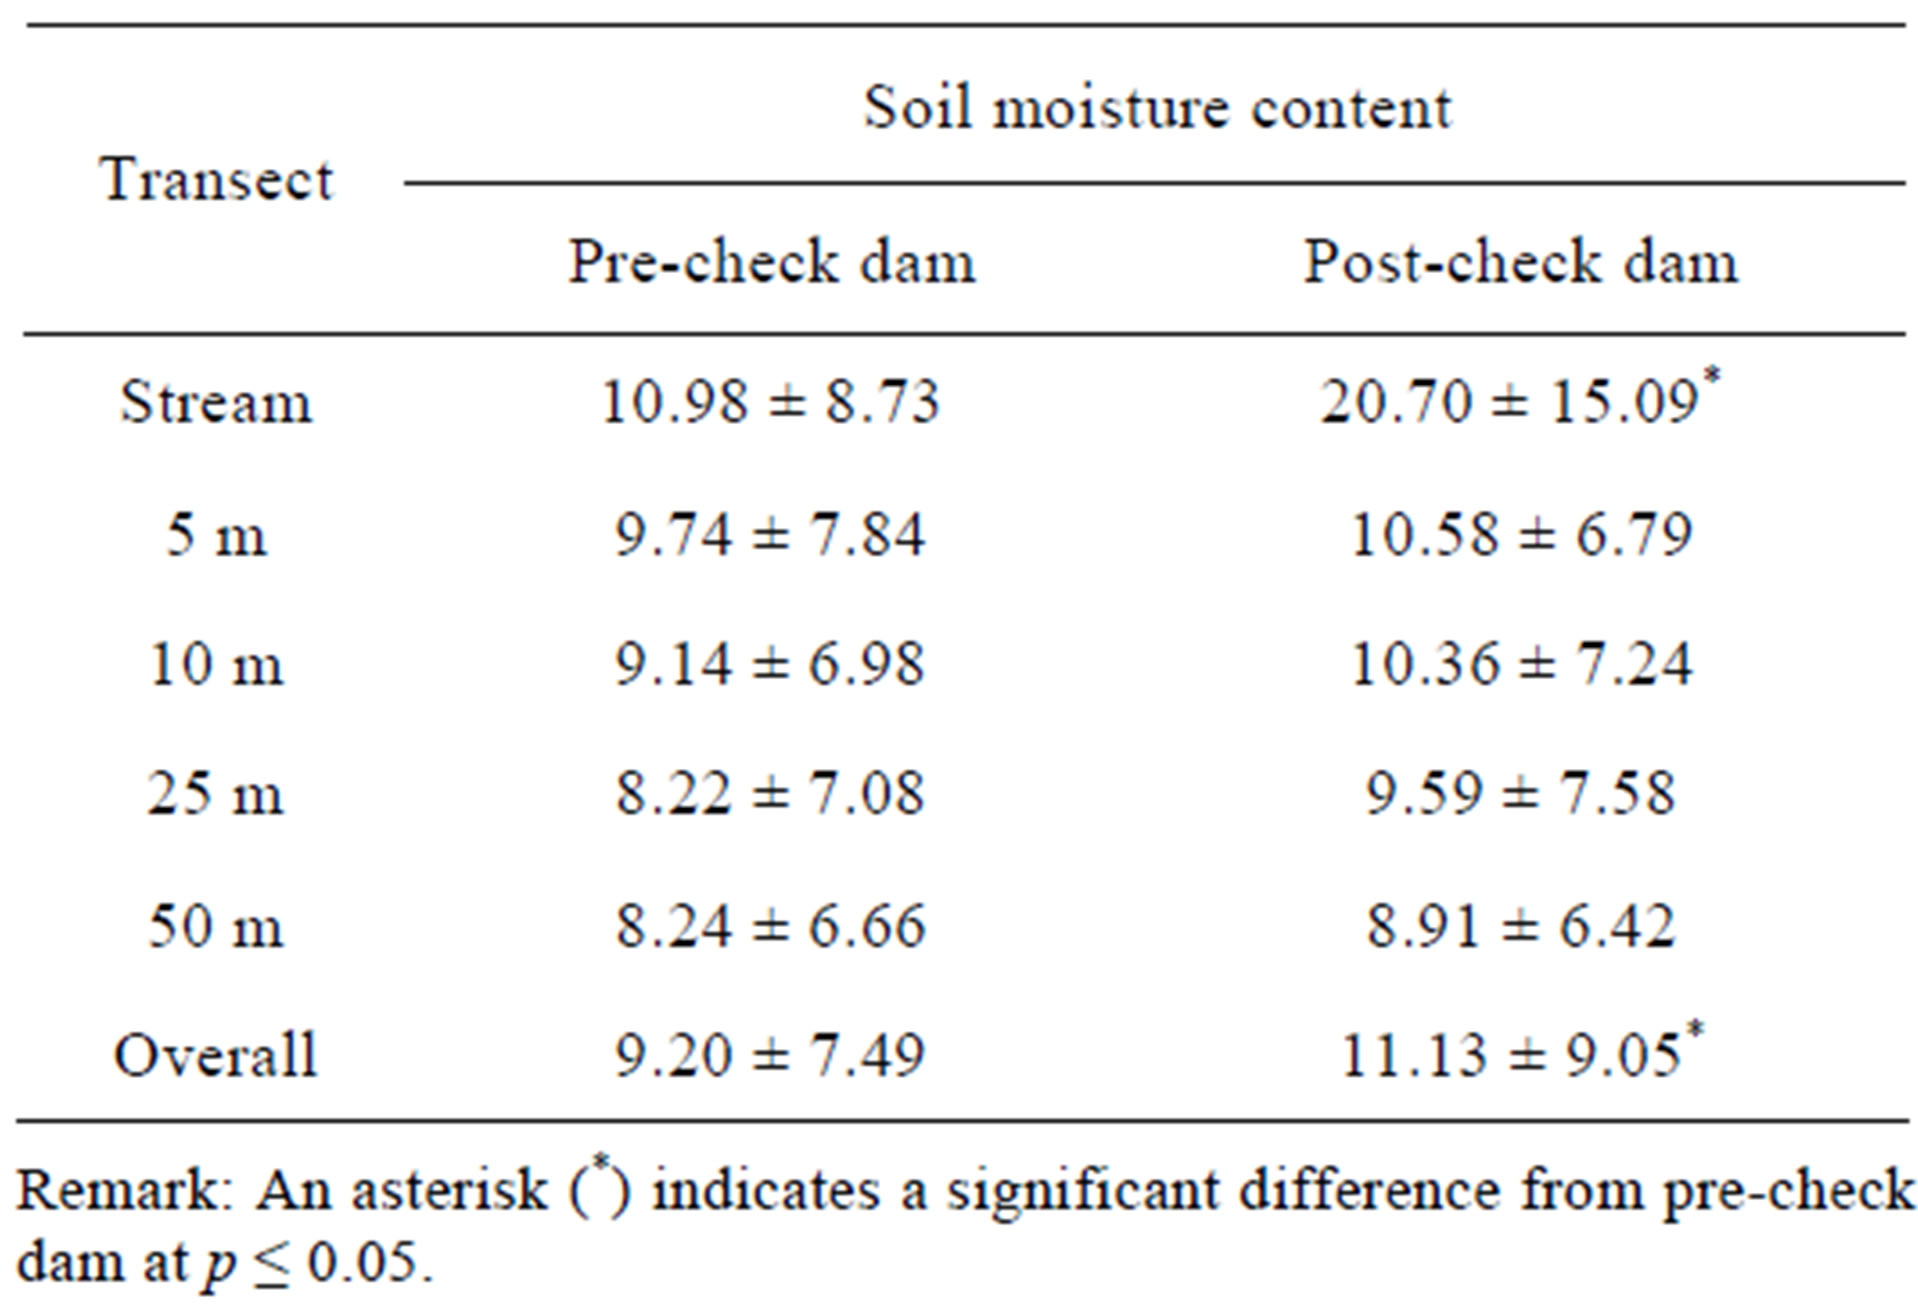
Table 2. Soil moisture content at each transect in preand post-check dam periods.
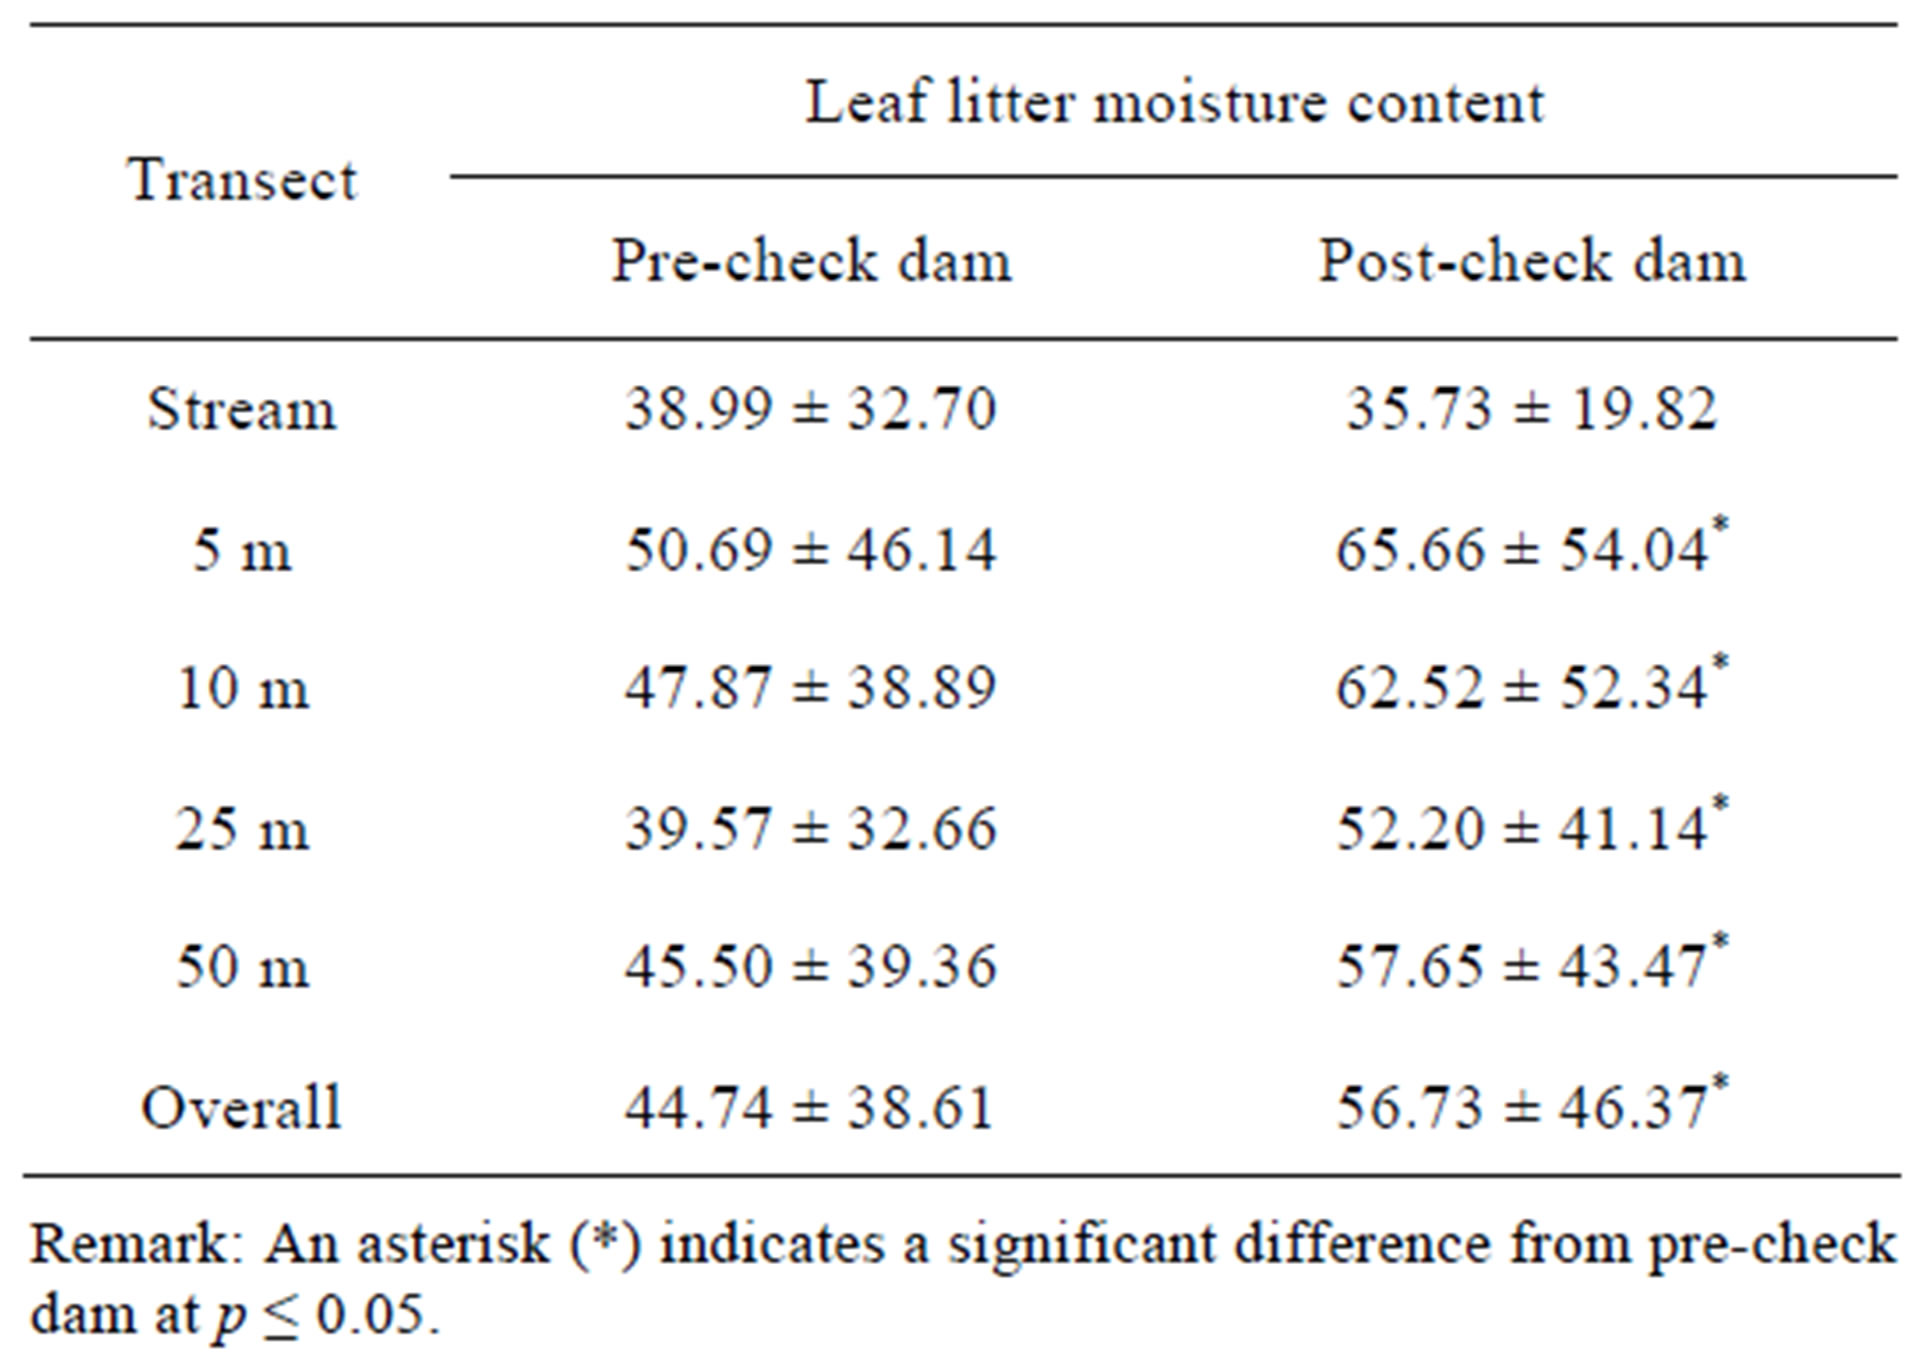
Table 3. Leaf litter moisture content at each transect in preand post-check dam periods.
At the stream transects, the rarefaction curves of preand post-check dam periods (Figure 4) show an almost complete overlap between 95% confidence interval of these 2 curves, indicating that the reptile diversity was not significantly different between these 2 periods in the stream habitat.
The rarefaction curves of preand post-check dam periods at the 5, 10, 25 and 50 m terrestrial transects (Figures 5-8) show varying degree of overlap between 95% confidence interval of these 2 curves, indicating that the reptile diversities were not significantly different between these 2 periods at any of these terrestrial habitats.
Morisita’s index of similarity indicated that the overall reptile composition was very similar (98%) between preand post-check dam periods (Table 4). Moreover, the similarity in reptile composition at each terrestrial transect was also very similar between preand post-check dam period (90% - 100%). The degree of similarity was also high (86%) in the stream habitat, a habitat with greatest change as a result of the check dam.
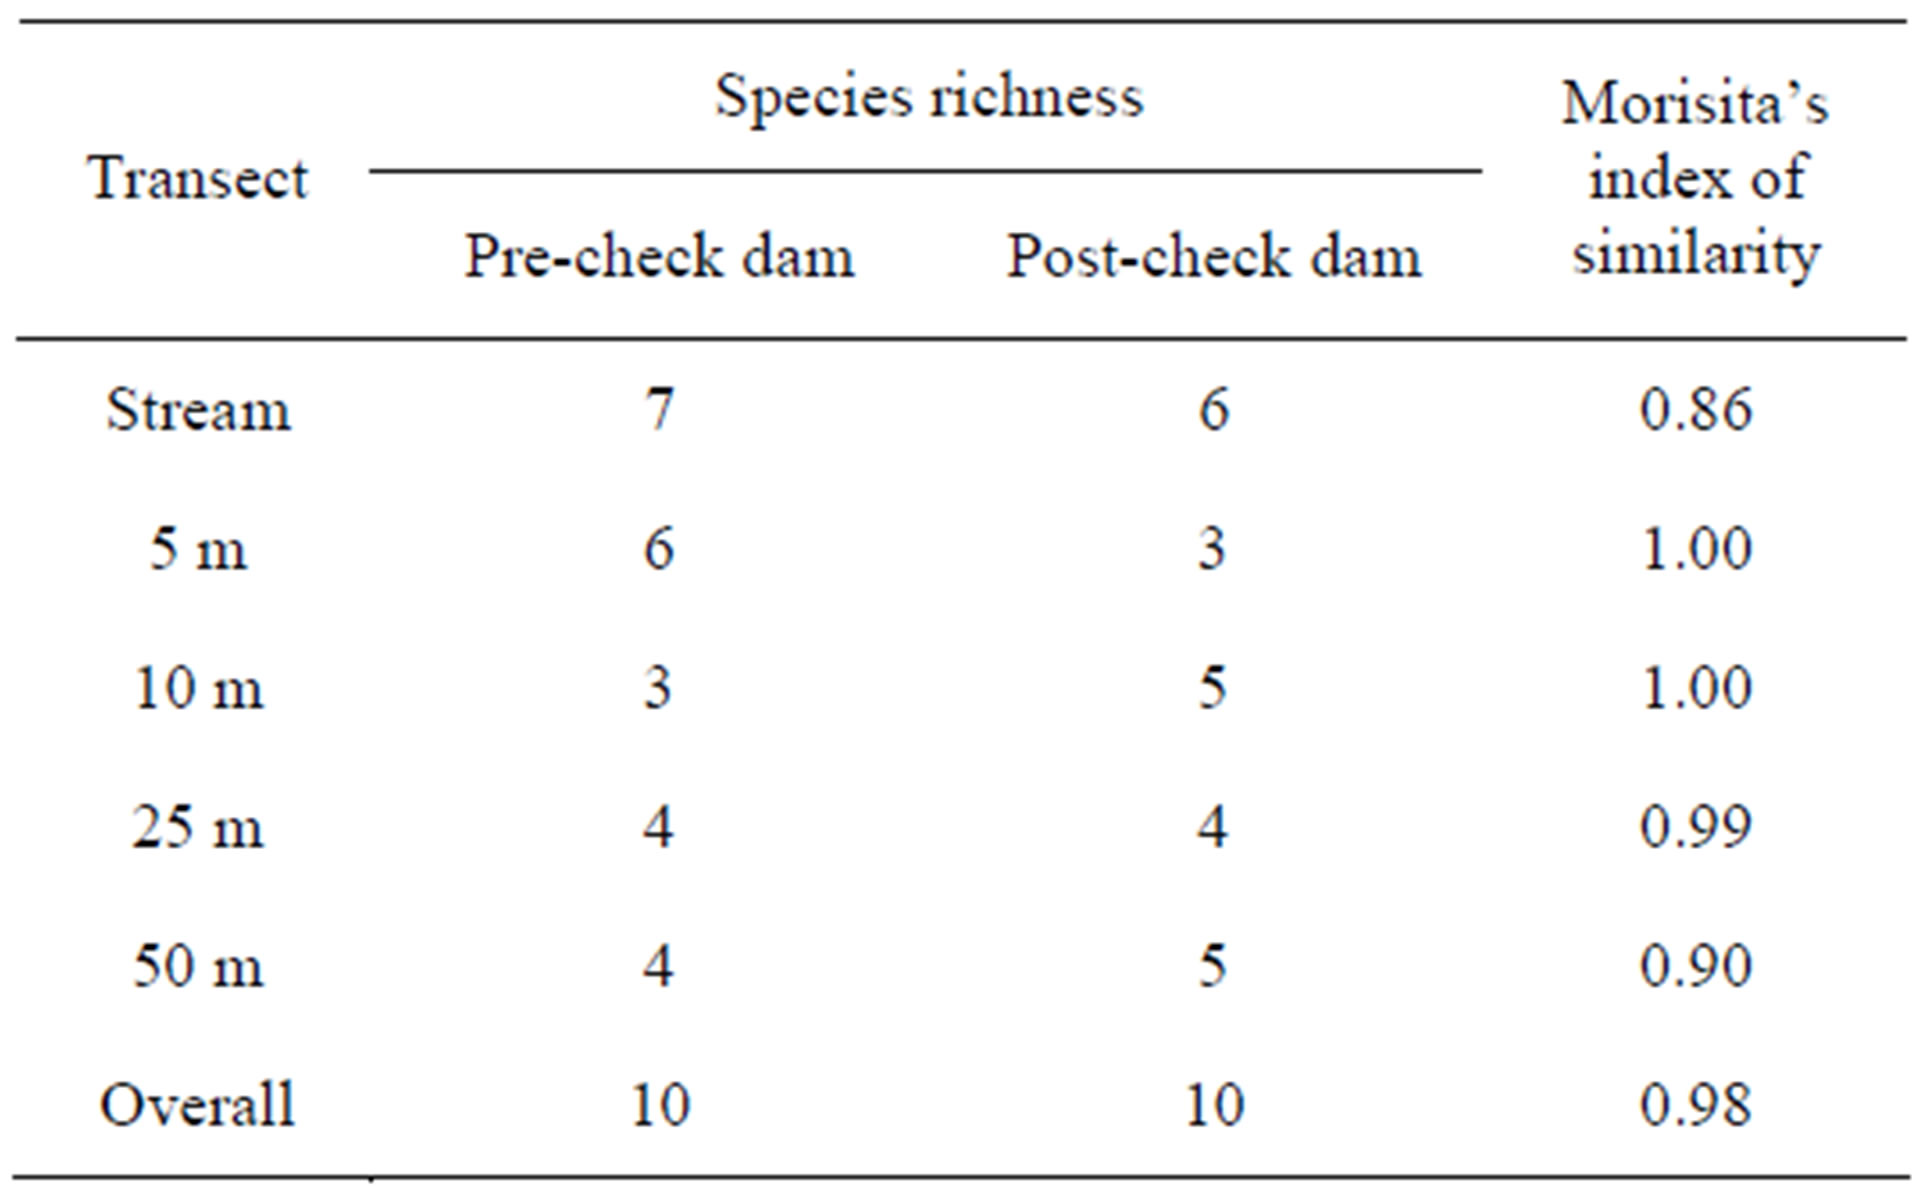
Table 4. Total number of reptiles found at each transect in preand post-check dam periods.
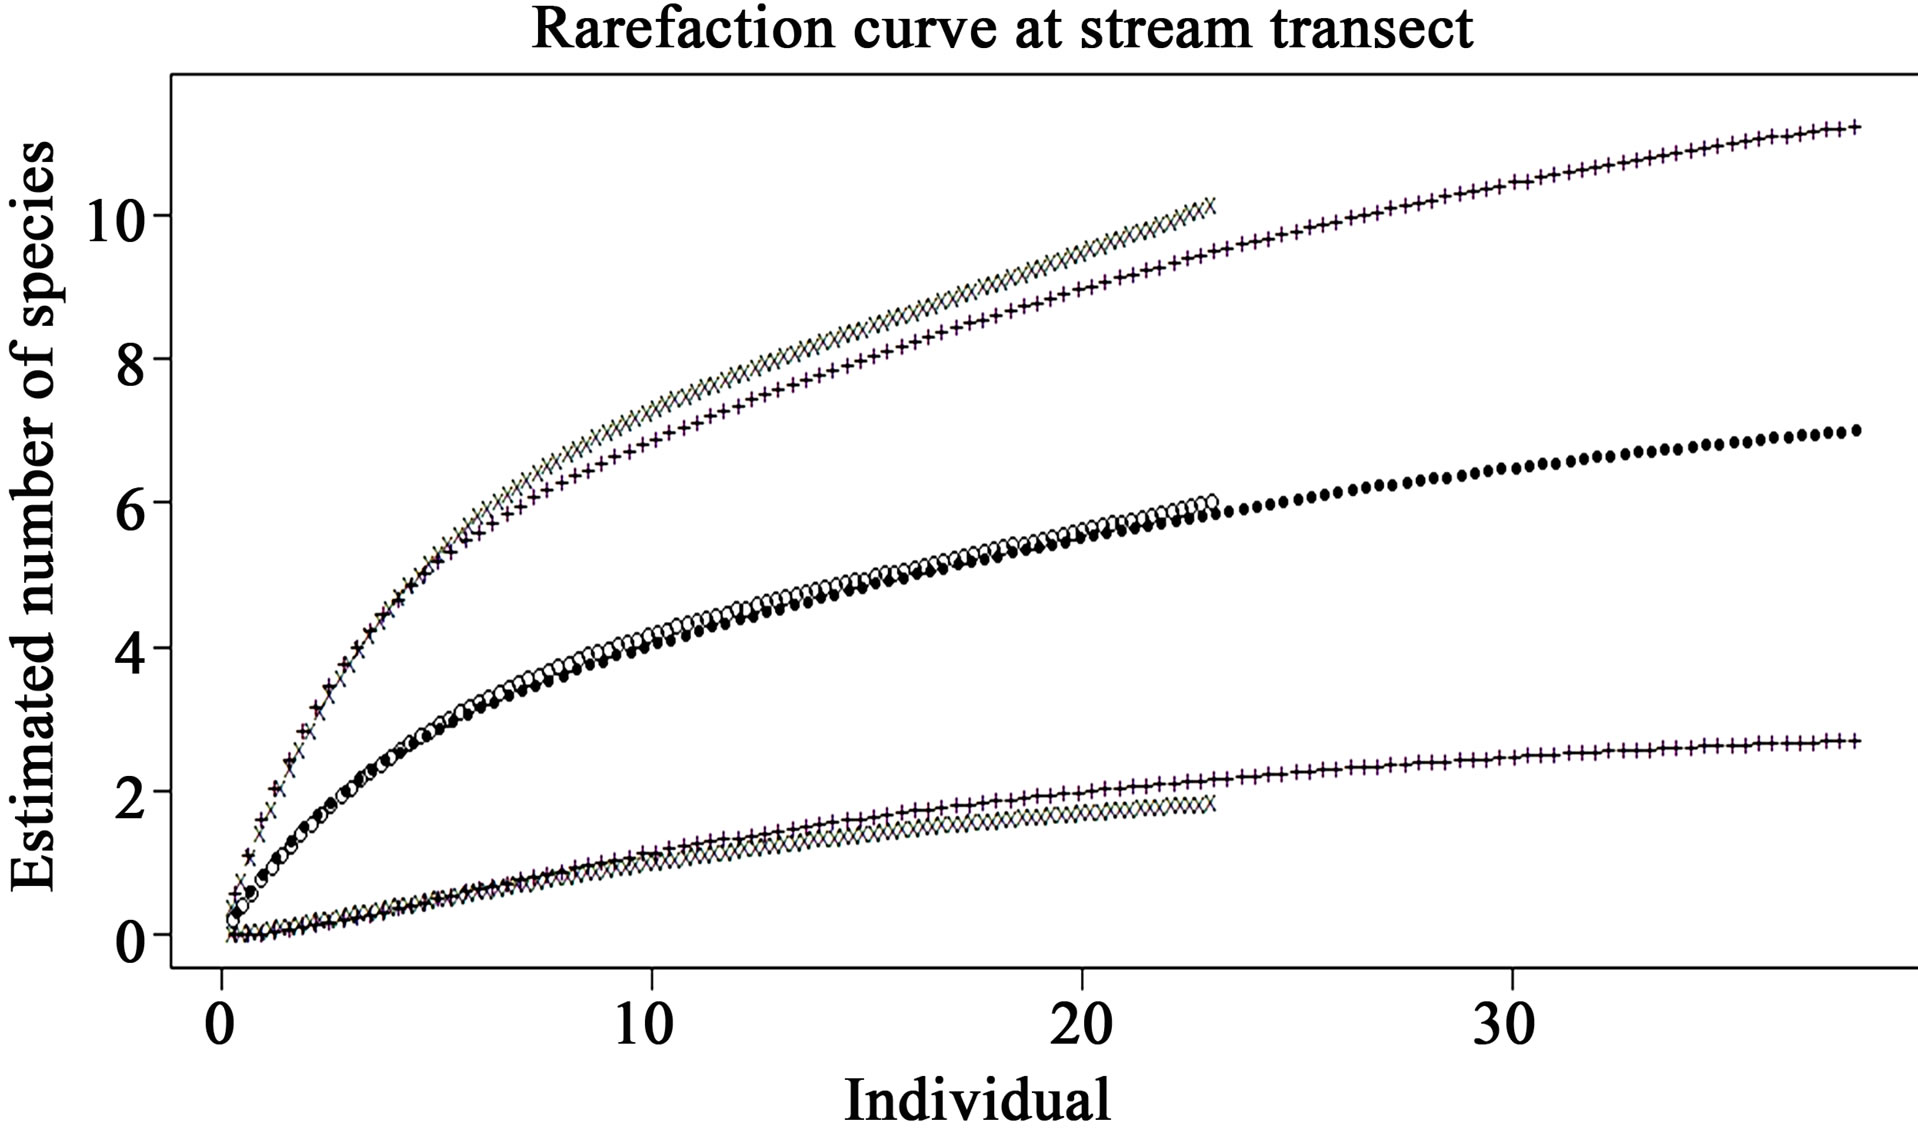
Figure 4. Comparison of species richness between preand post-check dam periods at stream habitat by rarefaction curve with 95% confidence interval. Close dots (—) represent pre-check dam rarefaction curve; Opened dots (°) represent post-check dam rarefaction curve; Plus (+) and x-mark (x) represent the 95% confidence interval of preand postcheck dam curves, respectively.
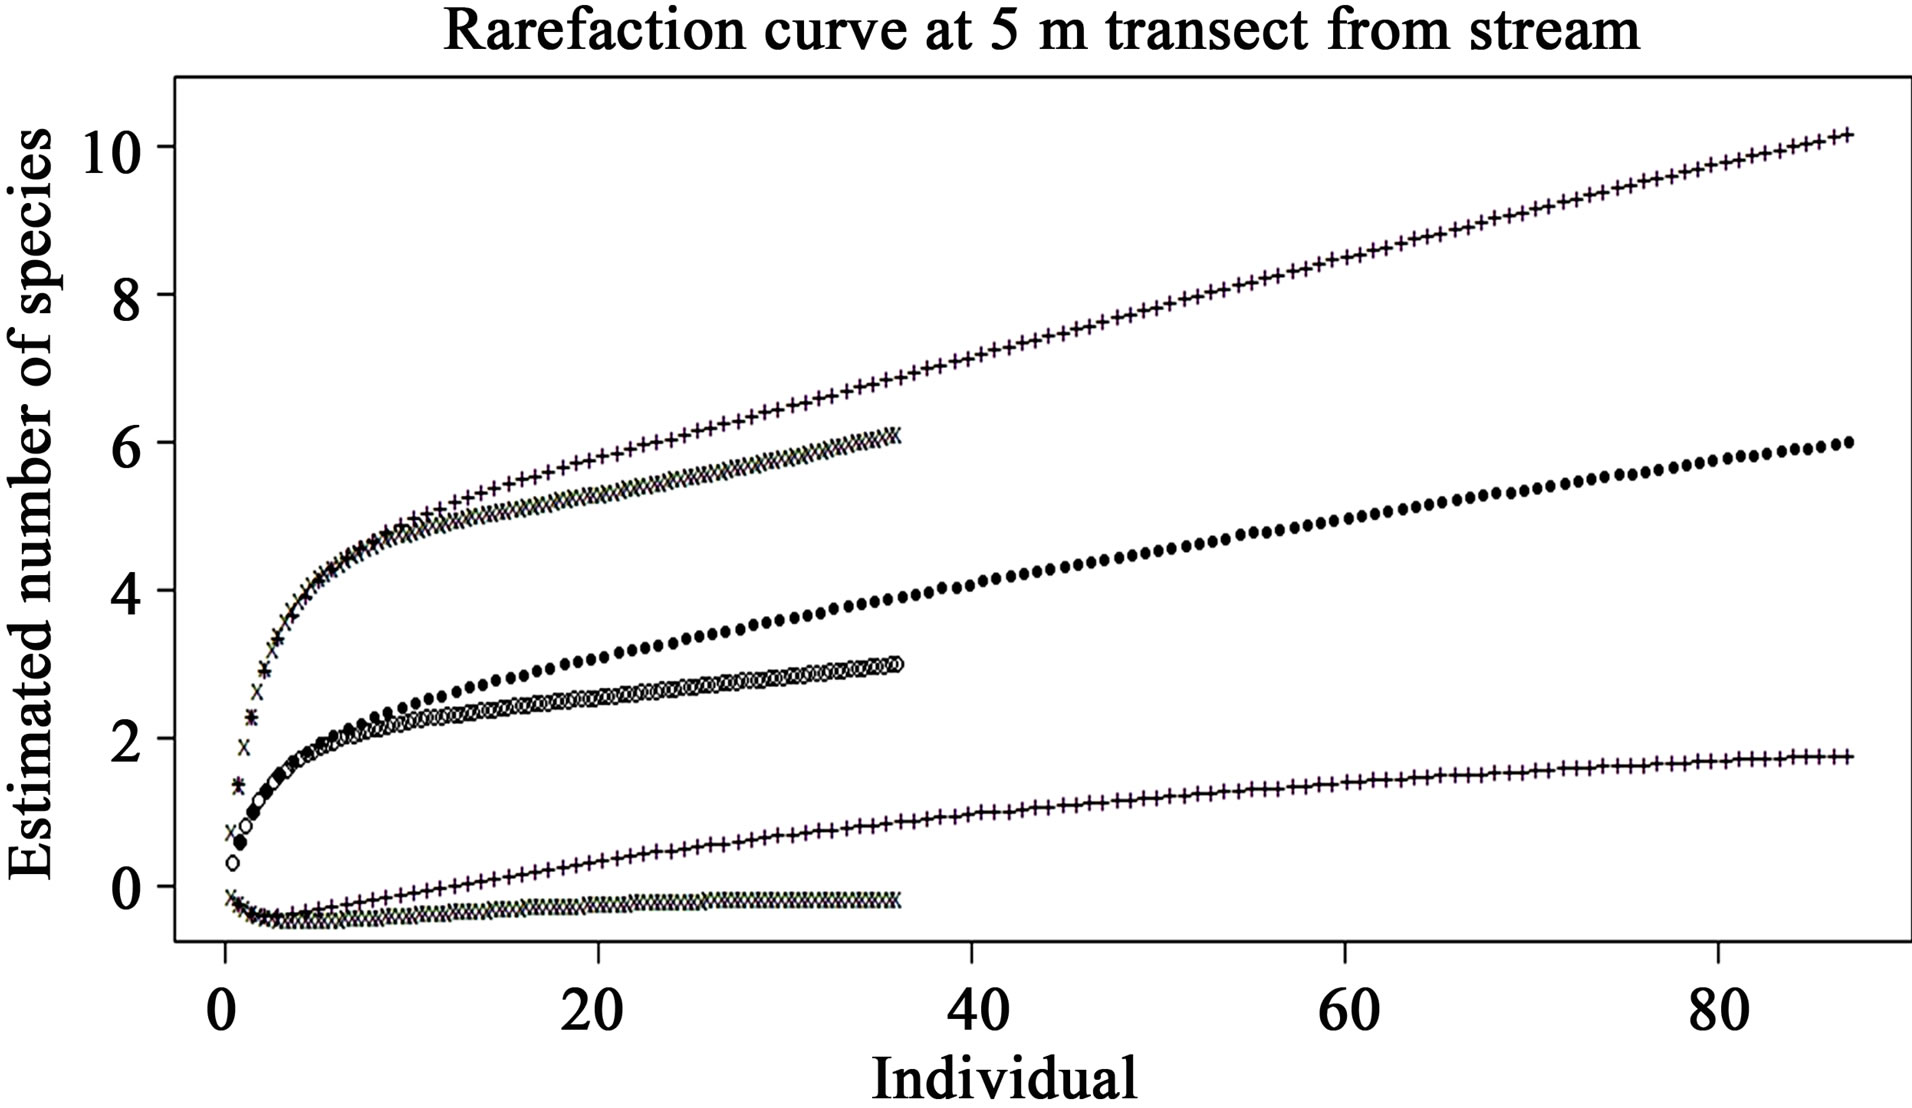
Figure 5. Comparison of species richness between preand post-check dam periods at 5 m terrestrial habitat by rarefaction curve with 95% confidence interval. Close dots (—) represent pre-check dam rarefaction curve; Opened dots (°) represent post-check dam rarefaction curve; Plus (+) and x-mark (x) represent the 95% confidence interval of preand post-check dam curves, respectively.
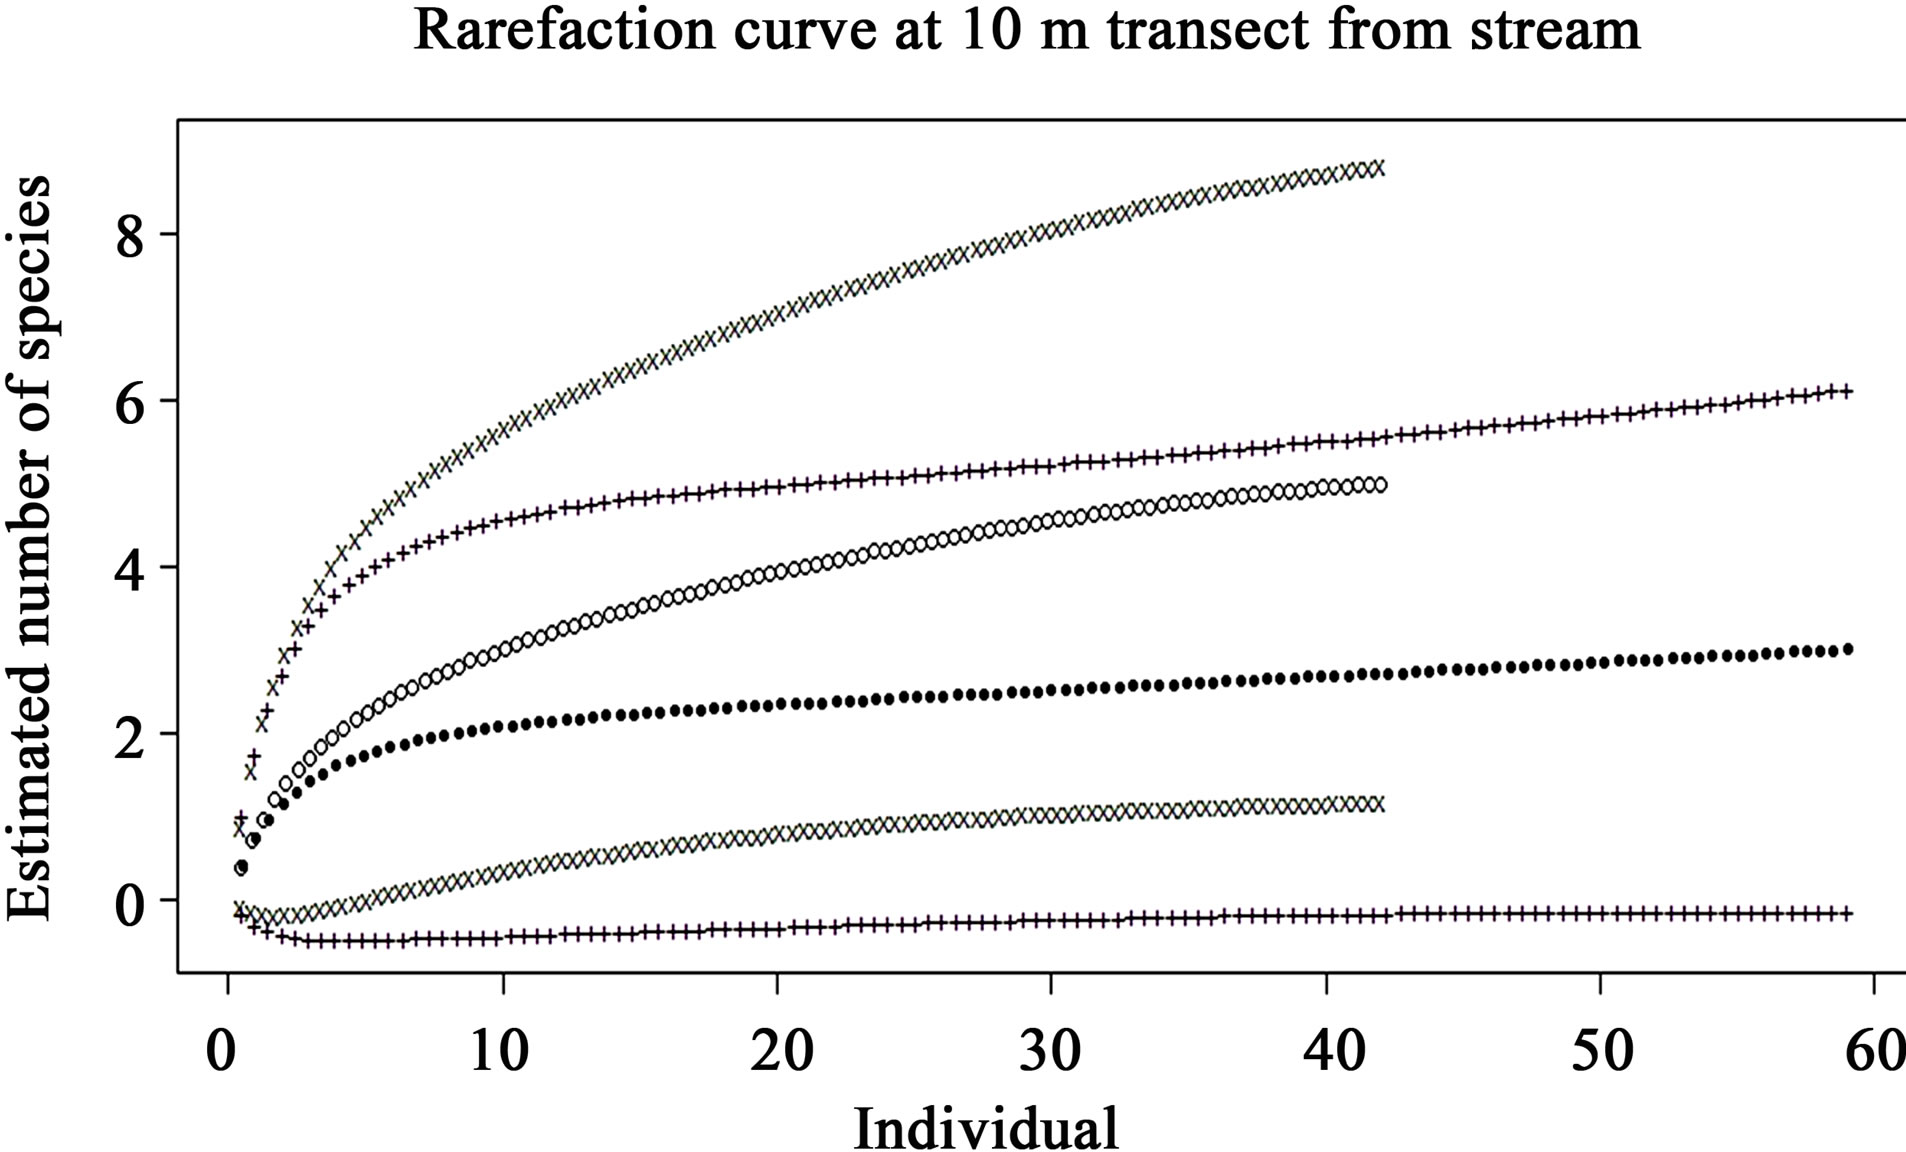
Figure 6. Comparison of species richness between preand post-check dam periods at 10 m terrestrial habitat by rarefaction curve with 95% confidence interval. Close dots (—) represent pre-check dam rarefaction curve; Opened dots (°) represent post-check dam rarefaction curve; Plus (+) and x-mark (x) represent the 95% confident interval of preand post-check dam curves, respectively.
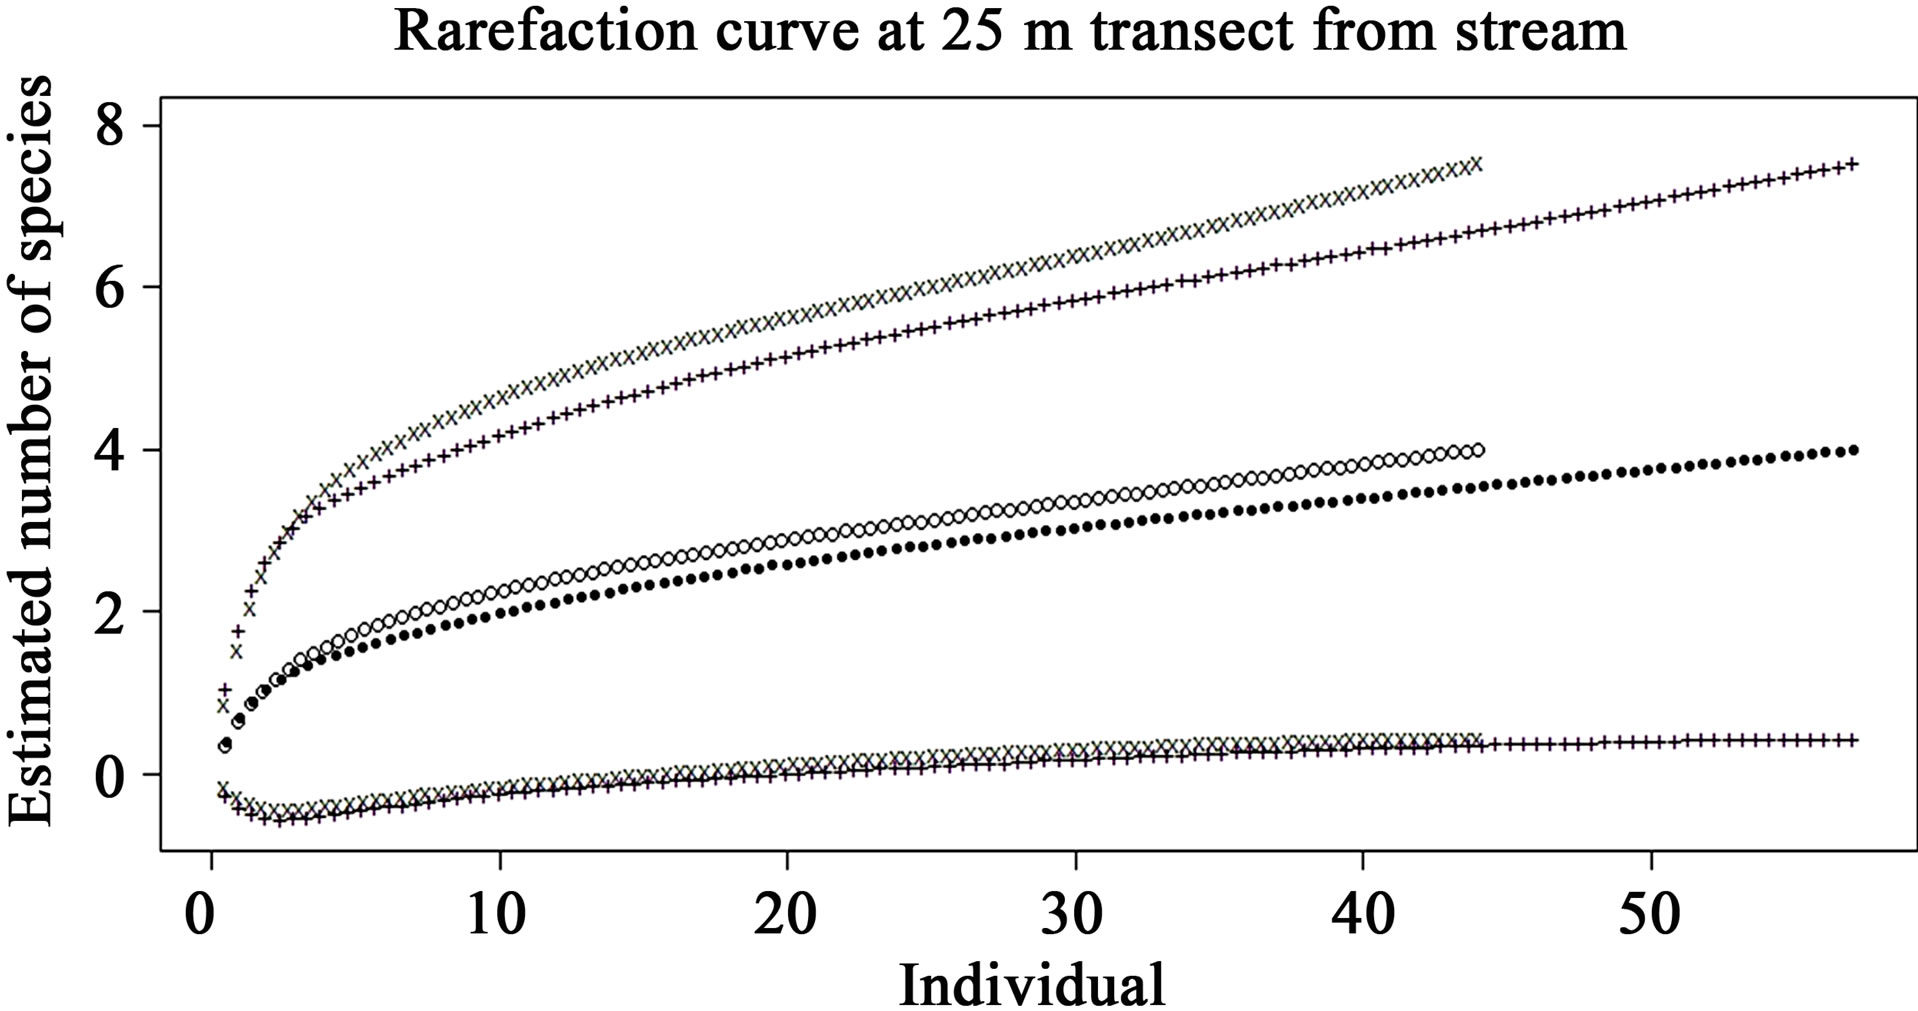
Figure 7. Comparison of species richness between preand post-check dam periods at 25 m terrestrial habitat by rarefaction curve with 95% confident interval. Close dots (—) represent pre-check dam rarefaction curve; Opened dots (°) represent post-check dam rarefaction curve; Plus (+) and x-mark (x) represent the 95% confidence interval of preand post-check dam curves, respectively.
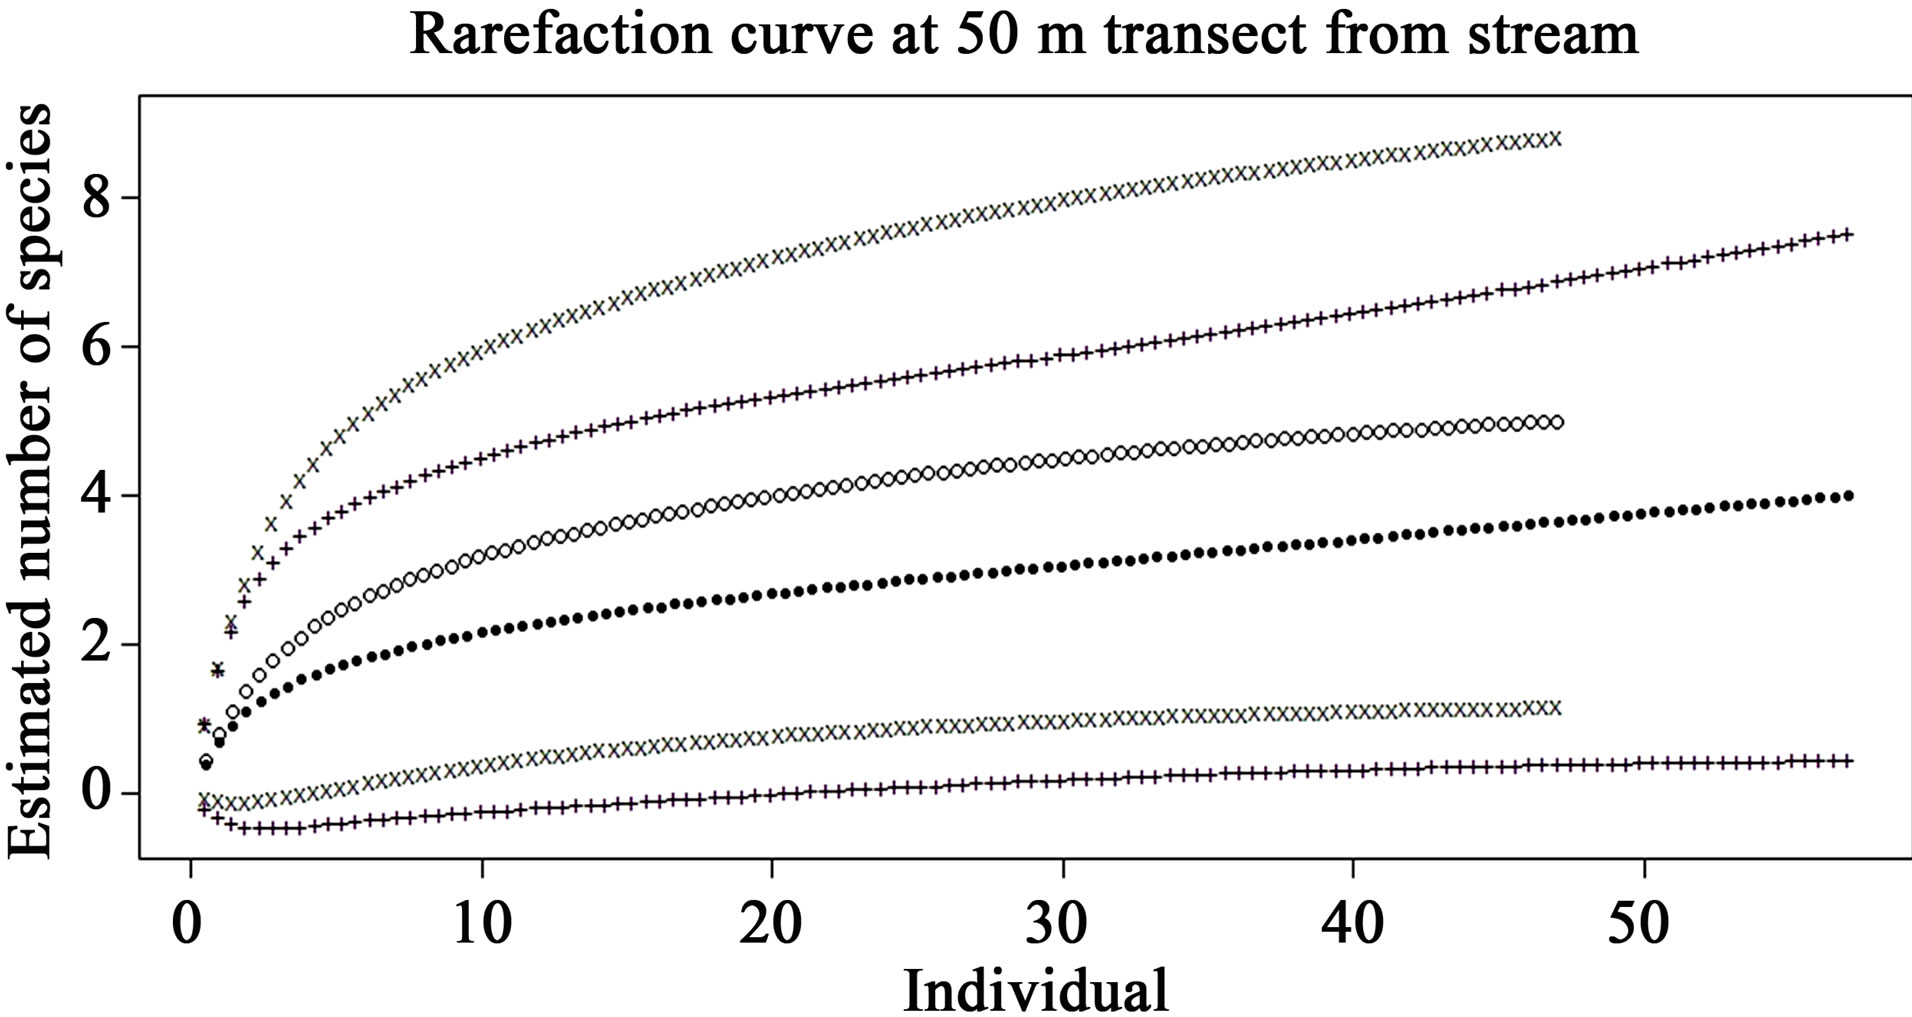
Figure 8. Comparison of species richness between preand post-check dam periods at 50 m terrestrial habitat by rarefaction curve with 95% confidence interval. Close dots (—) represent pre-check dam rarefaction curve; Opened dots (°) represent post-check dam rarefaction curve; Plus (+) and x-mark (x) represent the 95% confidence interval of preand post-check dam curves, respectively.
4. Discussion
The check dam clearly affect the water pattern of this ephemeral stream by changing the physical factors related to water including the hydroperiod, number of water body, and water depth. These physical factors confirmed that check dam can prolong the presence of utilizable water in the area. However, an assumption that the prolonged hydroperiod in this ephemeral stream may affect reptiles that used this ephemeral stream for specific purpose such as heat absorption and sun basking seems to be challenged. The results from the rarefaction curves in every stream and terrestrial transects indicated that reptile diversities were not significantly different between preand post-check dam periods. Moreover, the results from the Morisita’s index of similarity indicated that the reptile composition in every transect was almost the same between preand post-check dam periods. According to this 1-year data, these 2 assemblage parameters indicated that the reptile assemblage was not affected by the check dam albeit its effect on water pattern in this stream.
Although the hydroperiod in the post-check dam period (48.68%) are much longer than those in pre-check dam period (16.82%), data on water depth showed that there were still large part of the stream bed that were not covered by water. Table 1 shows that the mean water depth in post-check dam period is 20.85 cm. Normally, the water depth was recorded at the deepest point of the stream transect, usually located in front of the check dam. Given that maximum capacity of each check dam is equaled to its height or around 1 meter, it can be estimated based on the average water depth that the current capacity of the check dam was around 21% of total capacity. At this mean capacity of 21%, there were some parts of the stream bed that were not covered by water. As a result, reptile can still use this habitat for their activities with small impact from the check dam.
Previous research reported that soil moisture is the significant positive factor for prediction of the presence of herpetofauna species [22]. The current results indicate no significant difference in soil moisture content at every terrestrial transects between preand post-check dam periods. Therefore, this may be the cause of the similarity in reptile assemblage between these 2 periods at the terrestrial habitat.
Plant community structure can also affect the reptile assemblage [22-24]. However, there was no evidence of plant community change during this 1 year period. Long term study is needed in order to determine the effect of check dam on plant community structure and its potential link to reptile assemblage.
In addition to the above reason, this 1-year period after check dam construction may be too short to see an establishment of new reptile species from other areas. Moreover, since the study area is not connected to other forest patches, the time required for such establishment must be relatively long.
5. Conclusion
This study reported and confirmed that presence of check dams in ephemeral stream in a deciduous forest can prolong the presence of exploitable water in the area. Comparison on biotic component using reptile as monitoring species showed no evidence of the check dam effect on the existing reptile diversity and composition in this area. It can be conclude that check dam is the way to prolong the utilizable water in the area with minimal effect on the reptile assemblage. However, long term monitoring is still needed in order to determine the effect of check dam on the reptile assemblage in the long period.
6. Acknowledgements
This research was supported by the Science for Locale Project under the Chulalongkorn University Academic Development Plan (2008-2012) (S4LB-D51-04(H03)), Thai government budget 2009, under the Research Program on Conservation and Utilization of Biodiversity and the Center of Excellence in Biodiversity, Faculty of Science, Chulalongkorn University (CEB_D_20_2009), and Chulalongkorn University Graduate School Thesis Grant. We would like to give a great thank to the Chulalongkorn University Forest and Research Station for the check dam construction, accommodation, and other supports.
REFERENCES
- Intergovernmental Panel on Climate Change (IPCC), “Climate Change 2007: Synthesis Report, Contribution of Working Group I, II and III to the Fourth Assessment Report of the Intergovernmental Panel on Climate Change,” IPCC, Geneva, 2007, p. 104.
- D. H. Gray and A. T. Leiser, “Biotechnical Slope Protection and Erosion Control,” 1st Edition, Van Nostrand Reinhold, New York, 1982. Cited in K. Solaimani, E. Omidvar and A. Kelarestaghi, Eds., “Investigation of Check Dam’s Effects on Channel Morphology (Case study: Chehel Cheshme Watershed),” Pakistan Journal of Biological Sciences, Vol. 11, No. 17, 2008, pp. 2083- 2091.
- Department of Local Administration, “Check Dam Construction,” 2008. http://www.thailocaladmin.go.th/work/e_book/eb1/stan12/p10.pdf
- C. Liu, “The Effectiveness of Check Dams in Controlling Upstream Channel Stability in Northeastern Taiwan,” Proceeding of Erosion, Debris Flows and Environment in Mountain Regions (Proceeding of the Chengdu Symposium 209), Chengdu, 5-9 July 1992, pp. 423-485.
- N. Kalantari, K. Rangzan, S. S. Thigale and M. H. Rahimi, “Site Selection and Cost-benefit Analysis for Artifi- cial Recharge in the Baghmalek Plain, Khuzestan Province, Southwest Iran,” Hydrogeology Journal, Vol. 18, No. 3, 2010, pp. 761-773. doi:10.1007/s10040-009-0552-x
- J. Nyssen, M. Veyret-Picot, J. Poesen, J. Moeyersons, M. Haile, J. Deckers and G. Govers, “The Effectiveness of Loose Rock Check Dams for Gull Control in Tigray, Northern Ethiopia,” Soil Use and Management, Vol. 20, No. 1, 2004, pp. 55-64. doi:10.1111/j.1475-2743. 2004.tb00337.x
- A. Romero-Díaz, F. Alonso-Sarriá and M. Martínez-Lloris, “Erosion Rates Obtained from Check-Dam Sedimentation (SE Spain): A Multi-Method Comparison,” CATENA, Vol. 71, No. 1, 2007, pp. 172-178. doi:10.1016/j.catena.2006.05.011
- X. Xiang-Zhou, Z. Hong-Wu and Z. Ouyang, “Development of Check-Dam Systems in Gullies on the Loess Plateau, China,” Environmental Science & Policy, Vol. 7, 2004, pp. 79-86. doi:10.1016/j.envsci.2003.12.002
- Q. L. Zeng, Z. Q. Yue, Z. F. Yang and X. J. Zhang, “A Case Study of Long-Term Field Performance of CheckDams in Mitigation of Soil Erosion in Jiangjia Stream, China,” Environmental Geology, Vol. 58, No. 4, 2009, pp. 897-911. doi:10.1007/s00254-008-1570-z
- C. Shieh, Y. Guh and S. Wang, “The Application of Range of Variability Approach to the Assessment of a Check Dam on Riverine Habitat Alteration,” Environmental Geology, Vol. 52, No. 3, 2007, pp. 427-435. doi:10.1007/s00254-006-0470-3
- Watershed Conservation and Management Office, “Benefit of the Check Dam,” 2008. http://www.dnp.go.th/Watershed/checkdam_site/cd_benefit3.htm
- P. Treepatanasuwan and P. Ploychareon, “Plant Community Change in the Check Dam Forestry Area at Phu-Phan Royal Development Study Centre, Sakon Nakorn Province,” Wildlife and Plant Conservation, Bangkok, 2006.
- G. R. Zug, L. J. Vitt and J. P. Caldwell, “Herpetology: An Introductory Biology of Amphibians and Reptiles,” 2nd Edition, Academic Press, Cambridge, 2001, p. 630.
- P. Dumrongrojwatthana, “Impacts of Forest Disturbance on Soil Organic Matter, Soil Nutrients and Carbon Sequestration in Nam Wa Sub-Watershed, Nan Province,” M.Sc. Thesis, Chulalongkorn University, Bangkok, 2004, p. 191.
- H. Walter, E. Harnickell and D. Mueller-Dombois, “Climate-Diagram Maps,” Springer-Verlag, Berlin, 1975, p. 36.
- W. R. Heyer, M. A. Donnelly, R. W. McDiarmid, L. C. Hayek and M. S. Foster, “Measuring and Monitoring Biological Diversity: Standard Methods for Amphibians,” Smithsonian Institution Press, Washington DC, 1994, p. 364.
- J. H. Zar, “Biostatistical Analysis” 4th Edition, Prentice Hall International, Hemel Hempstead, 1999, p. 663.
- R. K. Colwell, “EstimateS: Statistical Estimation of Species Richness and Shared Species from Samples,” Version 8, 2006. http://purl.oclc.org/estimates
- R. K. Colwell, C. X. Mao and J. Chang, “Interpolating, Extrapolating, and Comparing Incidence-Based Species Accumulation Curves,” Ecology, Vol. 85, No. 10, 2004, pp. 2717-2727. doi:10.1890/03-0557
- H. Wolda, “Similarity Indices, Sample Size, and Diversity,” Oecologia, Vol. 50, No. 3, 1981, pp. 296-302. doi:10.1007/BF00344966
- C. J. Krebs, “Ecological Methodology,” 2nd Edition, Addison-Wesley Educational, Menlo Park, 1999, p. 620.
- J. Vonesh, “Patterns of Richness and Abundance in a Tropical African Leaf-Litter Herpetofauna,” Biotropica, Vol. 33, No. 3, 2001, pp. 502-510. doi:10.1111/j.1744- 7429.2001.tb00204.x
- L. A. Fitzgerald, F. B. Cruz and G. Perotti, “Phenology of a Lizard Assemblage in the Dry Chaco of Argentina,” Journal of Herpetology, Vol. 33, No. 4, 1999, pp. 526-535. doi:10.2307/1565568
- G. R. Friend and K. M. Cellier, “Wetland Herpetofauna of Kakadu National Park, Australia: Seasonal Richness Trends, Habitat Preferences and the Effects of Feral Ungulates,” Journal of Tropical Ecology, Vol. 6, No. 2, 1990, pp. 131-152. doi:10.1017/S0266467400004235
NOTES
*Corresponding author.