Journal of Water Resource and Protection
Vol.4 No.4(2012), Article ID:18423,7 pages DOI:10.4236/jwarp.2012.44025
The Dynamics of Domestic Water Vending in Enugu North L.G.A. of Enugu State, Nigeria
1Department of Geography & Environmental Management, Imo State University, Owerri, Nigeria
2Department of Urban & Regional Planning, Imo State University, Owerri, Nigeria
3Department of Geography & Environmental Management, University of Port Harcourt, Port Harcourt, Nigeria
Email: emmazob@yahoo.com
Received January 16, 2012; revised February 20, 2012; accepted March 22, 2012
Keywords: Households; Enugu State; Tanker Trucks; Water Policy; Cost; Water Vending
ABSTRACT
The present investigation provides a case study of water vending in Enugu North Local Government Area, Enugu State of South Eastern Nigeria. Questionnaire copies were randomly distributed in the study area to 200 households. Data obtained from the field were analyzed using descriptive statistics and chi-square test. The analysis revealed that almost all the residents of Enugu North L.G.A. obtain their water from independent water vending systems which are operated by the private sector. Tanker truck, distributing and small retail water vendors all operate in the study area. There are an estimated number of 250 tanker truck drivers serving Enugu North L.G.A. Approximately 35 tanker trucks serve Hilltop/Udi siding ward, while there are a total of 52 retail vendors in Onuasata ward. Majority of the respondents are low income earners who spend within the ranges of NGN500 ($3.33) and NGN1500 ($10) a month on water on the average. 50.0 percent of these respondents opined that vended water was expensive. Of the respondents, 49.4 percent consumed 91 - 100 litres per capita per day, which is less than the 120 litres per capita per day recommended by the Federal Republic of Nigeria’s National water supply and sanitation policy document of 2000. This deficit can be attributed to the cost of vended water. From the chi-square test, there is significant difference in the unit cost of water sold by vendors in the various wards in Enugu North L.G.A. In the absence of regular water provision through pipe-connections from the public utility, water vending should be supported but regulated. Meeting the water and sanitation target and optimizing water resources for the Millennium Development Goals (MDGs) by 2015 will require a dramatic scaling up of joint efforts by the state government and the people in ensuring that vendors provide safe water at a low cost.
1. Introduction
Water sale and the privatization of urban water supply in Africa has remained an issue since the 1980s. Several other issues have arisen as a fall out of this trend. It is highly contested who actually benefits: the consumers, or rather those selling water to the households? World Bank and some other global players consider water as a commodity which should be allocated according to market logics. On the other hand there are those who regard water in terms of public goods, basic needs and human rights, and they strongly oppose commercialization of water services. Thus, water sales, water vending and water privatization are currently of concern to individuals, groups and government.
From the recent past till date, the supply of potable water for domestic use is a major challenge for the development effort in Nigerian cities. Unfortunately, the increasing gap in the demand and supply of water has acquired crisis proportions. Most of Nigeria’s State Water Agencies (SWAs) are grappling with the multiple problems of erratic power supply, corruption policies, diversion and theft of heavy equipments, poor maintenance culture, faculty distribution system, and the topography of the area. In addition to the aforementioned factors, population growth and bad-housing in some towns and cities have meant that most public water facilities put in place by the SWA are over-stretched and incapable of efficient water delivery to the people. Consequently, water supply at public water taps is often irregular and of short durations and most residents of cities rely heavily on commercial borehole owners and itinerant (water tanker drivers) water vendors for their daily supplies. Some research findings in previous studies, example Isreal [1] indicate that it is the widespread water shortage that has made urban water problem a central policy issue. There is a pressing need in the academia to investigate the types of domestic water vending and their characteristics in urban and rural areas.
Many people world-over rely on water supplied by tankers or other forms of vendor supplies [2]. A small proportion of vended water is delivered in containers brought by carts, bicycles, or jeepneys and in tanks or trucks. The water may come from hydrants connected to utility supplies or may be drawn from alternative sources. In many cases, the consumer will not be aware of the source of the water and there may be significant concerns about the quality of the water. In some instances vended water is water delivered to households by vendors who collect it from village wells using the same technology used by households who collect their own water. Others sell from home built underground tanks and reservoirs and are supplied with water from private water tankers. Generally, vendors sell water from many sources.
Water does not cost the same everywhere; the price of water varies widely between cities and rural areas and between economic sectors. Increasing cost of water has slowly provided incentives to change the way water is valued. In water vending, the following costs are considered; pumping, treatment, storage and purchase costs. Price is, no doubt, the most important determinant of a household’s decision to opt for a new source of supply. Residents that resort to buying water from vendors often do so at extremely high prices, often 5 - 10 times existing tariffs for public water supply [3]. Beyond cost considerations, vending is sometimes linked to health problems as hawkers may sell from polluted sources or fouled containers at each point of handling through collection and transport.
Researchers who have done studies in urban areas concentrating on water vending have shown little interest in investigating West Africa and particularly Nigeria. There are only two major documented efforts; the first on Onitsha, Anambra State and the second on Yola North in Adamawa State. At the request of the World Bank’s Infrastructure Division for West Africa, a study was undertaken in 1987 of water vending in Onitsha, Nigeria by Whittington, et al. [2]. This study showed that in the dry season water vendors delivered twice, as much water as the public water system and that payment for vended water were more than 20 times the payments made for water from the utility. The Yola North study by Ishaku, et al. [4] revealed that the non-evolution of special programs for regularizing informal settlements, meaning legalization of land tenure is responsible for the absence of piped water networks and the upsurge in water vendor patronage. The role of these informal and unregistered service providers in the delivery of water is under research. Little is still known about urban water vending activities in Nigeria. To provide or improve service delivery in Nigerian cities, the study area inclusive, a greater understanding of the dynamics of water vending is needed. This is because until recently the value of information on these activities was not appreciated by water resource engineers or policy analysts.
Previous studies on Enugu urban area and field observations in particular have equally revealed some of the associated problems that made it imperative to conduct this study. Enugu as a capital city of Enugu State from its inception had its inhabitants using rivers and streams as sources of water. A look into the historical development of Enugu urban showed that the water supply development is not commensurate with its population growth. Shortage of water supply has been a very big problem to the people of Enugu urban [5]. The metropolis has been characterized by recurrent water scarcity as is the case with most cities of developing nations. As the metropolis grows, the limitation in water available to competing regions becomes more obvious. While some parts of Enugu North Local Government Area have water occasionally, some areas are yet to be included in the water supply scheme. The use of water in households within Enugu incurs variations in cost with few areas having access to the supply. Problems occur in the supply of domestic and municipal water because of climatic variations, since water shortages occur in both dry and rainy seasons. Inadequacies in collection to meet maximum demands throughout the year are the principal factors of these shortages. It is imperative to study the contribution and activities of water vendors whose patronage are now gaining grounds in Enugu city as a result of the failure of government to provide adequate water supply to the people. This study will not only concern itself with locational attributes of water vending, it will also examine some cost implications of water vending activities. It is hoped that the findings of this study will be policy relevant information that would serve as a policy guide to the state government in the intervention and provision of safe water for the people. It will also aid the planning and management of the water resources in any similar region. Finally, it will contribute to the ongoing research on water privatization.
2. Aim and Objectives of the Study
The aim of this study is to investigate the dynamics of water vending in Enugu North Local Government Area with the following objectives:
1) To identify the different types of domestic water vending and their characteristics.
2) To assess the quantity of water and amount spent on vended water and relate it to the income of water users.
3. Material and Methods
The primary data needed for the study was obtained through the use of questionnaire. A well structured questionnaire of twenty-seven variables was designed and administered to the target population. The questionnaire had sections. Section A contained items on demographic characteristics of the respondents (e.g. sex, age). Section B summarily contained questions on water vendors, such as their sources of water, rate of demand for water by households and their interface with water users. Oral interviews were also conducted in order to elicit more information from households that patronize water vendors as well as vendors who sell water to these households.
In this study, the primary study unit is a household. The definition of household in the context of this study is a married person with a family or an unmarried person of at least 21 years of age living alone and catering for himself or herself. The data for this study were gathered from a sample survey of 200 households. To obtain an even sample, in all the wards regardless of size—25 households were randomly picked and served the questionnaire. It was ensured that all the wards in Enugu North L.G.A. of Enugu State were represented in the survey, namely; Umunevo, Onuasata, Ogbete East, Ogbete West, GRA, Ogui New Layout, Hilltop/Udi siding and Ogui-Township. The water users were required to supply information on the unit of water consumption (whether bucket, jerry can or tank) they employ, the availability and regularity of vended water, the cost of procured water i.e. amount monthly and proximity to the source. The vendors were required to give information on the cost of vended water. In summary, four categories of people were interviewed and these were; truck drivers, small retail water vendors, distributing vendors, and households. Costs were also calculated through information from key informants interviewed for those households that could not readily supply this information while filling the questionnaire. Quantities were estimated in units of standard buckets, jerry cans, and drums of water per day, and these were then converted to litres by the researcher. A gallon has a capacity of 4.5 litres, a standard bucket has a capacity of 12 litres, while our measure of an average drum is a capacity of 215 litres. Those who had literacy problems were interviewed by the enumerators who aided the researchers in the field.
All the inhabitants of Enugu North Local Government Area numbering 279,089 in the year 2006 (Census figure) constituted the population for the study. The respondents were either heads of households or spouses. Ideally the study targeted a person who manages household finances and procures water from vendors. Unfortunately this was not always possible. However, this approach is not expected to affect the study results. The data were subjected to descriptive statistics and chi-square statistical test. The chi-square test was used precisely to test the research hypothesis.
4. Results and Discussion
Umunevo, Onuasata, Ogbete East, Ogbete West, GRA, Ogui New Layout, Hilltop/Udi siding and Ogui township, are the eight wards of Enugu North L.G.A. and they are supplied with water by water tanker truck vendors (drivers). Umunevo ward is the largest user of this water source, followed by Hilltop/Udi siding. Whereas Ogbete West is the least user of this water source due to the presence of pipe borne water. Water is being regarded as an economic good by most of the residents; this is not necessarily by choice rather by compulsion. In many parts of the world, water markets have become the norm. This is obtainable in the study area as shown in Table 1. One of the benefits is that it allows for unrestricted reallocation of water which is especially important in the dry season.
The predominant water vendors in Hilltop/Udi siding are wholesale tanker truck vendors (see Table 1). These tanker truck vendors operate mostly during weekends. Responses obtained from the field during fieldwork revealed that approximately 35 tanker trucks serve Hilltop/Udi siding. The price is usually influenced by the volume of sales; it costs N4000 ($27) to procure 1,000 litres of water and N2500 ($16.7) to procure 500 litres if it is wholesale. While in the case of retail, it costs N30 to procure 20 litres (1 gallon) of water in the past, 1000 litres was sold for N1500 ($10) before it rose to N4000 ($27) currently. The entire Hilltop/Udi siding has no pipe borne water. The tanker truck water vendors have operated in this ward for a period of ten (10) years, constantly supplying water.
In Onuasata, the predominant types of vendors are retail vendors. They sell a gallon of water N10.00 ($0.07) and a bucket of water N5.00 ($0.03) if the water source is a well. The major source of the water sold by the vendors is well and pipe borne water. The water users use the well water for cooking and washing and the pipe borne water for drinking. When pipe borne water is not running and when the well dries up, the people resort to spring water (which they complain is not fit for consumption) as
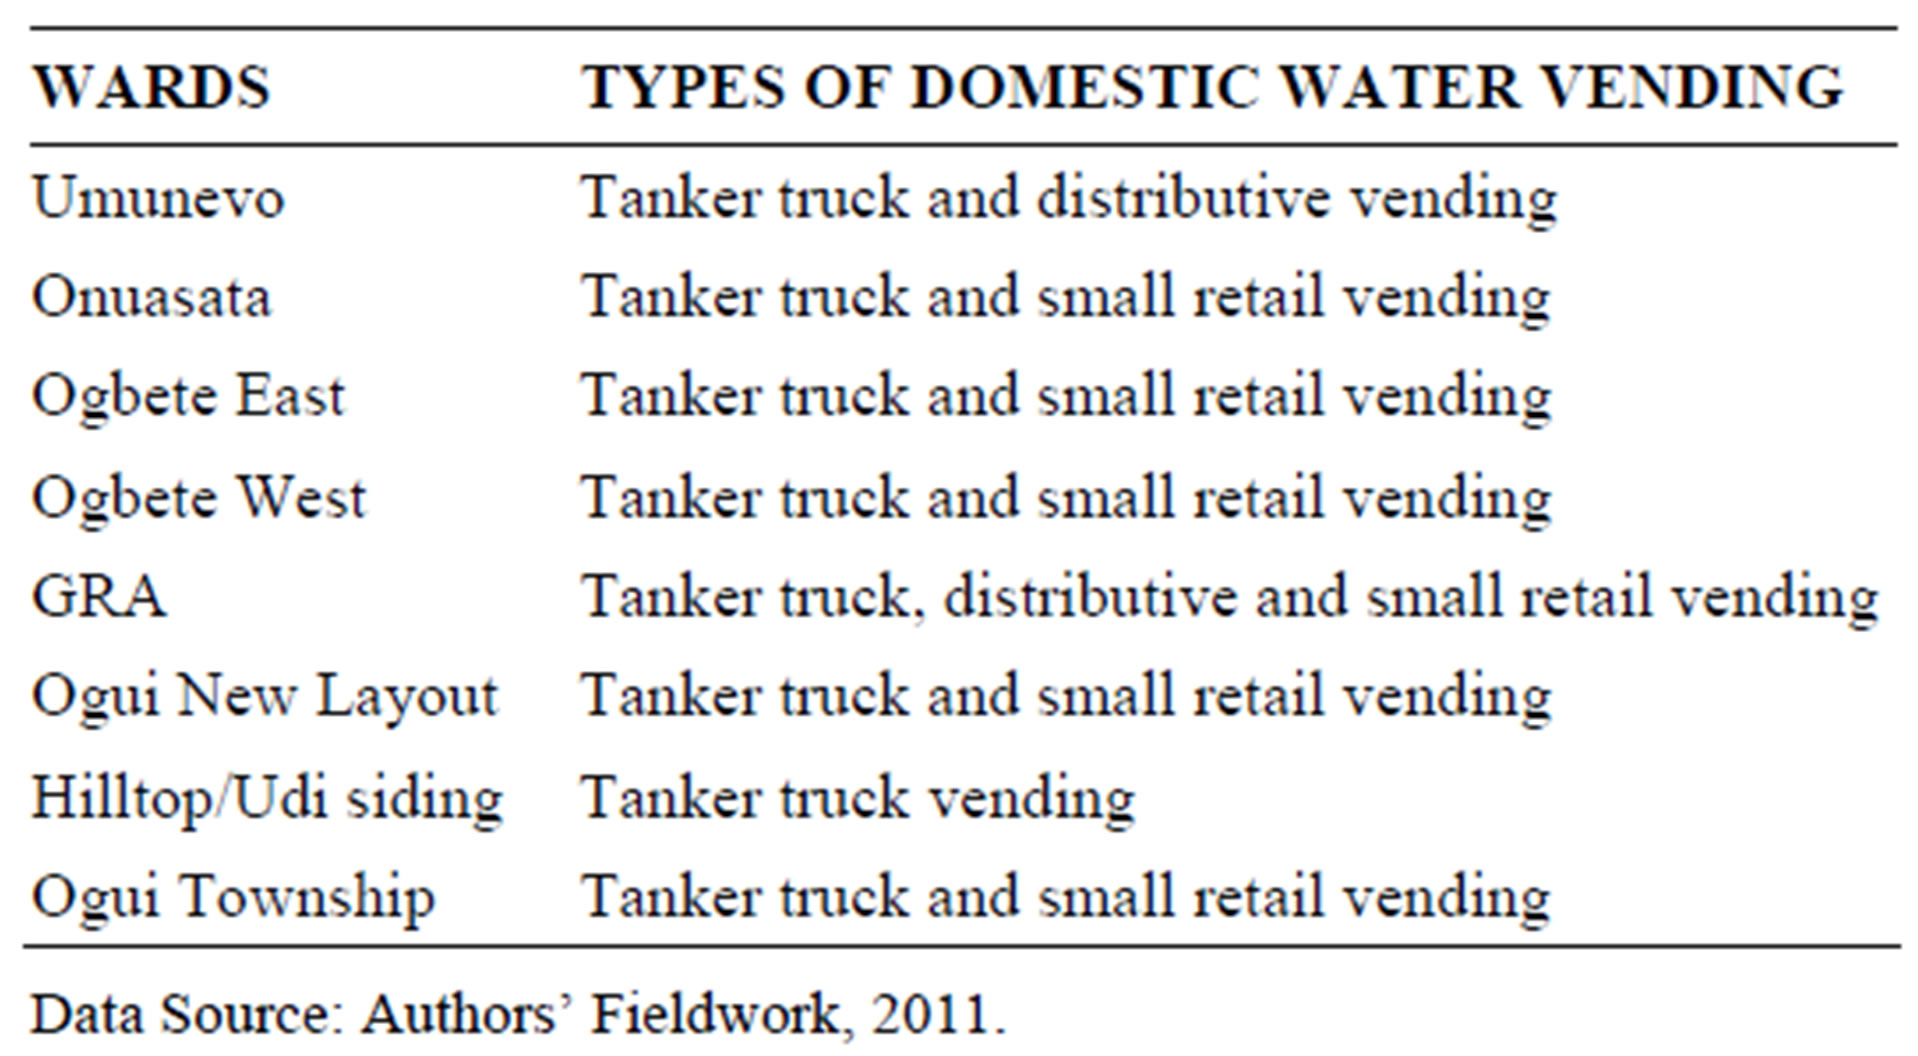
Table 1. Types of Domestic water vending found in the study area.
well as sachet water for drinking. In the case of pipe borne water abstraction, the retail vendors connect rubber hoses and polyvinyl chloride (PVC) pipes from their pipe borne water stand pipes to their storage tanks and sell. Three 25 litre cans are sold for N10 ($0.07) and at other times it may go for a little more i.e. two 25 litre cans for N10. When pipe borne water ceases to run and becomes absent, retail vendors sell 25 litre jerry can of water at N40.00 ($0.27). There are a total of 52 retail vendors in this ward.
The situation in Ogbete West varied slightly. This ward was served by pipe borne water from the public utilities as its initial artificial source of water supply. The trend has changed with time. The current situation has now degenerated into a critical state, as a result of infrastructural provision lapses especially in the water sector. The residents now resort to patronizing water vendors. The nature of vending activity in this ward is retail, while the source is the well. Vendors pump water from wells into Gee Pee tanks and sell to the users in gallons. There are no boreholes in the area. In all five wells exist in Ogbete West which were constructed mainly for vending purposes. The retail vendors sell N50.00 ($0.33) per gallon to the users. The residents are facing the plight with an outcry. This due to the on-going road construction works which has further left them without water even during the rainy season. The five wells cannot adequately serve the population of the ward in its dire need for domestic water.
Unlike in Ogbete West, only three (3) wells serve Ogbete East. The high demand for water has led to hike in cost of water; a gallon is sold for N50.00 ($0.33) while 50 litres of water is sold for N100.00. There is a growing presence of tanker truck vendors due to the inadequacy of water supply by the small retail vendors. Ten (10) tanker trucks supply water to the retail vendors, in addition to the well water being pumped daily by vendors into storage tanks for sale. Consequently, residents pay N50 ($0.33) per gallon to retail vendors. In Ogbete East tanker truck vendors do not sell water directly to individuals but only to retailers. Those retail vendors in turn sell in gallons to the people who live in the ward. The scarcity of water took a terrible turn in 2010, and has been that way till date.
In the GRA ward, the predominant type of water vending is the door-to-door distributing vending. These vendors are of two categories, there are the Hausas (Mai Ruwa) who carry two gallons on their shoulders to sell on one hand and those that sell in carts on the other. While the cart vendors revealed their source of water, the Hausas did not. The cart vendors get their water from well and pipe borne water. The cart vendors are roughly about 30 in number and have operated for about fifteen years in the ward, while the Hausa vendors are just ten and have operated for 5 years. They latter claim they wash their gallon yearly as the need arises.
Umunevo ward has been experiencing water vending activities for the past 18 years. The ward is characterized by the prevalence of tanker trucks water vending, cart operators and the water users going to buy water from retailers. The tanker trucks supplying the people of Umunevo ward with water are 20. There are 15 cart vendors and several hundreds of households buying water from different retail vendors in the ward. The Umunevo ward has on the average, 32 tank (small) retail vendors that are selling water at N15 per gallon.
Ogui Township and Ogui new layout are two wards with similarities in the nature of their water vending activities. Water users buy the water from designated points and stands where the vendors sell. In the field during the fieldwork exercise, 80 small retail vendors were recorded in the two wards while only 16 wholesale (tanker truck) vendors were recorded then. When the vendors (the tanker truck drivers and attendants) were questioned on the sanitary condition of their tanks, they attested to the fact that they wash the outside of the tank more often and rarely wash the inside.
Irrespective of the season, as a result of inadequacy of water sources most people resident in the eight wards studied buy water. This water is bought from water vendors, made up of water tanker truck drivers, small retail water vendors and distributing vendors but not managers/attendants. Thus, the patronage is high irrespective of the source of the water or its quality as they serve the entire wards in Enugu North L.G.A. Generally, vendors are not under the control of monopoly or cartel pricing but to seek recognition vendors form associations [6-8], the vendors that use trucks have a union known as tanker drivers’ union which started in the early 1970s. Water that fills up a truck’s tank may be obtained at N600 and sold between N2500 ($16.7) and N4000 ($27). The truck drivers do not pull their funds together or centrally. To get the estimate of their annual income from water sales is difficult because they render accounts to the business owners differently indicating they are independent. There are an estimated number of 250 tanker truck drivers serving Enugu North L.G.A. in terms of water provision.
The respondents proffered several reasons for their high patronage of vended water in the various wards. Some of the respondents indicated ready water availability as reason for water vendor patronage. There were others who indicated proximity of the source and service delivery efficiency. The reason that borders on quality of water was the least indicated by the residents. The quantity sold by the vendors daily differs from ward to ward and from household to household (see Table 2). Some water users buy lots of water. This is because it has become necessary for each household to store its own water
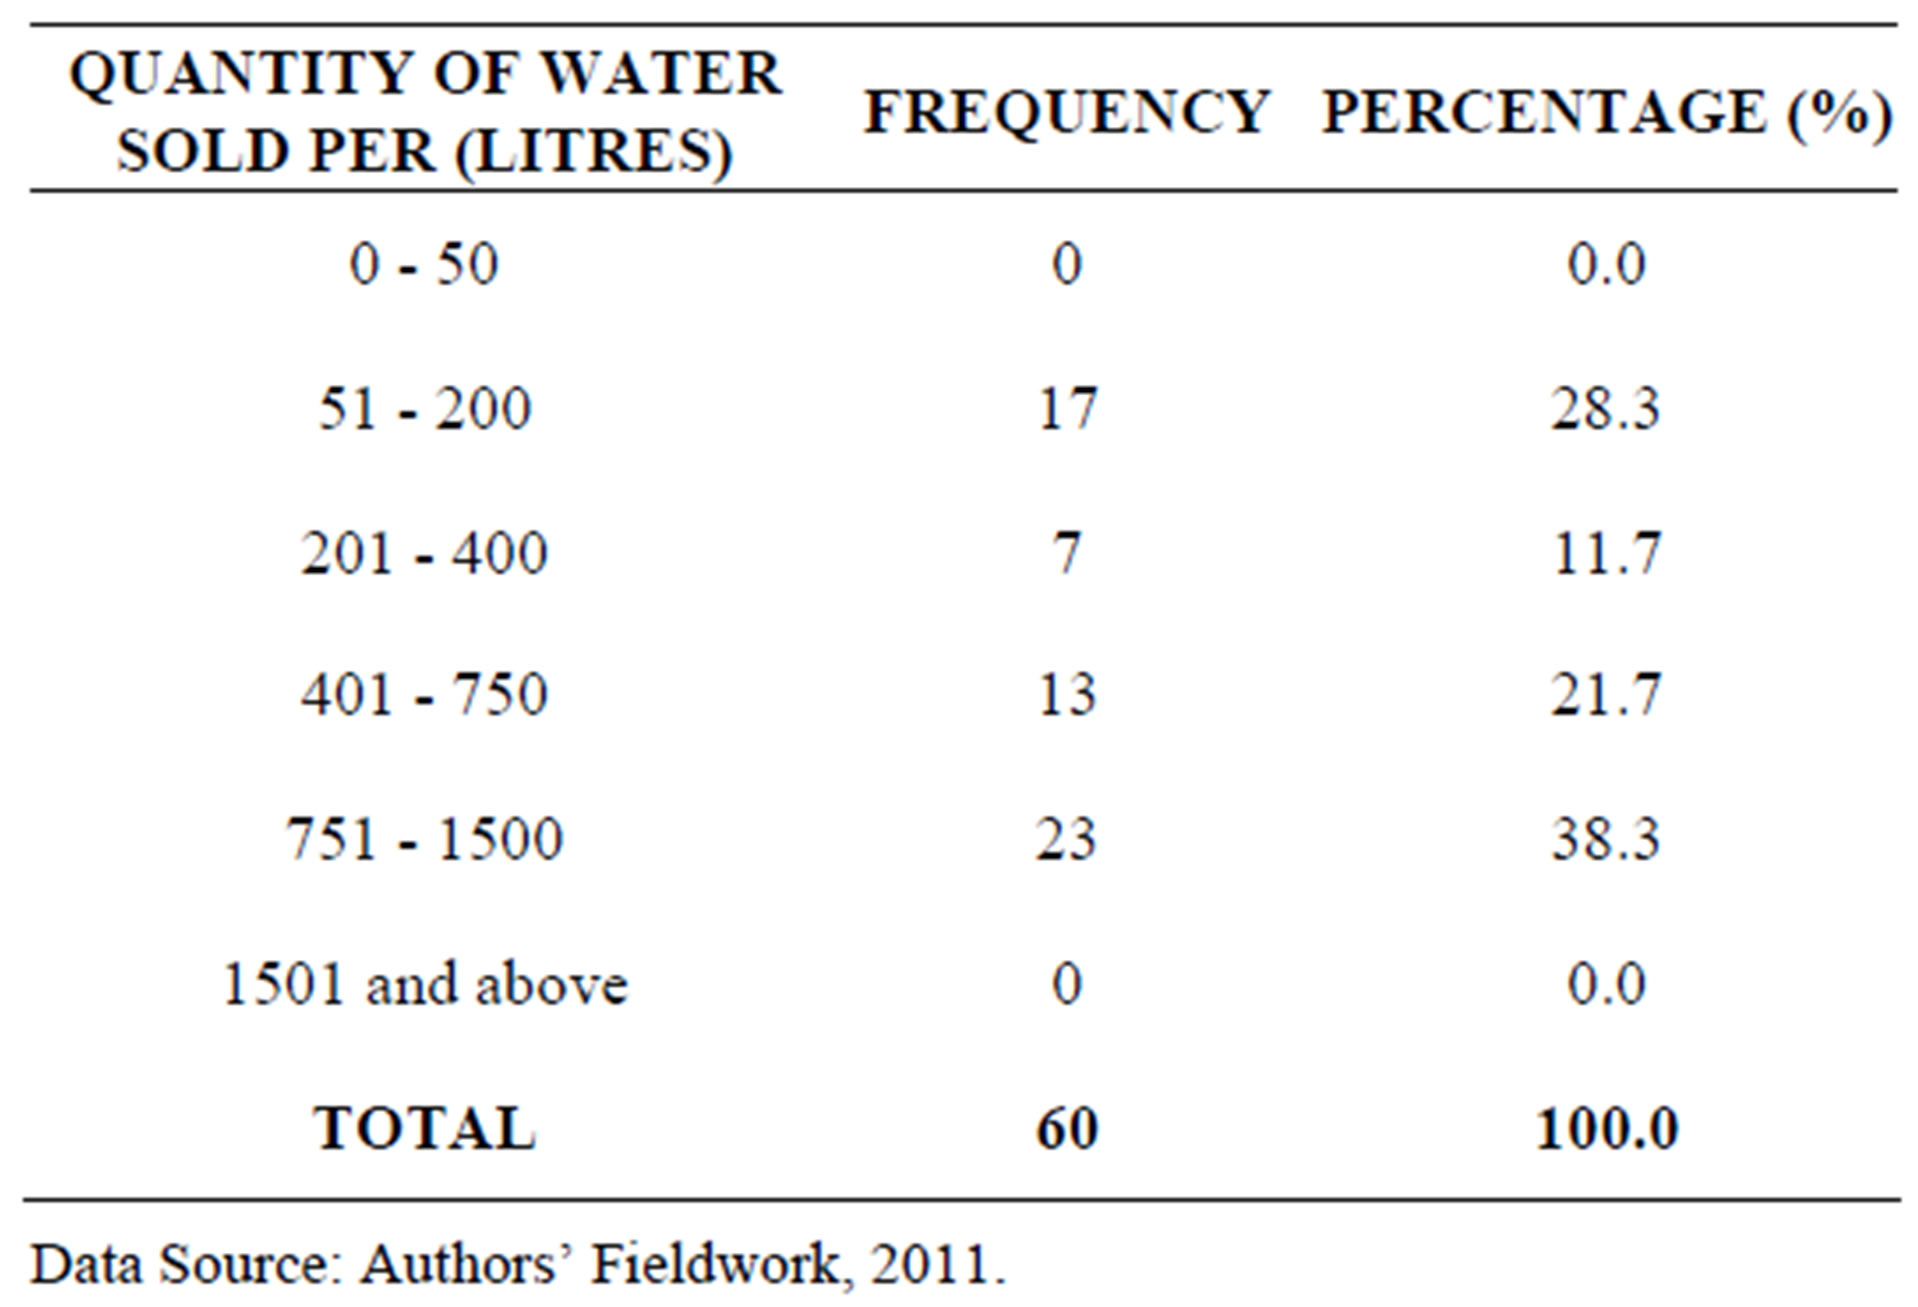
Table 2. Quantity of water sold per day by domestic water vendors to households.
as a hedge against water uncertainty [3]. However, there are those who buy little due to certain reasons such as absence of sufficient storage containers or low financial resources for water procurement. Table 2 reveals the approximate quantity of water quantity of water sold per day by vendors to water users. The percentage of vendors who sold 51 - 200 litres per day is 28.3, 201 - 400 litres is 11.7, 401 - 750 litres is 21.7, and 751 - 1500 litres is 38.3. A sizeable number of litres are sold daily as indicated by the results, which implies that a huge water sale exists in the study area that is continuous i.e. day to day, week to week, year to year.
Some vendors sell water daily, but water sale is recorded the most during weekends when most of the residents are indoors and not in their schools and workplaces.
The least rate is fortnightly. This indicates that water vending goes on more often on a daily basis than weekly or monthly. It seems that as long as the deficit in official water supplies exists, water vendors will continue with their endeavour to take up this deficit howbeit daily, weekly or otherwise. Procuring water daily also enables various households have their water demand met by their daily supplies with the least chances of incurring wastage, which is usually the case in the face of having more than what they need for a day. However, the pattern of water sales and procurement cannot be clearly understood without identifying the various occupations of the water users and their income levels, as these may have strong influence on the aforementioned.
Some respondents are civil servants engaged in government work, some are in farming and business activeties while some others are students. Field observation revealed that many of the respondents are income earners, though a reasonable number (about 1/3rd) of them are students. The income level of respondents is compiled in Table 3.
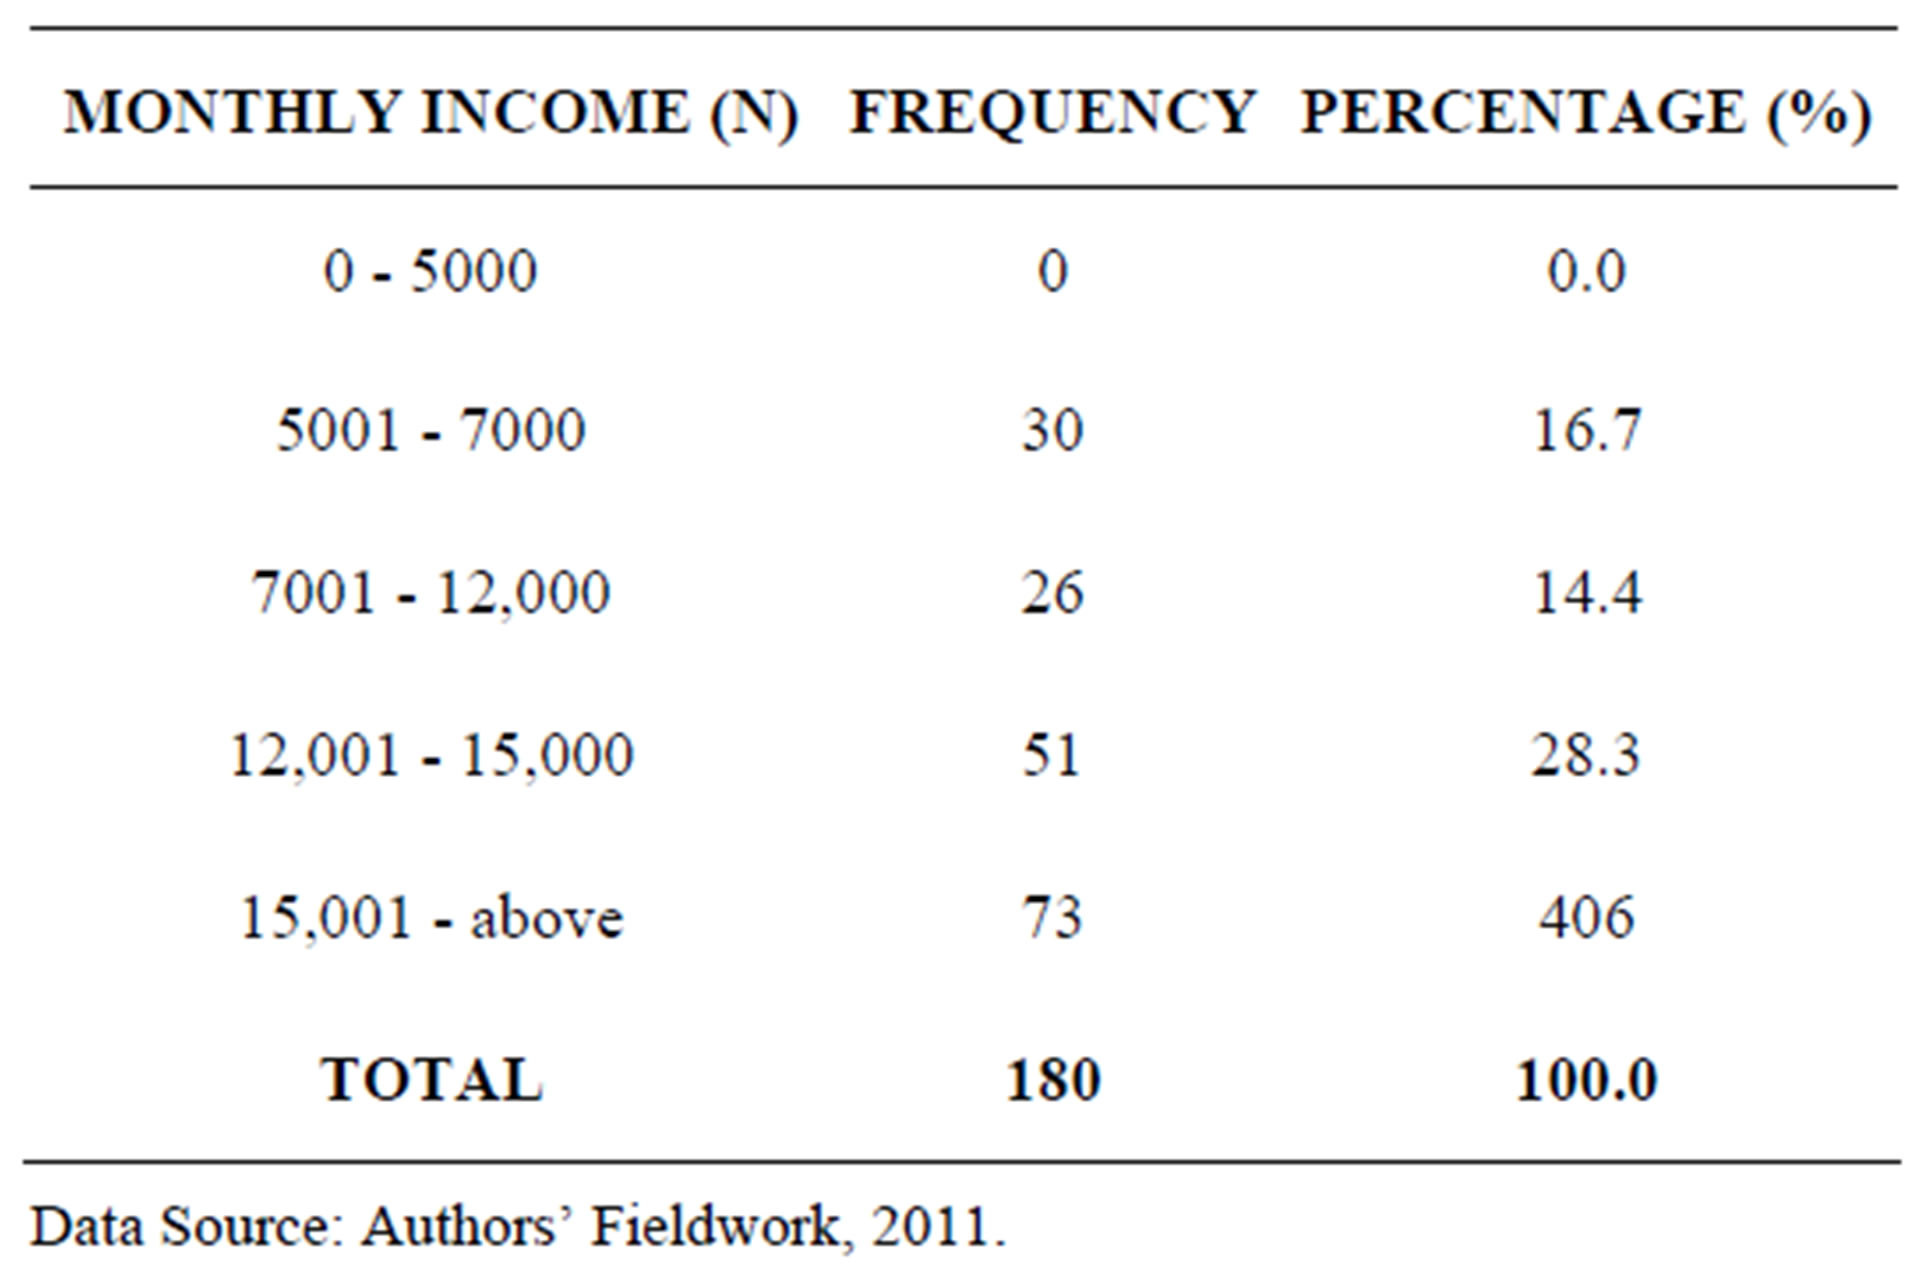
Table 3. Income levels of the Respondents (Household Heads).
Table 3 shows the various income levels of the domestic water users because to a large extent the rate of water purchase and the quantity of water purchased by any household is dependent on the purchasing power and income level of the water users. The above table shows that 16.7 percent of the respondents earned between N5000 - N7000 ($33.3 - $46.7) monthly. In the same monthly income of respondents’ table, 14.4 percent of them earned N7001 - N12,000 ($46.7 - $80), 28.3 percent earned between N12,001 - N15,000 ($80 - $100), while 40.6 percent earned N15,001 ($100) and above. One would readily form the opinion that since most earn sufficient income monthly they would probably spend more on water too. This is often times far from reality as several factors account for the portion of one’s earning that goes into water purchase, for instance family or household size may be a more important deciding factor. However, the more affordable water is the more the quantity that the household head would want to purchase all things being equal. The data on amount spent on vended water monthly by households is compiled in Table 4. On monthly basis water users incur expenses from water purchased; this depends on the quantity consumed.
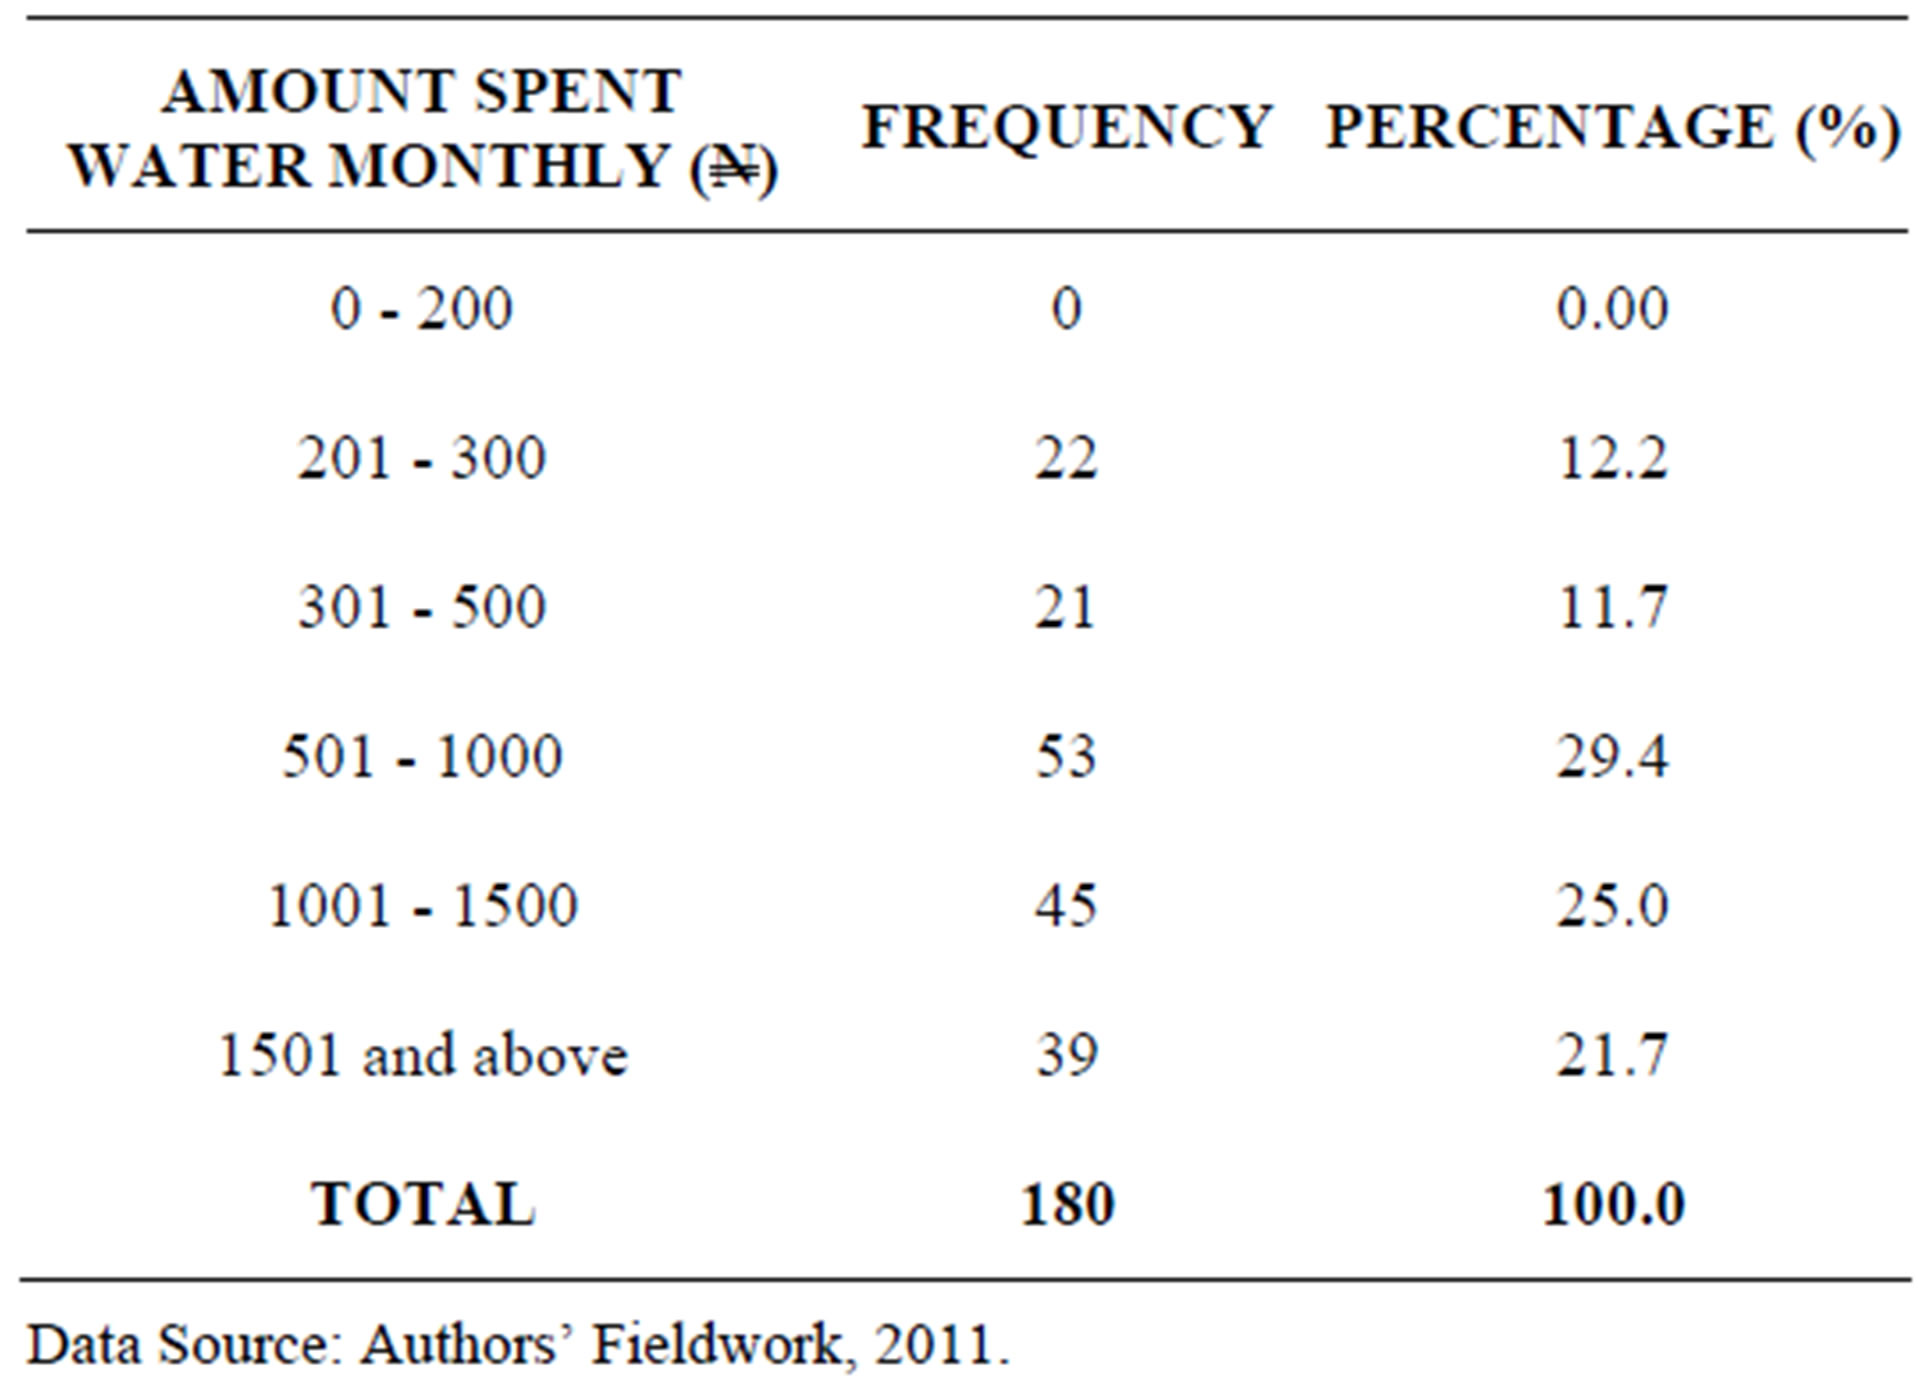
Table 4. Amount spent on vended water monthly.
In the household, the amount spent by households on water monthly is shown in Table 4. From the table it can be seen that 12.2 percent spend N201 - N300 ($1.34 - $2) on water monthly, 11.7 percent spend N301 - N500 ($2 - $3.33), while 29.4 percent spend N501 - N1000 ($3.33 - $6.67). Another 25.0 percent spend between N1001 - N1500 ($6.67 - $100) and 21.7 percent spend N1, 501 ($100) and above on water monthly. Majority of the respondents spend within the ranges of N500 ($3.33) and N1500 ($10) a month on water on average. This is relatively affordable when compared and contrasted with the average range of monthly income of the respondents, which stood at N12,001 to N15,000 ($46.7 - $100). This implies that many of the residents especially the various study households can afford to buy water conveniently, while a few may be constrained. A fact corroborated by Israel [1].
When the opinion of respondents was sought on issues of water cost it was quite revealing. Table 5 shows the perception of respondents on the cost of the water purchased by them monthly. 3.9 percent rated the cost of water purchased as cheap. Another 45.6 percent perceived it as affordable, while 50.0 percent felt it was expensive. It was only a negligible percent (0.5 percent) that perceived it as not affordable. It is certain that the cost of water provides incentives to change the way we value water, and it also affects a household decision to opt for a new source of supply. Almost halve of the respondents’ perception is that water is affordable. Generally the ‘affordability’ of water is related to economic development. That is why no matter the water cost, it is critically important to consider its affordability for poor population. It can influence water consumption as well. The data on the mean household water consumption vended per day of those who patronize vendors of water is compiled in Table 6.
According to Headley [9] the quantity of water demanded for consumption is a function of price per unit, income of users, and other social and economic variables. This corroborates our discussion, thus far which tries to
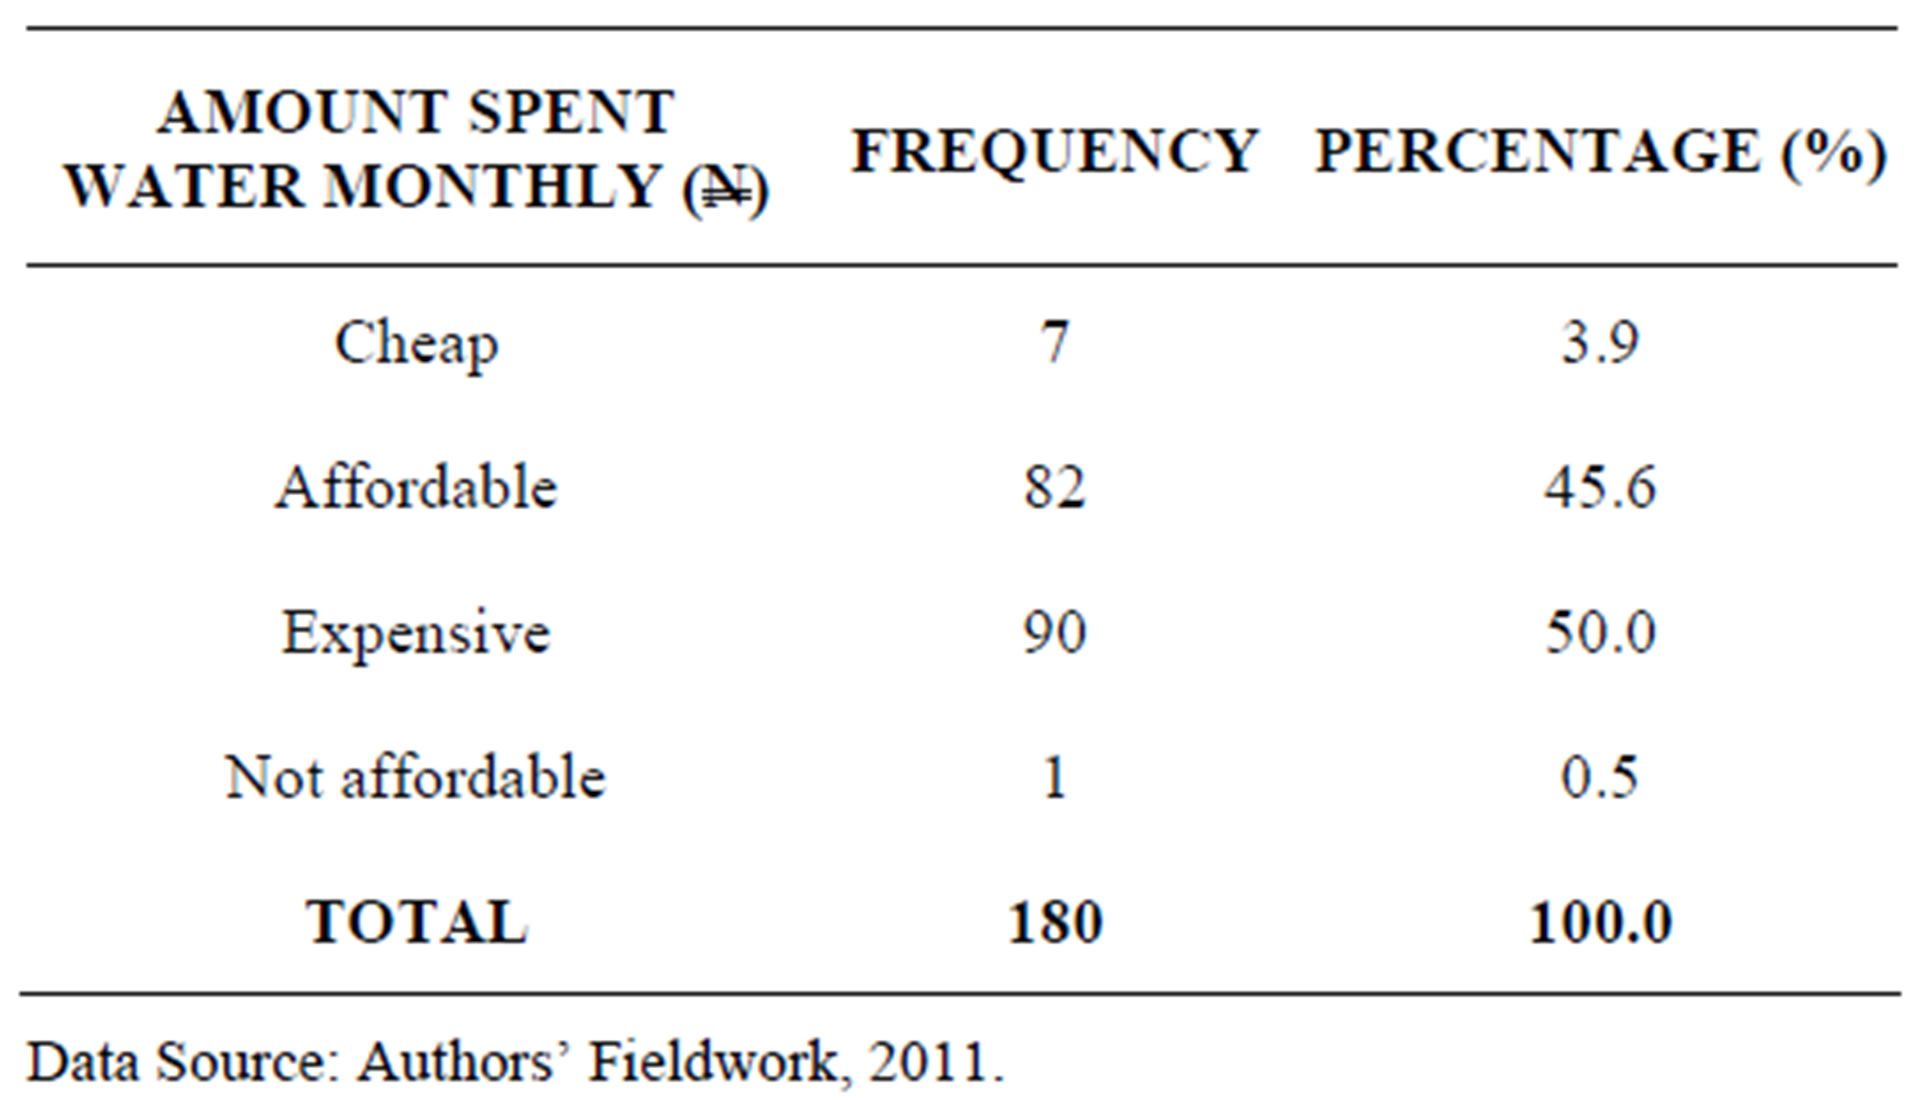
Table 5. Perception of Respondents on cost of water from vendors.
analyze the interrelationship quantity of vended water sold by vendors, amount spent on vended water, perception of respondents and the income of water users. It will also try to relate same to the data compiled in Table 6 below. While 49.4 percent of the respondents consumed 91 - 100 litres of water per capita per day, 26.7 percent consumed 51 - 70 litres per capita per day.
Another 18.3 percent consumed 71 - 90 litres of water per capita per day. While those who consume 21 - 50 litres of water per capita per day account for only 5.6 percent. All these values are shown in Table 6 which provides the details of the mean per capita water consumption per day of those who patronize water vendor. It is observed that none of the respondents consumed up to the 120 litres per capita per day recommended by the Federal Republic of Nigeria’s National water supply and sanitation policy document of 2000, for residents of urban areas. An enhancement of the provision of water services most likely will ensure that majority of the residents attain the benchmark and even surpass it.
5. Testing of Hypothesis
Whenever the public water supply company services are scarce in an area, then the second choice is the water supply from vendors which is purely commercial. The price of water from water vendors is higher. Globally cost imperatives of water supply and sanitation are high. Water obtained through vendors and resellers cost much more per litre than water piped into the homes by the public water supply company. The issue is, water does not cost the same everywhere. From literature, it has widely been understood that price of water or rather its cost varies between countries, between cities and rural areas. However, below is the null hypothesis propounded for testing in this study. It states that there is no signifycant difference in the unit cost of water sold by vendors operating in the various wards in Enugu North L.G.A.
In testing this hypothesis, the data on the unit cost of water in naira were cross tabulated with the eight study wards in order to produce chi-square (x2) cells, (see Table 7). The
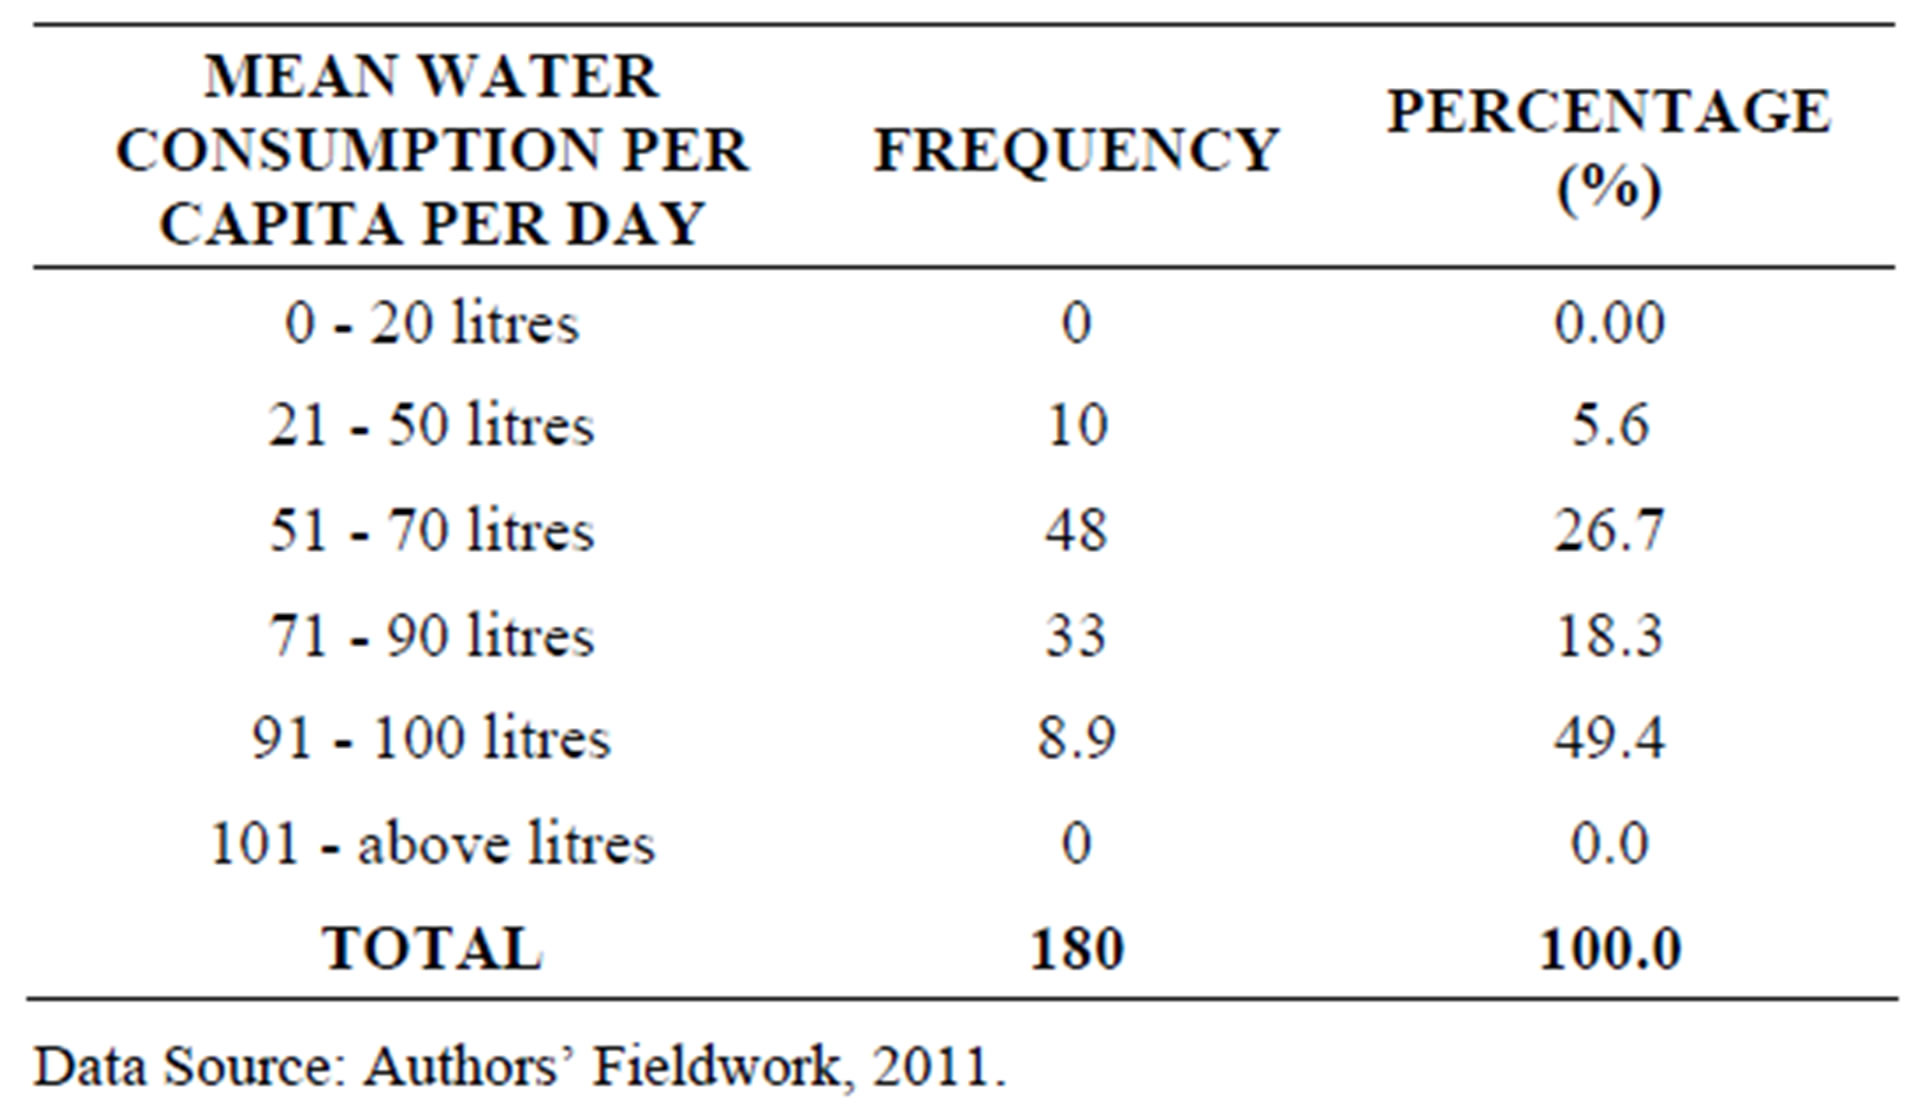
Table 6. The Mean per capita water consumption per day of those who patronize water vendors.

Table 7. Unit cost of vended water in the various wards of the study area.
assumption as earlier stated is that water does not cost the same everywhere. The calculated value for the chi-square is 54.56. To test the first hypothesis, the alternative states that there is significant difference in the unit cost of water sold by vendors operating in the various wards in Enugu North L.G.A. Testing at 95 percent confidence limit at 21 degrees of freedom the critical value is 32.67. With the critical value less than the calculated chi-square value, the null hypothesis (Ho) is rejected and the alternative (H1) is accepted. That is, there is significant difference in the unit cost of water sold by vendors in the various wards in Enugu North L.G.A.
6. Conclusion
In this paper attention has been focused on domestic water vending. The different types of domestic water vending and their characteristics have been identified and discussed. The quantity of water and amount spent on vended water in relation to the income of water users was assessed. The study has revealed amongst other things that differences exist in unit cost of water sold by vendors in the different wards in the study LGA. The water vending system remains a major means of water supply to Enugu North Local Government Area. Making household water secure and providing water efficiently in the face of water supply problems will be a key strategy in advancing standard of living and attaining the MDGs by 2015. Dependable clean water supplies and protection from health hazards will not only unlock the use of other resources but will also lead to the enhancement of development of the city, state and nation as a whole. Water development and management offers one means of correcting undeveloped areas. A socially responsible water policy looks at the situation of end-users of different socio-economic situations [10]. The study recommends that water policies that support water vending be formulated in the interim. However in the long-term, Enugu State Water Corporation would need to capture a large share of the water vendors market by providing pipeborne system even if the prices charged for water from the piped system are high enough to cover the full costs of supply. Consumers would be better off than they are, because they would receive more and safer water at a lower price. It is hoped that the recommendation made will be useful for water resource managers and city planners.
REFERENCES
- D. K. Isreal, “Impact of Increased Access and Price on Household Water in Urban Bolivia,” The Journal of Environment and Development, Vol. 16, No. 3, 2007, pp. 58-83. doi:10.1177/1070496506298190
- D. Whittington, D. T. Lauria and X. Mu, “Paying for Urban Water Services: A Study of Water Vending and Willingness to Pay for Water in Onitsha, Nigeria,” World Bank Publications, Washington DC, 1989.
- B. Baisa, L. Davis, S. W. Salant and W. Wilcox, “The Welfare Costs of Unreliable Water Service,” Unpublished MPRA Paper, 2008. http://www.mpra.ub.uni-muenchen.de/9812
- H. T. Ishaku, A. A. Peters, A. Haruna and F. M. Dama, “The Role of Private Water Vending in Nigerian PeriUrban Informal Settlements: Implications for Policy Makers,” Journal of Water Resource and Protection, Vol. 2, No. 12, 2010, pp. 1082-1087. doi:10.4236/jwarp.2010.212127
- E. C. Uzoma, “Water Supply: A Case Study of Enugu Metropolis,” B.Sc. Thesis, Anambra State University of Technology, Enugu, 1990.
- S. Cairncross and J. Kinnear, “Water Vending in Urban Sudan,” International Journal of Water Resources Development, Vol. 7, No. 4, 1991, pp. 267-273. doi:10.1080/07900629108722522
- R. Abdullah, “The Role of Private Vending in Developing Country Water Services Delivery: The Case of Karachi, Pakistan,” Working Paper Series, World Bank, Washington DC, 1999.
- G. S. Debomy, “Study of Individual Water Vendors and Water Vendors Association at Teshi—Nungua and Nima, Ghana,” Project 5, Water Utilities Partnership, 2000.
- J. C. Headley, “The Relation of Family Income and Use of Water for Residential and Commercial Purpose in the San Francisco—Oakland Metropolitan Area,” Land Economics, Vol. 39, No. 4, 1963, pp. 441-449. doi:10.2307/3144849
- M. Kjellen, “Water Vending in Dares Salaam, Tanzania,” In: B. Calas and C. A. Mumma Martinon, Eds., Shared Waters, Shared Opportunities: Hydropolitics in East Africa, Nairobi and Mkukina Nyota Publishers Ltd., Tanzania, 2010, pp. 173-184.