Journal of Water Resource and Protection
Vol. 3 No. 6 (2011) , Article ID: 5647 , 11 pages DOI:10.4236/jwarp.2011.36049
Comparison of Nine Membrane Pairs for Electrodialytic Removal of Nitrate Ions
Centre for Research and Technology Development in Electrochemistry, Pedro Escobedo, Querétaro, México
E-mail: fcastaneda@cideteq.mx
Received March 30, 2011; revised May 1, 2011; accepted June 3, 2011
Keywords: Electrodialysis, Ion exchange membranes, Nitrate removal, Nitric acid, Sodium hydroxide
ABSTRACT
Electrodialysis (ED) of NaNO3 solutions was performed to stress the role of the membrane pair as a unit i.e. the behavior as a whole of Anion Exchange Membrane (AEM) and Cation Exchange Membrane (CEM), in the process at room temperature. The membrane pair was also tested in the reclamation of nitric acid and sodium hydroxide. It was found that the membrane pair ranking in Limiting Current Density does not agree with that of ions leakage and both rankings are not the same as for Current Efficiency or Specific Power Consumption, each parameter for a specific membrane pair depends on the associated membrane and at a lesser degree on the flow rate. Results show that one cannot select a membrane or a membrane pair only by its limiting current density i.e. it is necessary to evaluate several parameters of the process by characterizing the whole membrane pair and to decide the parameter of interest, i.e. denitrification speed, ions leakage, proton back migration, current efficiency or specific power consumption.
1. Introduction
The removal of nitrate from water sources that results from the use of fertilizers, industrial wastewater and human or animal waste disposal has been of great concern [1-3]. For instance, acidic wastewater produced from the etching and rinsing processes in electronic, mechanical, and metal-plating industries, contains a substantially large amount of nitrate due to the use of nitric acid. Attempts to remove nitrate from water or wastewater by using physicochemical or biological methods have been made, in this sense, treatment methods such as adsorption [4], ion exchange [5-7], electrodialysis (ED) [5, 8-11], reverse osmosis (RO) [5,12], nanofiltration (NF) [11], biological denitrification and combination of two [13] or more of these methods have been reported in many studies.
Membrane separation could be an alternative to the biological wastewater treatment for stainless steel manufacturers then reverse osmosis, nanofiltration and electrodialysis can be applied for nitrate separation at the high concentrations found in this kind of operations [14-17]. The electrodialysis is more convenient when it comes to the acid regeneration in pickling operations. For economic and environmental reasons, splitting of dissolved nitrate salts into, for example, sodium hydroxide and nitric acid is advantageous since these products may be recycled upstream in the process or reused elsewhere after further concentration by any other method as evaporation [18-24].
The principle of this operation lies on the membrane characteristics that allow the passage of cations trough CEM and anions trough AEM under the action of an electric field to produce acid and base. In this regard, the selection of the membrane cannot be based only on one characteristic and one has to define on what parameters the selection will be made, i.e. selection will be made in order to have the highest limiting current or the best nitrate rate removal, or the highest product purity or the best current efficiency or the lowest specific power consumption; the optimum point of one of these parameters does not assure the best performance of the other ones.
In this work we have tested 9 membrane pairs for sodium nitrate splitting. Each membrane pair was evaluated by limiting current density, nitrate removal rate, nitrate, sodium and proton leakage, current efficiency and specific power consumption to stress the importance of membrane pair behavior.
2. Materials and Methods
2.1. Electrodialysis
The DS-0 system from Asahi Glass was used for the ED experiments. The system (not shown) consisted of three separated circuits for the acid, salt feed and caustic solutions, each with a volume of 3 L. A salt splitting arrangement was used. Solutions were recirculated by individual Iwaki magnetic-centrifugal pumps model MD- 30-RN having a maximum capacity of 1800 L·h−1. 25 and 50 L·h−1 flow rates and a 1.5 mm gap were used. The stack was connected to a Sorensen power supply model DCS 60 - 50 providing direct current through a platinum plated titanium anode and a stainless steel cathode whose operating area, as well as that of membranes, was of 172 cm2. ED experiments were carried out at 70% of the previously determined limiting current.
2.2. Chemicals
All experiments were carried out with HNO3 0.01 mol·L−1 solutions for anodic compartment and NaOH 0.01 mol·L−1 for cathodic compartment while NaNO3 0.5 mol·L−1 was used for salt feed compartment. Technical grade NaNO3 was purchased from Insumos Químicos Azteca; HNO3 and NaOH were of reagent grade obtained from J.T. Beaker and were used without further purification. The solutions were prepared with deionized water. The pH of the 0.5 mol·L−1 NaNO3 solution was in the range of 8 to 9, which was attributed to impurities in the industrial-grade reagent. Titration of this solution showed that these impurities accounted for an alkalinity no greater than 3·10−4 mol·L−1·OH−. All ED experiments were conducted under the above conditions unless specified.
2.3. Ion Exchange Membranes
Commercial ion-exchange membranes CMV, AMV were purchased from Asahi Glass, CMS and ACM were obtained from Tokuyama, and membranes 3470 and 3475 were provided by Sybron. All the membranes were immersed in NaNO3 0.5 mol·L−1 for 24 h. before ED experiment, table 1 give some general membrane properties.
2.4. Limiting Current Density
Limiting current density experiments were carried out on the electrodialytic stack under operational conditions. Limiting current density was obtained from R vs 1/I plots as described by Sorensen [25]. Values are the mean of at least 3 experiments.
2.5. Analytical Methods
Solutions from electrodialysis experiments were periodically sampled and analyzed for: Na+ by Inductive Coupled Plasma spectroscopy (ICP-OES) in a Perkin Elmer model3300DV,  in a HACH spectrometer, model DR/2010, and H+ and OH- by acid-base titration.
3. Results
3.1. Limiting Current Density
Limiting current density was evaluated from R vs. 1/I
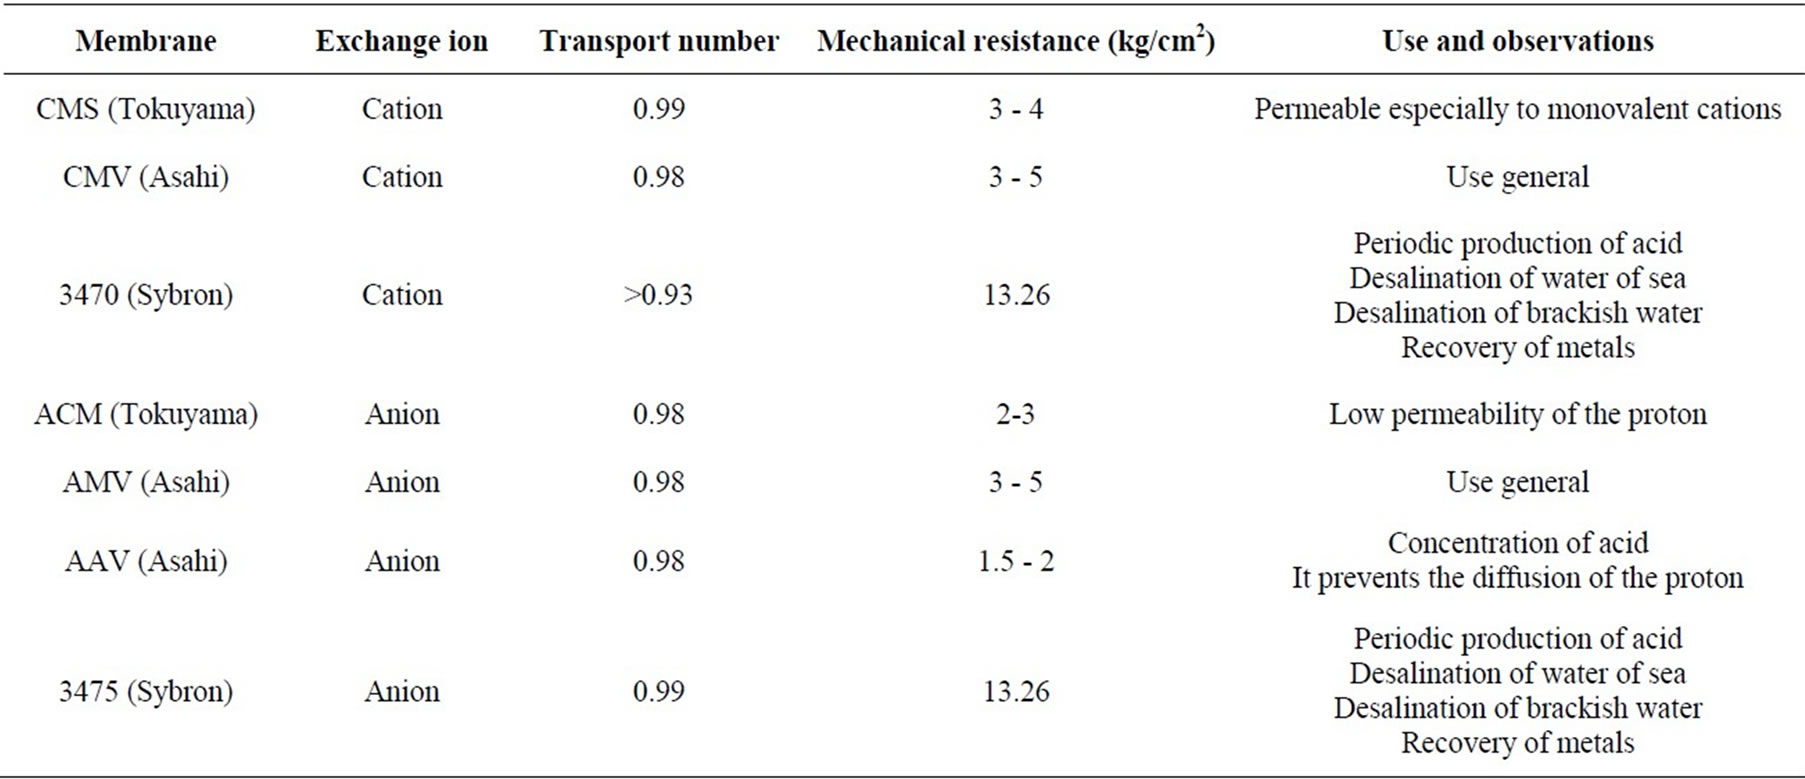
Table 1. General properties of membranes.
plots (not shown) as described elsewhere [25]. In all of the cases it is observed an inflexion point where graphically one can obtain the LCD value. Physically, the inflexion point means that there is a steady state so the number of nitrate ions that enter the membrane are equal to the number of nitrate ions that enter to the diffusion zone.
Limiting current density value largely depends on ions concentration and in order to achieve a faster demineralization LCD must have the highest possible value: From the economic point of view the process must be done with the lowest total voltage to minimize specific power consumption. In table 2 it is shown the membrane pair ranked by LCD and table 3 shows the membrane pair ranked by voltage applied at LC at different flow values.
Tables 2 and 3 point out important differences. While membrane ranking by LCD is the same at both flow conditions, ranking by applied voltage at LCD is not the same as LCD ranking, and indeed, it is not the same for the two flow rates, i.e. one membrane pair can show the highest limiting current but, not the best applied voltage. The results indicate that different membrane combination having similar selectivity may differ performing nitrate electrodialysis due to several reasons, for example: intrinsic resistance, counter ion permeability, differences between anions and cations mobility, or interactions between the ionic groups in the membrane and counter ions [26,27]. In previous work, we have shown by Electrochemical impedance spectroscopy that phenomena occurring inside of membranes could affect the ion transport mechanism and transport fastness. We have demonstrated that in the case of a particular membrane, strong interactions of nitrate with the ionic groups in the membrane affect its transport [28,29].
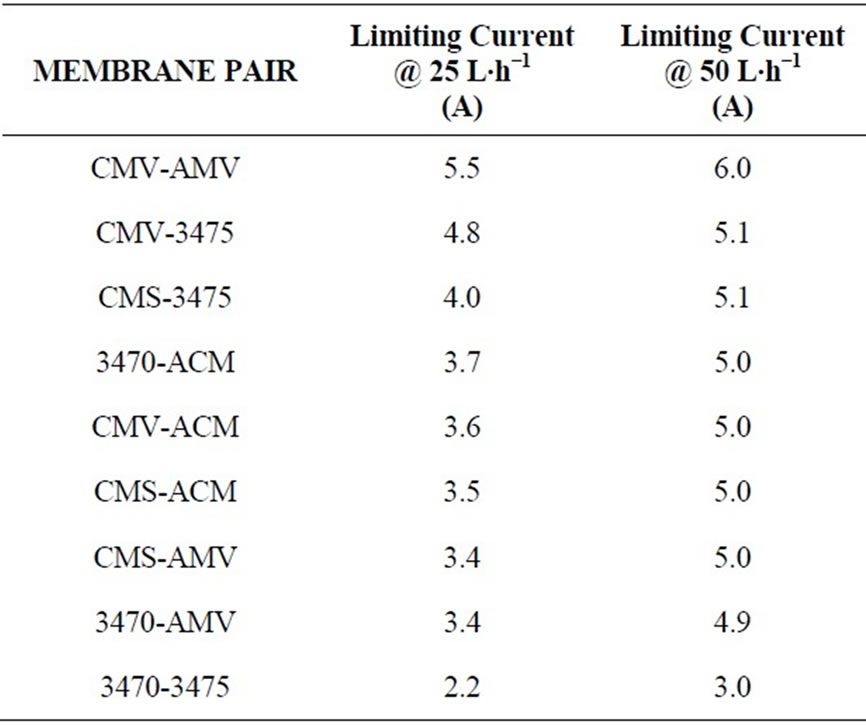
Table 2. Membrane pair ranking by limiting current.
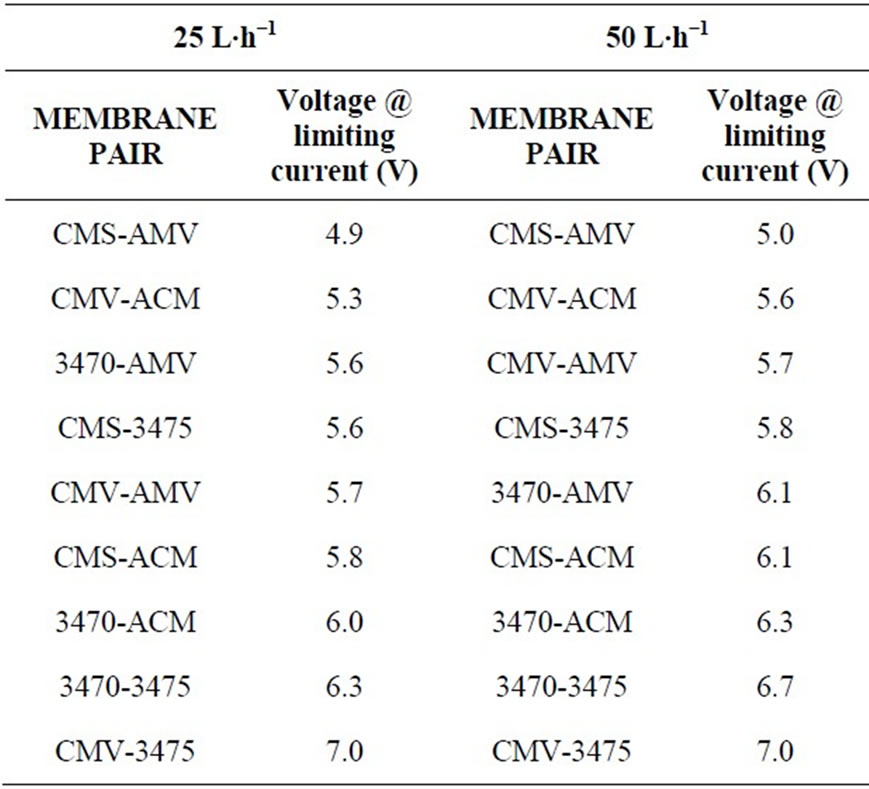
Table 3. Membrane pair ranking by voltage at limiting current.
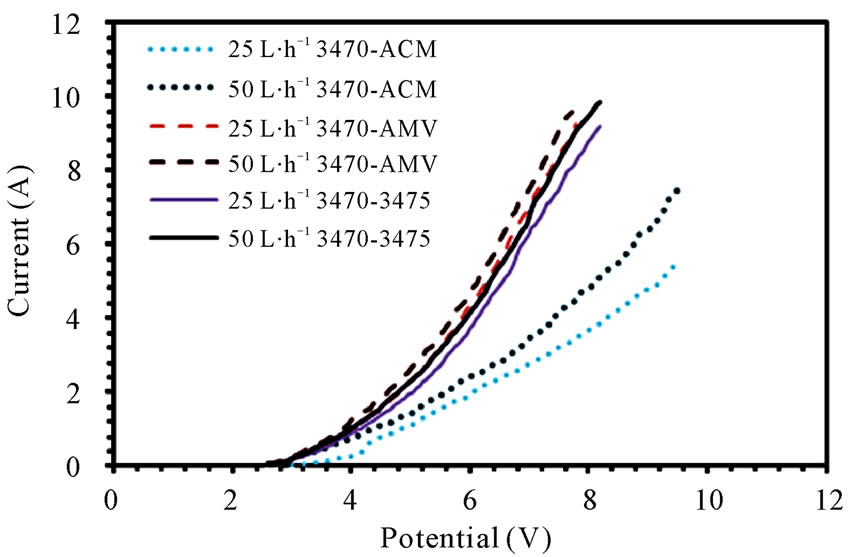
The current-potential characteristics of each membrane pair can be seen in figure 1(a), (b) and (c), it is easy to see that the membranes performance changes from one membrane pair to another, indeed, the change is dynamic, i.e. one membrane pair performs better than another, while few milivolts before or after it could be the inverse situation.
3.2. Nitrate Removal
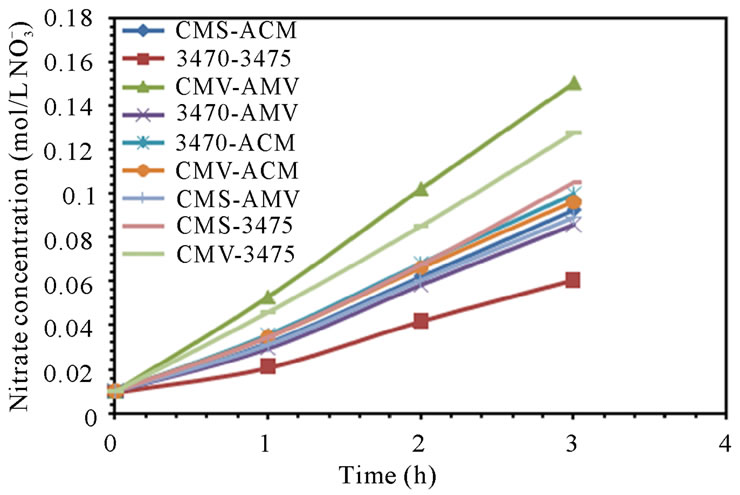
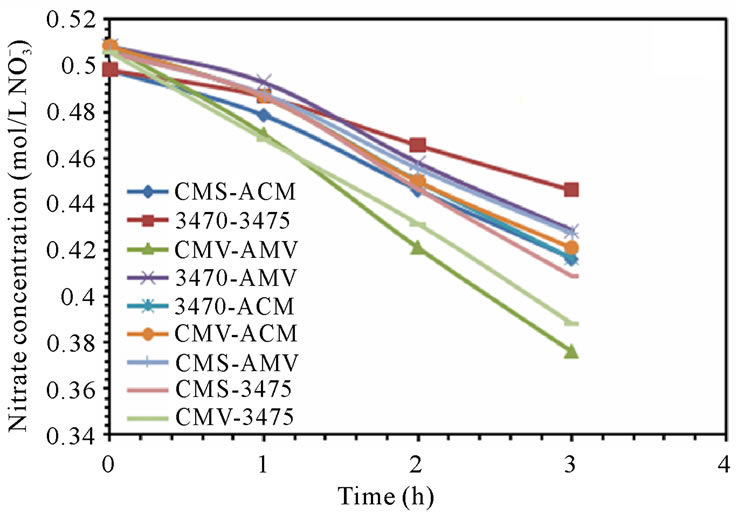
The electrodialytic study was done for every membrane pair to compare their performance in terms of nitrate removal, base and acid production. Figures 2(a) and (b) show the increase of nitrate, as well as the increase of the proton concentration in the anodic compartment. Figures 3(a) and (b) show that the sodium and hydroxyl ions concentration also increases in the cathodic compartment, as expected. Moreover, the nitrate and sodium ions increase in anodic and cathodic compartments corresponds to the decrease of these same ions in the feed compartment, as can be seen in figures 4(a) and (b).
The linear increase in nitrate, proton, sodium and hydroxyl ions in their respective compartment is observed for all the membrane pairs tested, indicating a good performance for nitrate removal, as well as for acid and base production. As for all the membrane pair tested the nitrate increase in anodic compartment is practically equal to that of sodium in cathodic compartment, the differences are then attributed to the analysis accuracy and to the ions leakage from one to another compartment in spite of electrical field and stack polarity.
Concentration increase or decrease as well as the slope have the same magnitude but are different for all the
 (a)
(a)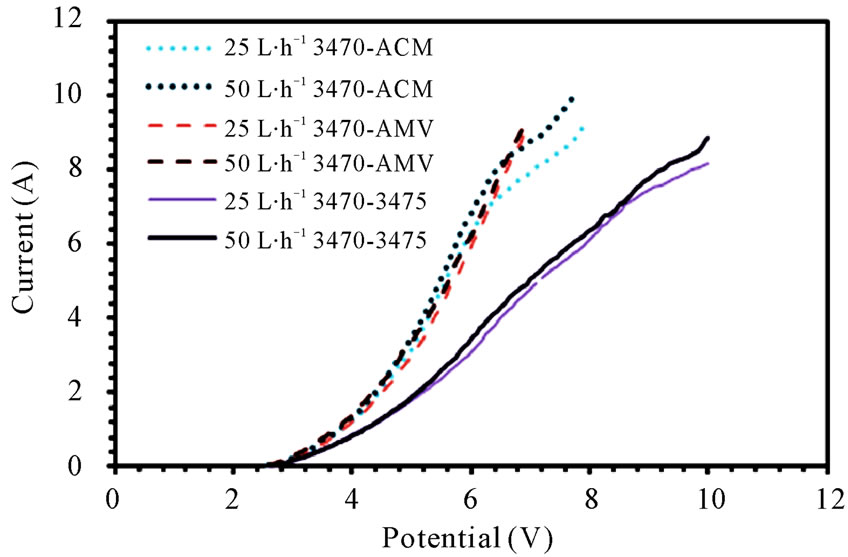 (b)
(b)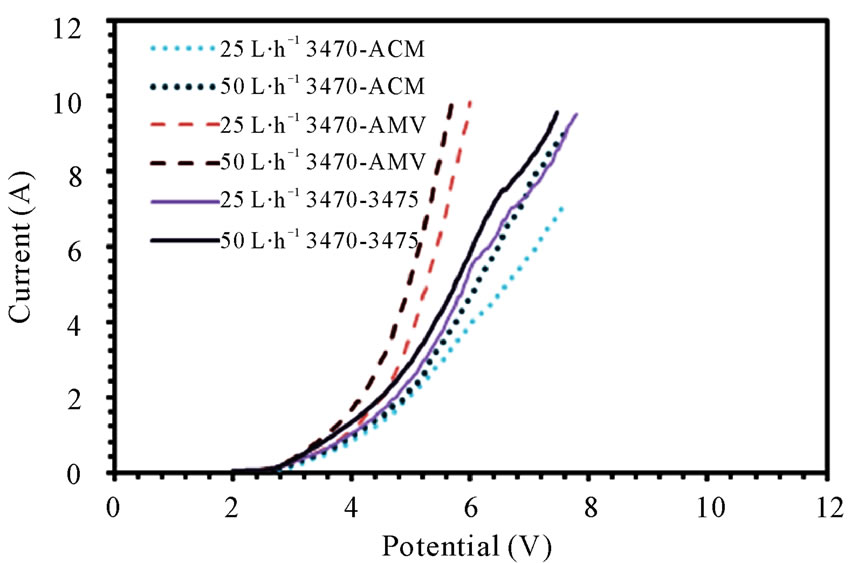 (c)
(c)
Figure 1. Polarization curves for (a) 3470 series; (b) CMV series; (c) CMS series.
membrane pair tested and are just a little higher at 50 L·h−1 than at 25 L·h−1. CMV-AMV arte the best performing membrane pair, while the worst performing is the 3470 - 4375 membrane pair, all others membrane pairs fall in between and their performance are almost the same. Table 4 shows the membrane pair transport rate which goes from about 1.9 to about 2.7 mol·h−1·m−2. H+ and OH− production rates are shown for comparison purposes.
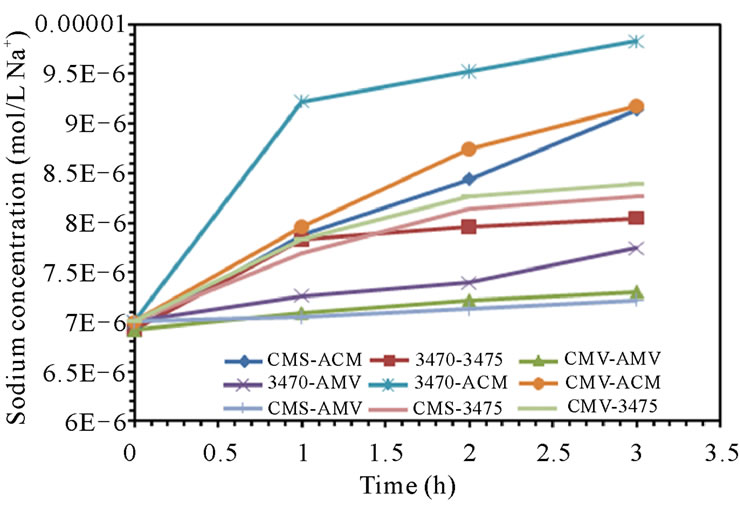
3.3. Nitrate and Sodium Ions Leakage
Leakage of ions in opposite direction to the electric field is well known and has been the object of many studies, it has been estimated up to 4% of salt in acid and base products and is found to account for a loss of about 0.1% in CE [30,31]. In our case, ion leakage has been studied by monitoring the sodium concentration in anodic compartment and nitrate ion in cathodic compartment. Figure 5 shows sodium leakage to the anodic compartment and nitrate leakage to the cathodic compartment. It is to note that leakage depends on the associated membranes and remains at a level of 10−6 M for sodium but at a level of 10−3 M for nitrate. It is to note also that the flow conditions seem to have a higher influence on nitrate leakage than in that of sodium. CMV-AMV and CMS-AMV are the best membrane pairs regarding sodium leakage to the anodic compartment at 25 and 50 L·h−1; as leakage stay at very low values. In the other hand, CMS-AMV and CMV-ACM are the best regarding nitrate leakage to the cathodic compartment at both flow values. Surprisingly, nitrate leakage is at least two orders of magnitude higher than sodium leakage; this behavior will be discussed in the next paragraph.
3.4. Feeding Compartment Acidification
Proton back-migration has been observed in all the cases under all operation conditions i.e. there is a leakage of protons from anodic compartment to the feed compartment, as a consequence, feed compartment pH changes from ca. 9 to ca.2.5.
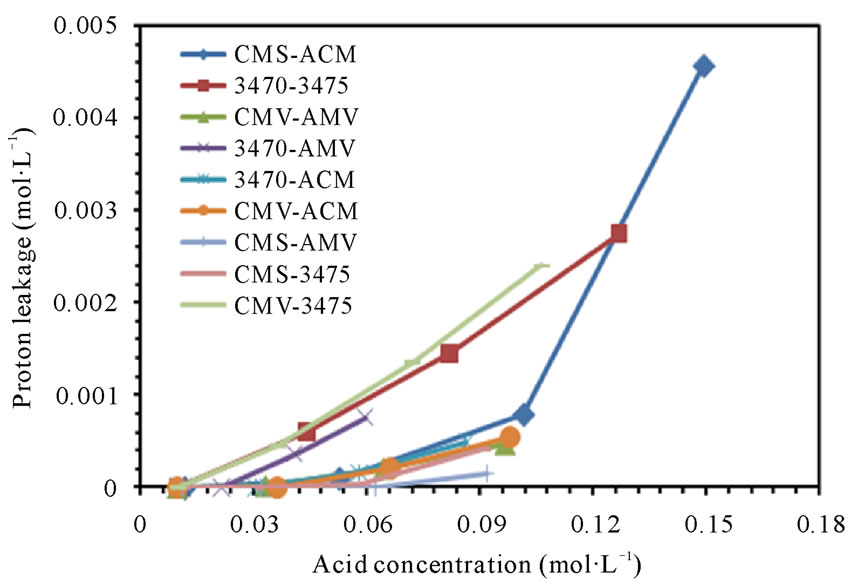
From figures 6(a) and (b) we can observe that proton leakage is proportional to the acid concentration, also that the proportionality depends on the associated membrane and flow conditions. In these figures we can also see that the proton leakage is about 10−3 M (see figure 7). These results are in agreement with others authors [31-34]. In figure 8 we plot the proton leakage Vs membrane pair, and we can see that this plot has almost the same shape of that of nitrate transport rate or proton production, but obviously, one hundred times smaller. This behavior shows that proton leakage depends on membrane pair and not only in single membrane characteristics (data for 50 L·h−1 not shown).
Proton, sodium, nitrate and hence hydroxyl ions leakage must tie to the global electroneutrality. If proton leakage, i.e. feed compartment acidification is about 10−3 M, sodium leakage to the anodic compartment is about 10−6 M and nitrate leakage to the cathodic compartment is about 10−3 M (figures 5 and 7), thus, it is clear, in this
 (a1)
(a1) (a2)
(a2)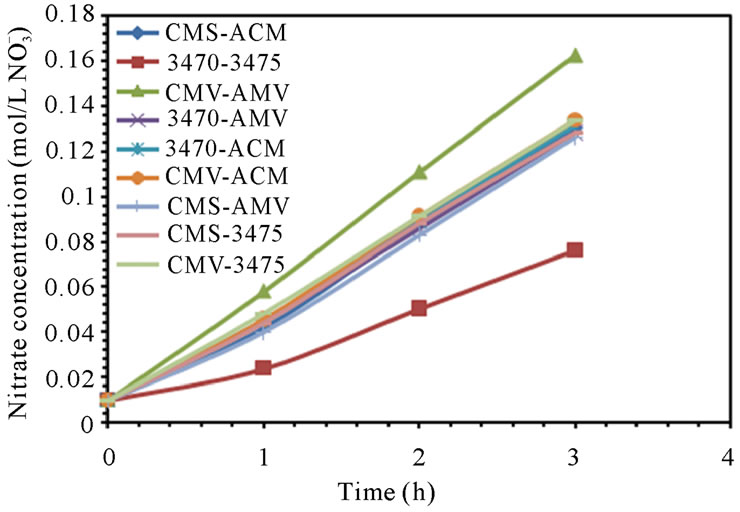 (b1)
(b1)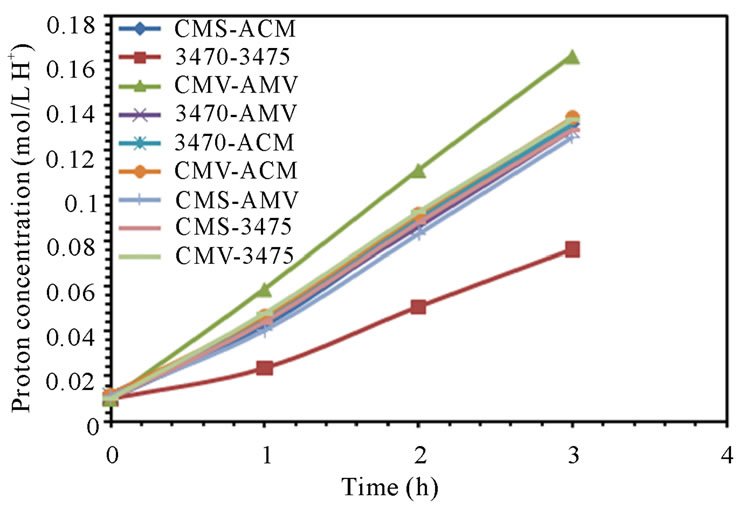 (b2)
(b2)
Figure 2. Nitrate and proton ions concentration in anodic compartment. (a) 25 L·h−1; (b) 50 L·h−1.
 (a1)
(a1)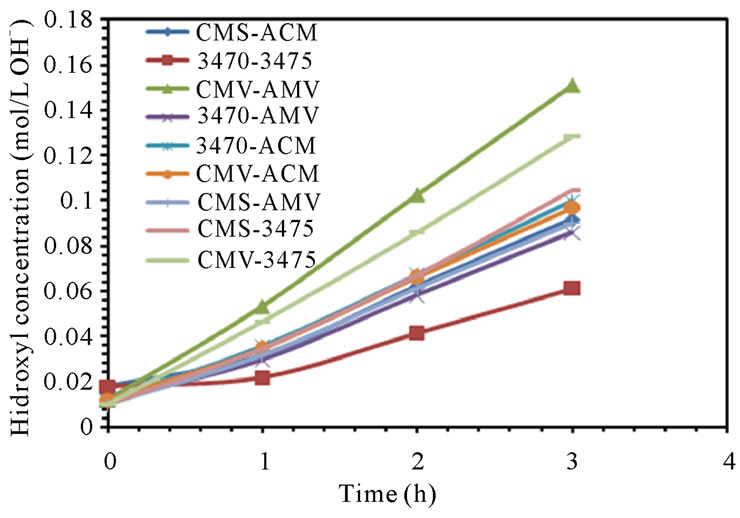 (a2)
(a2)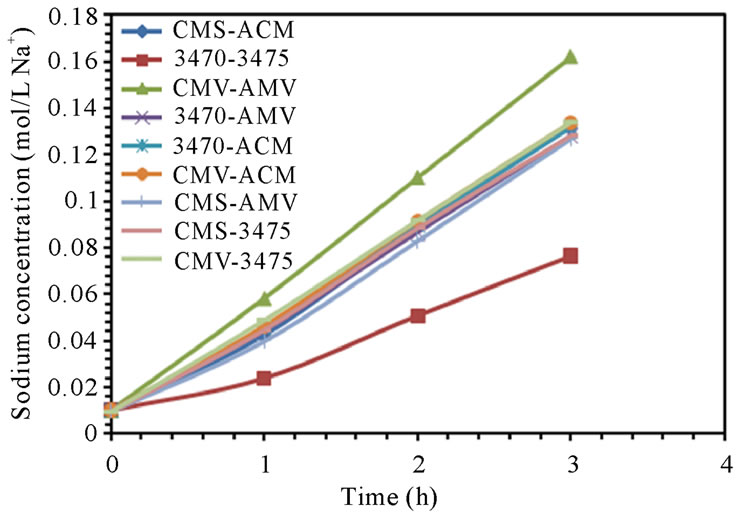 (b1)
(b1)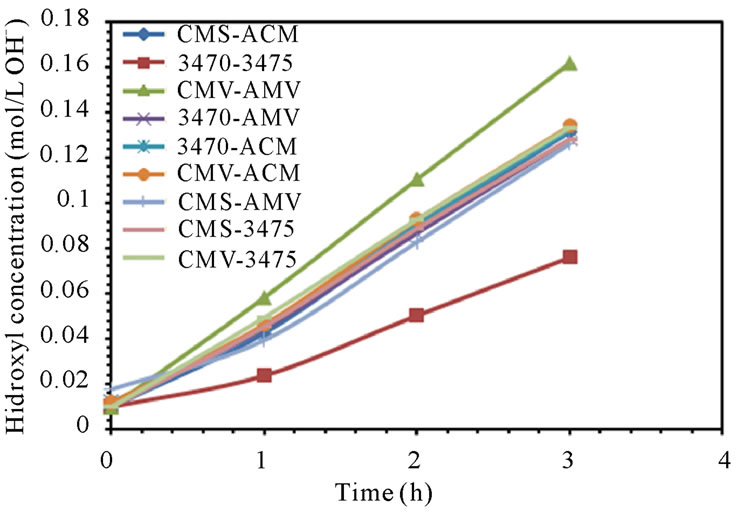 (b2)
(b2)
Figure 3. Sodium and Hydroxyl ions concentration in cathodic compartment. (a) 25 L·h−1; (b) 50 L·h−1.
 (a1)
(a1)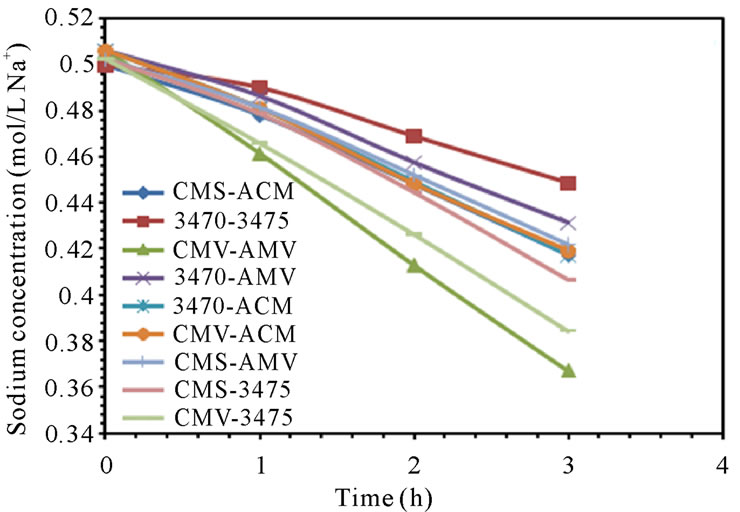 (a2)
(a2)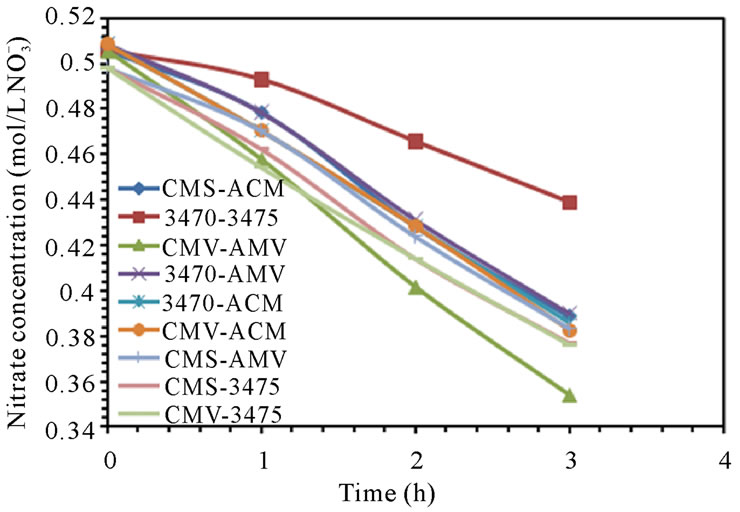 (b1)
(b1)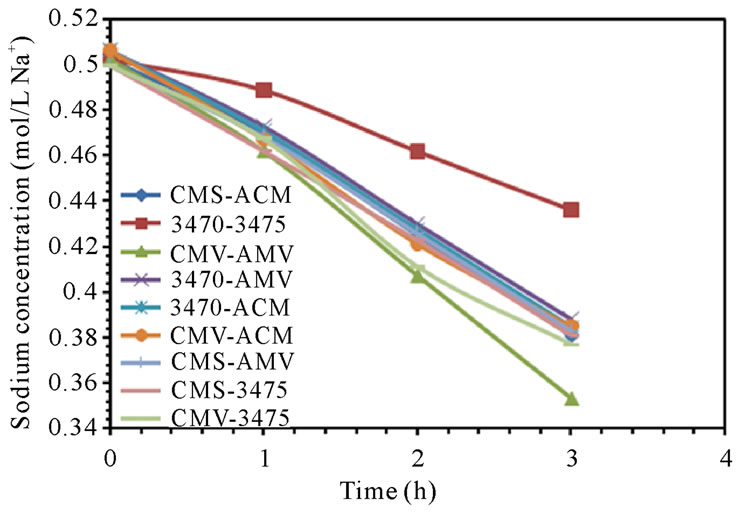 (b2)
(b2)
Figure 4. Nitrate and Sodium ions concentration in feed compartment. (a) 25 L·h−1; (b) 50 L·h−1.
 (a1)
(a1)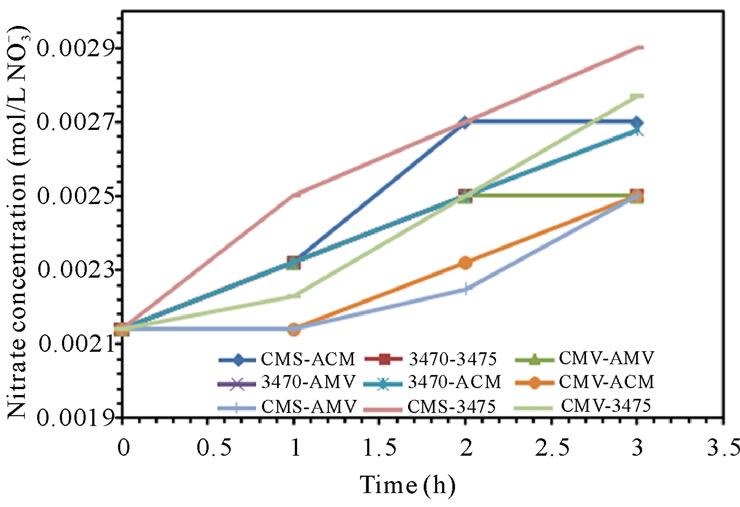 (a2)
(a2)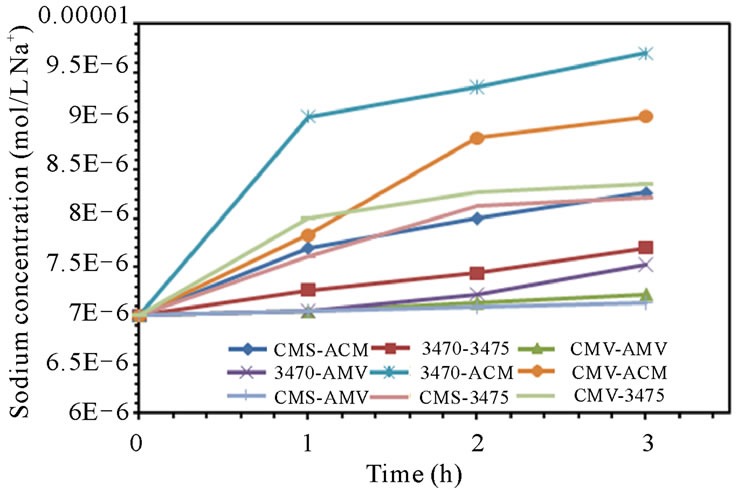 (b1)
(b1)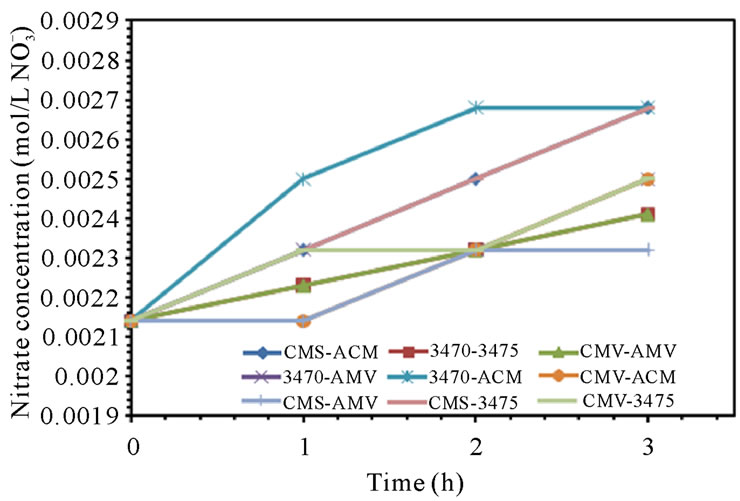 (b2)
(b2)
Figure 5. Sodium and Nitrate ions leakage. (a) 25 L·h−1; (b) 50 L·h−1.
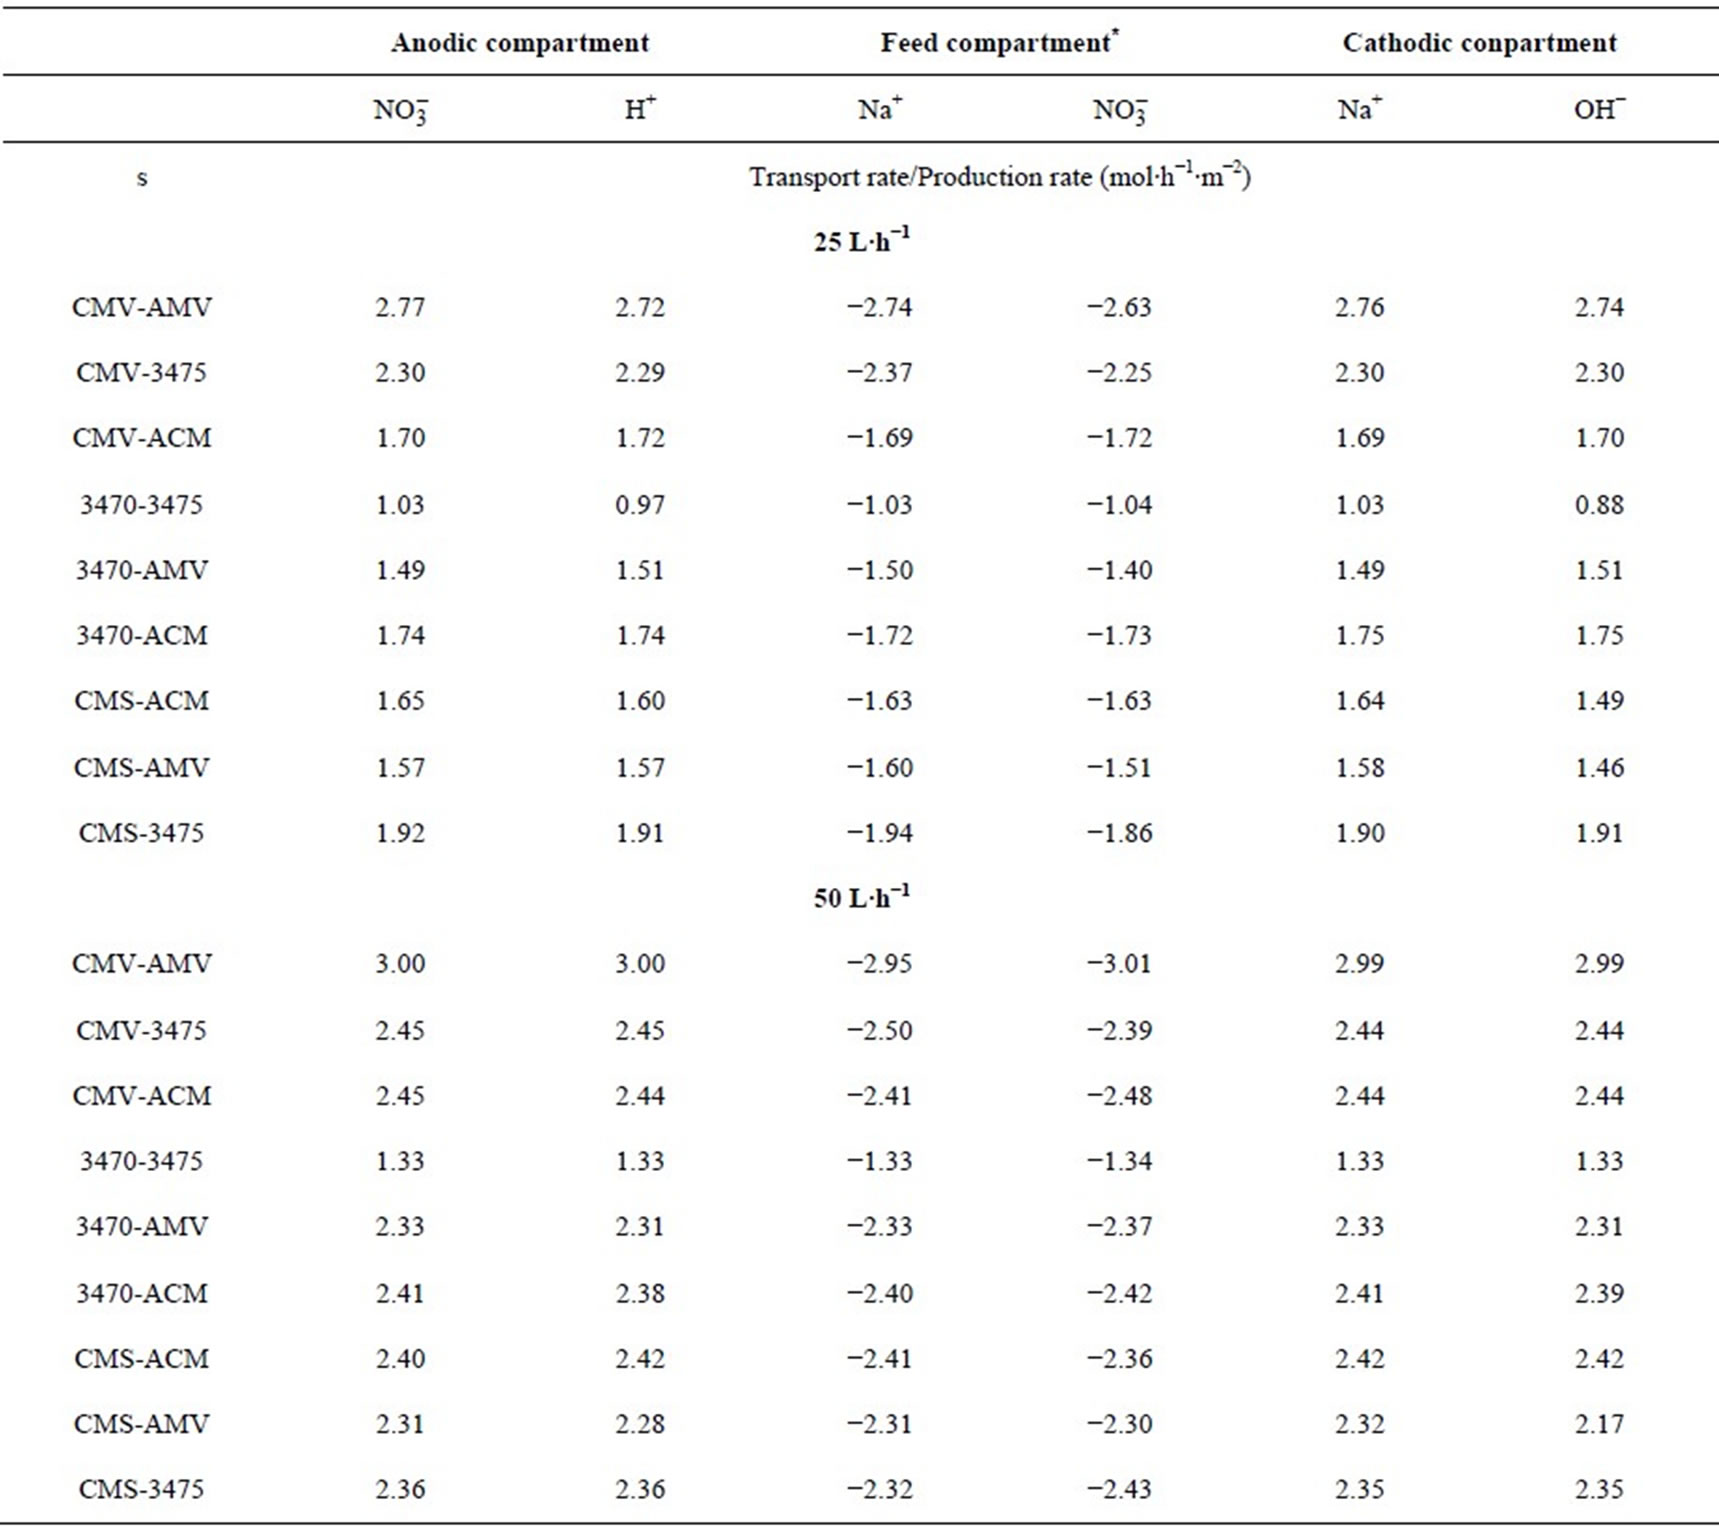
Table 4. Membrane pair transport rate at 25 and 50 L·h−1. Negative values indicates decreasing concentration rate.
 (a)
(a)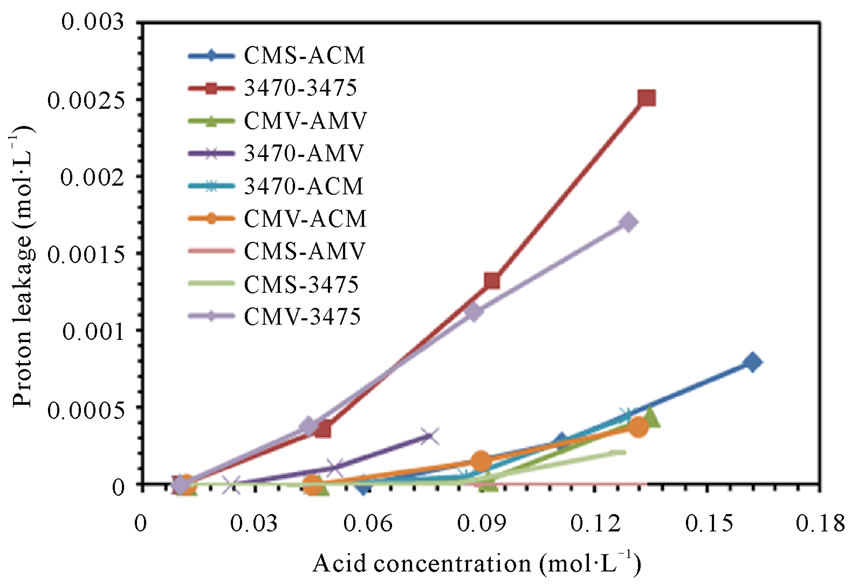 (b)
(b)
Figure 6. Proton leakage vs Nitric acid concentration. (a) 25 L·h−1; (b) 50 L·h−1.
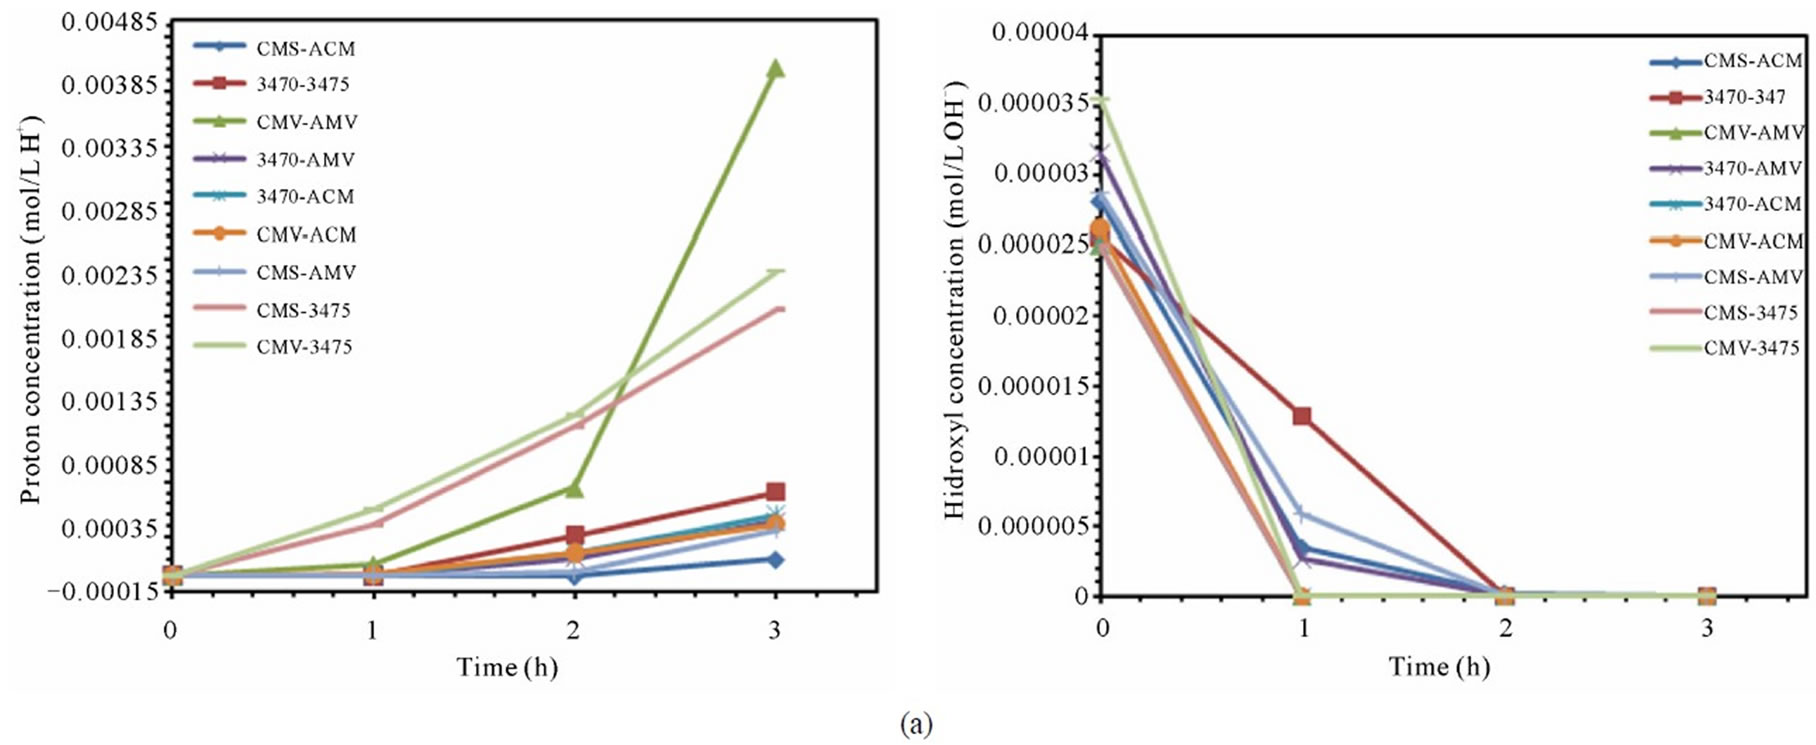
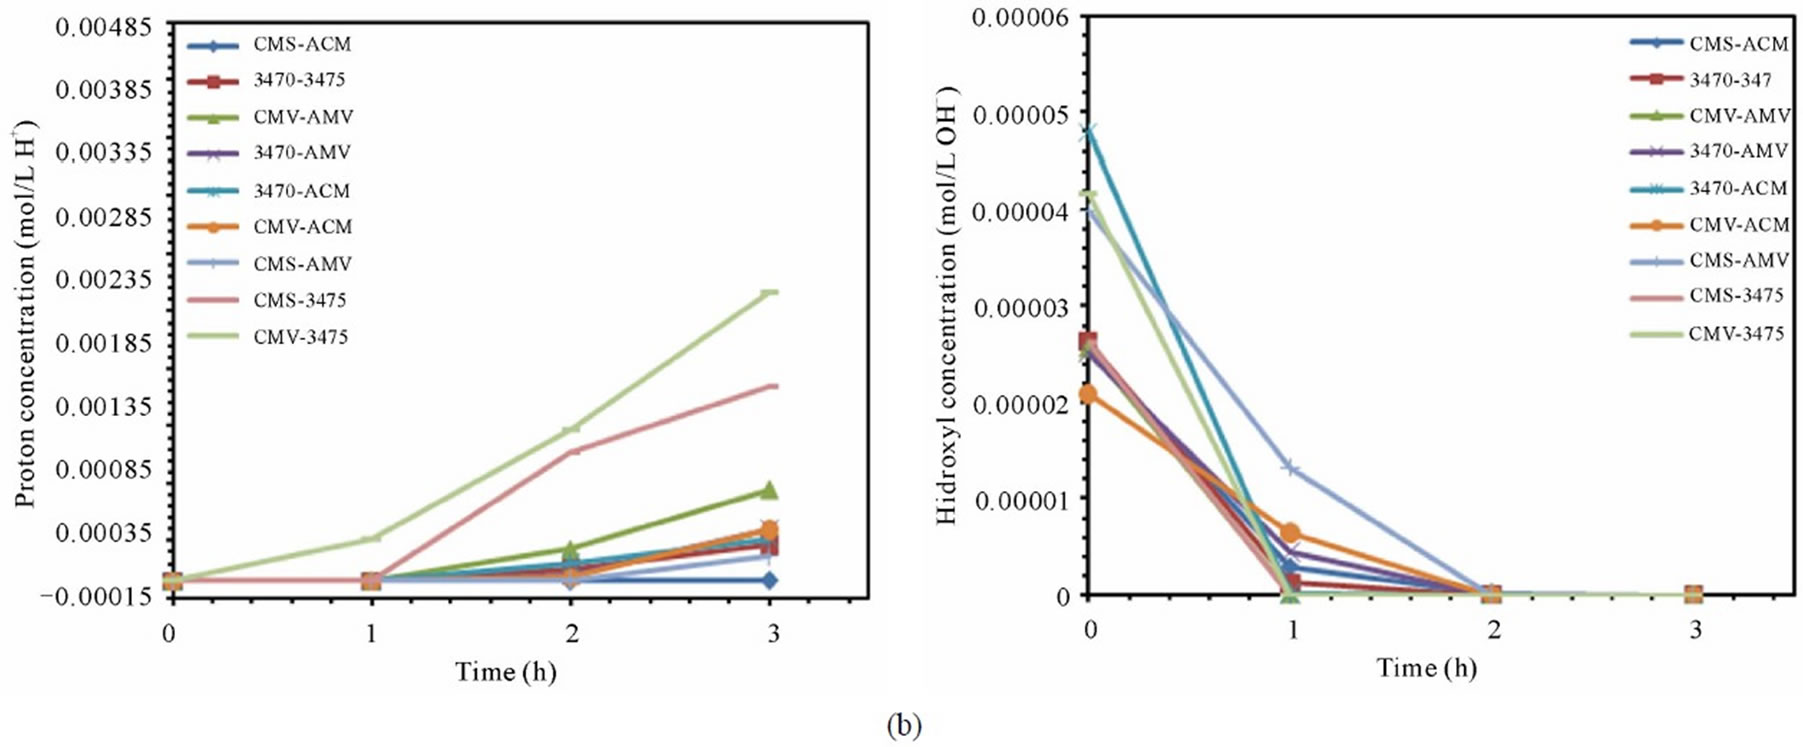
Figure 7. Proton and hydroxyl ions behavior for the different membrane pair. (a) 25 L·h−1; (b) 50 L·h−1.
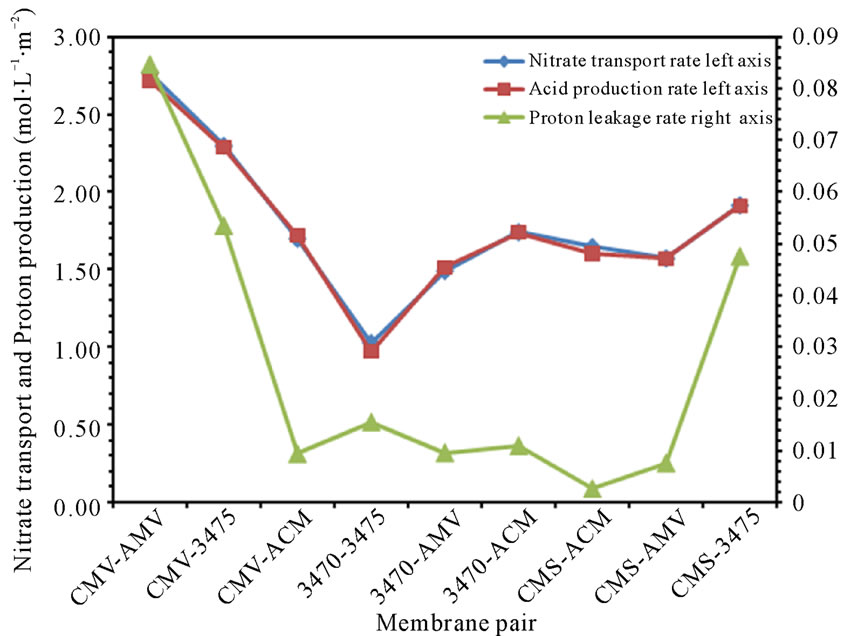
Figure 8. Nitrate transport rate, acid production rate and proton leakage vs. membrane pair at 25 L·h−1.
case, that hydroxyl ions coming from cathodic compartment to the feed compartment must be of about 10−6 M. These results are in agreement with similar findings for proton leakage, as well as for sodium and nitrate ions leakage, which have been reported [30]. Indeed this behavior is seen in all the membrane pair tested, and is more or less pronounced depending on membrane pair as for the above cited studies. Nevertheless, since proton back migration (proton leakage) is higher than hydroxyl ion, the consequence is the well known acidification of the central compartment. Work is under conduction to better understand this behavior. As mentioned above the ranking by proton leakage does not agree with the ranking by LC (table and figure not shown).
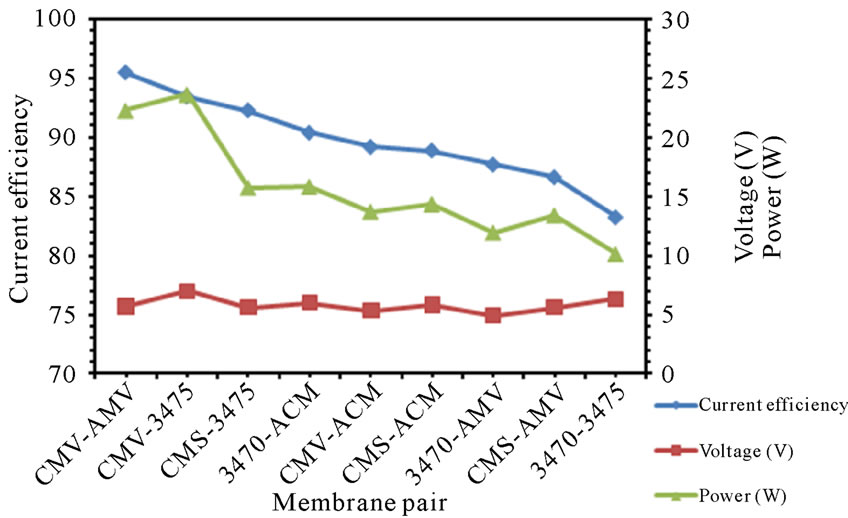
3.5. Current Efficiency
We have tested all the membrane pairs regarding current efficiency. The current efficiency is a measure of the system to use the current advisedly. The current efficiency for production of a component C during a timeperiod t is the ratio between the moles of C produced during t and the theoretical moles corresponding to the quantity of charge involved during t. Figure 9 show the current efficiciency for every membrane pair at 25 and 50 L·h−1. One can see that CE depends on the associated membrane and that it varies with flow rate. Nonetheless, ranking do not agree with that of limiting current density or ions leakage.
3.6. Specific Power Consumption
The specific power consumption for all the membrane pairs was calculated using (1). Where E is the voltage applied, t is the electrodialysis time, I is the current intensity and VF is the volume of feed compartment. The Calculated specific power consumption values for nitrate removal are shown in figure 10. It was found that the more efficient the membrane pair, the more power consuming. Once again, ranking by SPC does not agree with ranking by LCD, neither by Voltage at LCD.
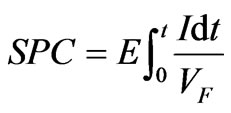 (1)
(1)
4. Conclusions
The electrodialysis study performed with sodium nitrate solutions in order to treat wastewaters and at the same time to produce nitric acid and sodium hydroxide reveals that the AEM/CEM unit is responsible for the global performance. When we compare the limiting current density for each membrane pair, results show that, while membrane ranking by LCD is the same at both flow conditions, ranking by applied voltage at LCD is not the same as LCD ranking, and indeed, it is not the same for the two flow rates.
Regarding nitrate and sodium transport trough AEM and CEM all the pair tested have a good performance.
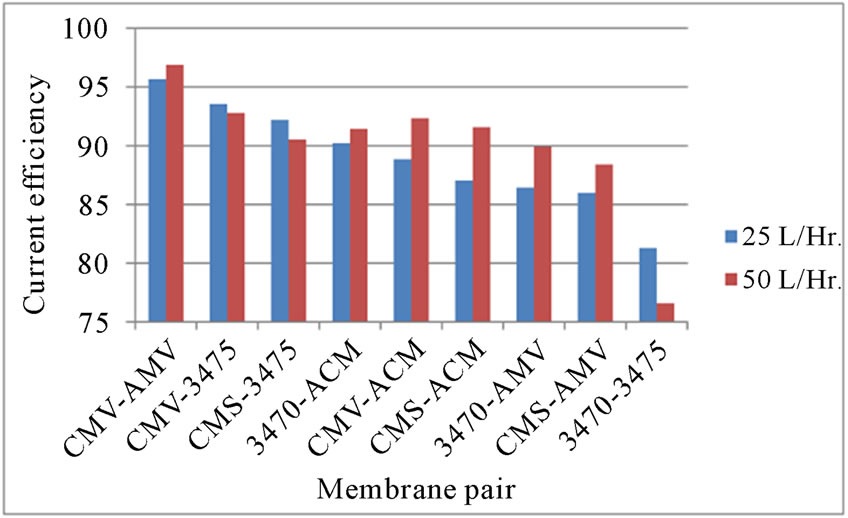
Figure 9. CE vs. membrane pair.
 (a)
(a)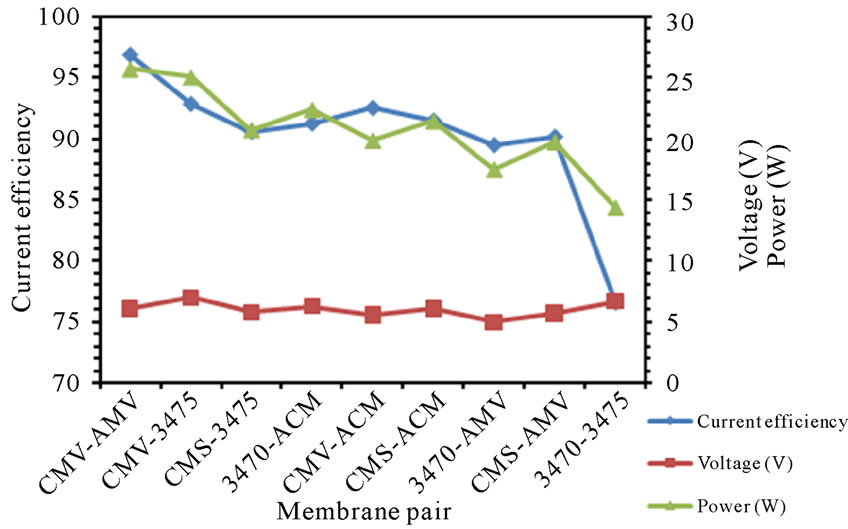 (b)
(b)
Figure 10. SPC for the different membrane pair (a) 25 L·h−1; (b) 50 L·h−1.
Working at 70% of LCD of each membrane pair the transport rate varies from 1.9 to 2.7 mol·h−1·m−2, but this ranking does not agree with that of LCD or voltage at LCD.
The same can be said for the nitrate and sodium leakage in the opposite direction of electric field. Surprisingly nitrate leakage is three orders of magnitude higher than sodium. In the other hand proton leakage is of same order of nitrate, leading to the acidification of feed compartment.
Regarding current efficiency, it depends on the membrane pair and it varies with flow rate. Indeed, ranking do not agree with that of LCD or ions leakage. Finally it was found that the more efficient the membrane pair, the more power consuming. Once again, ranking by specific power consumption does not agree with ranking by LCD neither voltage at LCD.
Results show that one cannot select a membrane or a membrane pair only by limiting current i.e. it is necessary to evaluate several parameters of the process by characterizing the whole membrane pair and to decide the parameter of interest, i.e. denitrification speed, ions leakage, proton back migration, current efficiency or specific power consumption. Nevertheless, in the tested conditions, CMV-AMV has the better performance regarding current efficiency and nitrate removal.
5. Acknowledgements
Ulises López-García acknowledges CONACYT for scholarship support.
REFERENCES
- M. I. M. Soares, “Biological denitrification of ground water,” Water, Air, and Soil Pollution, Vol. 123, No. 1-4, 2000, pp. 183-193. doi:10.1023/A:1005242600186
- C. D. Rocca, V. Belgiorno and S. Meric, “Overview of in-Situ Applicable Nitrate Removal Processes,” Desalination, Vol. 204, No. 1-3, 2007, pp. 46-62. doi:10.1016/j.desal.2006.04.023
- C. Su and R.W. Puls, “Nitrate Reduction by Zerovalent Iron: Effects of Formate, Oxalate, Citrate, Chloride, Sulfate, Borate, and Phosphate,” Environmental Science and Technology, Vol. 38, No. 9, 2004, pp. 2715-2720. doi:10.1021/es034650p
- A. Afkhami, T. Madrakian and Z. Karimi, “The Effect of Acid Treatment of Carbon Cloth on the Adsorption of Nitrite and Nitrate Ions,” Journal of Hazardous Materials, Vol. 144, No. 1-2, 2007, pp. 427-431. doi:10.1016/j.jhazmat.2006.10.062
- C. J. Martin, E. O. Kartinen Jr. and J. Condon, “Examination of Processes for Multiple Contaminant Removal from Groundwater,” Desalination, Vol. 102, No. 1-3, 1995, pp. 35-45. doi:10.1016/0011-9164(95)00039-5
- D. Clifford and X. Liu, “Ion Exchange for Nitrate Removal,” Journal of the American Water Works Association, Vol. 85, 1993, pp. 135-143.
- J.-H. Ahn, K.-H. Choo and H.-S. Park, “Ion Exchange Membrane Treatment of Acidic Etchant Wastewater: Effect of Neutralization and Polyelectrolyte Coating on Nitrate Removal,” Journal of Membrane Science, Vol. 310, No. 1-2, 2008, pp. 296-302. doi:10.1016/j.memsci.2007.11.010
- A. Elmidaoui, F. Elhannouni, M. A. MenkouchiSahli, L. Chay, H. Elabbassi, M. Hafsi and D. Largeteau, “Pollution of Nitrate in Moroccan Ground Water: Removal by Electrodialysis,” Desalination, Vol. 136, No. 1-3, 2001, pp. 325-332. doi:10.1016/S0011-9164(01)00195-3
- F. Hell, J. Lahnsteiner, H. Frischherz and G. Baumgartner, “Experience with Full-Scale Electrodialysis for Nitrate and Hardness Removal,” Desalination, Vol. 117, No. 1-3, 1998, pp. 173-180. doi:10.1016/S0011-9164(98)00088-5
- M. Amara and H. Kerdjoudj, “A Modified Anion -Exchange Membrane Applied to Purification of Effluent Containing Different Anions: Pretreatment before Desalination,” Desalination, Vol. 206, No. 1-3, 2007, pp. 205-209. doi:10.1016/j.desal.2006.02.067
- B. Van der Bruggen, A. Koninckx and C. Vandecasteele, “Separation of Monovalent and Divalent Ions from Aqueous Solution by Electrodialysis and Nanofiltration,” Water Research, Vol. 38, No. 5, 2004, pp. 1347-1353. doi:10.1016/j.watres.2003.11.008
- H. Wang and J. Qu, “Combined Bioelectrochemical and Sulfur Autotrophic Denitrification for Drinking Water Treatment,” Water Research, Vol. 37, No. 15, 2003, pp. 3767-3775. doi:10.1016/S0043-1354(03)00249-5
- Y.-H. Kima, E.-D. Hwangb, W. S. Shinc, J.-H. Choic, T. W. Had and S. J. Choic “Treatments of Stainless Steel Wastewater Containing a High Concentration of Nitrate Using Reverse Osmosis and Nanomembranes,” Desalination. Vol. 202, No. 1-3, 2007, pp. 286-292. doi:10.1016/j.desal.2005.12.066
- J. J. Schhoeman, A. Steyn and P. J. Scurr, “Treatment Using Reverse Osmosis of an Effluent from Stainless Steel Manufacture,” Water Research, Vol. 30, No. 9, 1996, pp. 1979-1984. doi:10.1016/0043-1354(96)00014-0
- S. Choi and Z. Yun, “The Effect of Co-Existing Ions and Surface Characteristics of Nanomembranes on the Removal of Nitrate and Fluoride,” Desalination, Vol. 133, No. 1, 2001, pp. 53-64. doi:10.1016/S0011-9164(01)00082-0
- C. J. Martin, E. O. Kartinen and J. Condon, “Examination of Processes for Multiple Contaminant Removal from Groundwater,” Desalination, Vol. 102, No. 1-3, 1995, pp. 35-45. doi:10.1016/0011-9164(95)00039-5
- R. Molinari, P. Argurio and L. Romeo, “Studies on Interactions between Membranes (RO and NF) and Pollutants (SiO2, NO3−, Mn2+ and Humic Acid) in Water,” Desalination, Vol. 138, No. 1-3, 2001, pp. 271-281. doi:10.1016/S0011-9164(01)00273-9
- E. Gain, S. Laborie, Ph. Viers, M. Rakib, G. Durand and D. Hartmann, “Ammonium Nitrate Wastewater Treatment by Coupled Membrane Electrolysis and Electrodialysis,” Journal of Applied Electrochemistry, Vol. 32, No. 9, 2002, pp. 969-975. doi:10.1023/A:1020908702406
- E. Gain, S. Laborie, Ph. Viers, M. Rakib, D. Hartmann and G. Durand, “Ammonium Nitrate Wastewater Treatment by an Electromembrane Process,” Desalination, Vol. 149, No. 1-3, 2002, pp. 337-342. doi:10.1016/S0011-9164(02)00806-8
- T. Sawa, Y. Hirose, Y. Ishii, A. Takatsudo, K. Wakasugi and H. Hayashi, “Development of Electrochemical Denitrification from Waste Water Containing Ammonium Nitrate, Radiactive Waste Management and Environmental Remediation,” The Association for the Study of Medical Education, 1995.
- K. N. Mani, F. P. Chlanda and C. H. Byszewski, “Aquatech Membrane Technology for Recovery of Acid/Base Value for Salt Streams,” Desalination, Vol. 68, No. 2-3, 1988, pp. 149-166. doi:10.1016/0011-9164(88)80051-1
- J. L. Gineste, G. Pourcelly, Y. Lorrain, F. Persin and C. Gavach, “Analysis of Factors Limiting the Use of Bipolar Membranes: A Simplified Model to Determine Trends,” Journal of Membrane Science, Vol. 112, No. 2, 1996, pp. 199-208. doi:10.1016/0376-7388(95)00284-7
- K. N. Mani, “Electrodialysis Water Splitting Technology,” Journal of Membrane Science, Vol. 58, No. 2, 1991, pp. 117-138. doi:10.1016/S0376-7388(00)82450-3
- Y. C. Chiao, F. P. Chlanda and K. N. Mani, “Bipolar Membranes for Purification of Acids and Bases,” Journal of Membrane Science, Vol. 61, 1991, pp. 239-252. doi:10.1016/0376-7388(91)80018-2
- T. S. Sorensen, “Interfacial Electrodynamics of Membranes and Polymer Films, in Surface Chemistry and Electrochemistry of Membranes,” CRC Press, New York, 1999.
- P. Dlugolecki, B. Anet, S. J. Metz, K. Nijmeijer and M. Wessling, “Transport Limitations in Ion Exchange Membranes at Low Salt Concentrations,” Journal of Membrane Science, Vol. 346, No. 1, 2010, pp. 163-171. doi:10.1016/j.memsci.2009.09.033
- K. Hattenbach and K. Kneifel, “Determination of Transport Properties and Limiting Current Densities of Ion Exchange Membrane Stacks,” Desalination, Vol. 21, No. 3, 1977, pp. 317-326. doi:10.1016/S0011-9164(00)88249-1
- U. López-García, R. Antaño-López, G. Orozco, T. Chapman and F. Castaneda, “Characterization of Electrodialysis Membranes by Electrochemical Impedance Spectroscopy at Low Polarization and by Raman Spectroscopy,” Separation and Purification Technology, Vol. 68, No. 3, 2009, pp. 375-381. doi:10.1016/j.seppur.2009.06.012
- U, López-García, “Nitrate Removal by Electrodialysis,” Thesis of Master Degree in Electrochemistry, CIDETEQ, México, 2005.
- J. L. Gineste, G. Pourcelly, Y. Lorrain, F. Persin and C. Gavach, “Analysis of Factors Limiting the Use of Bipolar Membranes: A Simplified Model to Determine Trends,” Journal of Membrane Science, Vol. 112, No. 2, 1996, pp. 199-208. doi:10.1016/0376-7388(95)00284-7
- J. S. Jaime-Ferrer, E. Couallier, Ph. Viers, G. Durand and M. Rakib, “Three-Compartment Bipolar Membrane Electrodialysis for Splitting of Sodium Formate into Formic Acid and Sodium Hydroxide: Role of Diffusion of Molecular Acid,” Journal of Membrane Science, Vol. 325, No. 2, 2008, pp. 528-536. doi:10.1016/j.memsci.2008.07.059
- J. S. Jaime Ferrer, S. Laborie, G. Durand and M. Rakib, “Formic Acid Regeneration by Electromembrane Processes,” Journal of Membrane Science, Vol. 280, No. 1-2, 2006, pp. 509-516. doi:10.1016/j.memsci.2006.02.012
- M. Amara and H. Kerdjoudj, “A Modified Anion-Exchange Membrane Applied to Purification of Effluent Containing Different Anions: Pre-Treatment before Desalination,” Desalination, Vol. 206, No. 1-3, 2007, pp. 205-209. doi:10.1016/j.desal.2006.02.067
- M. A. Ben Ali, M. Rakib, S. Laborie, Ph. Viers and G. Durand, “Coupling of Bipolar Membrane Electrodialysis and Ammonia Stripping for Direct Treatment of Wastewaters Containing Ammonium Nitrate,” Journal of Membrane Science, Vol. 244, No. 1-2, 2004, pp. 89-96. doi:10.1016/j.memsci.2004.07.007