Journal of Water Resource and Protection
Vol. 3 No. 5 (2011) , Article ID: 4980 , 7 pages DOI:10.4236/jwarp.2011.35040
Monitoring Groundwater Contamination Using Surface Electrical Resistivity and Geochemical Methods
Department of Physics, Michael Okpara University of Agriculture, Umudike, Nigeria
E-mail: igboekwemu@yahoo.com
Received February 26, 2011; revised March 29, 2011; accepted April 30, 2011
Keywords: Groundwater, Uyo Urban, Resistivity, VES, Dumpsites
ABSTRACT
Surface electrical resistivity has been used as a tool in the detection of groundwater contamination. In this work, five geoelectric soundings with two at waste dumpsites have been carried out in Uyo, Southwestern Nigeria to map the gross layered structure of the refuse as well as the extent of groundwater contamination. The geology of the area (Benin Formation) mainly consists of fine-medium-coarse grained sands. The data of five Schlumberger Vertical Electrical Soundings (VES), with a maximum of AB/2 = 500 m, were analyzed using Hemkler computer program. In general, there exists a common feature in the resistivity variation pattern of high-low-high-low-high in the area. The result shows a wide range of resistivity variation ranging from 2.0 to 60700 Ωm. Based on the survey results, the resistivity values less than 75 Ωm shows contamination due to waste at Eka street and Udo street. Also, the high resistivity value at mechanic village (60700 Ωm) may be related to the waste oil deposit due to the automobile repair activities. A comparison of the resistivity values and the curve types at the dumpsites (Eka street and Udo street) and other locations show that the two dumpsites have an H curve type indicating contaminated zones, while other locations have a K curve type indicating non contaminated zones. Hydrochemical analysis of groundwater samples collected in the area was also carried out for some physico-chemical parameters. The results produced higher concentration of conductivity, total dissolved solids and chloride values for water collected at close locations to dumpsites than those far away from the dumpsites: an evidence for a quantitative assessment of groundwater contamination.
1. Introduction
Water is a landscape element and a chemically active mobile substance; it is always on continuous move through the surface and subsurface. Frequent handling of polluting substances on the ground surface involve interventions with water quality, in view of the fact that water is an excellent solvent, chemically active and always on the move according to the laws controlling the hydrodynamics of the water cycle. Once caught by the moving groundwater, pollutants therefore tend to move along with the groundwater, unless chemical reactions along the ground pathways influence the mobility of the pollutant.
Water carries pollutants through invisible and visible landscape. On the local scale, water soluble components used in agriculture, industrial refuse, dry waste deposits, etc., may be caught by water and produce groundwater pollution, which will remain undetected until the polluted water passes through a local well. Similarly, refuse disposed of in the discharge area may be leached by the water, and ultimately transferred to the river. Effect of pollution may show up further downstream where the river water is being used for some vulnerable purpose like irrigation.
Refuse (domestic and industrial solid waste) has been defined as useless, unwanted materials which arise from human activities and are not free floating [1]. Poor management of solid waste materials has resulted to a lot of disastrous effects such as aesthetics, environmental hazards and pollution. Groundwater pollution may also occur due to the contamination potential of leachate from waste [2]. Various methods by which solid waste can be disposed are open dumps, sanitary landfill, incineration on-site disposal, swine feeding and compositing.
Swartz used surface electrical resistivity to locate salt water boundaries in the Hawaiian Island [3]. Surface electrical resistivity has been proved as a practical method in detecting groundwater contamination from sanitary landfills [4,5]; from sewage effluent [6]; from salt piles [7]; and from industrial waste seepage [8]. In this study, the feasibility of using electrical resistivity to investigate the internal refuse dumps structure compared to other areas is assessed in Uyo urban, as well as the hydrochemical analysis so as to access the level of contamination of the groundwater.
When an electrical current is introduced into the saturated soil, it tends to move in a tortuous path through intergranular spaces following the same path as the groundwater. In the case of groundwater flow, the driving force is the hydraulic potential; in electrical flow, it is the electrical potential. If the soil material itself is nonconductive, such as quartz sand, and relatively free of clay, the magnitude of the current depends primarily on effective porosity and pore-water conductivity (or resistivity). Conductive materials, such as magnetite in the matrix, as well as granular surface conductance, can also affect electrical flow, but these are normally of secondary importance.
A commonly used means of expressing the relationship between pore-water resistivity, and bulk resistivity,
 , is by formation factor, F [1].
 (1)
(1)
The formation factor is related to porosity, , in the following empirical equation [9].
 (2)
(2)
where
 = porosity
![]() = constant ranging from 0.47 to 2.2 and m = cementation constant ranging from 1.3 to 2.6 Combining (1) and (2)
= constant ranging from 0.47 to 2.2 and m = cementation constant ranging from 1.3 to 2.6 Combining (1) and (2)
 (3)
(3)
In surface electrical resistivity methods, an electrical current is introduced into the ground at the surface using two outside electrodes, and the resultant electrical potential is measured between two central electrodes. In the Schlumberger electrode arrangement, the central electrodes are kept relatively close together as compared to the separation of the outside current electrodes. The apparent resistivity,  , of the bulk earth can be determined by the following equation:
 (4)
(4)
where,
 (5)
(5)
is called the geometric factor and it is defined as the parameter which when multiplied by the measured resistance will convert the resistance to the resistivity for a uniform medium. Equation (4) gives a relationship between the potential difference V, current I, and apparent resistivity  measured using the Schlumberger array.
Uyo is situated between latitude 5001” North of Equator and 7056” East of the meridian. Figure 1 shows the location map of the study area. The sub-equatorial climate region is influenced by warm humid air masses from the Atlantic Ocean and slightly by the hot day air masses called harmattan. The area enjoys the influence of maritime all the year round. Rainy season occurs between March and October with a short dry season from November to February. The area has mean annual rainfall of 2 484 mm and a mean yearly temperature of 27˚C. It has relative humidity range of 70 - 80%.
The study area is located within the lowland coastal plain region of Nigeria. It has almost flat terrain of 61 m average height above sea level, except in the Northern sides where 50 meters deep Ikpa river valley breaks the monotony. A close study of the area indicates that 90% of the town slopes to the South while the remaining portion slopes towards the Ikpa valley [10]. The virtually flat nature of the town has adversely affected rhe drainage of the town and its physical development. The stabilized ground surface has greatly increased the rate of rainfall infiltration into the ground.
The aluvial deposits of the late tertiary age from homogenous rock structures and sandstones, shales and clay have resulted in a physiographic region underlined by coastal plain sand. The resultant ferralitic soils are rich in free iron but low mineral reserves. The specific ferralitic soil type is brownish and porous.
Geologically, Uyo belongs to the area classified as coastal plain sands known as the Benin formation [11]. The Benin formation is the upper most unit of the Niger Delta complex and overlies the Agbada formation. Ugbaja and Edet observed that coastal plain sands are made of alternating sequences of gravels and sands of different grain sizes, silt, clay and alluvium [12]. According to Edet and Okereke, Benin formation comprises of sediments whose age is from tertiary to recent [13]. Mpipom et al., observed that Benin formation consists of fine-medium coarse grained sands which sometimes poorly sorted [11].
2. Methods
Electrical resistivity technique surveys have been employed for many years in routine hydrogeological investigation. This technique is particularly useful in the area of complex geology [14], in archeology, and in other shallow subsurface investigations [15]. For the geoelectric soundings carried out in this study, an ABEM Terrameter SAS300B and its accessories were used. The instrument displays directly the apparent resistivity of the subsurface under probe. It has an in-built dc power source. A total of five vertical electrical soundings (VES) were made using the Schlumberger array with a maximum current electrode separation of AB/2 of 500 m. Two VES were made at the flat surfaces of two dumpsites, one at a popular automobile service outlet (mechanic village), while the remaining two were carried out at locations free from waste (Figure 1).
For a comprehensive study, five groundwater samples were collected from wells located at the various VES points (Figure 1). For all the samples, temperature, conductivity, total dissolved solid, pH, and dissolved oxygen was determined at the sites. The temperature, conductivity and total dissolved solid were determined using a HACH 44600-00 Conductivity/TDS meter. The pH was determined using a HACH sensor 3 pH meter, while the dissolved oxygen was determined using a JYD-IA dissolved oxygen meter. The samples were then stored in a sterilized 250 ml bottles and transferred to the laboratory for further analyses. The laboratory analysis for chloride (Cl–) was done by titrimetric using potassium dichromate as the indicator [16]. For the total heterotrophic bacteria (THB), the pour plate technique was used with nutrient-
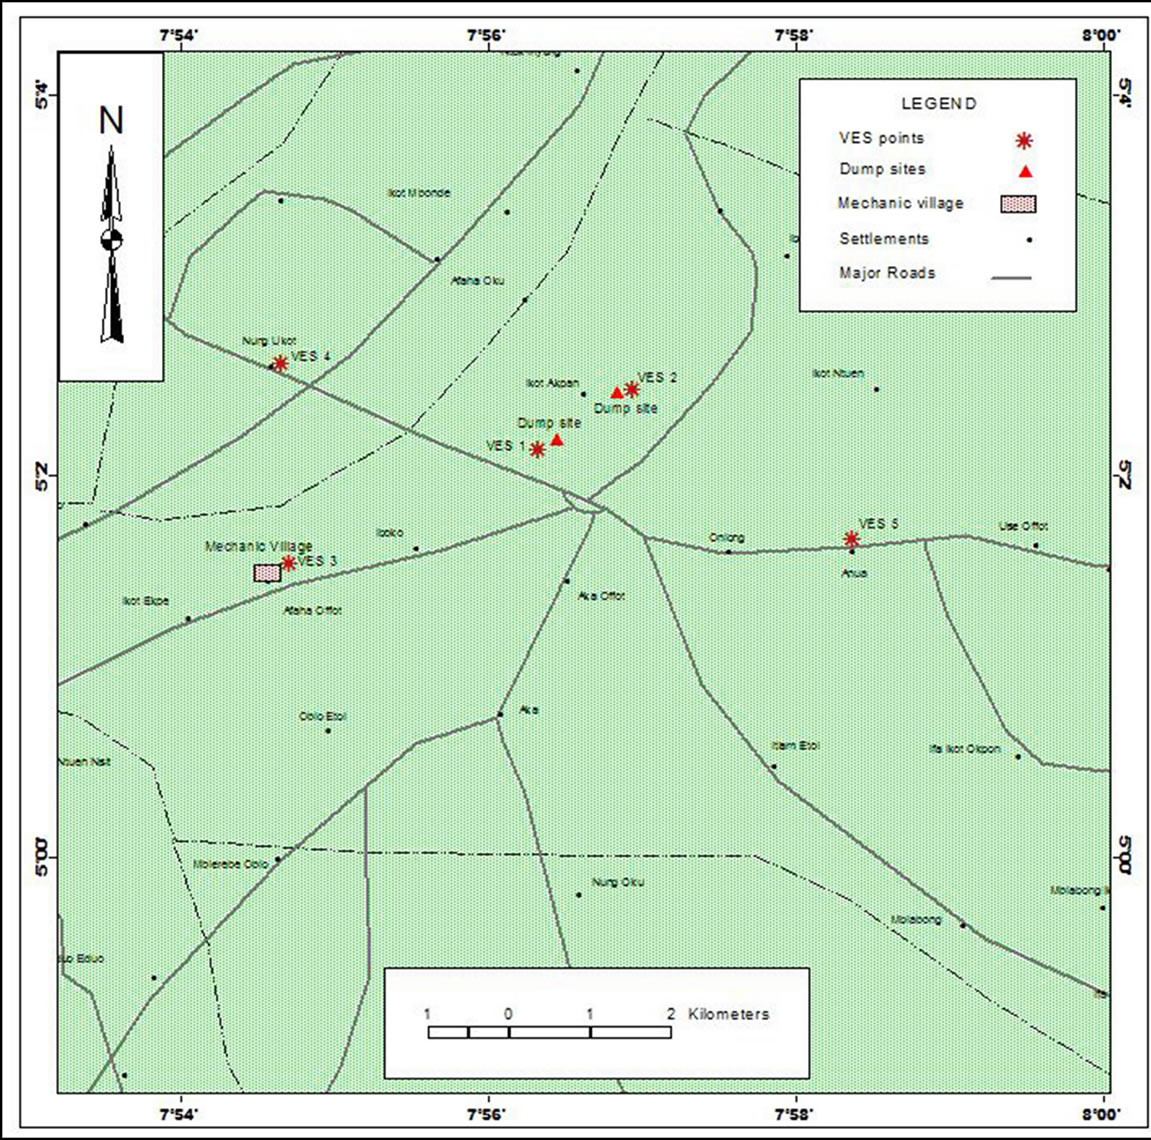
Figure 1. Locations of dump sites and VES points on the map Uyo urban.
agar as the medium, and an indication temperature of 37˚C, while the incubation period was 24 hours.
3. Results and Discussion
Table 1 shows the result of the computation of resistivity and depth at each measurement point done with the Hemkler computer program [17]. The software performs inversion of resistivity sounding data collected using Schlumberger array. The computer modeling results for all the sounding locations in the area show that a number of layers could be distinctly defined ranging from three to six (Table 1). Two locations (Eka street and Udo street dumpsites) show low resistivity top layers of between 8.0 to 72.2 Ωm, while the remaining three locations show resistivities ranging between 756 to 1930 Ωm. These values can be attributed to a variation in the amount of moisture and clay substance in that soil. The resistivity values of the bottom layers ranged between not too high to relatively high values ranging from 124 (Itam) to 60700 Ωm (mechanic village). This high resistivity layer may be considered to have prevented and reduced chances of detecting deeper layers.
In general, there exists a common feature in the resistivity variation pattern of high-low-high-low-high in the area. The result shows a wide range of resistivity variation ranging from 2.01 to 60700 Ωm. Based on the survey results, the resistivity values less than 75 Ωm shows contamination due to waste at Eka street and Udo street. Also, the high resistivity value at mechanic village (60700 Ωm) may be related to the waste oil deposit due to the automobile repair activities.
The resistivity values and the curve type at Eka street dumpsite show that the area has an H curve type indicating contaminated zone (Figure 2). Also, another contaminated zone appears at Udo street dumpsite with an H curve type (Figure 3). The resistivity values and the curve type at mechanic village show that the area has a K curve type indicating non contaminated zone (Figure 4). Also, other non contaminated zones appear at Itam (Figure 5) and Anua (Figure 6) with a K curve types. The resistivity values at the dumpsites are relatively low at the first and second layers ranging from 8.0 to 39.7 Ωm, while the values at other locations are higher ranging from 756 to 4090 Ωm. The sandy and porous nature of the area contributes to the high infiltration process at the dumpsites leading to groundwater contamination. Also the virtually flat nature of the town with a poor drainage system also increases the rate of rainfall infiltration into the groundwater since the rate of run off will be slow.
Table 2 shows the results of the physico-chemical parameters either measured or analysed for the five wells. The temperature values at all the locations appeared uniform, ranging from a minimum of 26.10˚C to a maximum of 26.80˚C. For the entire area, the temperature has a mean value of 26.38˚C. These values are consistent
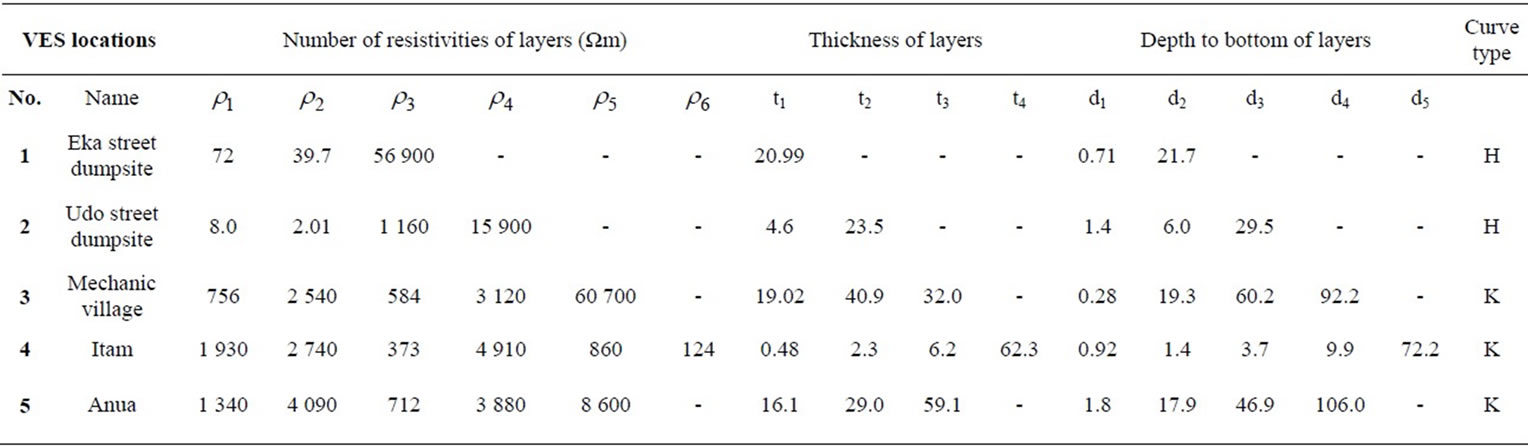
Table 1. General VES results from computer modeling.
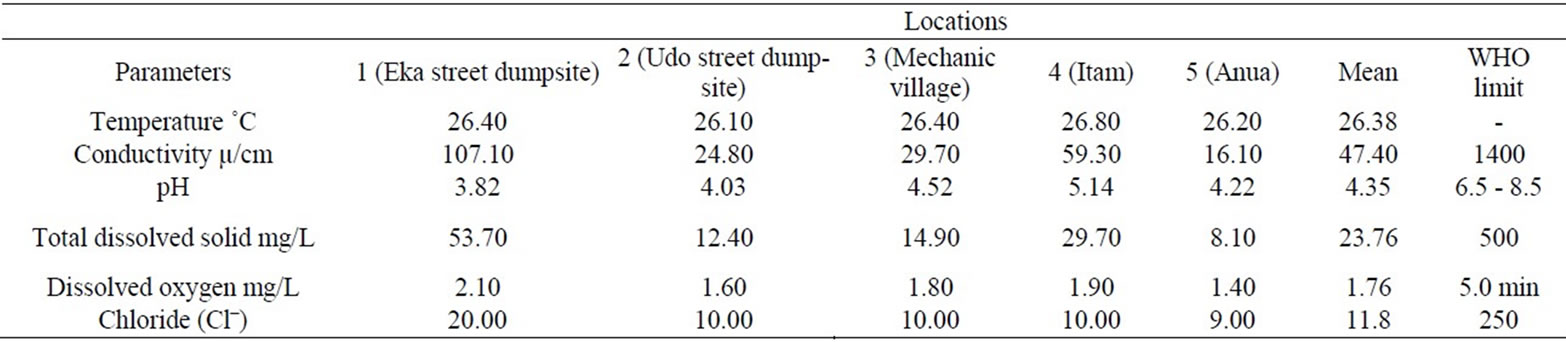
Table 2. Physico-chemical parameters for the five wells.
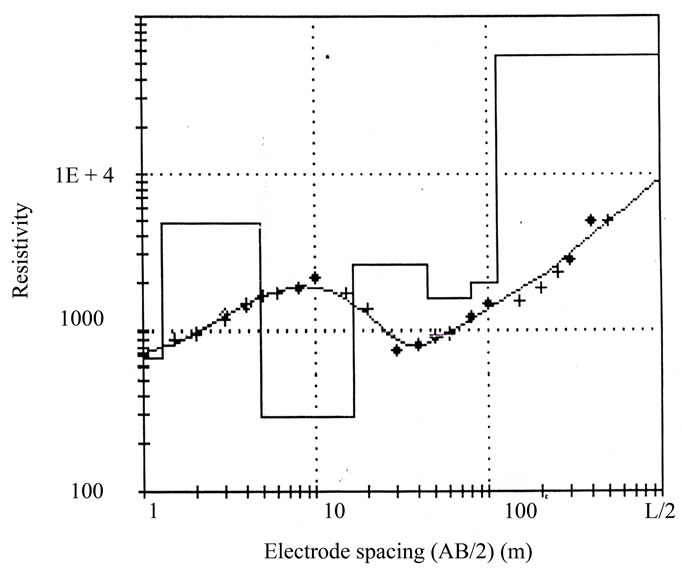
Figure 2. Sounding curve at VES 1 (Eka street dumpsite).
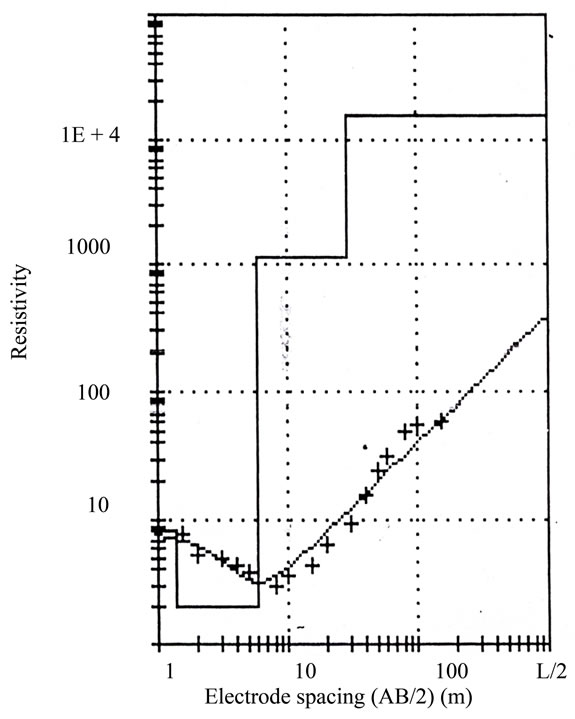
Figure 3. Sounding curve at VES 2 (Udo street dumpsite).
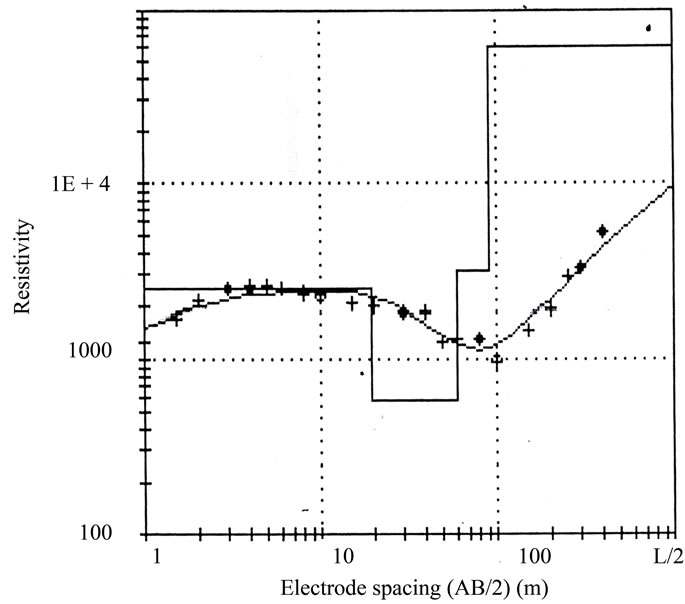
Figure 4. Sounding curve at VES 3 (mechanic village).
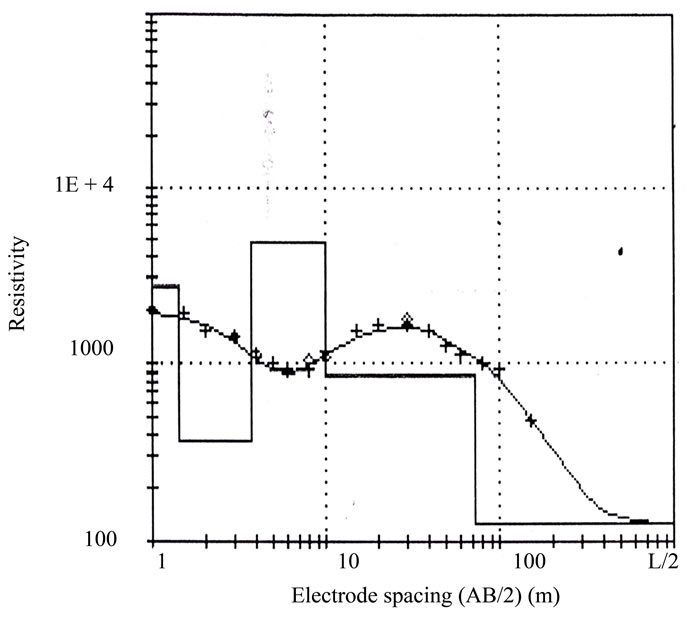
Figure 5. Sounding curve at VES 4 (Itam).
with the mean yearly air temperature of 27˚C for the area.
The conductivity values in the area fluctuated greatly ranging from 107.10 to 24.80 µ/cm, with a mean value of 47.40 µ/cm. The pH values in the area varied from 3.82 to 5.14. (Table 2) According to Zamxaka (2004) [18], the pH values ranging from 3.0 to 10.5 could favour both indicator and pathogenic microorganism growth. The total dissolved solid values fluctuated. The values range between 8.10 to 53.70 mg/L. The concentration of dissolved oxygen for all the locations range between 1.40 to 2.10 mg/L. According to Akankpo, et al., groundwater in Uyo urban has a very low concentration of dissolved oxygen due to the high concentration of bacteria in the area [19]. Chloride concentration in the area varied from 9.00 to 20.00 mg/L which is relatively low below the WHO standard of 250 mg/L. Also, a scatter chart for temperature, conductivity and pH is shown in Figure 7, while Figure 8 shows a scatter chart for total dissolved
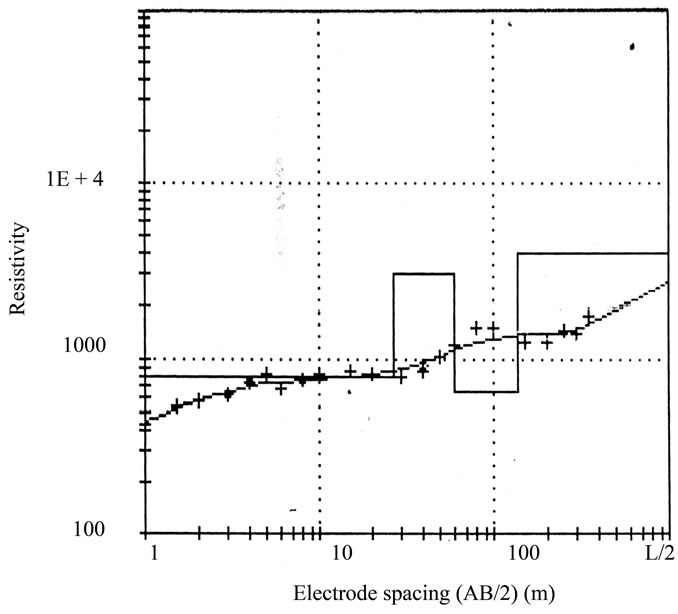
Figure 6. Sounding curve at VES 5 (Anua).
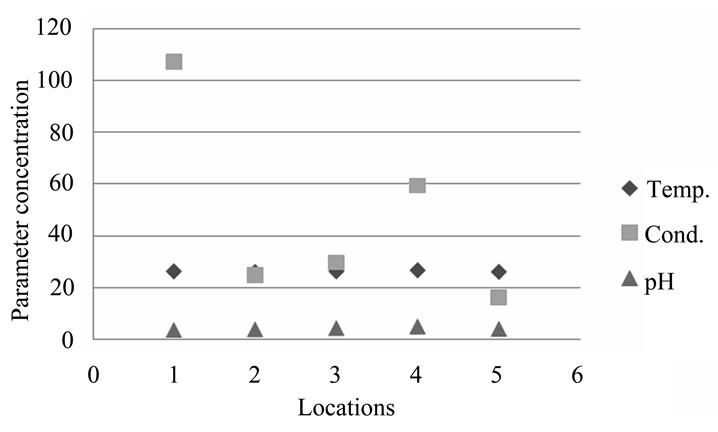
Figure 7. Scatter chart for temperature, conductivity and pH.
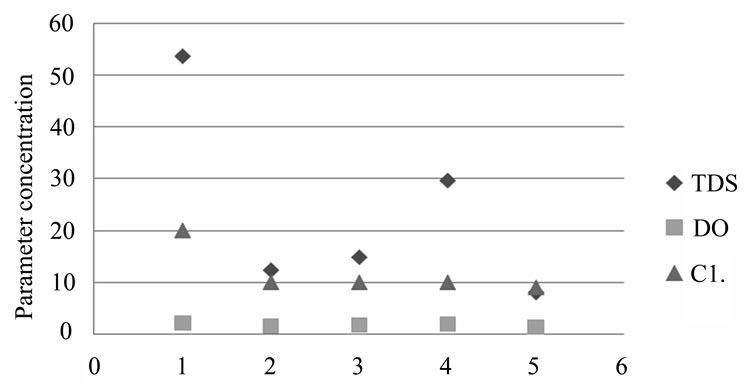
solid, dissolved oxygen and chloride. The study shows that high concentration of chloride is related to high concentration of conductivity and vice versa.
4. Conclusions
Quantitative interpretation of geoelectric soundings of dumpsites compared to other locations have yielded information on groundwater contamination as indicated by the measured values of dumpsites resistivity, curve types and hydrochemical parameters of the water samples. It is concluded that waste disposal has affected the groundwater quality in the area leading to contamination as indicated by the geoelectric curves obtained at the two dumpsites. Therefore a combination of electrical tomography and hydrochemical analysis is a unique and powerful technique for monitoring the groundwater contamination at dumpsites as well as examining shallow complex subsurface structures; an approach suitable in the studies of water quality.
REFERENCES
- G. E. Archie, “The Electrical Resistivity Log as an Aid in Determining Some Reseviour Characteristics,” Transactions. American Institute of Mining, Metallurgical and Petroleum Engineers, Vol. 146, 1942, pp. 54-62.
- K. S. Makey, “Natural Buffers for Sludge Leachate Stabilization,” Groundwater, Vol. 20, No. 4, 1982, pp. 420- 429. doi:10.1111/j.1745-6584.1982.tb02762.x
- J. H. Swartx, “Resistivity Studies of Some Salt-Water Boundaries in the Hawaiian Islands,” Transactions of American Geophysical Union, Vol. 18, 1937, pp. 387- 393.
- K. Cartwright and F. B. Sherman, Jr., “Electrical Earth Resistivity Surveying in Landfill Investigations,” Engineering and Soils Engineering Symposium Proceedings 10th Annual Meeting, Moscow, 1972, pp. 77-92.
- W. F. Kelly, “Geoelectrical Sounding for Delineating Ground-Water Contamination,” Groundwater, Vol. 14, No. 1, 1976, pp. 6-10. doi:10.1111/j.1745-6584.1976.tb03626.x
- D. L. Warner, “Preliminary Field Studies Using Earth Resistivity Measurements for Delineating Zones of Contaminated Ground Water,” Groundwater, Vol. 7, No. 1, 1969, pp. 9-16. doi:10.1111/j.1745-6584.1969.tb01262.x
- D. W. Urish, “Salt Source Sleuthing in a Coastal Environment: A Case Study,” American Geophysical Union, Vol. 61, No. 46, 1980, p. 955.
- R. L. Stollar and P. Roux, “Earth Resistivity Survey—A Method for Defining Groundwater Contamination,” Groundwater, Vol. 13, No. 2, 1975, pp. 145-150. doi:10.1111/j.1745-6584.1975.tb03070.x
- W. O. Winsauer, H. M. Shearin, P. H. Masson and M. Williams, “Resistivity of Brine Saturated Sands in relation to Pore Geometry,” American Association of Petroleum Geologists Bulletin, Vol. 36, No. 2, 1952, pp. 253- 277.
- I. A. Ema, “The Capital City of Akwa Ibom State,” E-ten Organization, Uyo, 1989.
- E. M. Mbipom, E. E. Okwueze and A. A. Onwuegbuche, “Estimation of Transmissivity Using VES Data from the Mbaise Area of Nigeria,” Nigerian Journal of Physics, Vol. 85, 1996, pp. 28-32.
- A. N. Ugbaja and A. E. Edet, “Groundwater Pollution near Shallow Waste Dumps in Southern Calabar, South- -Eastern Nigeria,” Global Journal of Geological Sciences, Vol. 2, No. 2, 2004, pp. 199-206.
- A. E. Edet and C. S. Okereke, “Delineation of Shallow Groundwater Aquifers in the Coastal Plain Sand of Calabar Area Using Surface Resistivity and Hydro-Geological,” Journal of African Earth Sciences, Vol. 35, No. 3, 2002, pp. 433-441. doi:10.1016/S0899-5362(02)00148-3
- D. H. Griffiths and R. D. Barker, “Two Dimensional Resistivity Imaging and Modeling in Areas of Complex Geology,” Journal of Applied Geophysics, Vol. 29, No. 3-4, 1993, pp. 211-226. doi:10.1016/0926-9851(93)90005-J
- M. Noel and R. Walker, “Development of an Electrical Tomography System for Imaging Archeological Structures,” Archeometry, Vol. 32, 1970, pp. 767-776.
- G. A. Best and S. L. Ross, “River Pollution Studies,” University Press, Liverpool, 1977.
- C. J. Hemkler, “A VES Modeling Programme for Schlumberger Automatics Analysis Version 0.92,” 1985.
- M. Zamxaka, G. Pironcheva and N. Muyima, “Microbiological and Physico-Chemical Assessment of the Quality of Domestic Water Sources in Selected Rural Communities of the Eastern Cape Province, South Africa,” Water South Africa, Vol. 30, No. 30, 2004, pp. 333-339.
- A. O. Akankpo, G. T. Akpabio and I. O. Akpabio, “Physicochemistry and Biological Properties of Groundwater samples from Boreholes Sited near Waste Dumps in Uyo, Soutwestern Nigeria,” Natural and Applied Sciences Journal, Vol. 10, No. 2, 2009, pp. 156-165.