Journal of Water Resource and Protection
Vol. 2 No. 12 (2010) , Article ID: 3510 , 14 pages DOI:10.4236/jwarp.2010.212125
Managed Aquifer Recharge (MAR) through Surface Infiltration in the Azraq Basin/Jordan
University of Jordan, Water and Environment Research and Study Center (WERSC), Amman, Jordan
E-mail: m.raggad@ju.edu.jo, s.jasem@ju.edu.jo
Received September 7, 2010; revised October 19, 2010; accepted November 20, 2010
Keywords: Azraq Basin, Climate Change, Integrated Water Resources Management, Managed Aquifer Recharge
ABSTRACT
Until the early 1990 s the Azraq basin in Jordan was covered by a huge wetland in the central parts representing a source of fresh water for all purposes. The presence of such wetland in the desert created a natural pathway for migratory birds. Man made and natural impacts caused severe depletion of this basin and the oasis disappeared in the early 1990 s. Under a GIS environment MAR layers were prepared for the Azraq basin. MAR mapping showed a very high and high potentials over 20.55% and 61.63% of the total basin area respectively; while the low potential areas represent only 4.03% of the total area.
1. Introduction
The Azraq basin is sited in the heart of the eastern Jordanian desert with a harsh environment making water the most important environmental component.
The total area of this transboundary basin is 12,414 km² and extends from the Syrian borders in the north to the Saudi borders in the south, where 94% of the Azraq basin area is located in Jordan and the rest in Syria Figure 1.
According to rainfall rates, the Syrian part of the basin supports the basin with flood flow in the wet season. Due to development of water resources in the Syrian side, flood flow decreased in the last few decades which affect the environmental system that is dependant on the water resources coming from the north.
The climate of the Azraq basin is arid with rainfall rates in the Jordanian part ranging from less than 60 mm/yr in the eastern areas, and receiving a maximum of 260 mm/yr in the western highlands; producing a total rainfall volume of 1075.9 Million Cubic Meters (MCM) producing 12.5 MCM of flood flow in the normal rainfall year and which can be up to 32.54 in the wet year (NWMP 1977). This all flows to the central part of the basin through the drainage system where it accumulates in the mudflat underlaid by thick layers of clay preventing the natural recharge to the ground water system where the depth to the groundwater is just 20 to 30 meters.
Hydrogeologically, the Azraq basin represents one of the high potential groundwater basins in Jordan due to the high yield, low depth to groundwater and its good quality.
The main aquifer system in this basin is the shallow aquifer which is a multi layered aquifer composed of the Tertiary limestone, chalk and chert which are hydrogeologically connected with the overlying basaltic rocks in the northern parts of the basin Figure 2.
The groundwater flow system in this aquifer complex is enhanced by two factors: the presence of recharge mounds in the northern and the western parts of the basin; and the topographic variation which produced the lowest topographic point in the central part of the basin Figure 3.
The safe yield of the Azraq basin is approximately 30 -35 MCM while the pumping rate is around 60 MCM / year, therefore groundwater levels all around the basin show severe decline with a long term average decline of around 70 cm/yr Figure 4.
2. Methodology of MAR Mapping
2.1. MAR Definition and Needs
MAR has been identified as a potential major water management tool to support the groundwater storage in arid and semi arid areas. MAR depends on a process by
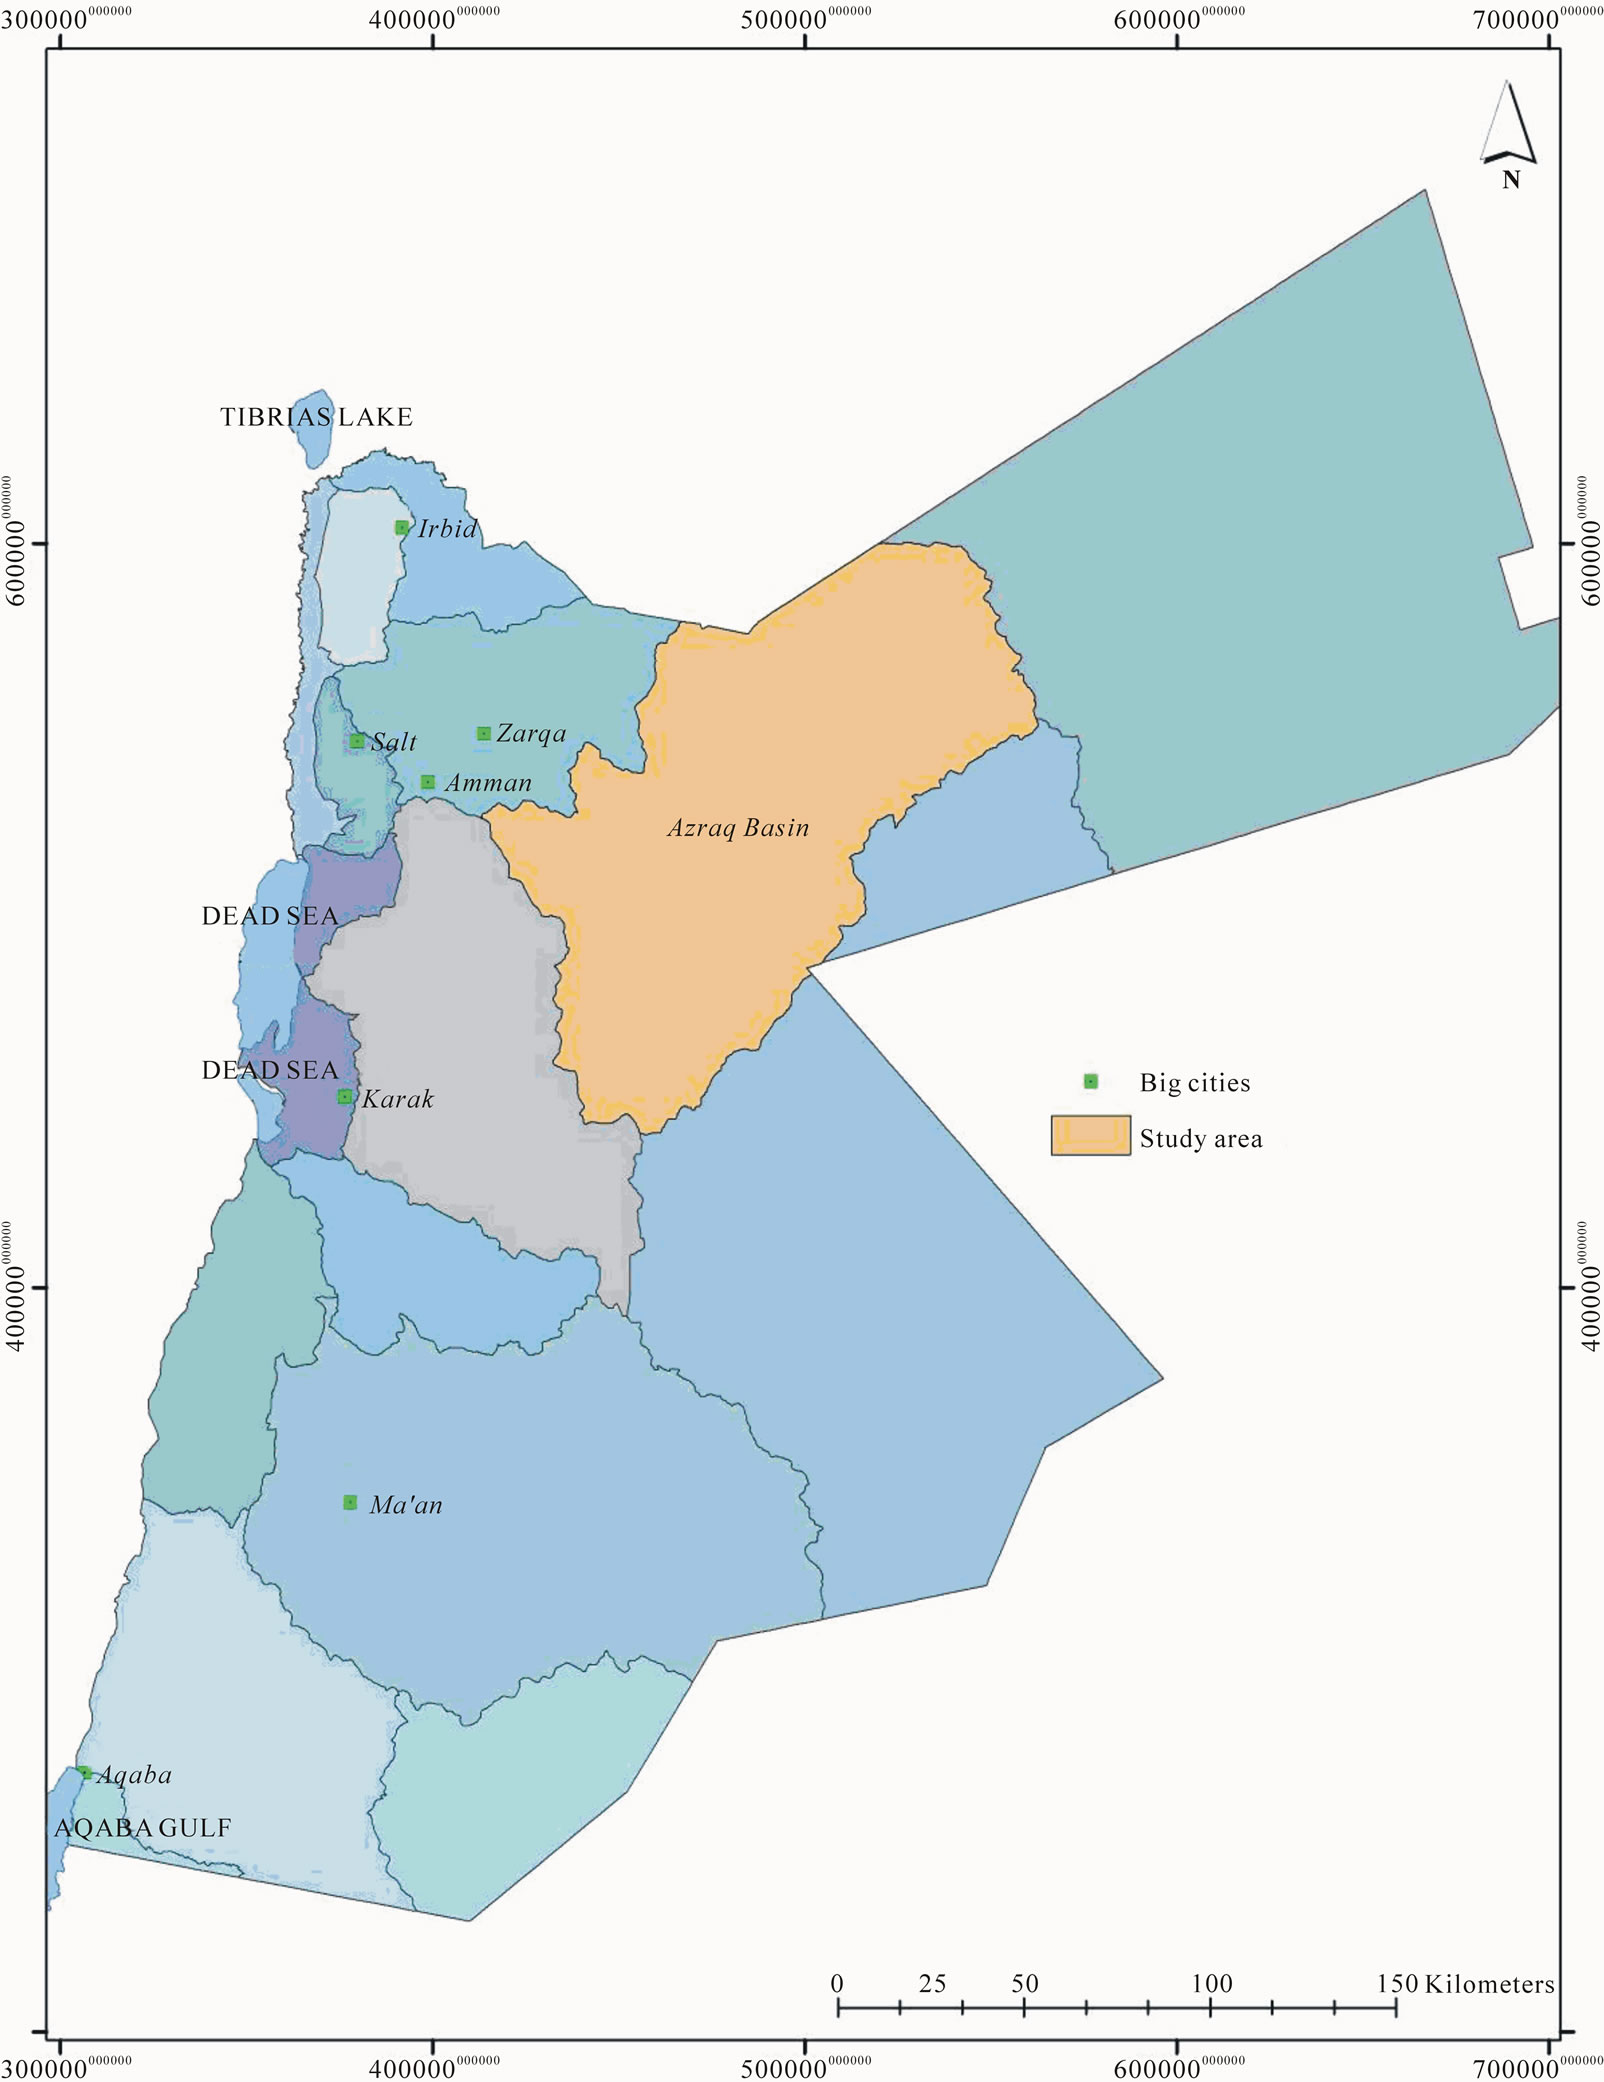
Figure 1. Location map of the study area (Coordinate system is Jordan Transverse Mercator JTM).
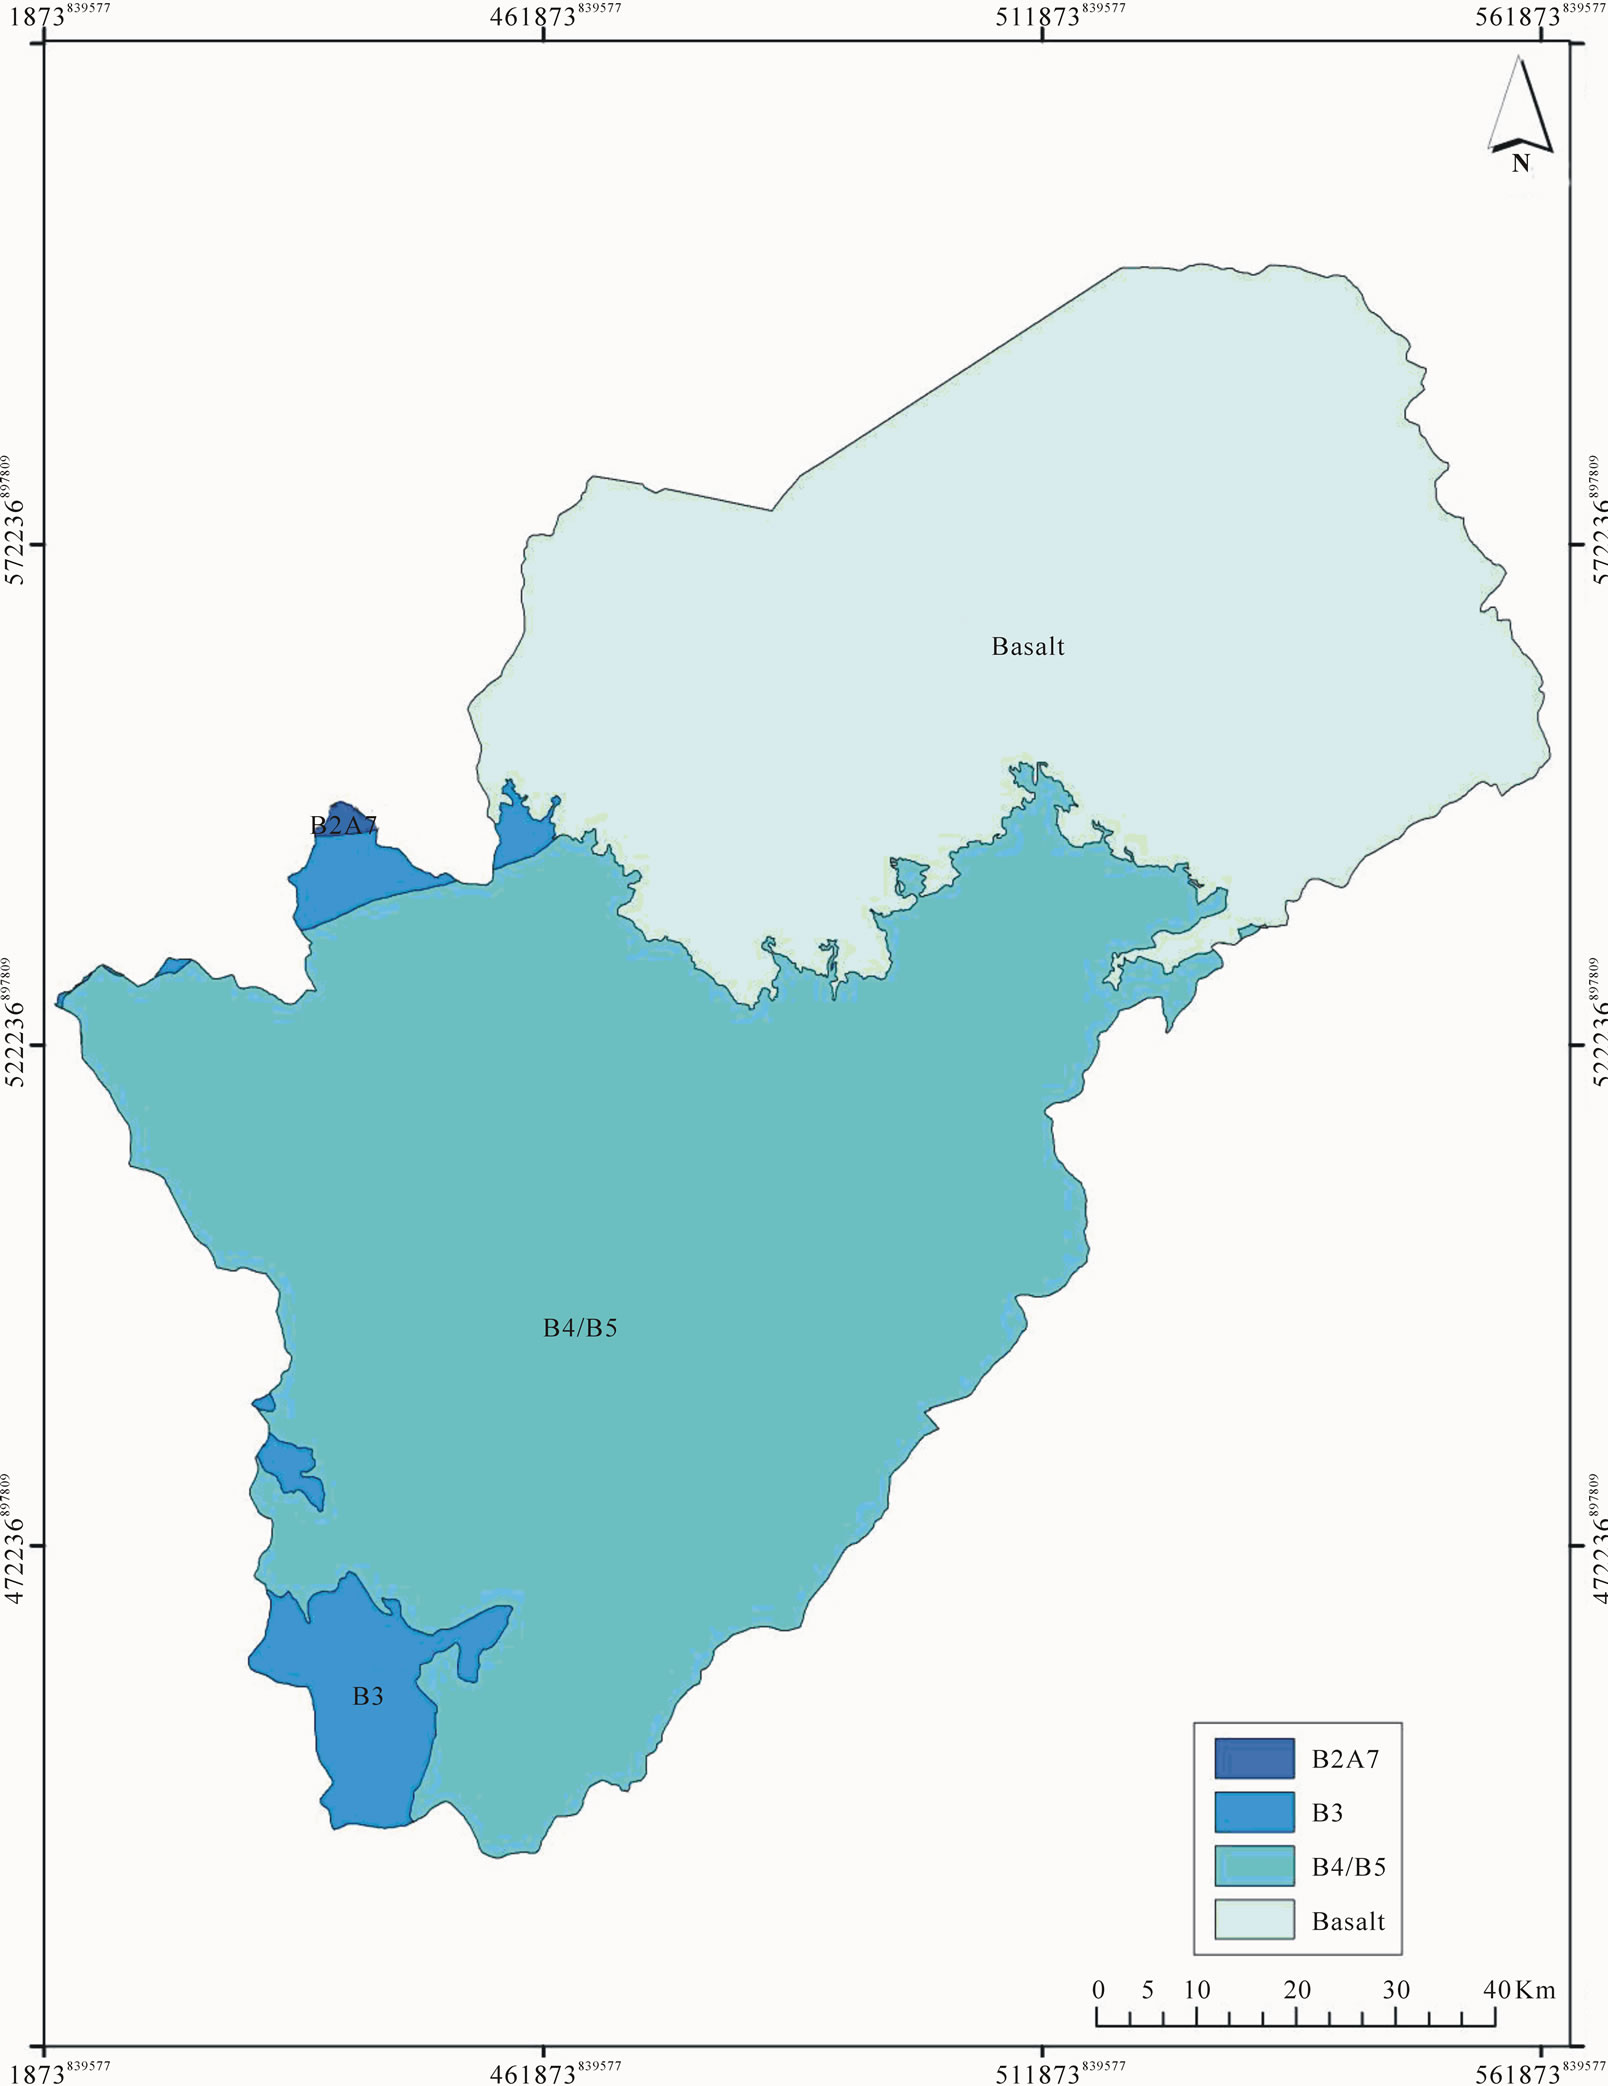
Figure 2. Hydrogeolocical units in Azraq basin.
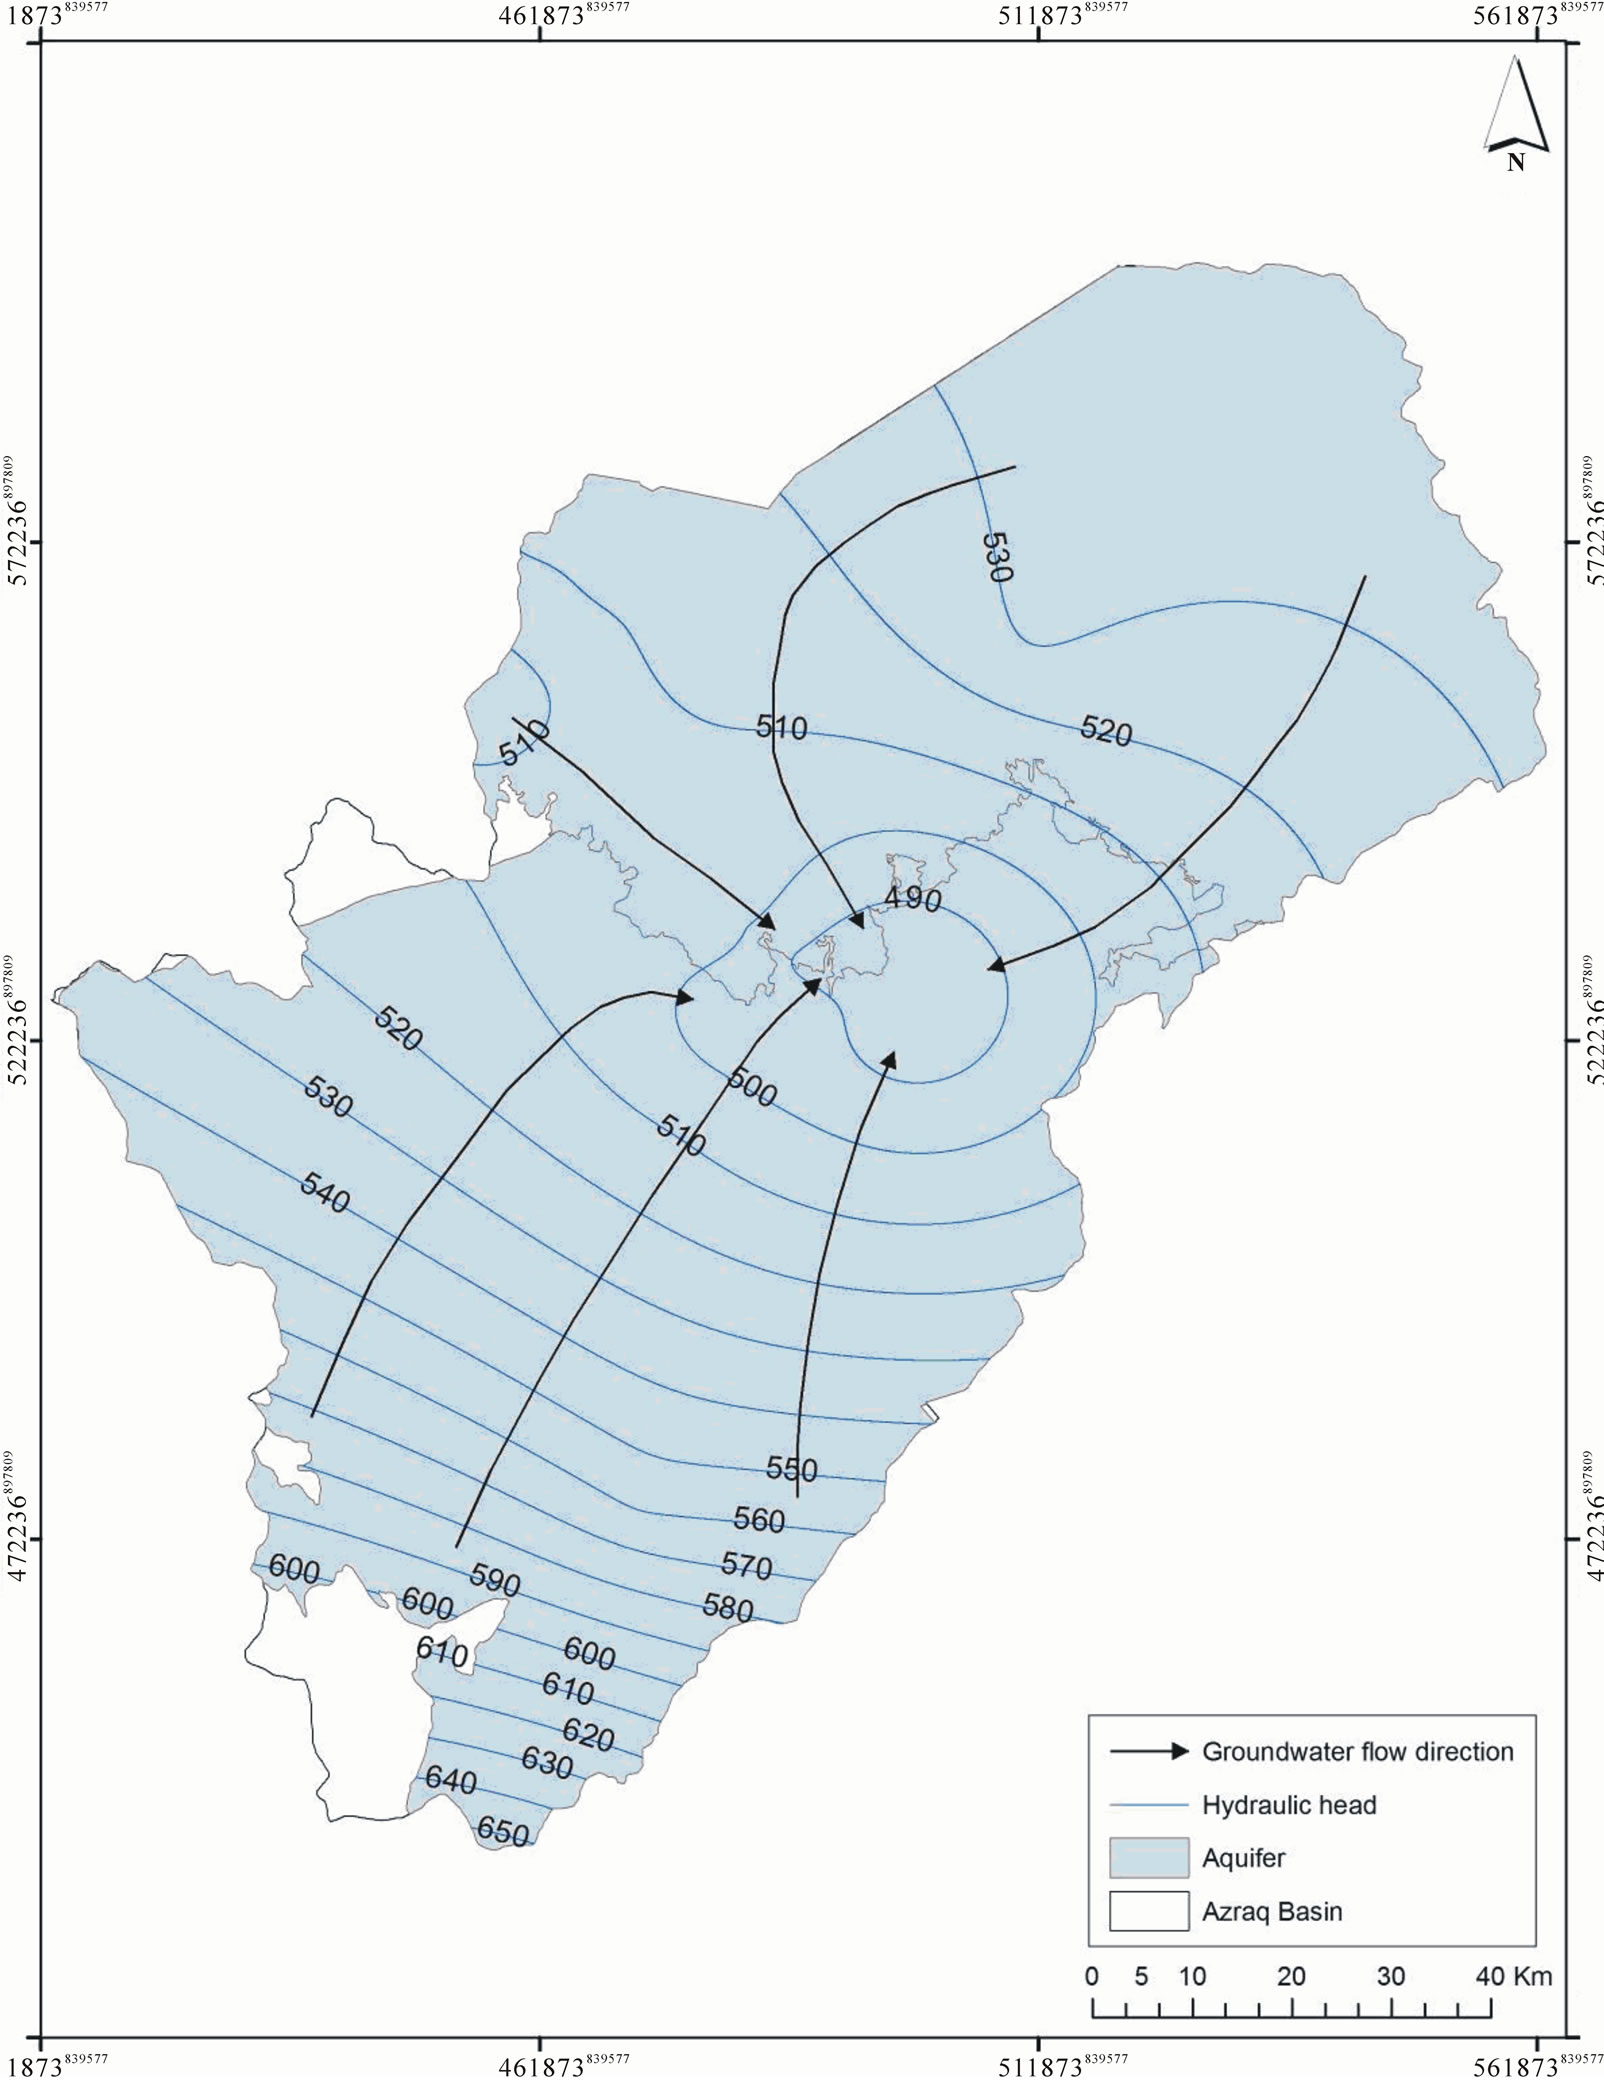
Figure 3. Groundwater flow system in Azraq basin shallow aquifer.
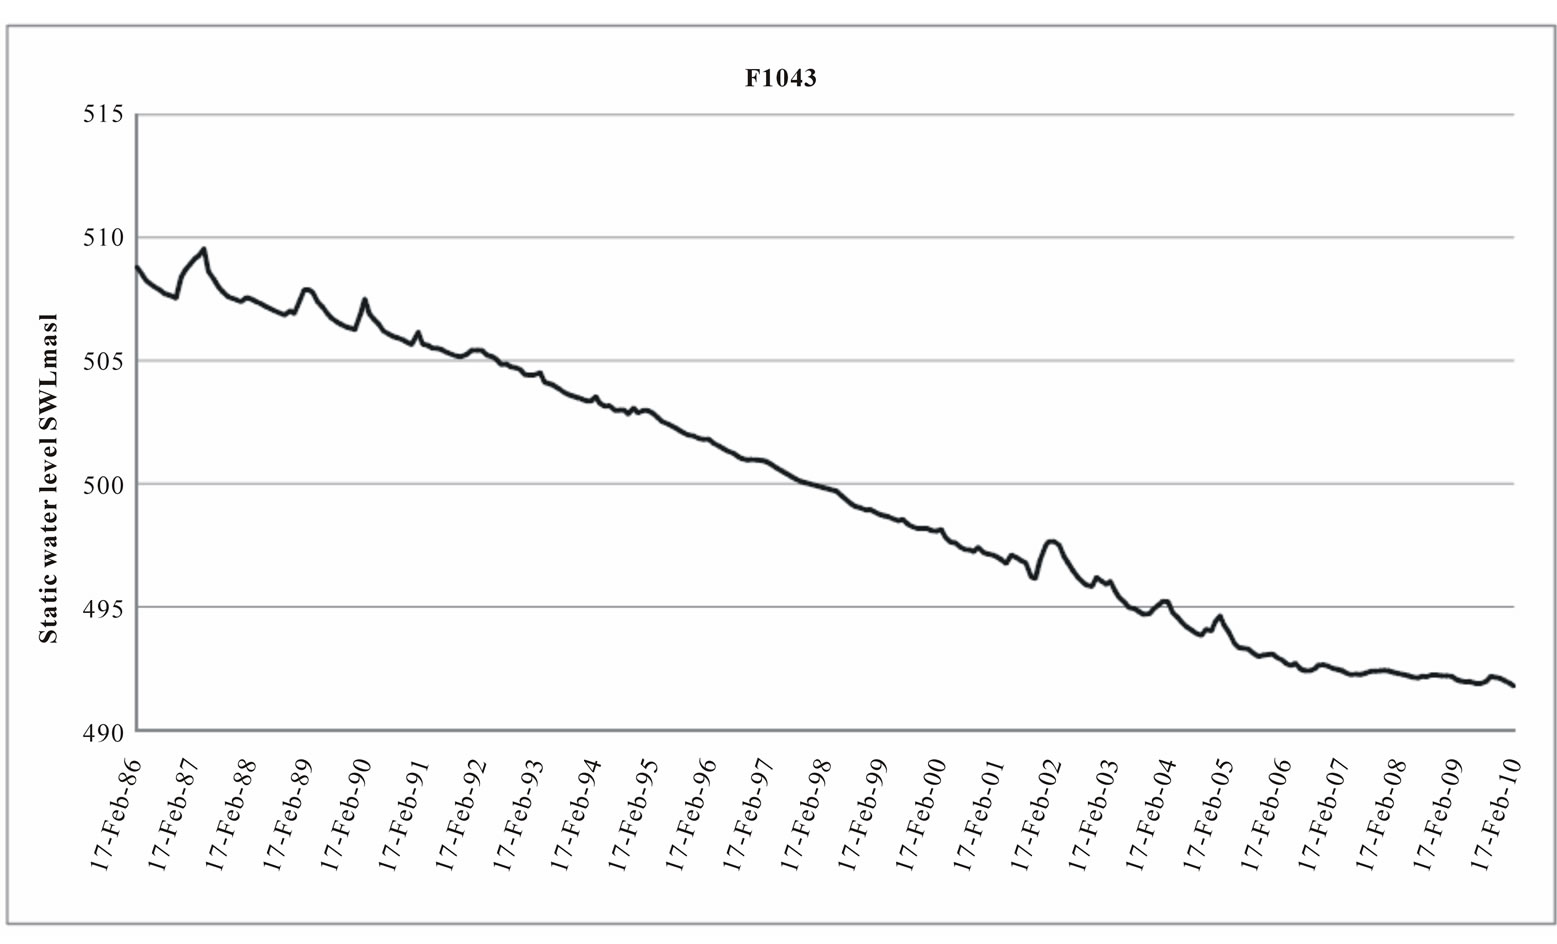
Figure 4. Monitoring well hydrograph.
which surface water is conducted to the underground water storage in unconfined aquifers.
The term MAR was introduced by Bouwer [2] to replace the previously used term Artificial Recharge and to describe the intended and controlled recharge [12].
The importance of MAR is identified as being able to:
1) Increase the amount of stored groundwater and to recover the over-exploited groundwater.
2) Improve the quality of groundwater.
3) Limit the salt water intrusion in local area and prevent any subsidence that may be caused by over pumping [12].
4) Reduce loss of fresh surface water due to evaporation.
5) Reduce soil erosion and storm runoff [4].
According to Gale 2005 the water sources suitable for MAR are:
6) Perennial streams, rivers, canals.
7) Intermittent streams, wadi and flood flow water.
8) Treated and reclaimed water.
9) Desalinated water.
2.2. Detailed MAR Mapping in the Area
In order to evaluate MAR potential for the aquifer in a detailed scale within the study area, four thematic layers were developed and processed in a GIS environment:
1) Hydrogeological classification.
2) Slope classification.
3) Urban areas.
4) Proximity to water sources.
2.2.1. Hydrogeological Classification
The basic parameter for MAR evaluation is the hydrogological classification which controls the presence or absence of the groundwater to be recharged.
The major distribution of the hydrogological units in Jordan by Hobler and Subah [6] was modified according to the Natural Resources Authority 1:50000 geological maps and used to evaluate the primary potentiality.
The study area was subdivided into two main hydrogological layers, namely;
1) Aquifer unit: composed of B4/B5 and basalt aquifer.
2) Aquitard unit: composed of the B3 aquitard.
Mainly aquifer outcrops are suitable for MAR. When the aquifer is covered by superficial alluvials, which enhance MAR potential through their high permeability they allow water to infiltrate directly to the aquifer without being stored in the soil thereby being exposed to evaporation conditions.
Geological maps of Jordan 1:50000 (published by the Natural Resources Authority) were used to extract the distribution of superficial alluvials. Figure 5 shows the general procedure used in preparing the hydrogeological
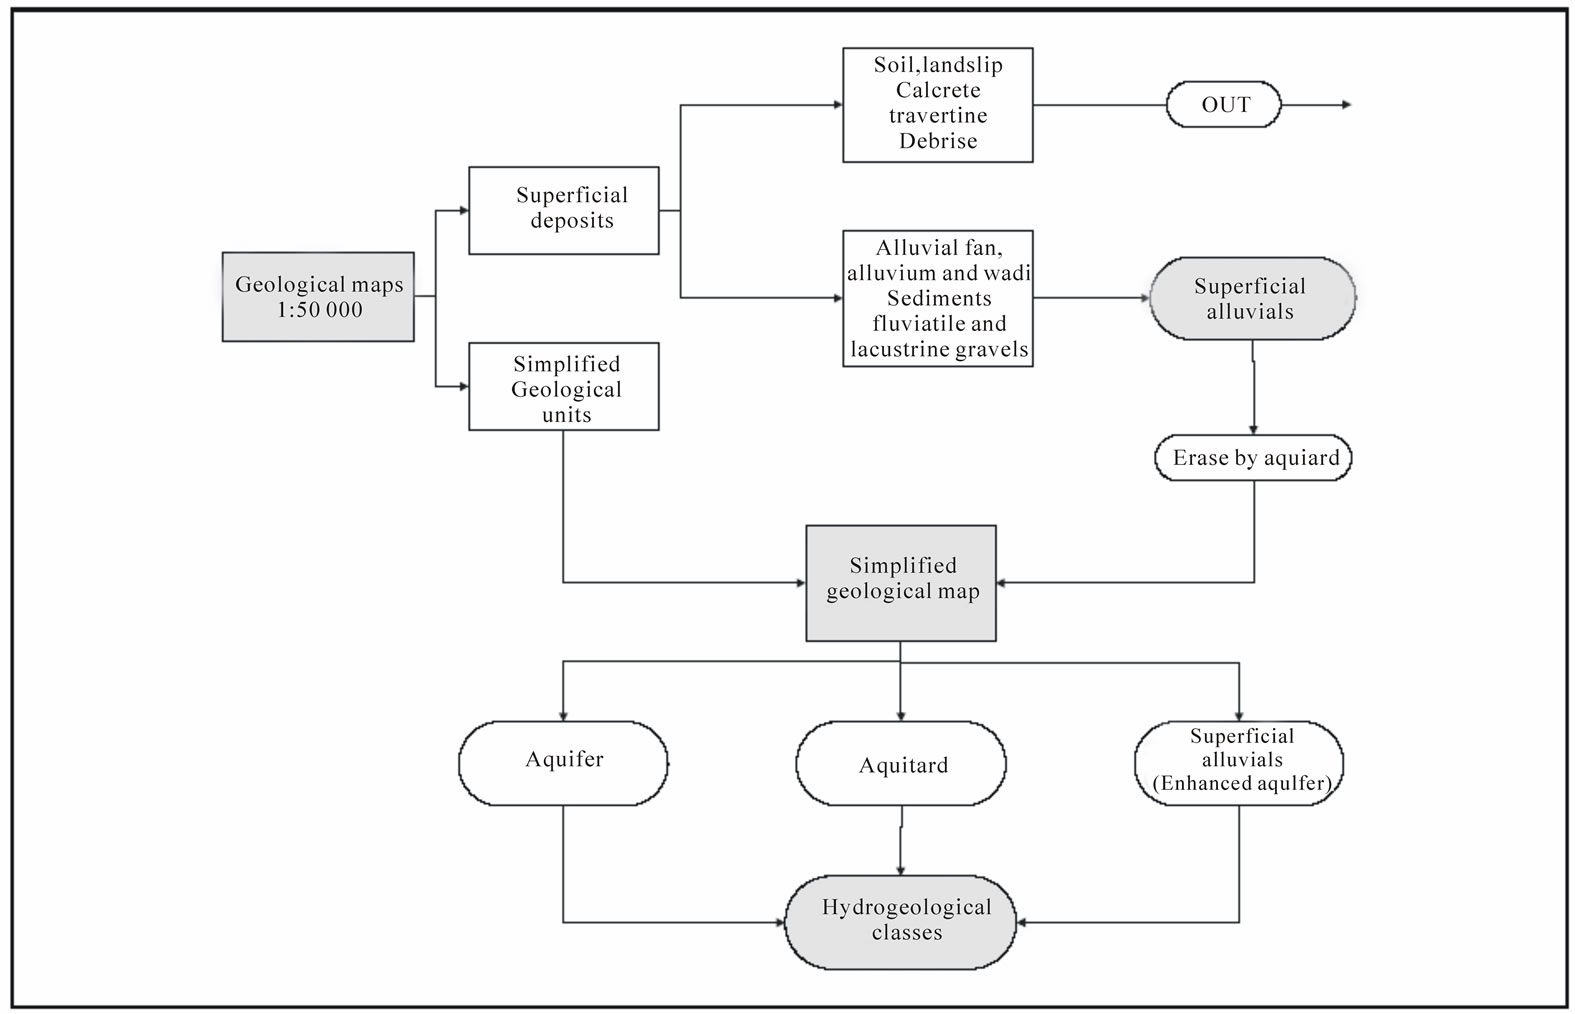
Figure 5. General procedure used in preparing the hydrogeological classification layer (modified after Rapp 2008).
classification layer which is shown in Figure 6.
2.2.2. Slope Classification
Topography plays a major role in MAR through the slope which determines the residence time of surface water over a specified area.
According to Rapp [12] the most effective slope for MAR is 0 – 5 % under which proper infiltration process can take place without any enhancement for the run off.
In reference to slopes the area was subdivided into two slope classes:
1) Slope 0 – 5%: suitable for MAR.
2) Slope > 5%: unsuitable for MAR.
2.2.3. Urban Areas
Urban areas and small settlements distributed over the study area represent a limitation for MAR, because MAR requires an appropriate area and some construction works. Whereas other land use types, such as farms, do not restrict MAR construction.
In order to delineate urban areas, a thematic layer was prepared for the settlements distributed in the area for consideration through MAR evaluation. A buffer zone of 250 m was considered as a safe distance for these settlements. Recent Google Earth satellite imagery was used to delineate the distribution of urban areas.
2.2.4. Proximity to Water Sources
All surface water resources are considered to be valuable for MAR. In the study area all types of existing water resources were considered in the process of MAR mapping.
The water resources considered in this mapping are dam water and flood water along wadis. Rapp [12] suggested 5 km as an economical buffer for the transport of water via gravity through a natural or artificial canal or pipe line to MAR sites.
A 5 km linear buffer zone around water sources (dams) was created in a GIS environment. Areas higher than the water sources were erased in the GIS application due to the economic inefficiency of pumping water to a MAR site.
The drainage pattern was created in the GIS application using ArcHydro tool. A buffer zone of 250 m was selected (on each side) as an economic distance for MAR potentiality around the linear water sources.
All the water sources were combined in a single GIS layer shown in Figure 7.
3. Thematic Layers Combination
The procedure of thematic layers processing and combi
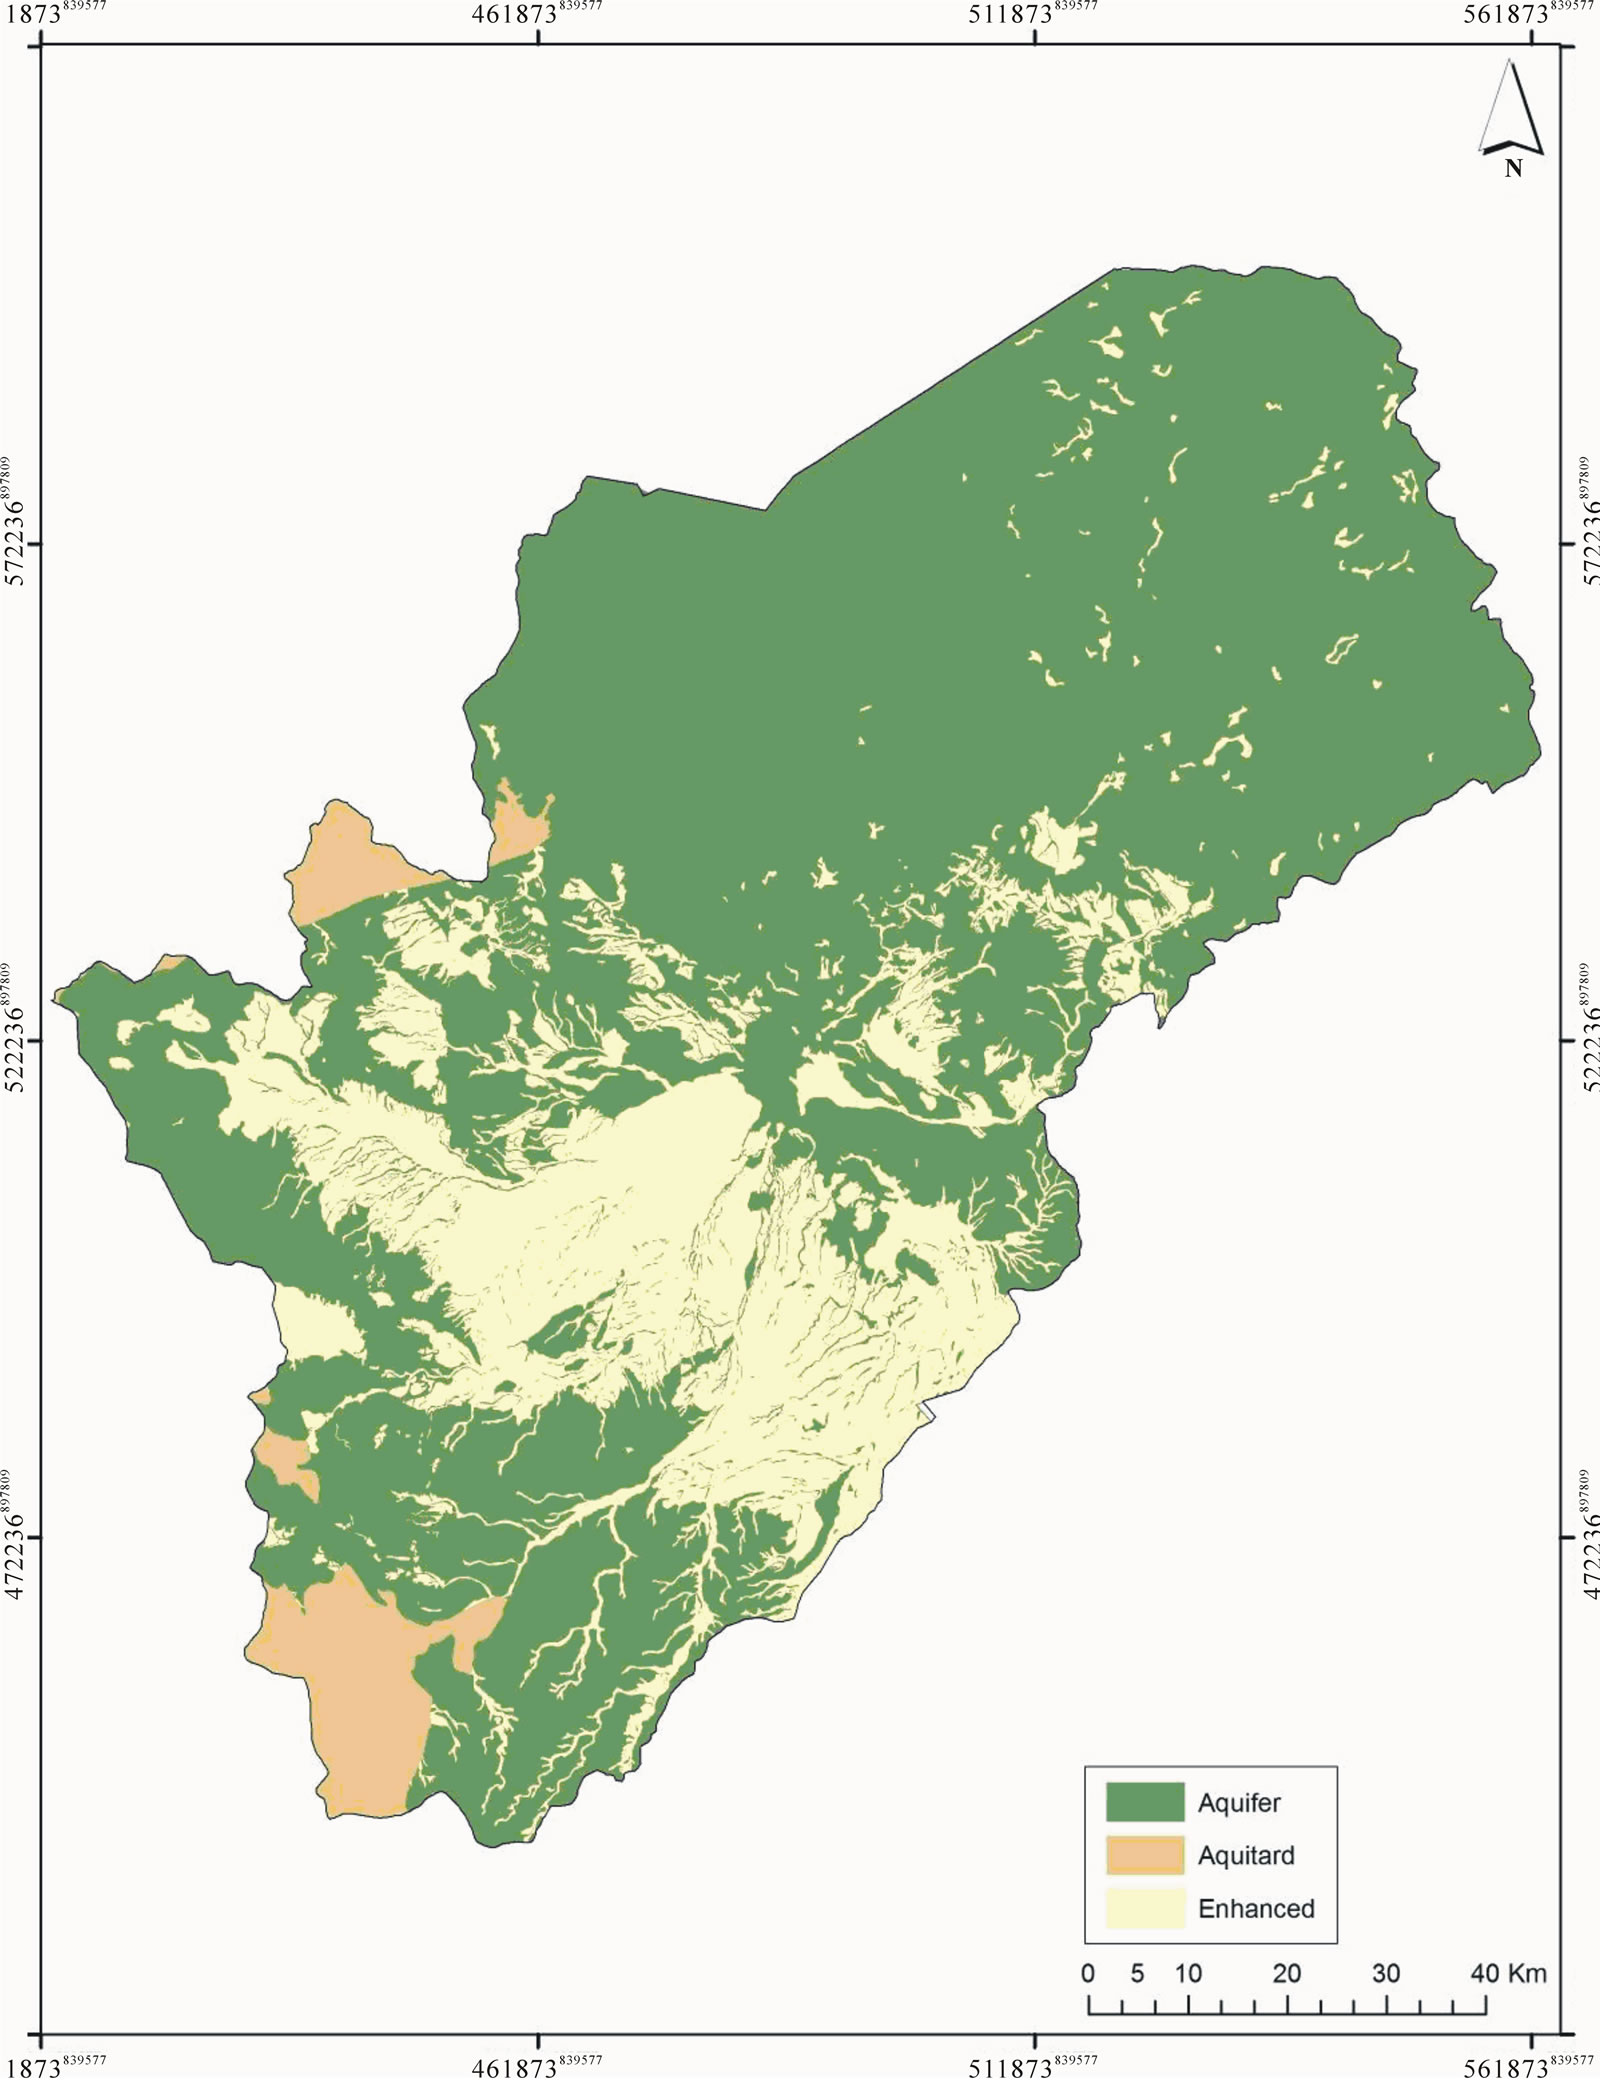
Figure 6. Hydrogeological classification.
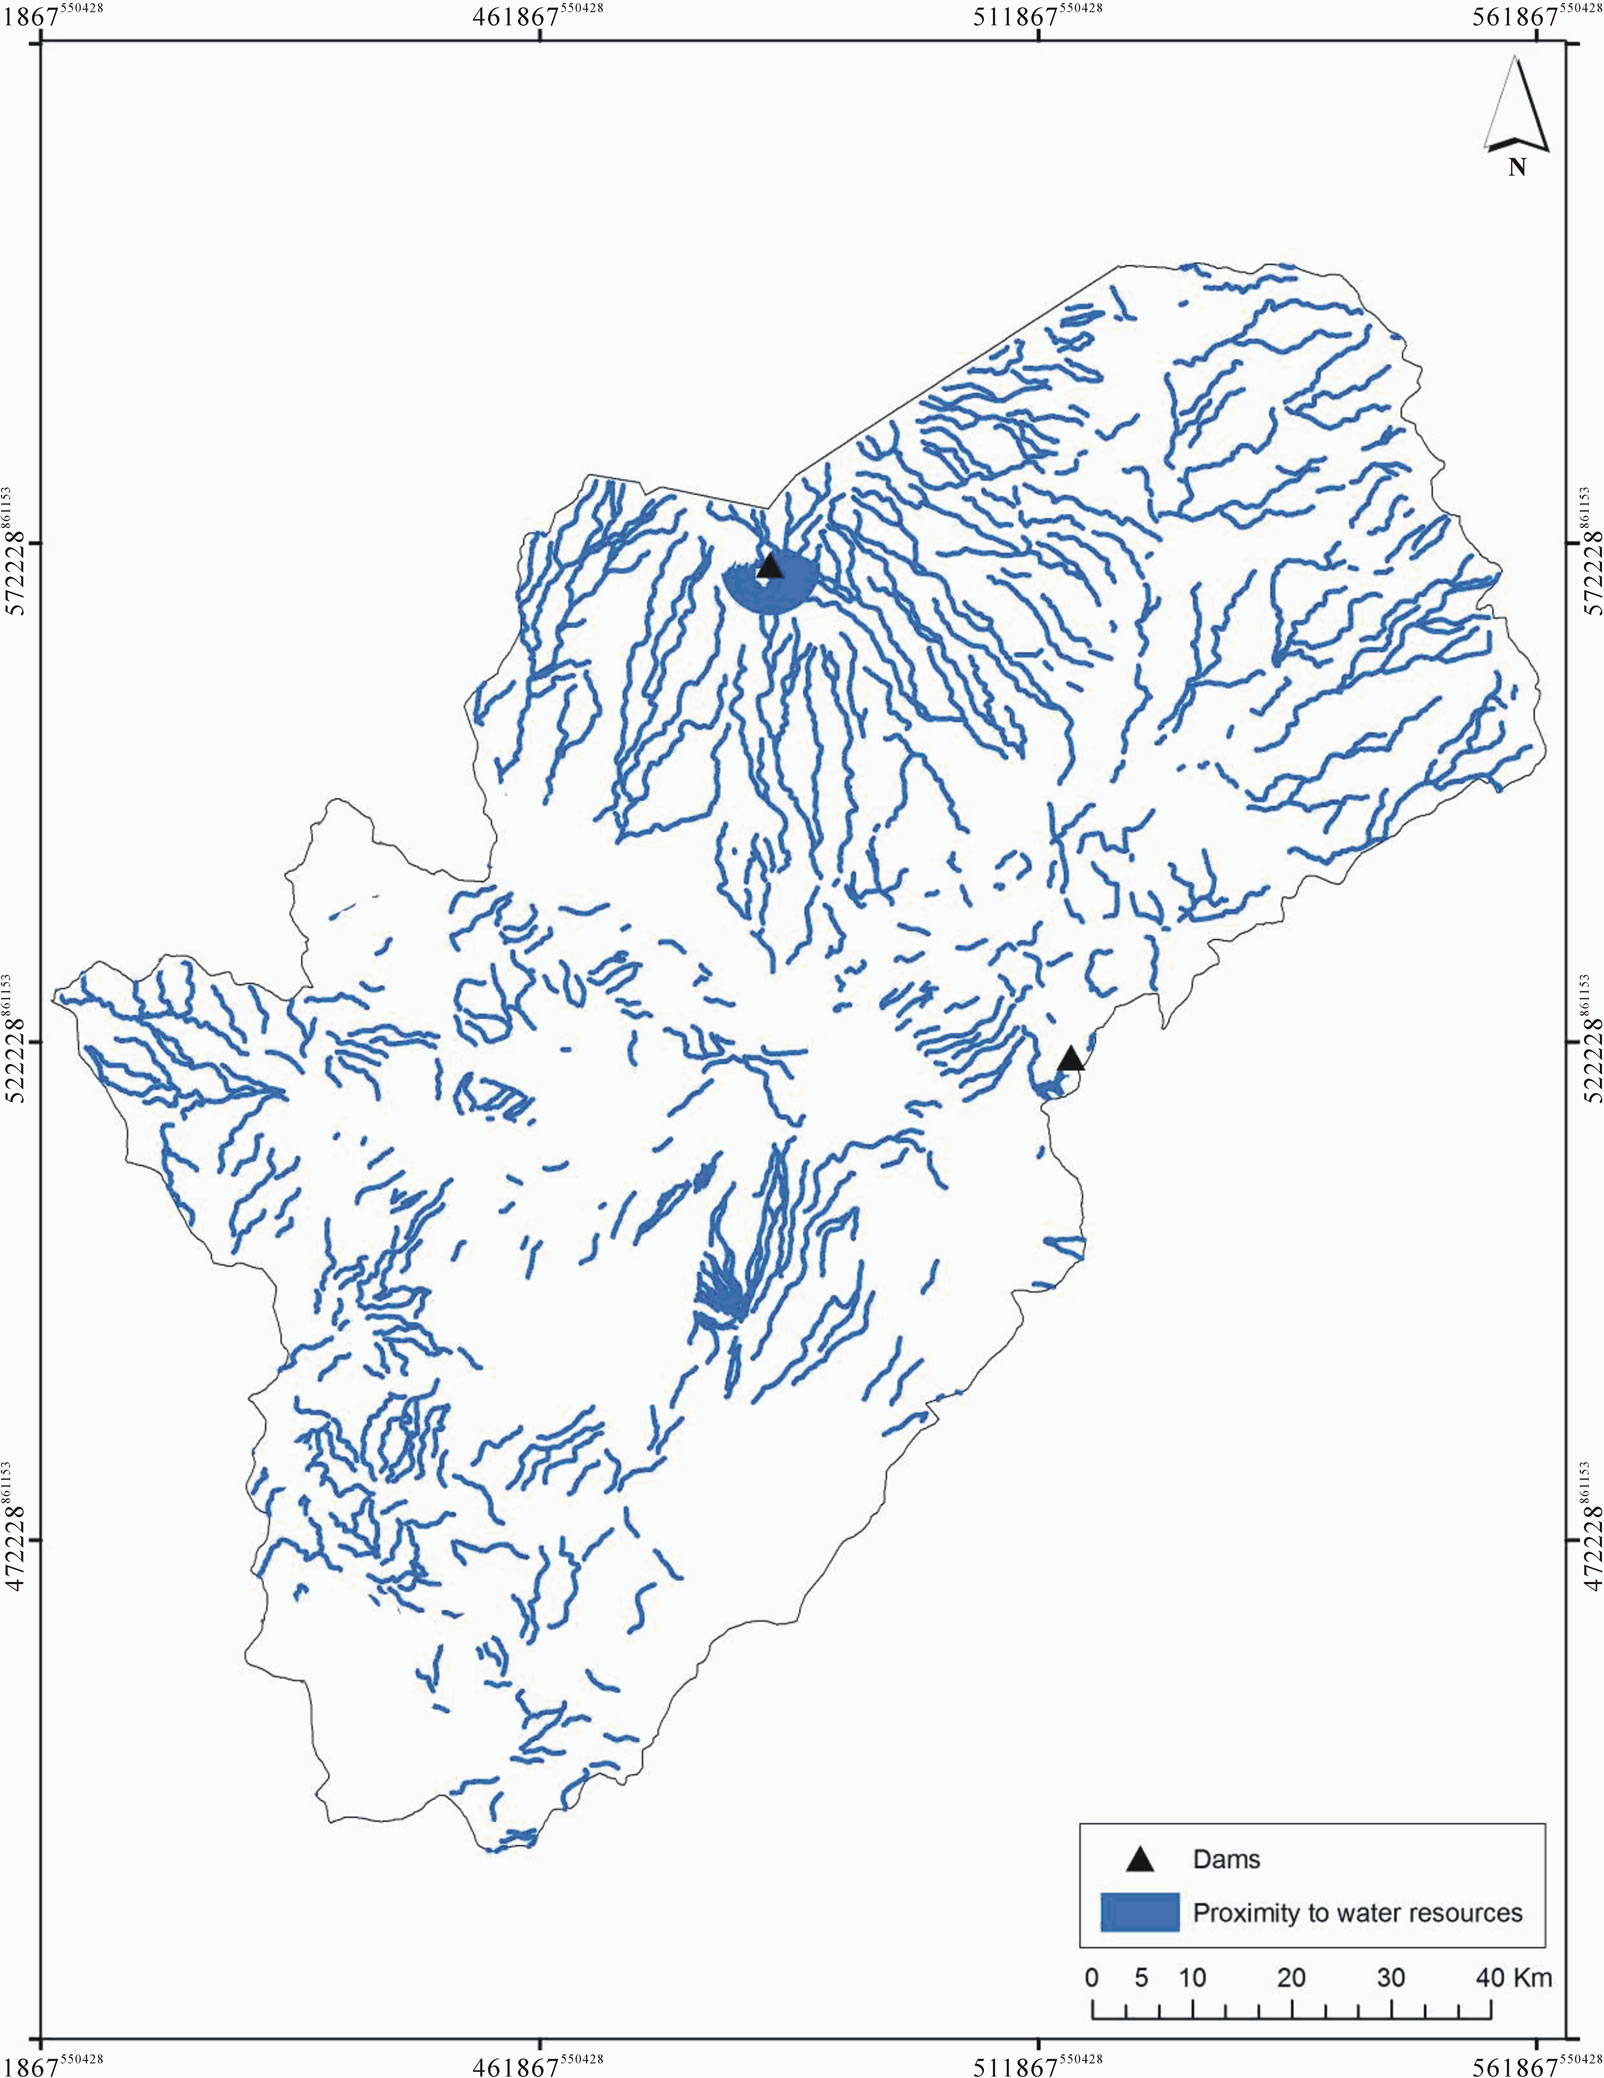
Figure 7. Proximity to water resources.
nation is shown in Figure 8, which details all the input data and the processes taken completely under GIS application through the powerful applications available in this software.
3.1. Combination of Hydrogeological Classes and Slope
The hydrogeological classification layer was combined with the slope. The resulting map is shown in Figure 9.
The combination of classified slope and hydrogeological classes gave 5 potential zones for MAR Table 1.
3.2. Combination of Hydrogeological-Slope Map with Proximity to Water Sources Layer
In order to supply MAR values the previous thematic map Figure 9 was combined with the proximity to water resources map.
The resulting map is shown in Figure 10, which represents the primary final MAR potential map for the shallow aquifer system in Azraq area. The combination of parameters and the resulting potential MAR are given in Table 2.
3.3. Urban Areas
As mentioned previously, urban areas represent a limitation factor for the construction of MAR structures, so they should be neglected as potential MAR locations. A layer of urban areas with a buffer of 250m around the main settlements was added to the primary MAR map. The final MAR map is shown in Figure 11, and the statistics of potential MAR areas are given in Table 3.
3.4. Fault Zones
The structural contour maps which were compiled by BGR and WAJ [1] indicate that the structural setting for the shallow aquifer is governed by a major fault system

Table 1. Combination of classified slope and hydrogeological classes.
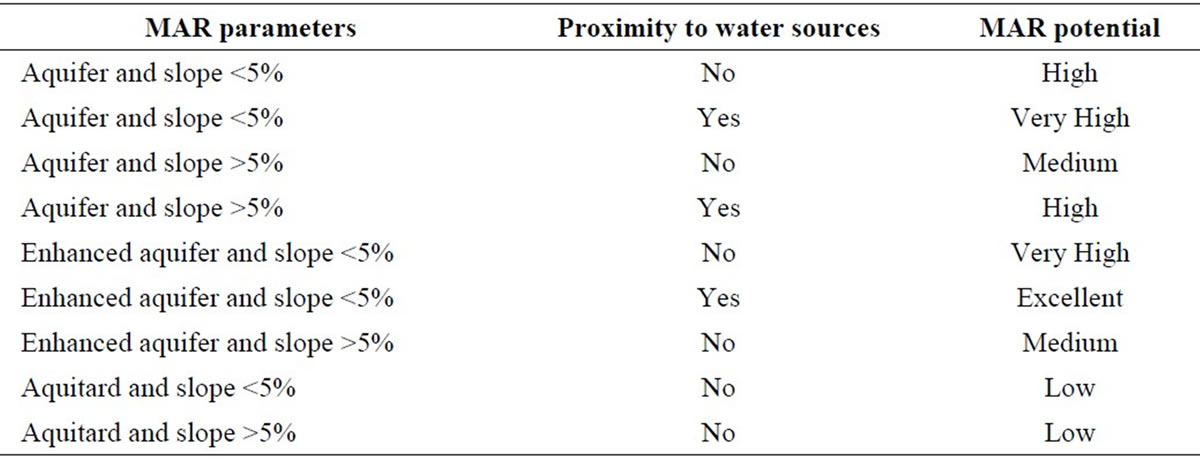
Table 2. Parameters combination and the resulting potential zones.

Table 3. Statistics of potential areas is given in.
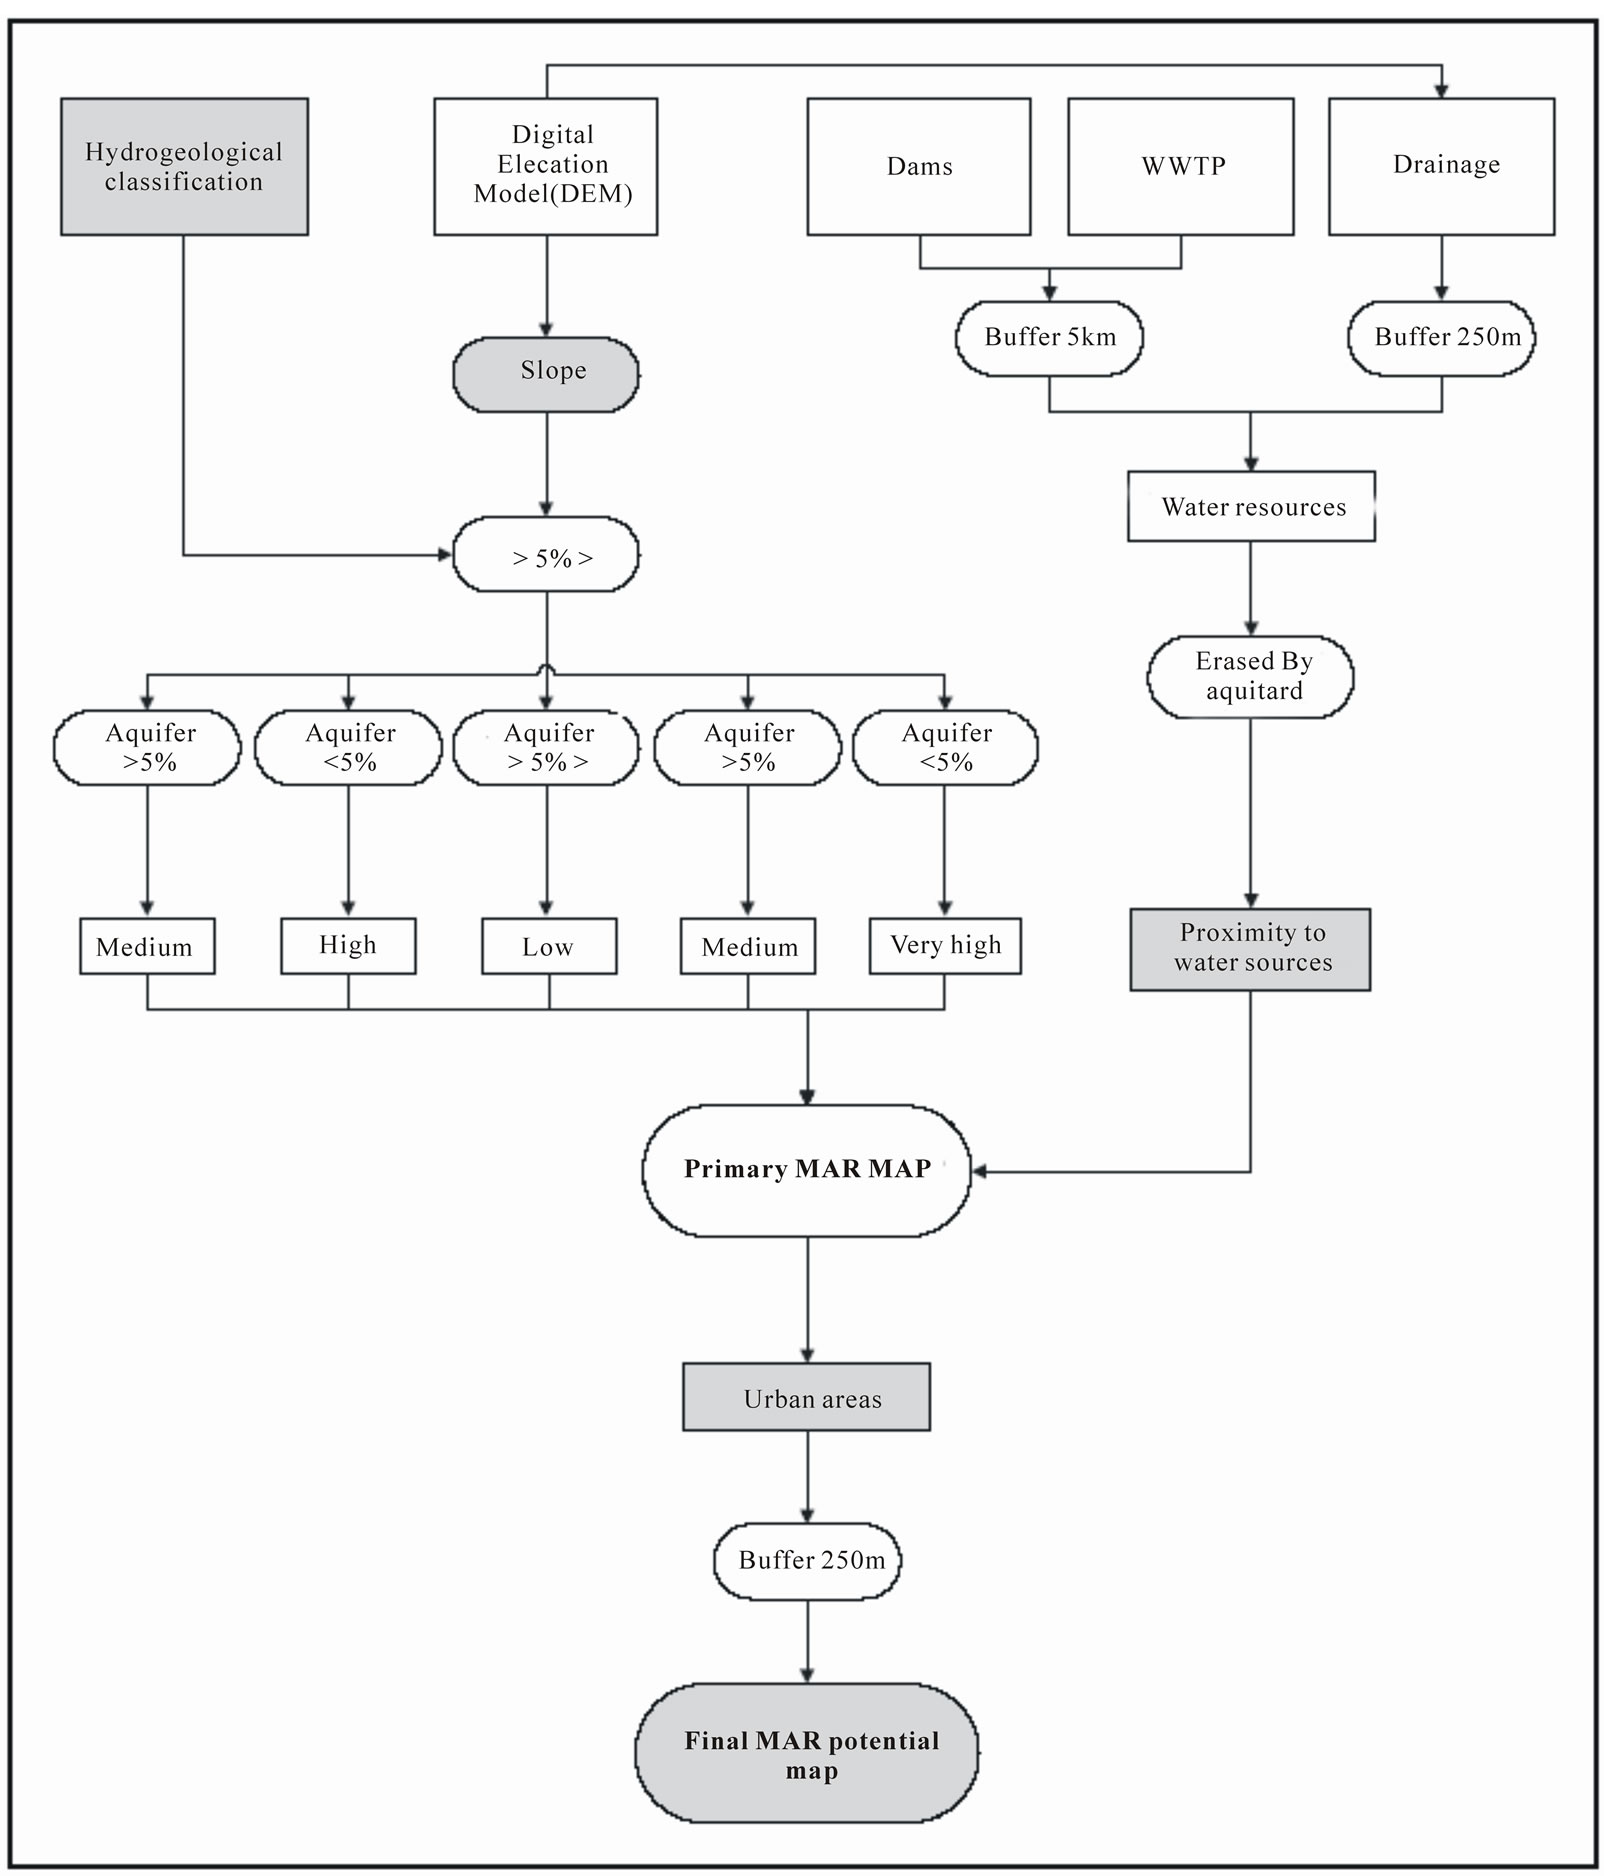
Figure 8. Thematic layers processing and combination (modified after Rapp 2008).
striking NW-SE in the form of three major faults combined with another fault system trending SW-NE.
This fault system shows a vertical displacement of up to 100m [1].
The weakness zone along these fault systems may enhance the vertical hydraulic conductivity giving more suitability of MAR projects in the areas with high MAR potential.
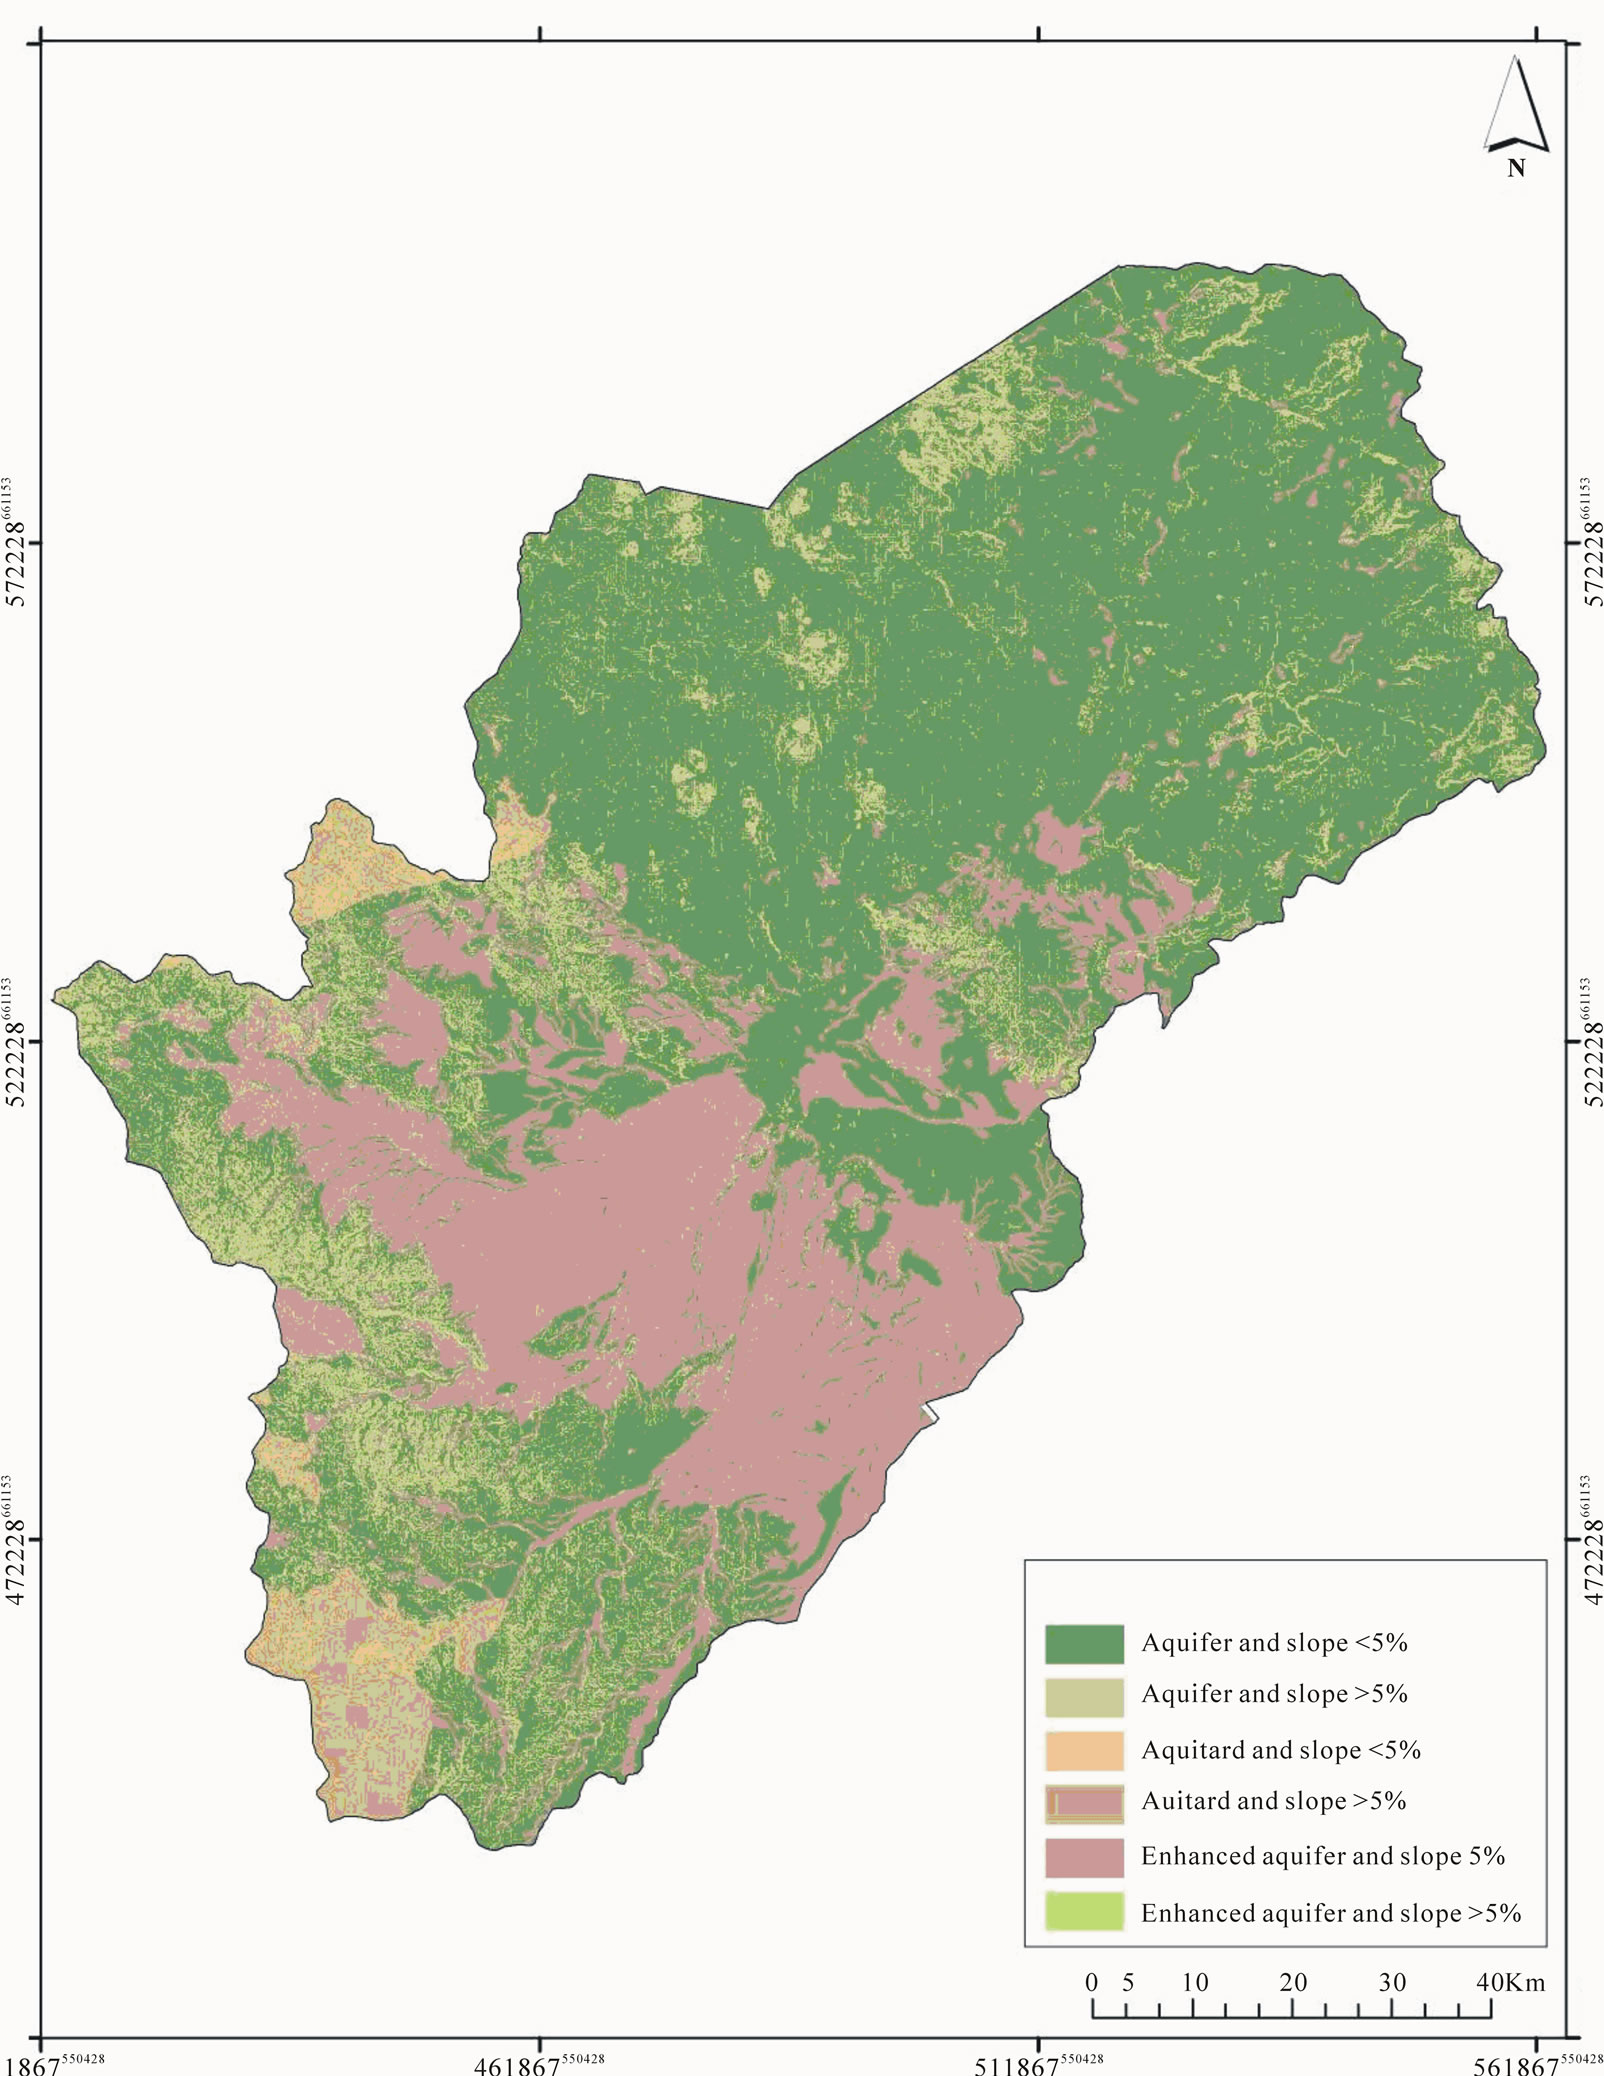
Figure 9. Combination of slope and hydrogeological classification.
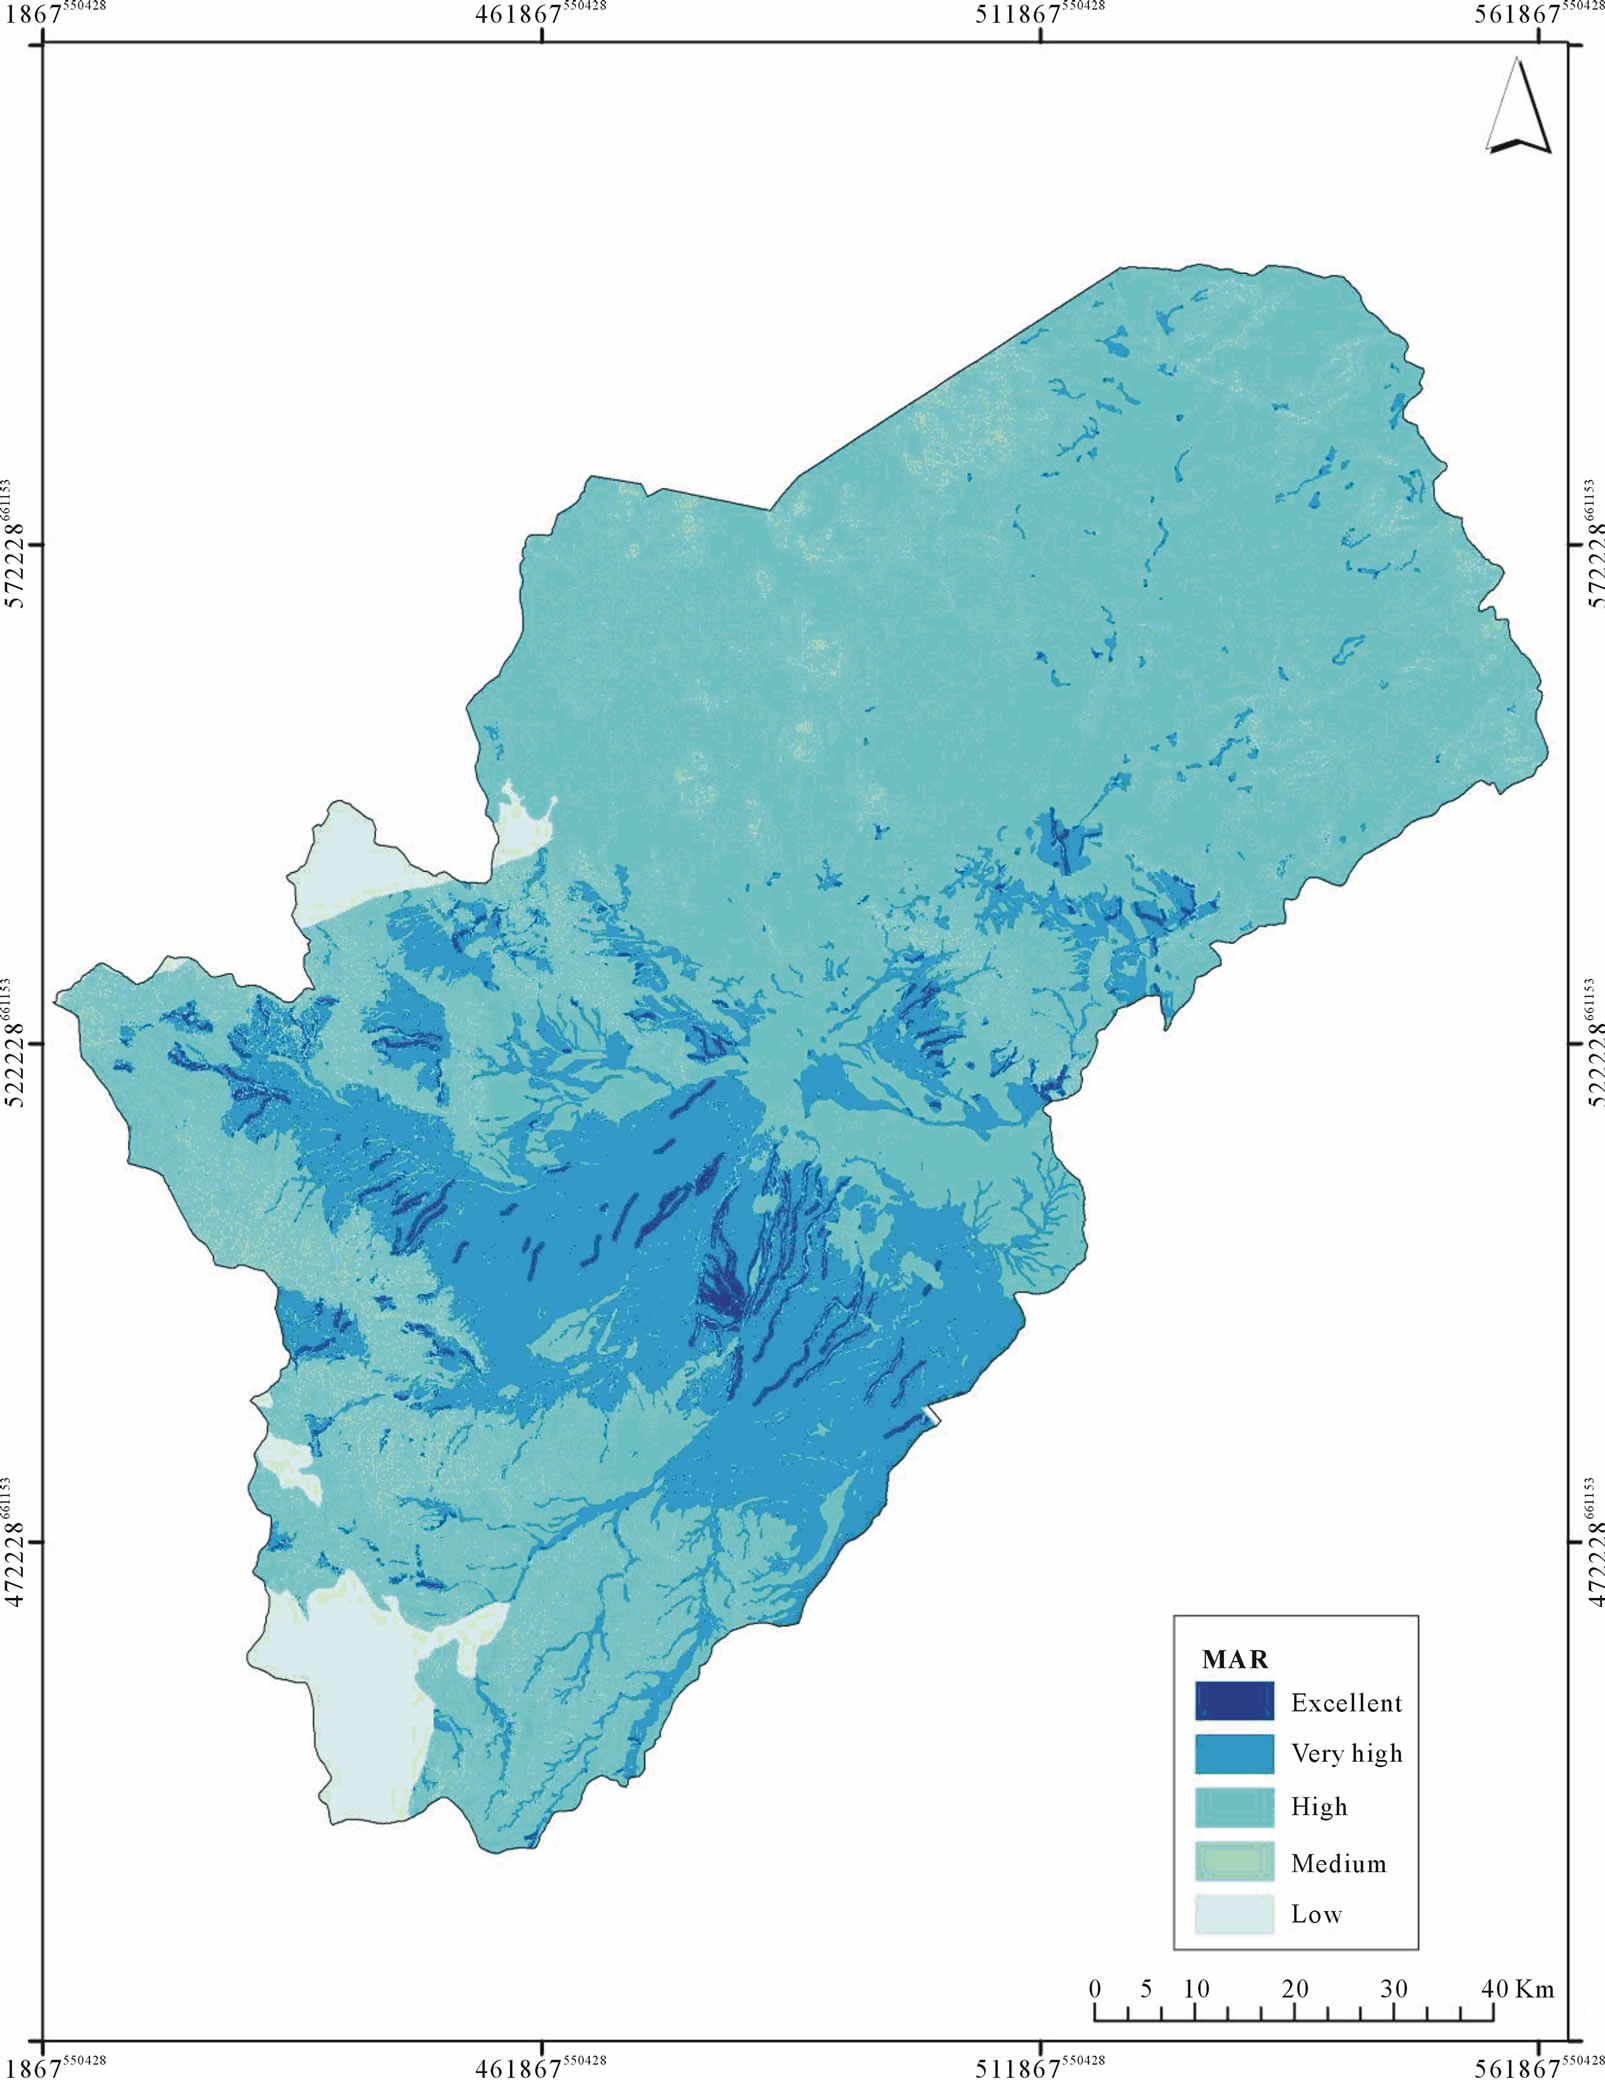
Figure 10. MAR potentiality map.
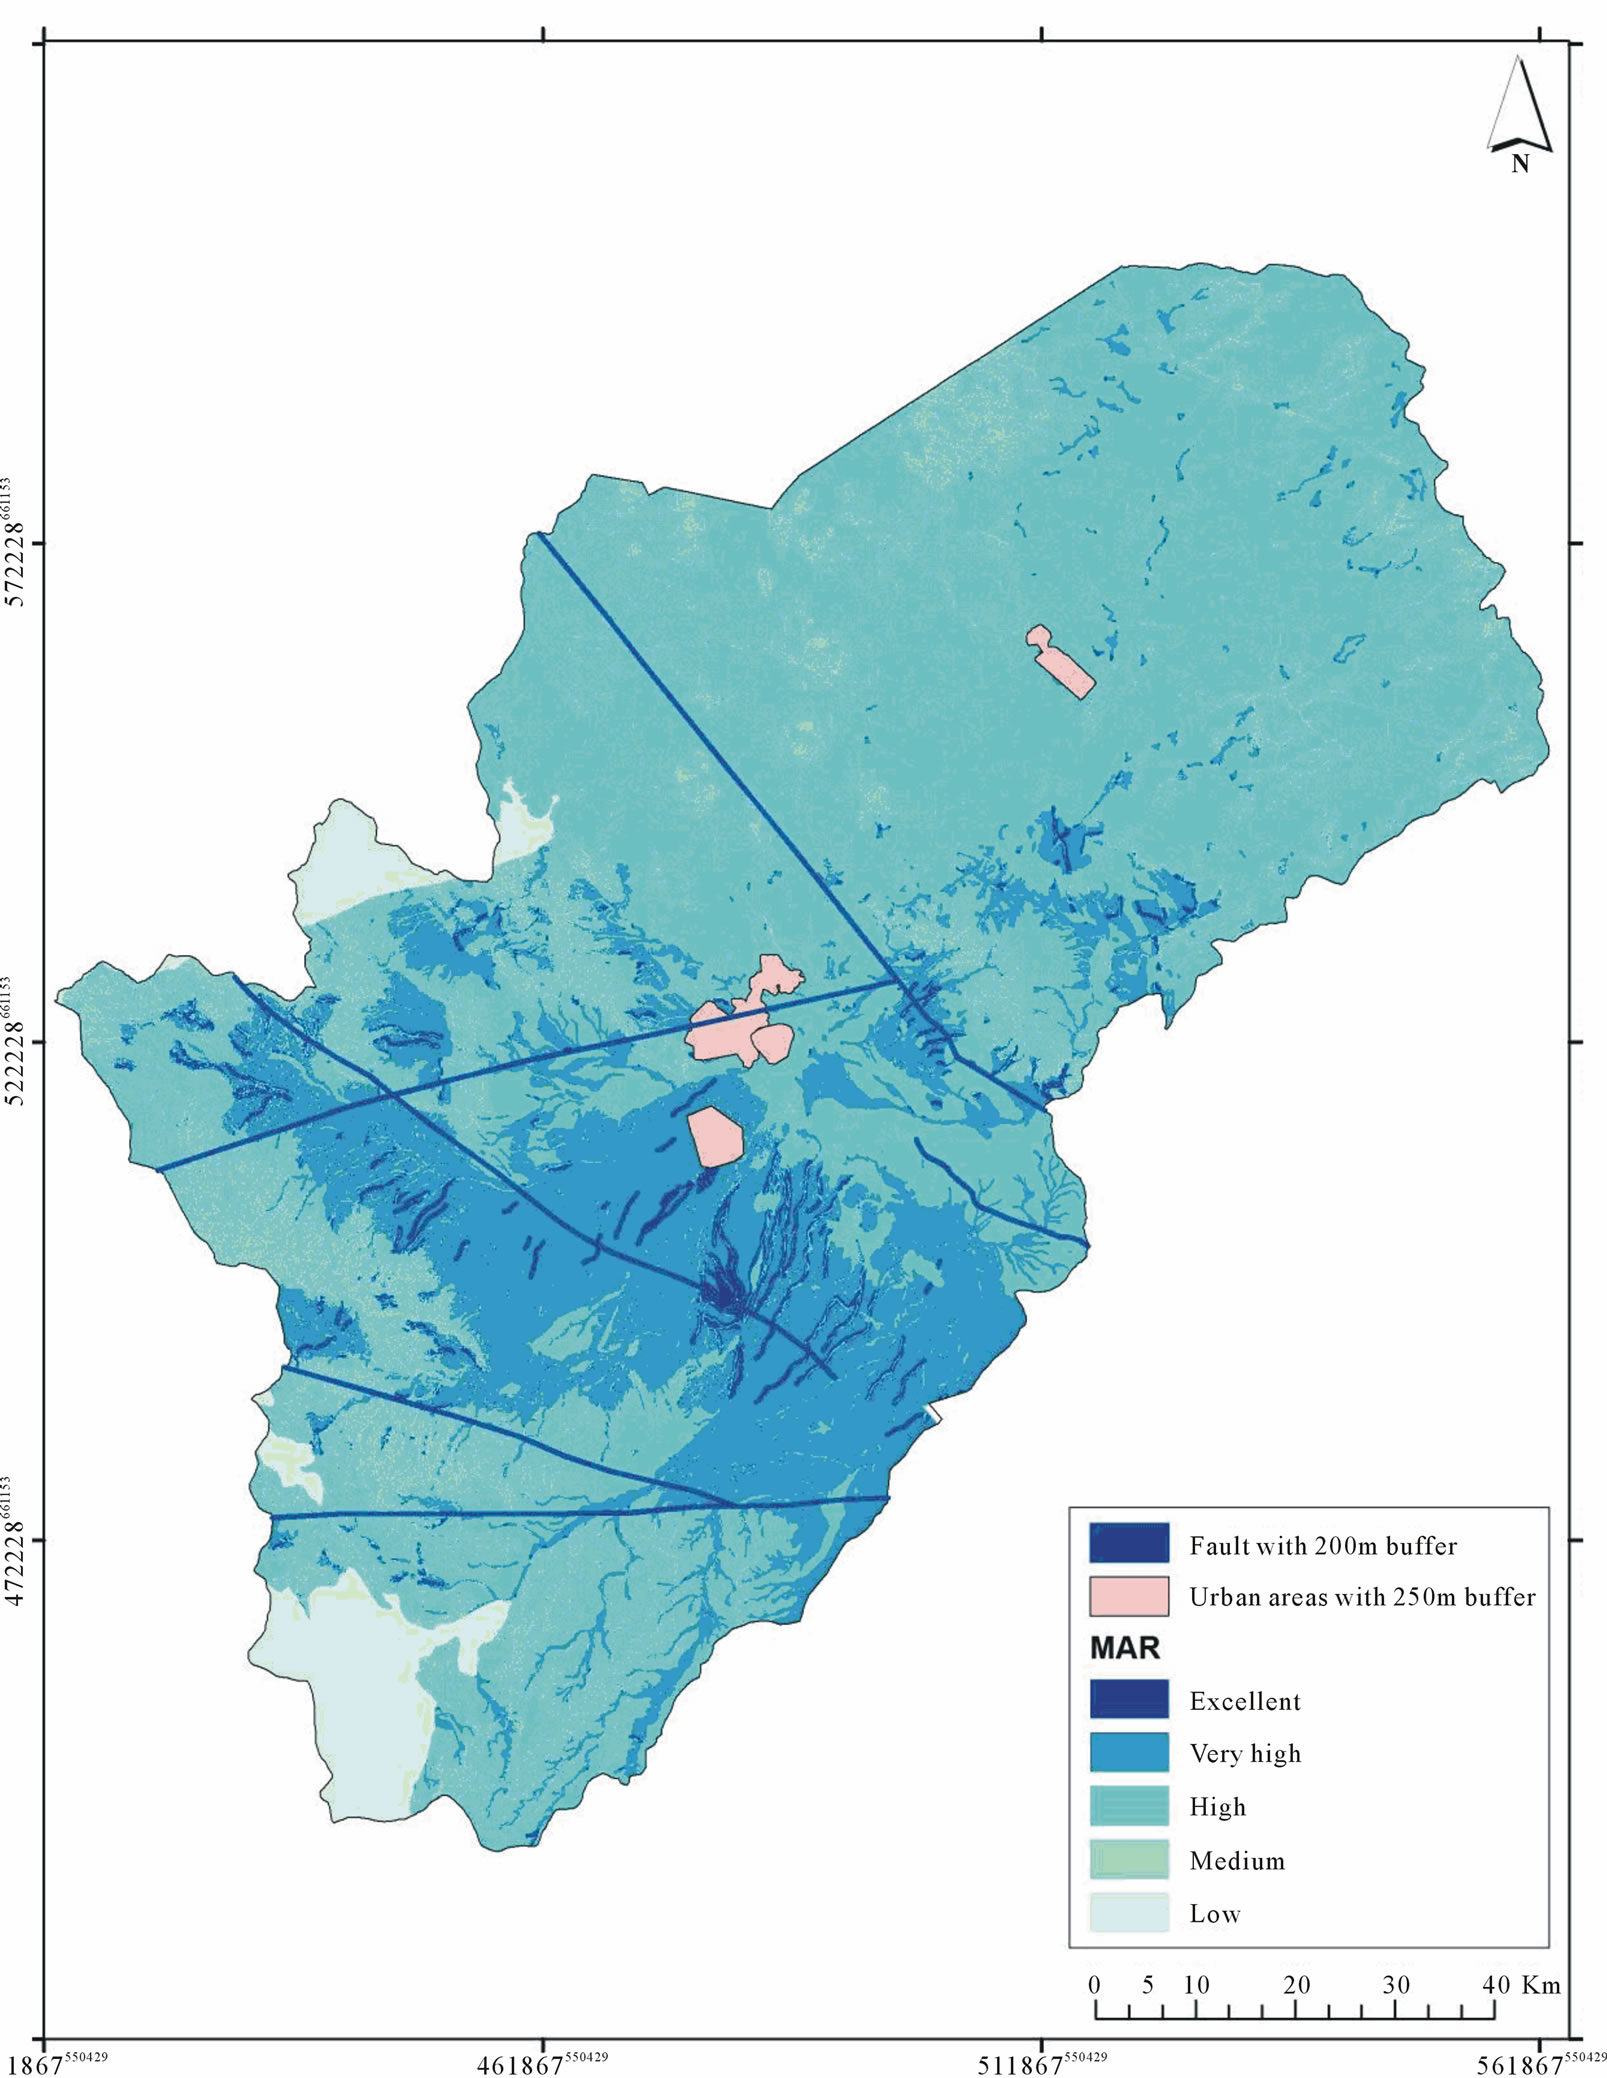
Figure 11. MAR potentiality combined by urban areas and fault system.
Figure 11 shows the major fault system in the basin which must be taken into consideration in any MAR planning.
4. Conclusions
The drafted situation of the groundwater resources in the Azraq basin requires the adaptation of IWRM. MAR mapping using a GIS environment showed that more than 20% of the total basin area possess very high potential to MAR, due to the presence of superficial deposits, low slope, aquifer conditions and proximity to water resources. High potential zones formed more than 61% of the total area. It is concentrated in the central parts of the Azraq basin where the depth to water is very low, therefore enhancing the MAR processes.
Low MAR potentiality areas formed 4.03% of the total Azraq basin area. This part was found to be restricted to the high slope areas and absences of aquifer rocks. It is mainly located in the western parts of the basin where the depth to the groundwater is very high and therefore MAR processes cannot be applied.
REFERENCES
- BGR and WAJ, “Groundwater Resources of Northern Jordan, Vol. 3 - Structural Features of the Main Hydrogeological Units in Northern Jordan, Water Authority of Jordan (WAJ) and Federal Institute for Geosciences and Natural Resources (BGR),” BGR-Archive, Vol. 57, No. 118702, 1994, p. 30.
- Bouwer, “Artificial Recharge of Groundwater: Hydrogeology and Engineering,” Hydrogeology Journal, Vol. 10, No. 1, 2002, pp. 121-142.
- ESRI-Environmental systems research institute: ArcView GIS version 9.1. A Computer Software to Visualize, Explore, Query and Analyze Data Spatially, USA, 2006.
- Gale, “Strategies for Managed Aquifer Recharge (MAR) in Semi-Arid Areas,” UNESCO’s International Hydrological Programme (IHP), 2005.
- GTZ and NRA, “National Water Master Plan of Jordan. Agrar-und Hydrtechnik GMBH ESSE,” Bundersanstalt fur Geowissenschaeien und Rohstoffe, Hannover, 1977.
- Hobler and Subah, “Groundwater Resources of Northern Jordan. - Vol. 4: Hydrogeological features of Northern Jordan. -Unpublished Report, prepared by the Federal Institute for Geoscience and Natural Resources (BGR) and Water Authority of Jordan (WAJ),” Technical Cooperation Project ‘Groundwater Resources of Northern Jordan’, BGRarchive, No. 118704, Amman, Hannover, 2001.
- Jasem and Alraggad, “GIS Modeling of the Effects of Climatic Changes on the Groundwater Recharge in the Central Western Parts of Jordan,” Jordan of Civil Engineering, Vol. 3, No. 5, 2009.
- JMD-Jordanian Meteorological Department JMD open files, Jordan, 2009.
- MWI-Ministry of Water and Irrigation, Water Information System. Hydrological, Geological and Hydrogeological Data Bank. MWI, Water Resources and Planning Directorate, Amman, Jordan, 2010.
- Pavelic, “Use of Isotopes and Geochemical Techniques in the Study of Artificial Recharge in Groundwater,” Advice on Design and Monitoring to Counterparts In Jordan, Jordan, 2005.
- Rapp, “Evaluation of Potential Sites for Managed Aquifer Recharge via Surface Infiltration in NW-Jordan,” Diploma Thesis Part A, University of Karlsruhe, Germany, 2008.
- Salameh, “Over-Exploitation of Groundwater Resources and Their Environmental and Socio-Economic Implications: The Case of Jordan,” Water International, Vol. 33, No. 1, 2008, pp. 55-68.

