Journal of Software Engineering and Applications
Vol. 6 No. 7 (2013) , Article ID: 34133 , 7 pages DOI:10.4236/jsea.2013.67046
Fuzzy Rule Generation for Diagnosis of Coronary Heart Disease Risk Using Substractive Clustering Method
![]()
1Department of Information Technology and Computer Science, University of Brawijaya, Malang, indonesia; 2Department of Computer Science, University of Brawijaya, Malang, Indonesia.
Email: laililmf@gmail.com, lailil@ub.ac.id, yeni.wahyu12@gmail.com, marji@ub.ac.id
Copyright © 2013 Lailil Muflikhah et al. This is an open access article distributed under the Creative Commons Attribution License, which permits unrestricted use, distribution, and reproduction in any medium, provided the original work is properly cited.
Received April 28th, 2013; revised May 30th, 2013; accepted June 7th, 2013
Keywords: fuzzy rule; coronary heart disease; subtractive clustering; Takagi Sugeno Kang; variant
ABSTRACT
Fuzzy modeling techniques have been widely used to solve the uncertainty problems. A diagnosis of coronary heart disease (CHD) consists of some parameters numerical value of lingustics data. It can be implemented using fuzzy system through construction of the rules which relate to the data. However, the range of linguistics value is determined by an expert that depends on his knowledge to interpret the problem. Therefore, we propose to generate the rules automatically from the data collection using subtractive clustering and fuzzy inference Tagaki Sugeno Kang orde-1 method. The subtractive clustering method is a clustering algorithm to look for data clusters that serve as the fuzzy rules for diagnosis of CHD risk. The selected cluster number is determined based on the value of variant boundaries. Hence, it is applied to fuzzy inference system method, Takagi Sugeno Kang order-1, which determines diagnnosis of the desease. The advantage of this method is applicable to generate the fuzzy rules without defining and describing from an expert.
1. Introduction
Recently, fuzzy logic can be used to model the process of thinking human involves elements of uncertainty, doubt and linguistics. It is used to settle the classical problem methods due to lack of knowledge [1]. Its characteristic is the ability to express knowledge using linguistic so that it can be understood by human. In most fuzzy system, the determination of fuzzy rules has been established and elaborated by experts. This process takes a long time, experience and the ability of experts [2]. Besides that, the experts cannot often express knowlege correctly and clearly so that the produced rules of fuzzy system are not optimal. Fuzzy clustering algorithm is suitable to generate fuzzy rule due to it can detect partition between input and output variable of data structure for the simple fuzzy rule [3]. Besides that, the strenghhness of fuzzy clustering is the computation time efficiently [4]. Therefore, it needs to establish the fuzzy rules, which are automatically based on optimizing data input and output system [5]. One of the algorithms is fuzzily subtractive clustering.
Subtractive clustering is a clustering algorithm based on potential size of the data points in a variable, where the classification is influenced by the radius, squash factor, accept ratio and reject ratio. The best selected clusters can be obtained using variant analysis. The results of subtractive clustering are clusters which contain the constructed rules and are combined to Takagi Sugeno Kang inference model. Fuzzy inference is important in fuzzy system that the same value exists between expected and actual output. One of the problems which can be solved in fuzzy system is diagnosis of Coronary Heart disease (CHD) due to the constructing rules of diagnosis are numerical data that have linguistic value. CHD is a disease affecting the blood vessels that drain blood to the heart and make a partial blockage or total of the coronary arteries. The detection of CHD risk uses some factors, such as age, sex, occupation, levels of LDL, cholesterol levels, HDL, trigliserid levels, blood pressure systolic and diastolic blood pressure [6]. Hence, we propose to apply subtractive clustering to generate the fuzzy rule for CHD risk.
2. The Previous Work
The research for diagnosis of coronary heart diseease has been done by Allahverdi N., et. al. using Fuzzy Expert system method to determine the risk for the next ten-years. The aquitition of rules to determine the risk is obtained from an expert (specialist doctor). The diagnosis result is depend on his knowledge [7]. Therefore, this paper is purpose to generate rules from the historical data. The automatic rule generation algorithm is based on optimize the process of data input and output system [5]. Several unsupervised learning algorithms have been implemented in various kinds of research. One of the many algorithms is a fuzzy clustering algorithm to generate the rules. Fuzzy clustering algorithm is very suitable to be applied for generating fuzzy rules due to this algorithm can detect partition the separation between input and output variables which are the basic structure of the fuzzy rules and very simple [3]. According to Koczy (2002), the fuzzy clustering has the advantages in computational efficiency. There are several clustering algorithms that can be used, including k-means, fuzzy c-means and subtractive clustering. K-means algorithm and fuzzy c-means algorithm is the unsupervised clustering. The cluster number should be determined initially for the both algorithms. However, the subtractive clustering that is an unsupervised clustering algorithm does not require the number of clusters previously. According to Sindhu (2010), subtractive clustering has the advantage that can estimate the center cluster as well [8].
3. Subtractive Clustering
Subtractive clustering is a clustering algorithm based on potential size of the data points in a variable. The idea of the subtractive clustering is the determining regions in a variable which has a high density of data points in surroundings. The point that has the largest number of neighbors will be selected as cluster centers and the density will be reduced. Then the algorithm will choose another point that has the most neighbors to be the center of another cluster [9]. Hereby, the subtractive clustering algorithm is applied to CHD dataset as follows:
1) To input data sets of CHD for clustering.
2) To determine the attribute value: radius (r), squash factor (q), accept ratio, reject ratio, minimum value (Xmin) and maximum value (Xmax).
3) To normalize the input data as in Equation (1).
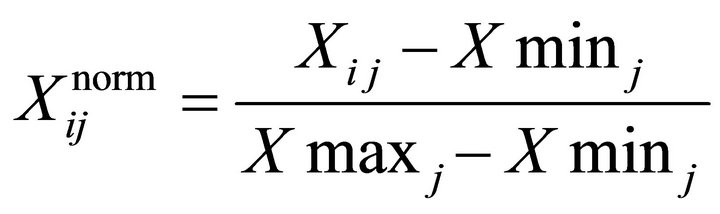
i = 1, 2, ···, n; j = 1, 2, ···, m. (1)
4) To determine the initil potential of each data point.
If the number of attributes (m) = 1, then it is applied to Equation (2).
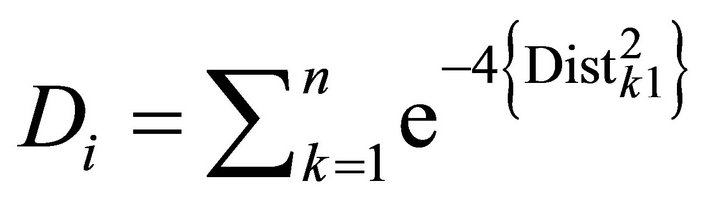 (2)
(2)
If m > 1, then it is applied to Equation (3).
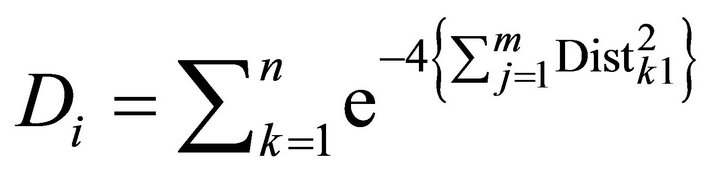 (3)
(3)
where, the distribution value of each attribute is obtained from Equation (4).
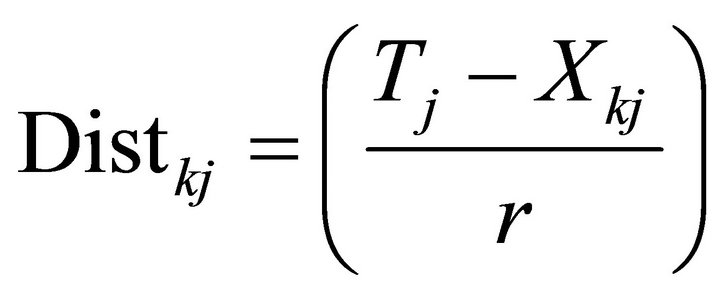 ;
;
i = 1, 2, ··· n; j = 1, 2, ··· m; k = 1, 2, ··· n .(4)
5) To find the highest potential of each data point using Equation (5).
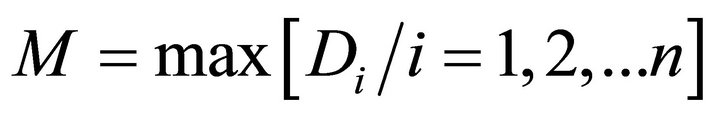 (5)
(5)
where, h = i so that Di = M.
6) To detemine the cluster center and reduce potential data point. It can be applied these below stages:
a) Set cluster center [], Vj = Chj, C = number of cluster, condition = 1, Z = M.
b) If condition !=0 and Z !=0, then it is processed:
• condition=0 (there is no candidate of new cluster center).
• if ratio (Z/M) > accept ratio, then condition = 1 (candidate is available).
• Else, it is executed to these below process:
° If ratio > reject ratio, then the candidate of cluster center will be accepted as center if its existence will make balance of data distantly from the cluster center.
° Md = −1.
° For I = 1 to c, to apply Equation (6).
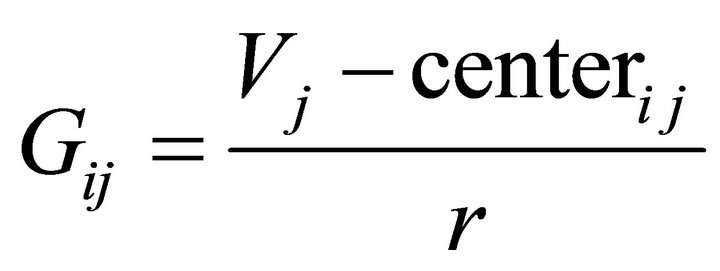 (6)
(6)
where, j = number of dataset attributes and r = the defined radius.
• Calculating distance of each data point as is shown in Equation (7).
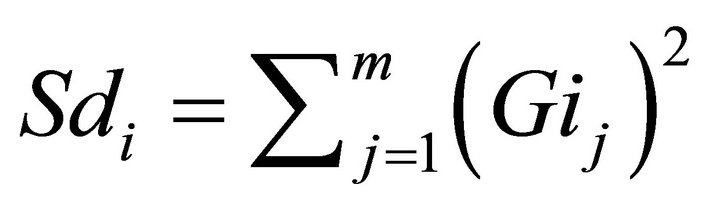 (7)
(7)
• If Md < 0 or Sd < Md, then Md = Sd.
c) Find the condition = 1, then it is processed as below:
• Set C = C + 1, where C is the number of cluster.
• Cluster center c = V which is the candidate of cluster center.
• To reduce the nearest data point of cluster center.
o Find Sij value using Equation (8).
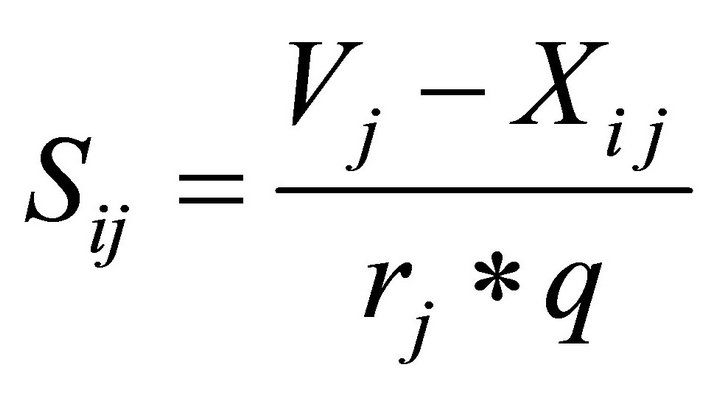 (8)
(8)
o  (9)
(9)
o D = D − De, where D is the initial potential of data point.
o If Di <= 0, then Di = 0.
o Z = max[Di/I = 1, 2, ··· n].
o Select h = i, so that Di = Z.
7) To return the the normalized cluster center into the initial formation using Equation (10).
 (10)
(10)
8) To calculate the cluster sigma value using Equation (11).
 (11).
(11).
3.1. Variant Analysis
The measurement value of the data spread unsupervised clustering results can be used variance. There are two kinds of variance, i.e. variance within clusters and variance between clusters. The both can be applied to determine the density of a cluster. In each stage of cluster formation, the variant is to be calculated as stated in Equation (12).
 (12)
(12)
where,  = variance in cluster c; c = 1···k, for k = number of cluster; nc = number of data in cluster c; yi = ith data of cluster;
  = data average in cluster c.
Thus, the variance within cluster can be calculated using Equation (13).
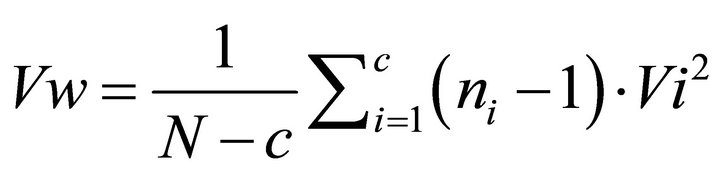 (13)
(13)
where, N = total the whole data; n = total data of ith cluster; Vi = variance in ith cluster; by variance between cluster (Vb), it is used Equation (14)
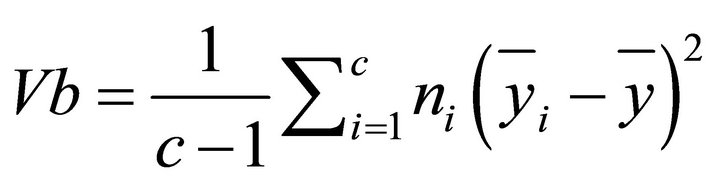 (14)
(14)
where,  average.
A method that can be used to determine the ideal cluster is variant limit. It calculates the cluster density either variance within cluster (Vw) or variance between cluster (Vb). The ideal cluster has a minimum Vw which represents internal homogenity and maximum Vb (external homogenity) [10]. Value of variant boundaries are shown as in Equation (15).
 (15)
(15)
3.2. Rule Extraction
The results of clustering algorithms in the form of matrix are cluster center (C) and sigma (σ) which will be used to determine the value of Gauss membership function parameters [9]. The steps of fuzzy rule extraction of the cluster are:
1) Calculate the degree of membership by using the Gauss membership function. Degree of membership of a data point Xi on the k-th cluster is shown in Equation (16).
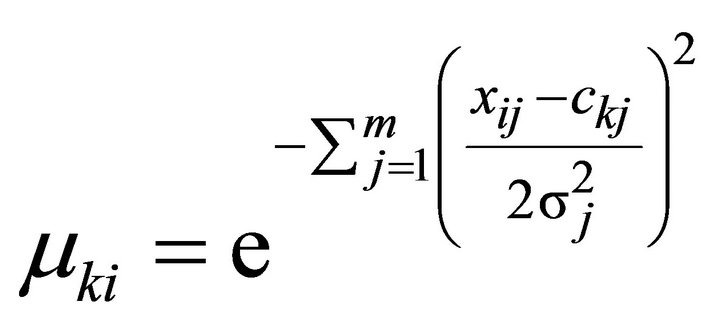 (16)
(16)
2) Create a matrix U of size n x (cluster number * number of attributes) by these below steps are:
a) Multiplying the membership degree of each data i in cluster k by each attribute j of the data i, ( ) as in Equation (17).
![]() (17)
(17)
b) Thus, it is the normalization process which is performed by  and
and![]() .
.
c) The next step is to construct matrix U with size n x (r * m + 1), where n = number of training data, r = number of rule/number of cluster and m = number of input variable with uij = .
.
3) The results of matrix U is applied the least square error method to obtain the output parameter coefficient, with details as below:
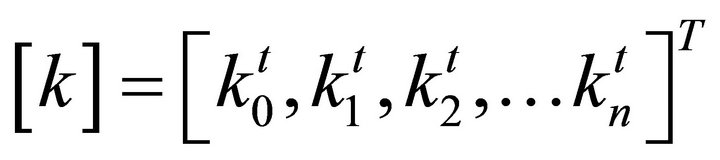
d) If consequent parameter k is noted Equation (18).
 (18)
(18)
Then, inference TS for 1 to N training data can be notated in Equation (19).
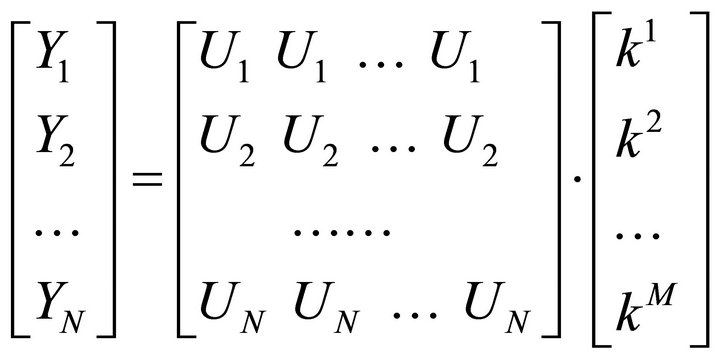 (19)
(19)
e) To calculate coefficient k can be used Least Square Error method using pseudo matrix, so that the equation of inference TS is stated in Equation (20).
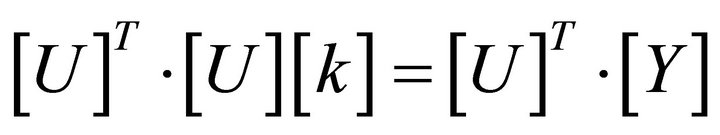
and
 (20)
(20)
The dimension of matrix parameter k is
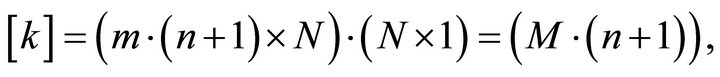
where M is the number of training data, and n is the number of input fuzzy. Thus, it is constructed the collection of rules r which is stated as below:
[R1] IF (x1 is A11) and (x2 is A12) and …. and (xm is A1m) THEN (Z = k11x1 +….+ k1mxm).
[R1] IF (x1 is A21) and (x2 is A22) and….and (xm is A2m) THEN (Z = k21x1 +….+ k2mxm).
....
[Rr] IF (xr is Ar1) and (x2 is Ar2) and….and (xm is Arm) THEN (Z = kr1x1 +….+ krmxm).
3.3. Inference Takagi Sugeno Kang Orde-1
Fuzzy inference method of Takagi Sugeno Kang (TSK) is a model for the fuzzy inference rules which are represented in IF-THEN, where the output (consequent) is not a set of fuzzy systems, but it is a constant or linear equations. This method was introduced by Takagi Sugeno Kang in 1985 [11]. There are two models of the TSK method are:
1) TSK model order-0. In general, the fuzzy inference TSK model order 0 is be notated: IF (x1 is A1i) o (x2 is A2i) o ... o (xn is Ani) THEN z = k; where xj is the j-th input varibael, Aji is a fuzzy set ith of the variable xj and k is a constant (crisp) as the consequent.
2) TSK model of order-1. In general form the method of fuzzy inference model TSK Order-1 is IF (x1 is A1i) o (x2 is A2i) o ... o (xn is Ani) THEN z = p1 * x1 + .... * xn + pn + q. where, xj is the j-th input variable, Aji is the i-th fuzzy set on the variables xj, pj is a constant (to be crisp) as the coefficients for the variables xj and q are constants for a linear equation in the consequent of a rule.
If the fire strength (α) and Zr values for each the r-th rule have been obtained (r = 1, ..., R), then the rule will be composed. The composition process is applied by-summation of the multiplication between the fire strength and the z value. Then, it is implemented defuzzyfication using weighted average concept is shown in Equation (21) [12].
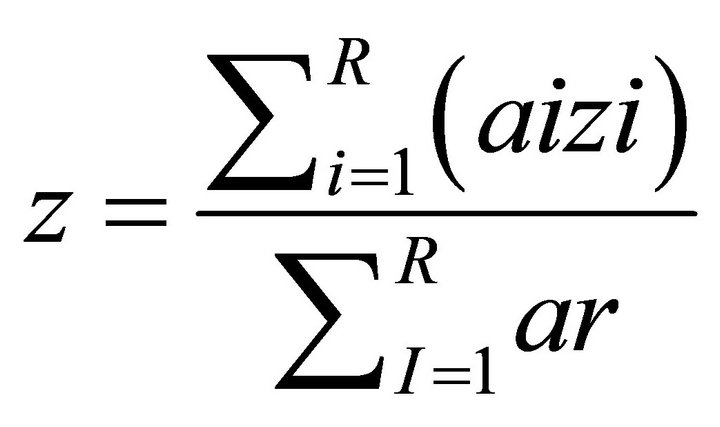 (21).
(21).
4. Methodology
Generally, the system is divided into two processes including fuzzy rules construction and inference. The first process is to get fuzzy rules through a process of clustering using subtractive clustering method, where the rules selected cluster will be the result of has a limit value that has the smallest variance performed the extraction process. The process of rule construction is shown in Figure 1.
The second is testing process. It is a process to determine level of accuracy of rules that are formed through inference process using Takagi Sugeno Kang model 1. The testing process can be carried out if the formation of fuzzy rules has been done. Thus, if the system has never made the process the formation of fuzzy rules, then the user can’t do the testing on the system. Input from this process is the test data CHD form data with CHD risk
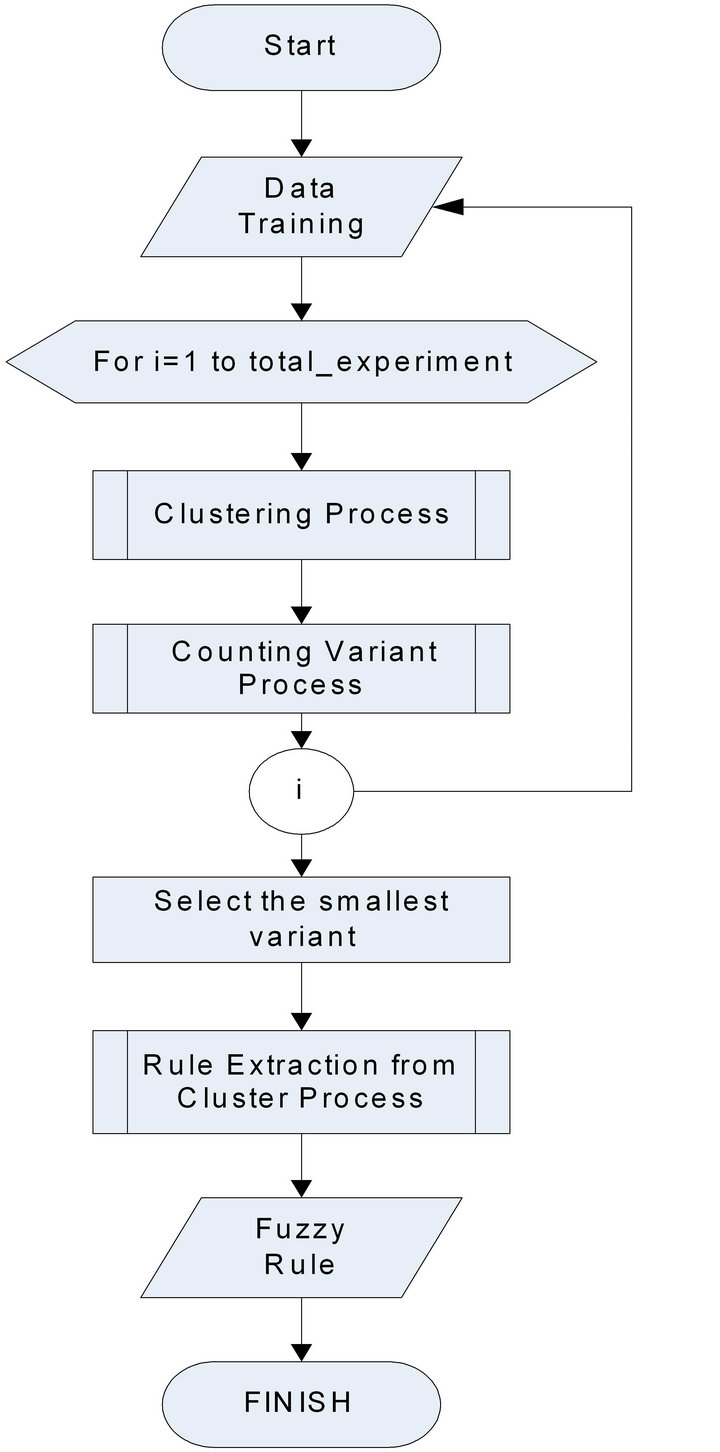
Figure 1. Flowchart of constructing rules process.
factors and fuzzy rules which have been formed from the previous training. However, the output of this process is a diagnosis of CHD risk. The testing process is shown in Figure 2.
Furthermore, the dataset is taken from medical record of CHD patients in a hospital and the laboratory of physical health checks in Indonesia. The parameters of CHD risk diagnosis include age, LDL, cholesterol, HDL, trigligerid, sistholic. The details of training data and testing data are shown in attachment-1 and attachment-2.
There are three experimental scenario using vario us the number of data training such as 50, 60 and 70 records with reject ratio: 0.1 - 0.9 and radius: 0.35 - 0.45. Each parameter of reject ratio will be produced diferrent rules. Thus it is applied to the data test using six attributes, i.e. age, LDL, cholesterol, HDL, triglerisida and sistholic presure. In this step, risk value and class of CHD is produced by system will be compare to the actual diagnosis.
5. Experimental Result and Analysis
There are two stages of testing the system. The first phase is to determine selected rules of the clustering based process of variant analysis. In this stage, it is carried out three trials with different amount of training data. The first test is used 50 trained data, the second test is used 60 trained data and the third test is used 70 trained data. At each testing, the applied parameters of clustering
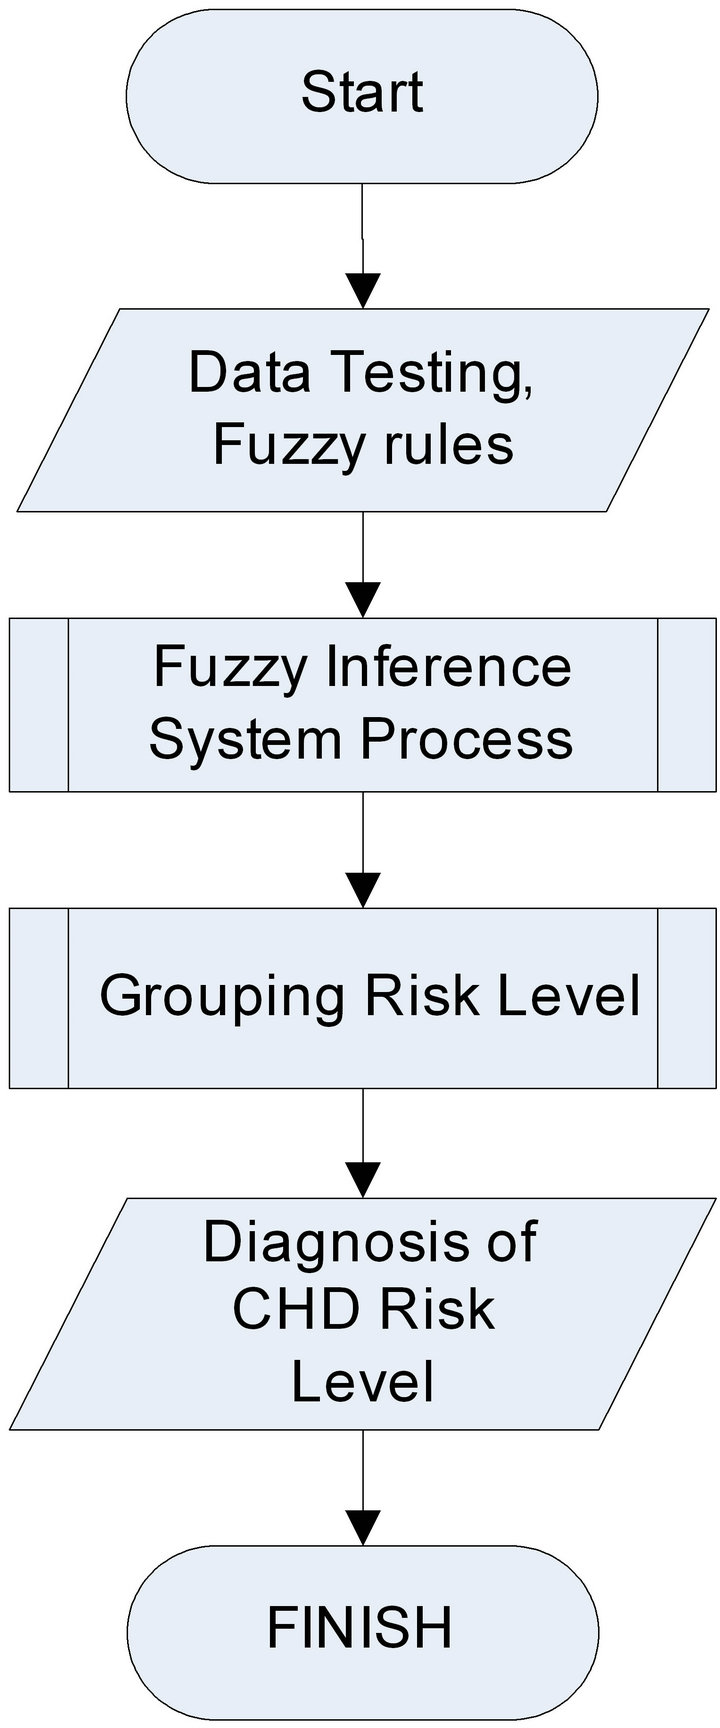
Figure 2. Flowchart of testing process.
process were different. Clustering process parameters in question are value of the radius and the reject ratio. Value of the radius is used in range from 0.35 to 0.45, however the value of reject ratio is used ranged between 0.1 - 0.9.The reject ratio of each training data will produce different rules. The different rules is used in the second phase of testing is to determine how accurate the rules that have been selected. The data used for the testing in the phase is 30 data, which contain six attributes includeing age, levels of LDL, total cholesterol, HDL, triglerisida and systolic pressure. In this stage, the value and grade level of CHD risk system will be compared to the reference of diagnostic results.
5.1. Experimental Result
The experimental result is implementation of fuzzy substractive clustering for generate rule of CHD risk. The implementation interface is shown in Figure 3.
In the first experiment, rule construction process is executed several times using different reject ratio, between 0.1 and 0.9. Each reject ratio is selected for the ideal cluster number based on the minimum of variance. The experimental result of the first scenario is shown as in Tables 1-3, with r radius, c cluster number, and v variant.
Then, the accuracy result of produced rules from the first experiment with 50 training data is shown in Table 4.
In the second test with 60 training data, it generated 8 different types of rules by the restriction the smallest variance in each reject ratio. The accuracy results of each rule are shown in Table 5.
Then, the third test with 70 training data is produced 9
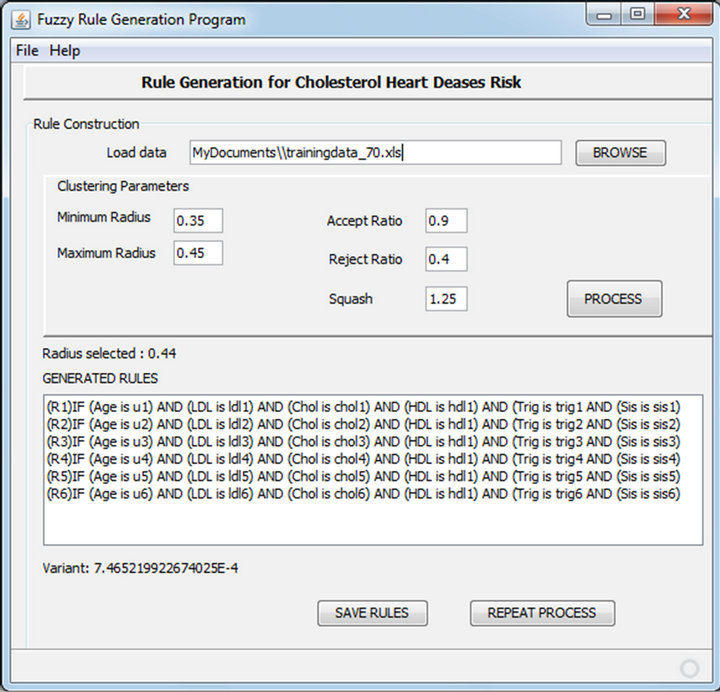
Figure 3. Interface of fuzzy generate rule for CHD system.
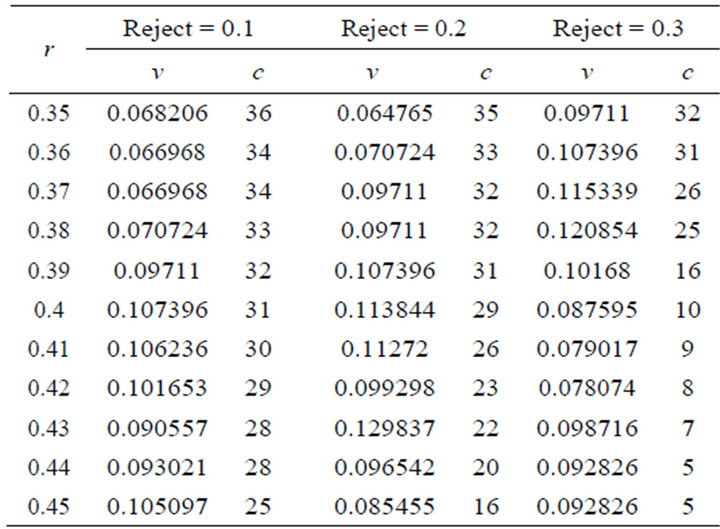
Table 1. Experimental result with reject value 0.1 - 0.3 (50 training data).
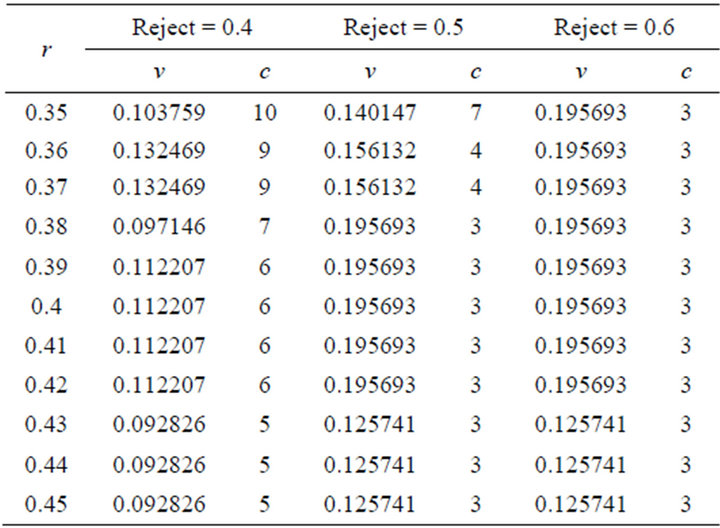
Table 2. Experimental result with reject value 0.4 - 0.6 (50 training data).
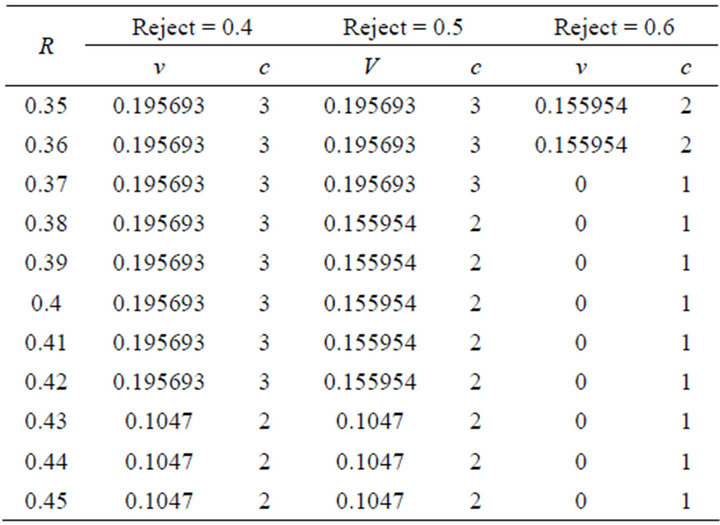
Table 3. Experimental result with reject value 0.7 - 0.9 (50 training data).
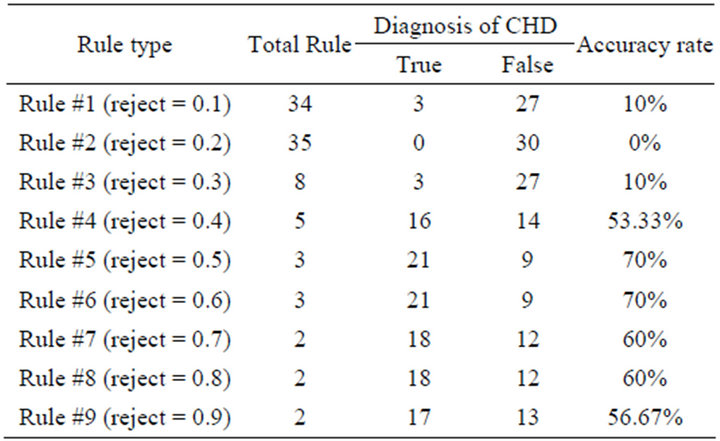
Table 4. The accuracy result of test-1.
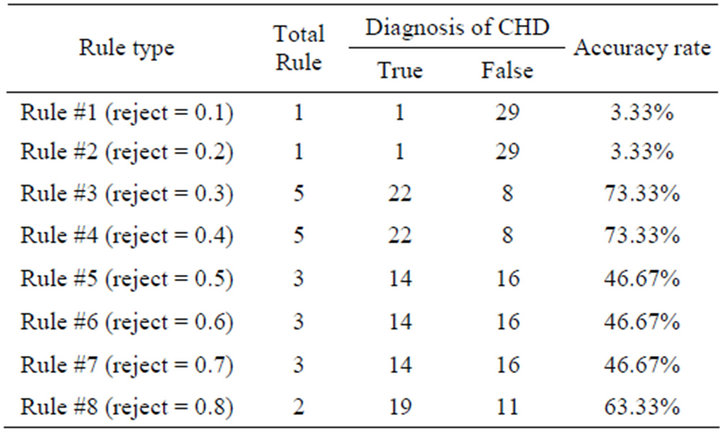
Table 5. The accuracy result of test-2.
different types of rules which were bounded the smallest variance in each of reject ratio. The accuracy results of each rule are shown in Table 6.
5.2. Result Analysis
In the first phase of testing, the parameters input of the radius and reject ratio is affect the number of clusters formed. Both parameters are inversely by the number of clusters. The smaller radius and reject ratio value, the
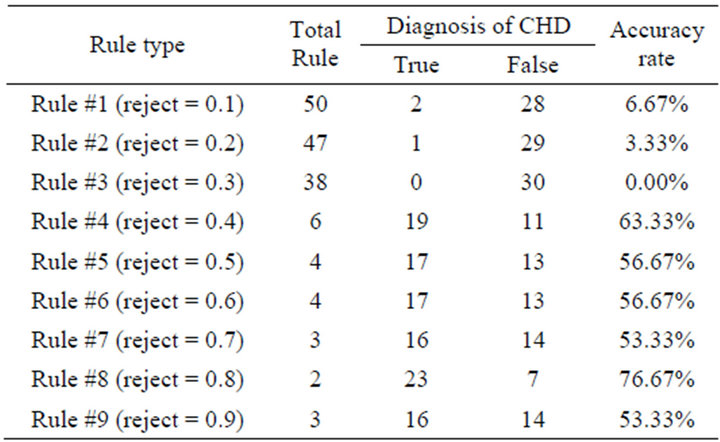
Table 6. The accuracy result of test-3.
more number of clusters. However an accept ratio didn’t give any influence on number of clusters. The number of clusters was generated in each testing and different training using the input parameter data of the same clustering process is different. This was caused of influence of training data used for the largest and smallest values in each attribute data. The largest and smallest values respectively one data attribute is useful in forming the data normalized, where the normalized data is effect to the formed cluster.
The second phase of the test results show that affect the number of rules established accuracy of test data. In many times of testing, it was generated the same number of rules, but different levels of accuracy. The different accuracy is caused of the cluster center and the produced sigma value. The both effect to output coefficient value which use to determine Z value of each rule. The Z value was applied to diagnosis CHD risk. The best accuracy of the generating fuzzy rules using the subtractive clustering method is 76.67% for diagnosis of CHD risk. This is caused by several factors, such as the number of attributes is 7. Also the number of data should be used not only 50, 60 and 70 patient’s medical record but also more types data training which the system will be better in recognizing patterns. Another factor that causes this accuracy is CHD risk values which are used as a reference for accuracy of the system.
6. Conclusion
Subtractive clustering method can be implemented in the establishment of fuzzy rules for the diagnosis of coronary heart disease risk (CHD). The method is used to produce the clustered data. Thus, the fuzzy rule is obtained by extracting rules from the cluster using the Least Square Error (LSE). Determination of the best cluster is a rule fuzzy selected at each time of testing performed using variant analysis. The smaller value of variant boundaries for cluster, the more ideal for clustering is. The best accuracy of the system of selected rules if it is applied to the TSK inference orde-1method is 76.67%, where the number of rule is 2 which is the result of the clustering process using the reject ratio = 0.8 at radius 0.45 for 70 training data.
REFERENCES
- A. Priyono, M. Ridwan and A. Jais Alias, “Generation of Fuzzy Rules with Subtractive Clustering,” Jurnal Teknologi, Vol. 43, 2005, pp. 143-153. doi:10.11113/jt.v43.782
- R. Arapoglou, K. Kolomvatsos and S. Hadjiefthymiades, “Buyer Agent Decision Process Based on Automatic Fuzzy Rules Generation Methods,” IEEE International Conference on Fuzzy Systems (FUZZ), Barcelona, 18-23 July 2010, pp. 1-8.
- J. A. Dickerson and B. Kosko, “Fuzzy Function Approximation with Ellipsoidal Rules,” IEEE Transactions on System Man and Cybernetics, Vol. 26, No. 4, 1993, pp. 542-560.
- L. T. Koczy, “Fuzzy Rule Base Model Identification Techniques,” Department of Telecommunication and Telematics, Budapest University of Technology and Economics, Budapest, 2002.
- H. Salehfar, N. Bengiamin and J. Huang. “A Systematic Approach to Linguistic Fuzzy Modeling Based on InputOutput Data,” Proceedings of the 2000 Winter Simulation Conference, Orlando, 10-13 December 2000, pp. 480-486. doi:10.1109/WSC.2000.899755
- P. R. J. Burch, “Coronary Disease: Risk Factors, Age, and Time,” American Heart Journal, Vol. 97, No. 4, 1979, pp. 415-419. doi:10.1016/0002-8703(79)90385-5
- N. Allahverdi, S. Torun and I. Saritas, “Design of a Fuzzy Expert System for Determination of Coronary Heart Disease Risk and Technologies,” Computer Systems and Technologies 2006, Veliko Turnovo, 14-15 June 2007.
- R. S. Sidhu, “A Subtractive Clustering Based Approach for Early Prediction of Fault Proneness in Software Modules,” World Academy of Science, Engineering and Technology 67, 2010.
- S. Kusumadewi and H. Purnomo, “Fuzzy Logic Application for Decission Support System,” Graha Ilmu Press, Jakarta, 2010.
- L. Man, T. C. Lim, S. Jian and L. Yue, “Supervised and Traditional Term Weighting Metodes for Automatic Text Categorization,” IEEE Transactions on Pattern Analysis and Machine Intelligence, Vol. 31, No. 4, 2009, pp. 721- 735.
- N. dan Gelley and R. Jang, “Fuzzy Logic Toolbox,” Mathwork, Inc., Natick, 2000.
- K. H. Lee, “First Course on Theory and Applications,” Springer-Verlag Berlin Heidelberg, New York, 2005.