Journal of Software Engineering and Applications
Vol. 5 No. 6 (2012) , Article ID: 19852 , 12 pages DOI:10.4236/jsea.2012.56048
Using Test Employee Capability Maturity Model for Supporting Gaps Bridging in Software Testing
![]()
1Technopreneurship and Innovation Management, Graduate School, Chulalongkorn University, Bangkok, Thailand; 2Department of Mathematics and Computer Science, Faculty of Science, Chulalongkorn University, Bangkok, Thailand; 3Department of Commerce, Faculty of Commerce and Accountancy, Chulalongkorn University, Bangkok, Thailand.
Email: jithinan.s@student.chula.ac.th, peraphon.s@chula.ac.th, decha@acc.chula.ac.th
Received April 2nd, 2012; revised April 30th, 2012; accepted May 8th, 2012
Keywords: Software Testing; Test People; Capability Maturity Model; Capability and Maturity Levels; Gap Assessment
ABSTRACT
This study addresses the challenge of assessing gaps among the differences of test people in eight groups by matching them based on four scenarios. The proposed model called Test Employee Capability Maturity Model (TEC-MM) helps find the gaps and measure the capability and maturity levels of each sub-maturity models in four dimensions as technicality, management, business, and personality. We applied TEC-MM to a software company which has instituted test people improvement strategy and plans to be a front runner in software testing industry. The findings reveal that gaps existed and consequently affect software testing process quality.
1. Introduction
Software testing is a part of software engineering which helps improve software quality, reduce costs and schedule of software project development. To improve these performance factors, the development organization must consider them as important requirements on software testing.
Many researches have proposed new techniques and technologies to attain quick results. However, many companies are constrained by limitations on test people such as lack of personnel, related resources, necessary skills, knowledge, and misunderstanding individual’s role and responsibility.
Studies have shown that human factors are very important that highly impact on software testing process improvement. To address these issues, the gaps among the various test people should be identified as the first strategic step to set the bridging plan which can lessen software testing problems caused by human errors. The core consideration is test capability analysis on present maturity status and test capability development plan for both short and long term operations. The principal contribution of this paper is to identify this gap, thereby test employee capability could be put to real use.
The paper is structured as follows. Section 2 presents related works and industrial survey results from literature reviews. Details of the proposed model are presented in Section 3. Section 4 summarizes data collection and analysis. Section 5 discusses the results using a case study to demonstrate the comparative findings based on four scenarios. The final conclusion and future work are given in Section 6.
2. Related Works and Industrial Survey Results
A few pertinent works were furnished as a rationale that motivated a preliminary study to conduct factor analysis on relevant factor. Some background, profile, and organization capability were collected and analyzed in order to establish the principal dimensions of our study.
2.1. Related Works
Test people are organized in several roles and responsibilities which are different in various organization structures [1,2]. Examples are test manager, test leader, test architect, and tester. It is especially important for test managers and test leaders to understand the management responsibilities such as test strategy/plan development, test monitoring, and test risk assessment.
From technicality standpoint, testers and test architects must concern with test scenario/case development, defect detection, and test data/environment preparation. Moreover, as each test staff has to possess test specific knowledge, they should understand business domain, management, innovative technology, and test techniques [3]. Therefore, the difference of personnel capability influences software testing performance on cost and time saving, and quality improving [1].
A leading cause of unsuccessful software testing is the various gaps of test people, especially between theory and practice. Glass et al. [4] pointed out from their industrial viewpoint that most practitioners had reached only moderate test knowledge. They learned by themselves and many had never read books on theory and technique. Three reasons given by Briand and Labiche [5] exemplified why the gap between academia and industry existed. Nevertheless, many articles optimistically propose various techniques to easily and properly apply in the industry to bridge the gap, e.g., behavior changing about reading more books, test case selection, and agile testing [6-9]. For first step of gap finding, we need an assessment method that could fit well with test issues in Capability Maturity Models Integration (CMMI) with four offers [10-13]. People CMM were deployed by this study. This led us to investigate the various relevant factors to employee capability in software testing industry.
2.2. Industrial Survey Results
We gathered 52% response which amounted to 104 answers from 26 companies categorized by management and non-management in the preliminary survey of software testing industry in Thailand. Company selection was performed through perspective sampling from those having independent test team from development team for the best unbiased performance in software testing.
Respondent organization profiles were summarized in four classes as shown in Table 1. The samples came from small, medium, and large size organizations. Approximately 65% of the companies had fewer than 51 staffs on their test team. Twenty four companies’ staff had less than 10 years of experience. The main responsibility was in-house service, but outsourcing gradually crept in. Three areas of staff’s profile were focused as education and training, individual’s viewpoint of knowledge, and personality, which are presented in subsequent sections.
2.2.1. Education and Training
The research questions asked about the impact of education and training that supported their work performance based on the five-point Likert scale, ranging from 0 (not at all important) to 4 (very important). The result is shown in Table 2. Most answers fell in quite important scale for both education and training at 40.4% and 45.2%, respectively. Interestingly, 9.6% of the respondents were not concerned with educational background of test staffs. On the contrary, 19.2% considered training was very important that could supplement for their educational
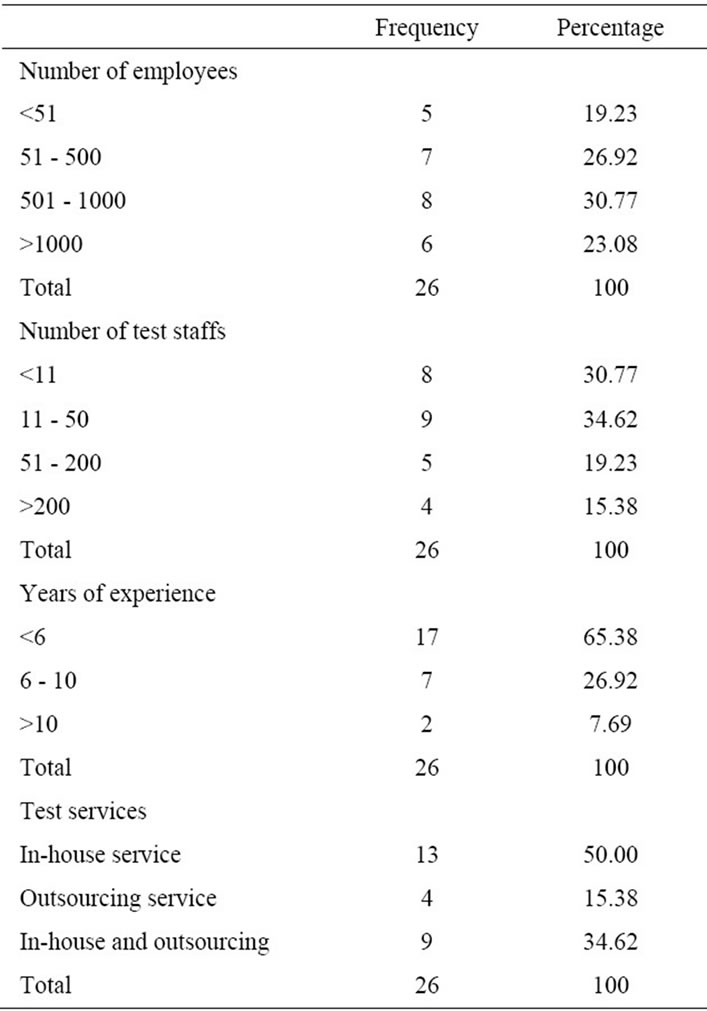
Table 1. Profile of respondent organizations.
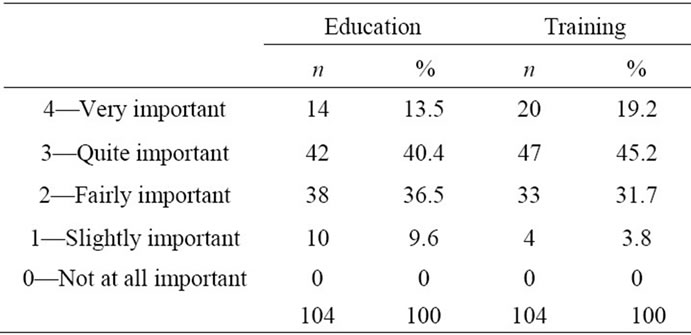
Table 2. Education and training.
deficiency. Yet 3.8% thought otherwise about the role of training.
2.2.2. Individual’s Viewpoint of Knowledge
The questions were concerned about the importance of various fields of knowledge and the need to force them in-line with company’s policy. We proposed ten options and one open answer. A five-point Likert scale, ranging from 0 (not at all important and no need to promote) to 4 (very important and must promote) was deployed to gauge their knowledge viewpoints. It turned out that four out of ten options were the necessary dimensions to be accounted for, namely, testing techniques or technicality, test management, business, and personality as shown in Table 3, while the remaining options were negligibly insignificance.
The frequency and percentage of business and personality were virtually no different, whose majority weight fell in 3 & 4 ranges, i.e., 75% for business and 71.2% for personality. Technicality and management were needed to propel their organization at 80.8% and 92.4%, respectively. Note that the most important dimension was management with the highest percentage at 46.2%.
We conducted a principal component analysis (PCA) with vaimax rotation to identify factors that explained the pattern of important knowledge viewpoints. Moreover, the values of mean and standard deviation of each factor were determined to prioritize the factors. Four factors ordered by mean values are presented in Table 4.
The Kaiser-Meyer-Olkin (KMO) value, which is an index used to examine the appropriateness of factor analysis, was 0.70 that exceeded the minimum acceptable value of 0.5 [14]. From the results, the specific knowledge viewpoint’s out of the four factors had the highest eigen value that represented the total variance explained by each factor, while the test planning and management of administration viewpoint was the most important factor based on the mean value. Test skills and test technique of test proficiency viewpoint as was the second rank that organization should focus on improvement. The specific knowledge viewpoint played a supplementary role to supporting other principal factors.
2.2.3. Personality
The question of personality focused on behavior evaluation in their organization. We suggested seventeen options and one open answer. A five-point Likert scale, ranging from 0 (very poor) to 4 (excellent) was applied to indicate the level of personality and competency. We selected the top three and last three ranking by mean and standard deviation to discuss in Table 5.
The top three rankings were the most common behaviors of test people in their companies, namely, test inspiration, defect detection, and fault effect awareness. They were good personality for capability and potential improvement areas in software testing. On the other hand, the last three rankings were rarely expressed personalities, namely, proactive management, risk awareness, and programming. Proactive management and risk awareness were
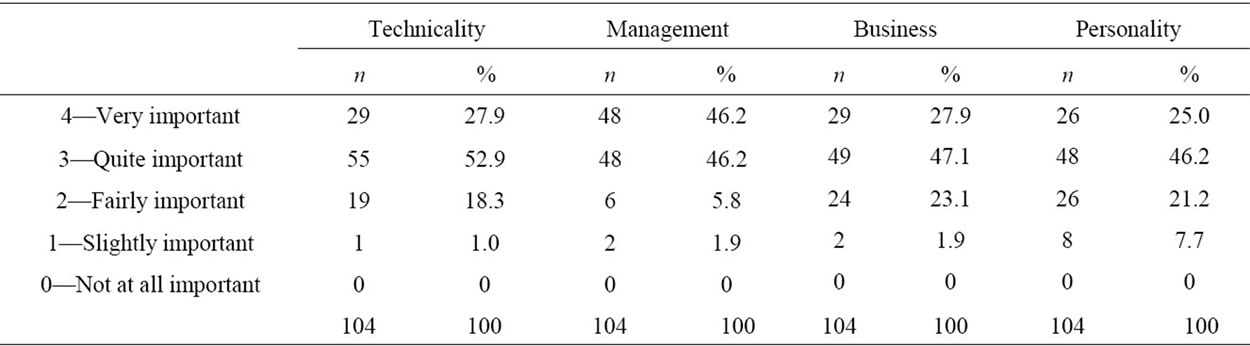
Table 3. Individual’s viewpoint of knowledge.
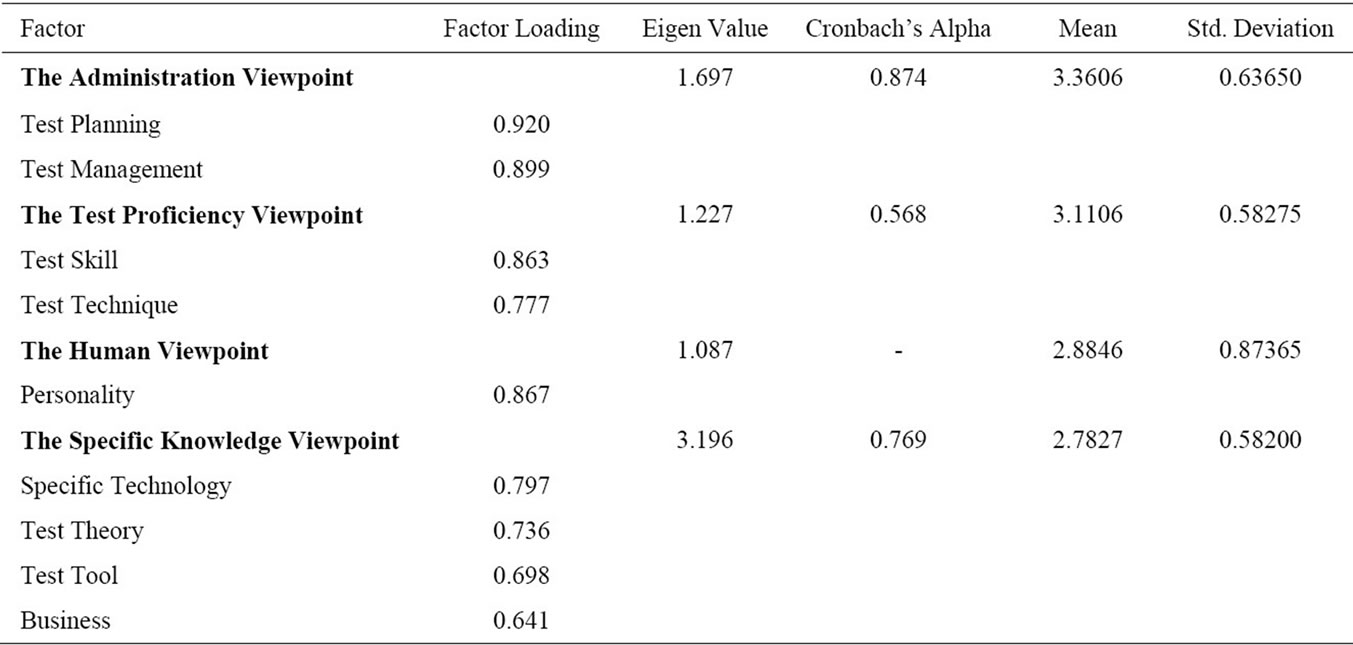
Table 4. Results of the exploratory factor analysis of individual’s viewpoint of knowledge.
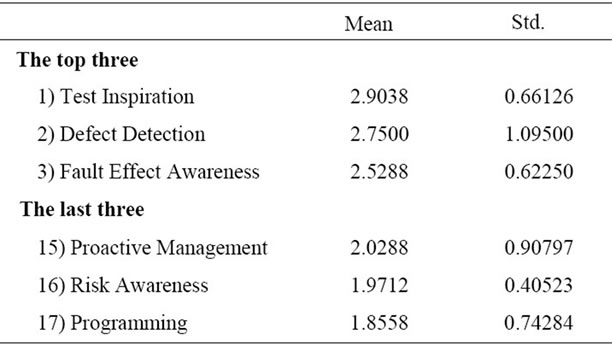
Table 5. The top and last three of personality.
a part of management viewpoint of which their test people lacked, whereas these personalities proved to be very important in their opinions from the results in Subsection 2.2.2. Most test personnel admitted that they did not have adequate programming skill, yet considered this shortfall to be not a serious issue. Nonetheless, concerns on basic concepts and programming language knowledge prevailed.
We employed principal component analysis (PCA) of factor analysis with a vaimax rotation to describe correlated observed variables. Table 6 exhibits the results of exploratory factor analysis of personality sorted by mean and standard deviation of each factor.
All variables were grouped in five factors arranged from the highest to the lowest eigen values as principal personality of software testing, supplementary personality of software testing, personality of business management, personality of business management, and personality of other knowledge and idea seeking. The KMO value was 0.535 exceeding the minimum acceptance value.
From average ranking scores, the supplementary personality of software testing had the highest average score. This explained that most test people were good listener, submit defect report, and have test inspiration.
One interesting note was that the personality of defect detection and fault effect awareness were ranked in the top three, while the personality of proactive management was ranked in the last three. Their overall categorization under principal personality of software testing was ranked third. The rationale was that test staffs needed a set of eight competencies to accommodate concurrent development, namely, communication, cautious/accurate/patient, proactive management, stress management, fault effect awareness, defect detection, specific test technique, and test
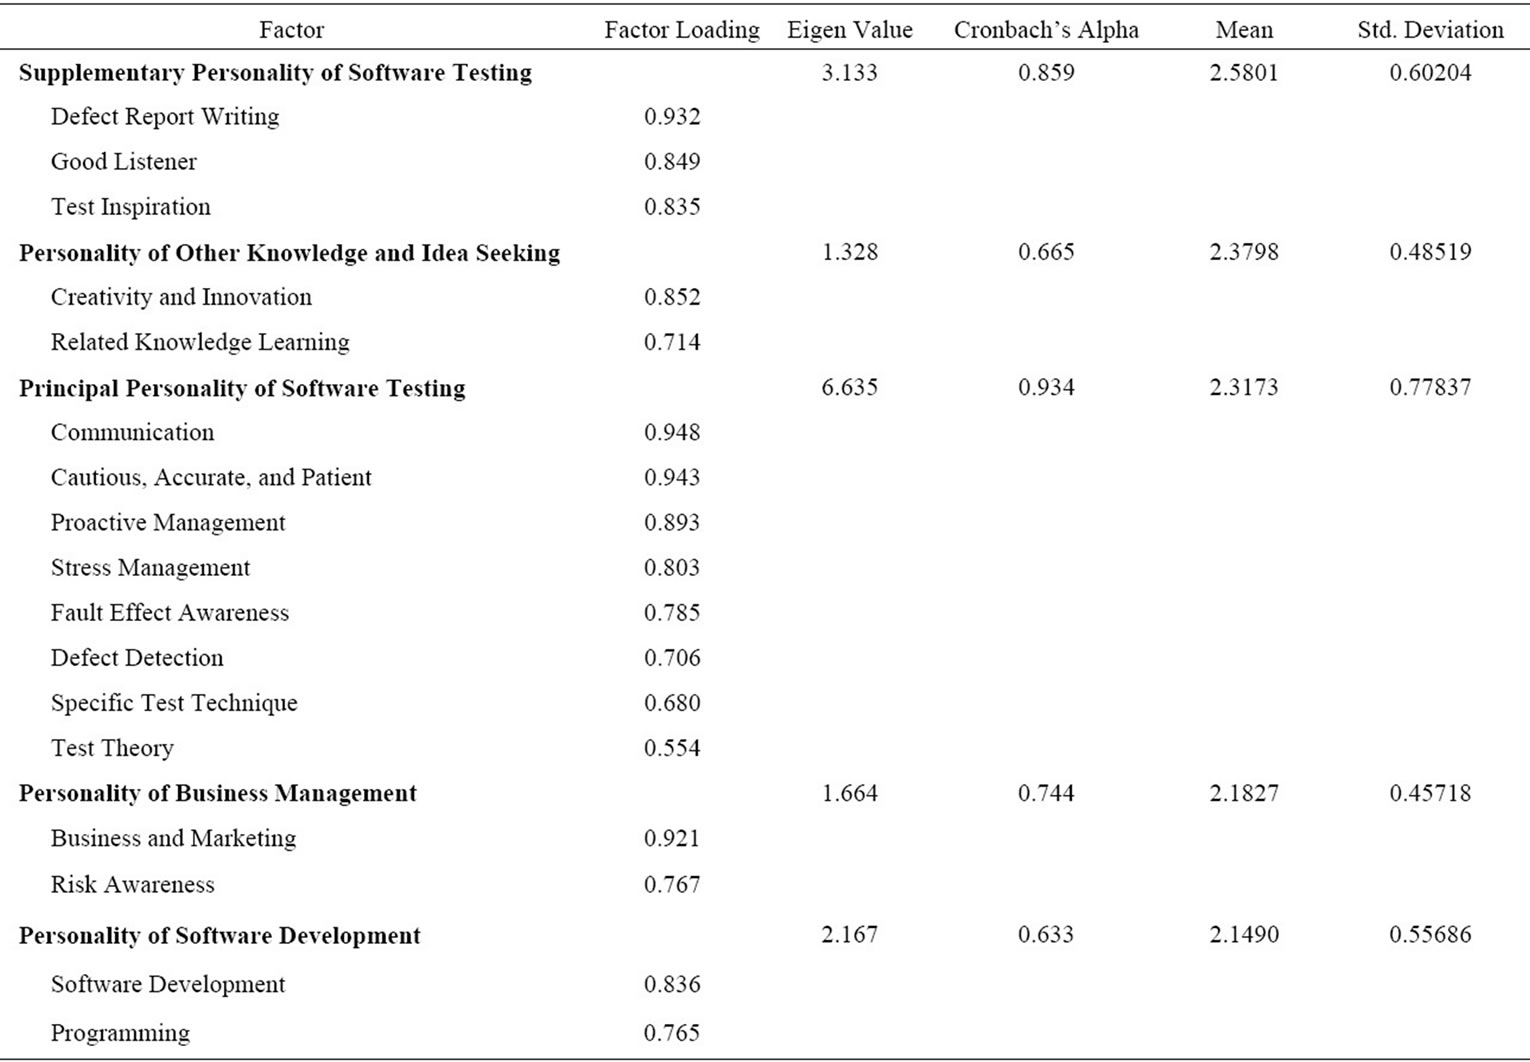
Table 6. Results of the exploratory factor analysis of personality.
theory.
On a favorable note was personality of other knowledge and idea seeking which was ranked second. From our interview, most testers were the new generation who were always active and willing to learn new things. However, many of them had never worked in software development as they started anew in software testing. They lacked skills on business and programming.
This coincided with the above results that the personality of business management and software development were the least concerned factors with average scores of 2.1827 and 2.1490, respectively.
3. The Test Employee Capability Maturity Model (TEC-MM)
TEC-MM focuses on contiguous representation of test people capability maturity to be considered in two aspects, namely, assessment framework and rating.
3.1. TEC-MM Assessment Framework
TEC-MM assessment framework as shown in Table 7 consists of five layers, namely, main maturity, sub-maturity, process area, goal, and practice. The main maturity is test employee capability which can be broken down into four sub-maturities levels, i.e., technicality, management, business, and personality. Each sub-maturity is made up of four process areas but conveys different assessment viewpoints according to sub-maturity:
1) Capability Analysis: consisting of four specific goals and nine specific practices;
2) Capability Development: consisting of four specific goals and eight specific practices;
3) Training and Development: consisting of three specific goals and eight specific practices;
4) Continuous Capability Improvement: consisting of five specific goals and fifteen specific practices.
Moreover, each process area encompasses in three generic goals and eight generic practices.
3.2. TEC-MM Rating
The bottom row of Table 7 depicts three rating methods. The main and sub-maturity layers employ the maturity level rating, process area layer uses capability level rating, and goal/practice layers utilize process area rating. Details of process area rating, capability level rating, and maturity level rating are depicted in Tables 8, 9 and 10, respectively.
The rating methods are adopted from CMMI and TMMi [15]. All specific and generic practices are rated by percentage of practice achievement, where process area rating is weighed by five scoring levels.
The capability level of each process area is rated in four
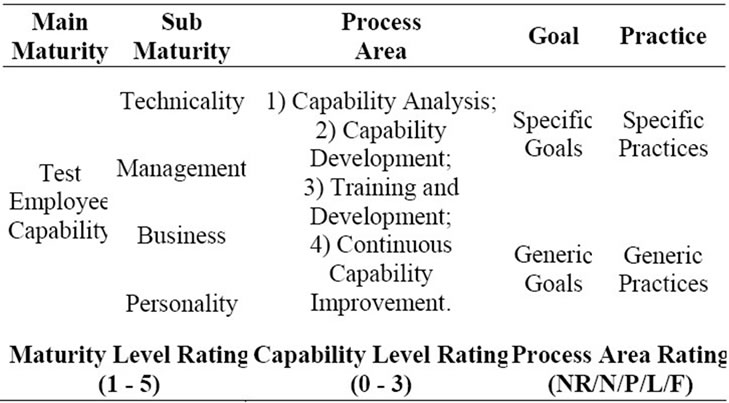
Table 7. TEC-MM assessment framework.

Table 8. Process area rating.
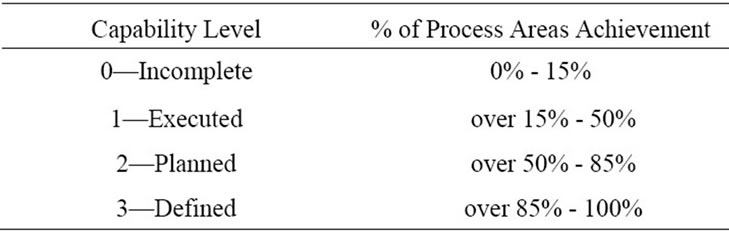
Table 9. Capability level rating.
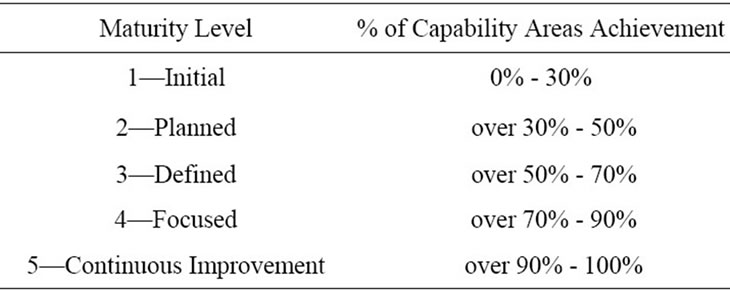
Table 10. Maturity level rating.
scoring levels from 0—Incomplete to 3—Defined. The percentage of process areas achievement is calculated from weighted average scores of specific and generic practices.
The maturity level rates the main and sub-maturity layers using five scoring levels from 1—Initial to 5— Continuous improvement. Test employee capability is thus compared by the levels of rating to assess their strengths and weaknesses. The results of main maturity rating can be further used to compare level of maturity among organizations within software test industry.
4. Data Collection and Analysis
A survey was devised to collect data and evaluate the results obtained from the proposed model. The population and sample of this study were from a test personnel list of test teams. They are shown in Table 11. The test organization mandated the test team to be separated from the development team. Subsequent test organizational policy would impose a test personnel development plan to provide the necessary test resources in the future.
This study is based on data collected via in-depth interview and operating documentation. We invited four roles and two levels of test team staffs, namely, test manager/test leader at management level, and tester/test architect at non-management level. They were further categorized into two groups. The first group consisted of inexperienced personnel having 0 - 2 years of working experience. The second group was experienced personnel with over two years of working experience.
We classified staffs’ interests in eight different groups that were identified in Figure 1. Moreover, the personnel groups were arranged in four scenarios to compare intergroup characteristic differences.
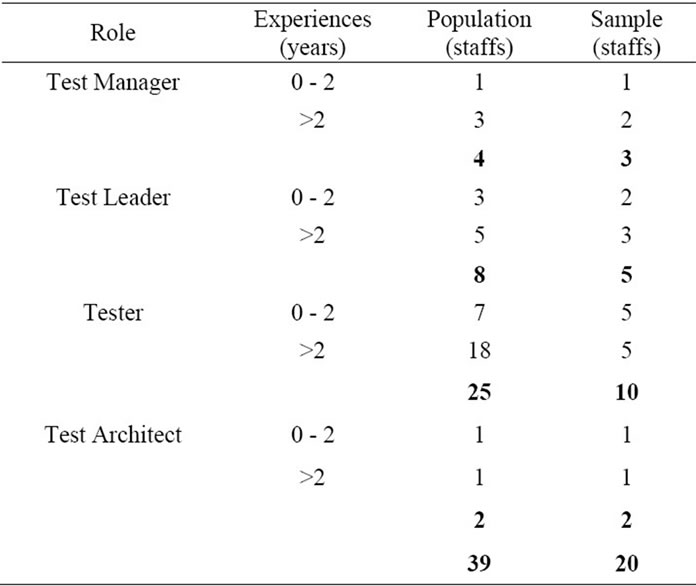
Table 11. Population and sample data.
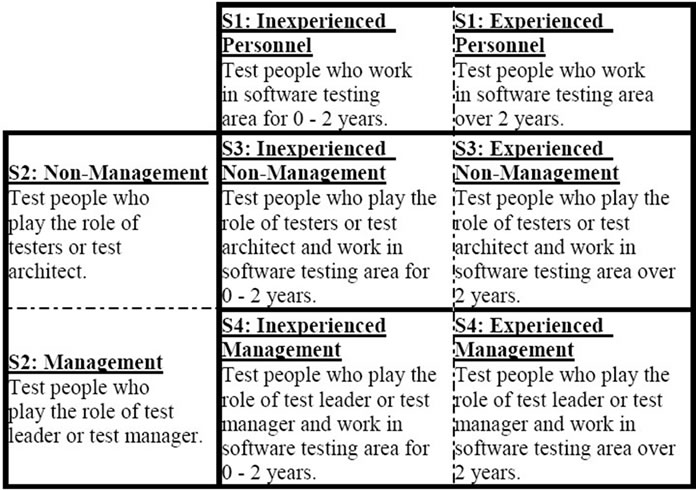
Figure 1. Eight personnel groups, four scenarios.
A total of 39 test staffs from the population showed willingness to participate in this research, from which 20 test staffs (three test managers, five test leaders, ten testers, and two test architect) attended the interview. The sample data covered all personnel groups and scenarios.
The interview questions consisted of two parts. The first part collected general information such as education background, work experiences, and work attitudes. The second part delved into their capabilities and skills which involved specific and generic practices of each process area in all sub-maturity models.
A number of relating documents were requested to support their answers. To cross-checking among different groups, we provided questions about their opinion on other groups. For example, the non-management commented management capabilities while the management expressed the opinion in view of non-management.
For data analysis course, the percentage achievements of specific and generic practices were computed. A follow up validation of the rating was discussed with representative of each group. After validation, the capability and maturity level ratings were performed.
5. Results: A Case Study with 4 Scenarios
The industrial practice results obtained from the proposed evaluation are elucidated in accordance with the aforementioned four subsections scenarios.
5.1. Inexperienced and Experienced Personnel
The objective of this scenario is to find gaps between test inexperienced and experienced personnel or simply put between juniors and seniors testers on non-specific responsibilities. The results for this study are shown in Figures 2 and 3.
While management skill was the widest gap between the two groups, three process areas remained at the lowest level (10.29% of capability analysis, 7.81% of capability development, and 10.94% of training development). Most process areas of personality for inexperienced personnel showed higher achievement than the others which was reflected in the comparative maturity level of submaturity models as shown in Figure 2.
For experienced personnel, the level results of technicality, management, and business in sub-maturity were better than others, while only the personality of inexperienced personnel reached level 3, but the percentage difference was insignificant (58.94% of inexperienced personnel as oppose to 47.11% of experienced personnel).
The percentage of experienced personnel is higher than the other group as shown in Figure 3. We found that most gaps occurred from the lack of knowledge, skills, and experiences. These were the weak points of inexperienced personnel. Similarly, gaps stemming from the
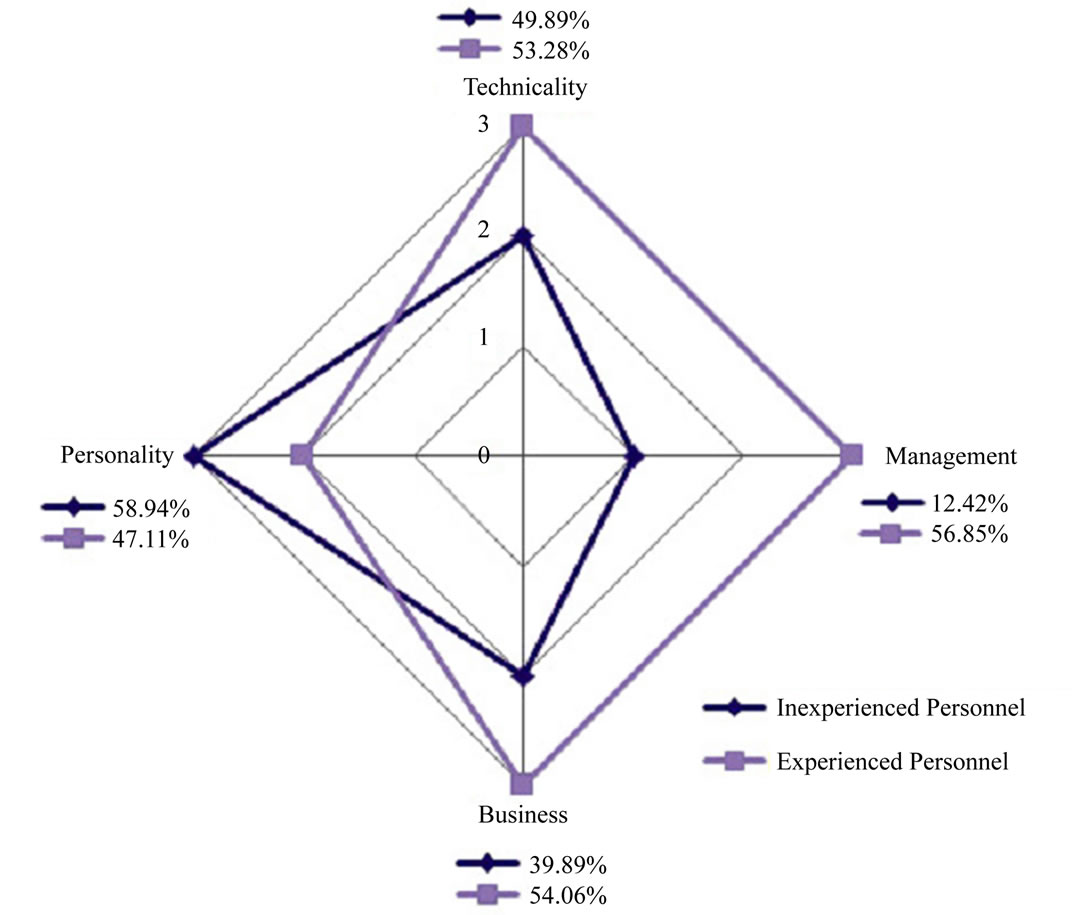
Figure 2. Maturity levels of sub-maturity models.
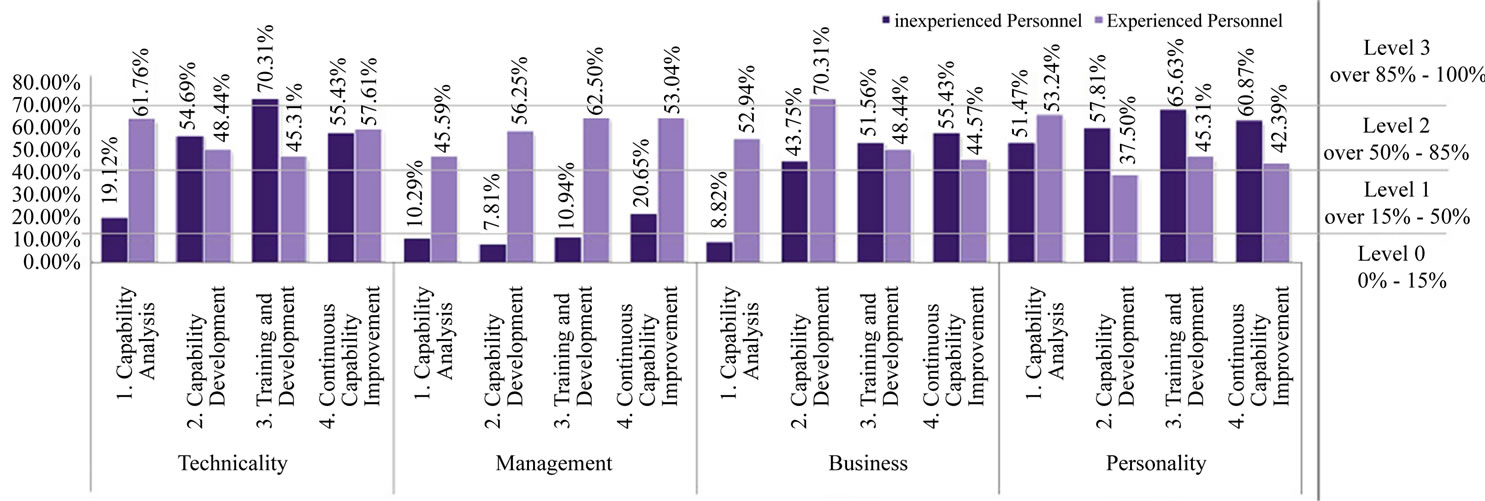
Figure 3. Capability levels of process areas by sub-maturity models for the first scenario.
weak points of experienced personnel were the lack of motivation, enthusiasm, determination, and continuous self-study, which was just opposite to inexperienced personnel who had more intention, commitment, and eagerness to increase potentiality, and develop skills.
The gap bridging of this scenario needs to focus on capability and training development for inexperienced personnel, while encouraging working potential of experienced personnel. Furthermore, experienced personnel should lend a helping hand to the other group for knowledge management and sharing. In return, new ideas from the starters need to distribute to seniors.
5.2. Non-Management and Management
Figures 4 and 5 present the results of the second scenario that is set out to find the gaps in different roles between non-management and management.
This scenario does not concern about experience because the range of experience for both non-management and management spans from 0 to 20 years. For example, some test managers have 0 - 1 years of experience in software testing, but already possess 10 - 15 years of experience in software development.
Capability analysis of all viewpoints revealed that nonmanagement staffs were very strong technically (86.76%),
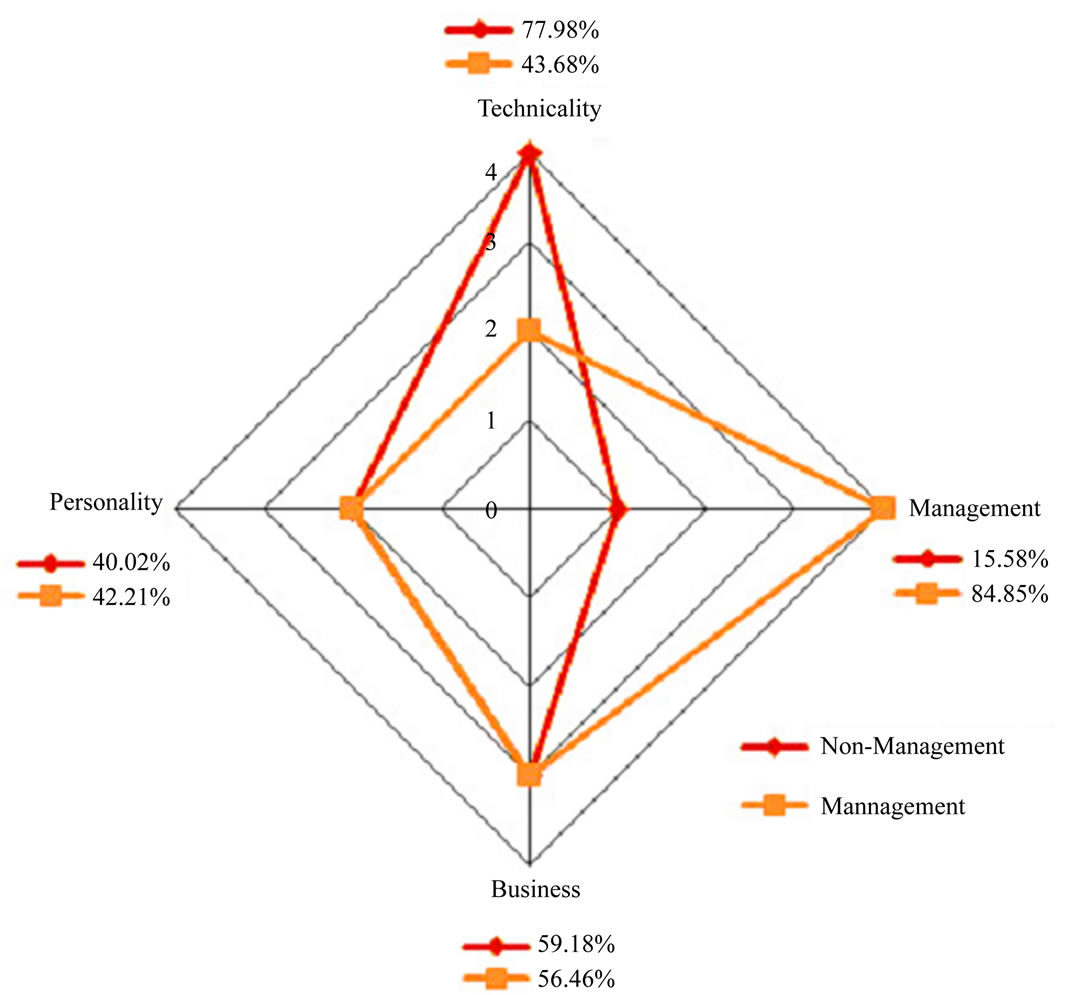
Figure 4. Maturity levels of sub-maturity models.
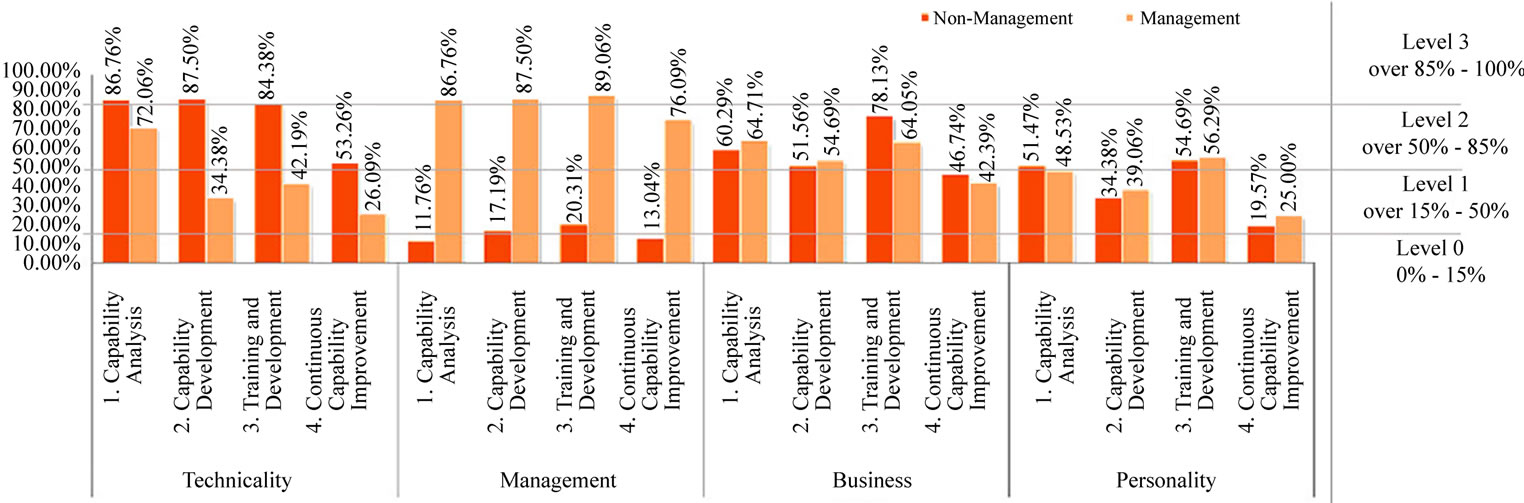
Figure 5. Capability levels of process areas by sub-maturity models for the second scenario.
but they were very weak in managerial skills (11.76%). Nevertheless, they were not significantly different in business and personality measures.
The interesting points which are different from the first scenario results are technicality percentages for nonmanagement group in capability development, training and development, and continuous capability improvement (87.50%, 84.38%, and 53.26%, respectively). The numbers were higher than the other group despite their expertise in this field. On the other hand, management percentages for management group in all four areas surpassed their counterpart considerably.
The above noteworthy results unveiled the culprit of the big gaps that were culminated from negligence of continuous improvement on employees’ deficiencies. The two levels of technicality and three levels of management discrepancies as evident in Figure 5 indicated where employees’ capability should be filled.
A viable approach to bridge the gaps of this scenario is to instill knowledge improvement through training and sharing between groups. In addition, the shortfall of personality in both groups at level 2 must be supplemented by soft skill trainings or other supporting activities.
5.3. Inexperienced Non-Management and Experienced Non-Management
We have built this scenario for gap assessment of academia and industry. Inexperienced non-management represents academia in software testing and engineering, while experienced non-management represents the status of software testing industry. The results for this study are shown in Figures 6 and 7.
For capability analysis, inexperienced nonmanagement staffs had lower principal capabilities than their counterpart at 14.71%, 8.82%, and 5.88% in technicality, management, and business, respectively, while they had been exercised better level of personality. For overall pictures, both groups had good development plans at present and future in technicality and personality, but lacked strong support in management and business as evident by 13.04% and 46.74% of continuous capability improvement for management, and 31.52% and 22.83% of continuous capability improvement for business.
Figure 7 shows a few gaps between academia and industry. An equal level of technicality and business and
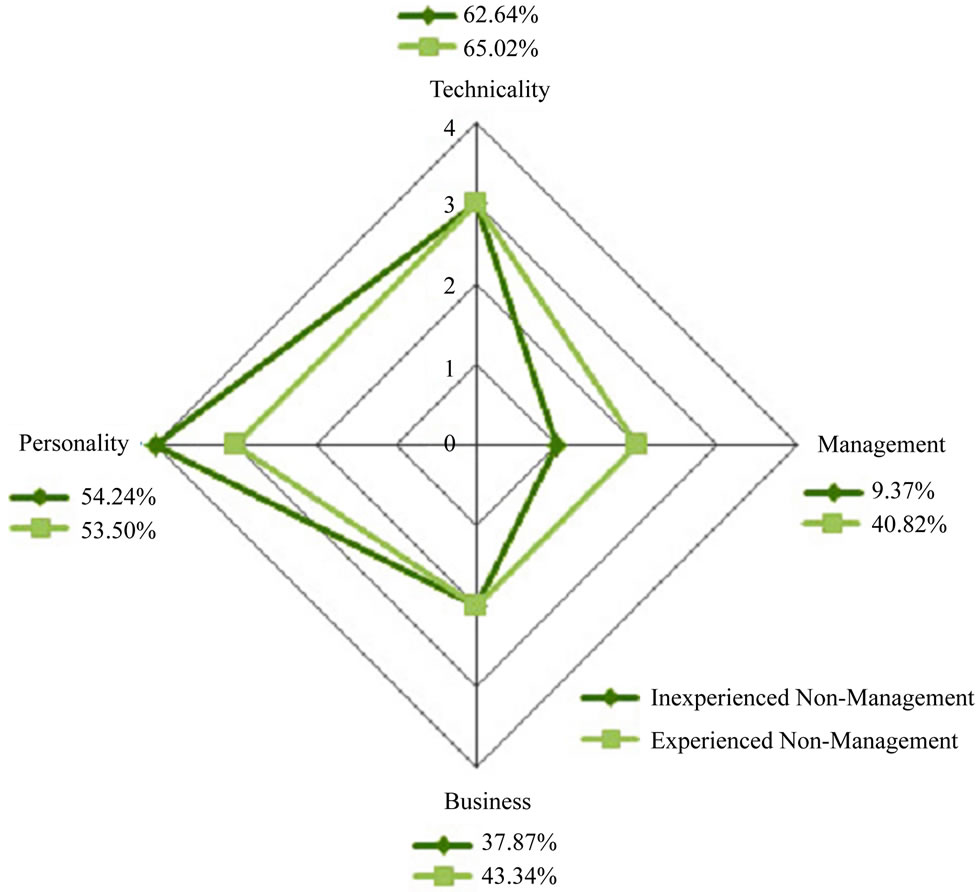
Figure 6. Maturity levels of sub-maturity models.
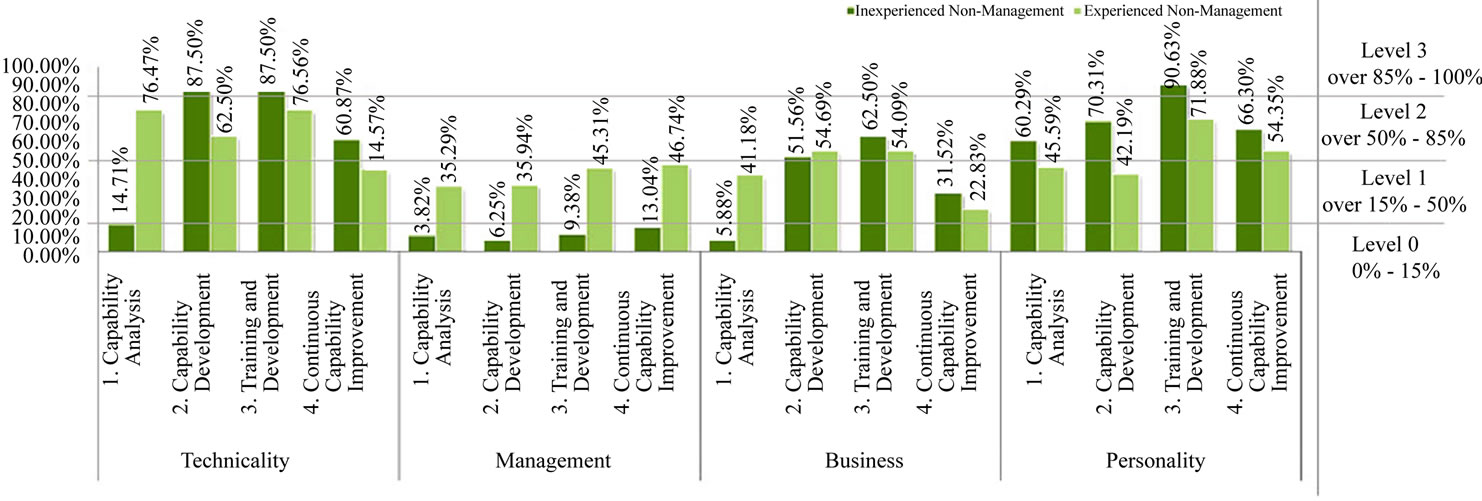
Figure 7. Capability levels of process areas by sub-maturity models for the third scenario.
onelevel for management and personality reflect a well balance of capability standard. In practice, however, we need to separately focus on capability analysis which portrays current situation, while development and improvement represent the present and future status.
A case in point about gaps in this scenario that are gradually diminishing by personnel development are the direct result of willingness to improve individual potential and skill on the part of inexperienced non-management staffs. Other existing big gaps include technicality (14.71% of inexperienced staffs and 76.47% of experienced staffs) and business (5.88% of inexperienced staffs and 41.18% of experienced staffs).
We found that the knowledge from academia was based on the theory while the knowledge from industry was the practice or applied testing techniques. Moreover, inexperienced personnel were conducting the projects in classroom environment bearing numerous limitations and conditions that set them apart from those in industry.
These gaps needed practice or on the job training to fill. Collaboration between universities and companies had to be initiated by government or supporting organizations to reconcile the differences between industry environment and university labs. Both sides should exchange the theoretical knowledge and practical know-how to bridge the gaps. One small note was about graduating students who should dedicate more of their internships at the company.
5.4. Inexperienced Management and Experienced Management
Management roles are important to drive the success of a project. In fact, many management personnel in software testing have moved from development role such as project manager, system analyst, and technical specialist. This scenario will explain about the gaps between different administrative experiences of management levels. The results are shown in Figures 8 and 9.
The overall results showed that both groups were not much different in management, business, and personality. Technicality was the only part that exhibited achievement gap at 25.00% or level 1 for the inexperienced group and 64.71% or level 2 for the inexperienced group.
For effective management, the new management staffs needed more practice on capability development and technical training that were provided by the organization, as evident by 67.19% of capability development and 92.19% of training development for inexperienced. As far as the gap of technicality was concerned, continuous capability improvement should be placed on these two process areas.
Some plans were underway to offer better benefits such as welfare, position, etc., hoping to compensate for staffs’ personality. This was due to the results from inexperienced management at 54.24% of level 3, while experienced management was at 44.85% of level 2.
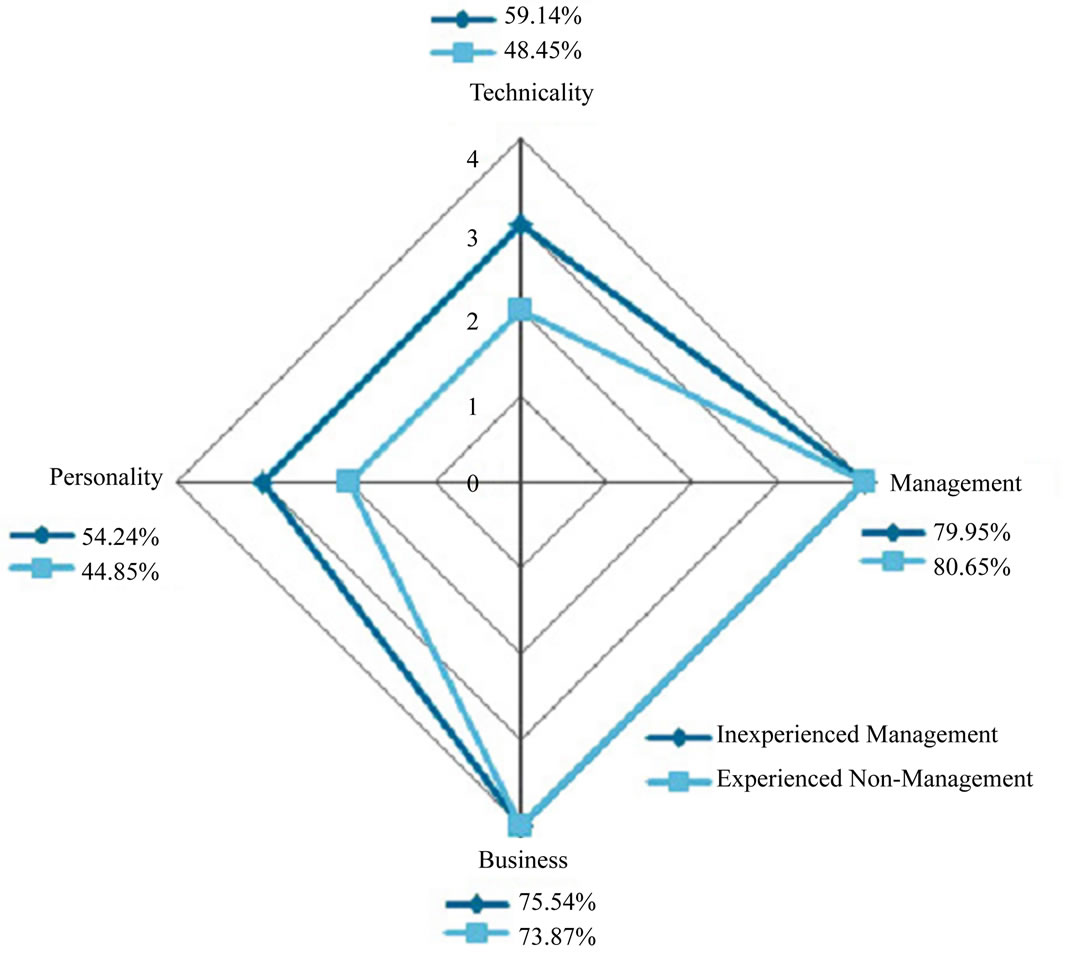
Figure 8. Maturity levels of sub-maturity models.
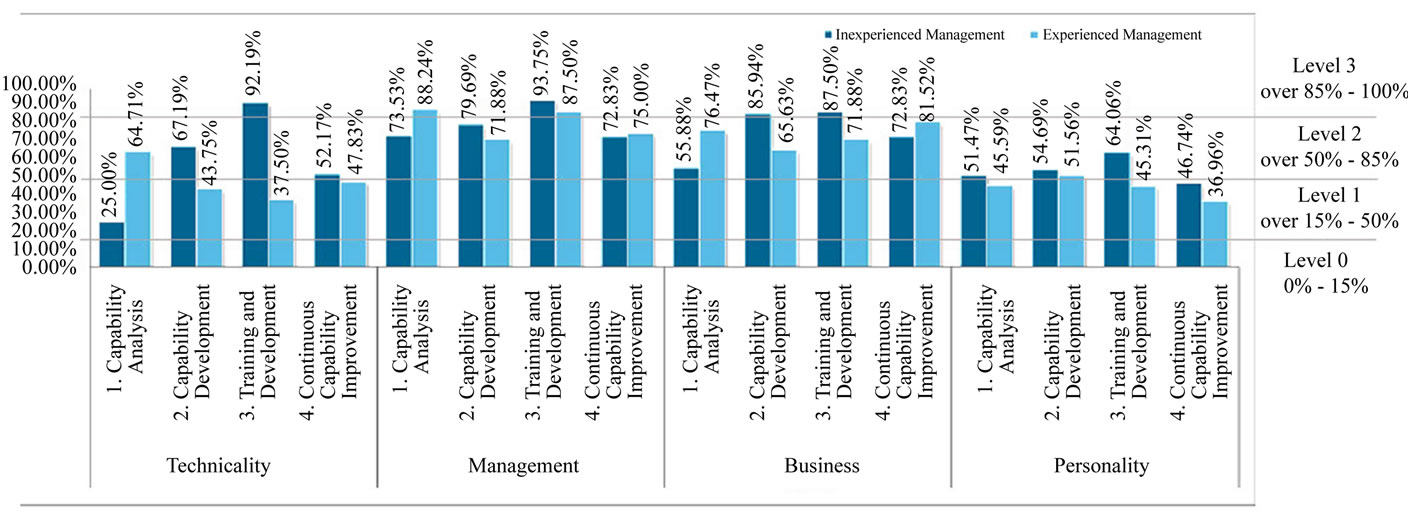
Figure 9. Capability levels of process areas by sub-maturity models for the fourth scenario.
On a brighter note, management and business were the best assessment with levels 2 and 3 of four process areas for both groups.
6. Conclusions
This study has provided an empirical survey to support our model building. The survey results showed that most test organizations lacked the principal personality of software testing. Most test people paid more attention to administration (test planning and management) and test proficiency (test skill and technique).
TEC-MM was proposed to assess test people capability in four areas, namely, capability analysis, capability development, training development, and continuous capability improvement, in four dimensions, i.e., technicality, management, business, and personality.
This study also provided an industrial case study that conveyed gap assessment framework covering four scenarios such as inexperienced and experienced personnel for different experience gaps, non-management and management for different role gaps, inexperienced and experienced non-management for academia-industry gaps, and inexperienced and experienced management for different experience and role gaps. Figure 10 summarizes gap analysis on the four scenarios of all four areas.
Special emphasis should be placed on management gap of scenario 2 and technicality gap of scenario 3 so that proper recommended course of action would be taken. Since this study only focuses on gap investigation, the benefits from our findings can serve as the aforementioned recommendations. Therefore, we plan on exploiting test strategy and human resource management to bridging the gaps using full options of TEC-MM. Further research will deploy this TEC-MM in various test organizations with different constrained factors.
7. Acknowledgements
This study was financially supported by The 90th Anni-
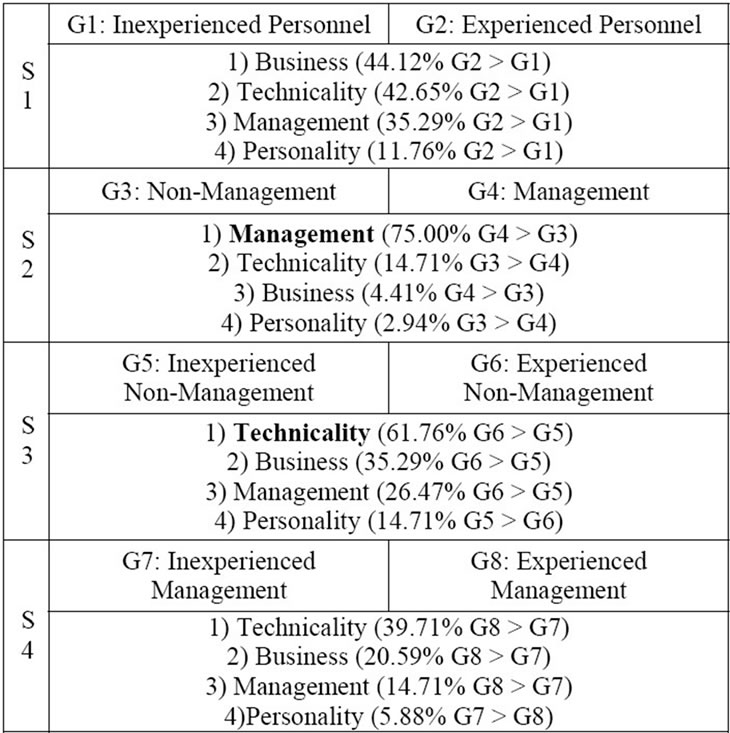
Figure 10. Gaps of four scenarios.
versary of Chulalongkorn University Fund (Ratchadaphiseksomphot Endowment Fund), Chulalongkorn University. The authors wish to acknowledge all interviewees of the case studies for their invaluable inputs and comments.
REFERENCES
- E. Dustin, “Effective Software Testing: 50 Specific Ways to Improve Your Testing,” Addison-Wesley Longman Publishing, Boston, 2002.
- A. M. J. Hass, “Guide to Advanced Software Testing,” Artech House, Norwood, 2008.
- D. Graham, E. Van Veenendaal, I. Evans and R. Black, “Foundations of Software Testing: ISTQB Certification,” Thomson Learning, Stamford, 2007.
- R. L. Glass, R. Collard, A. Bertolino, J. Bach and C. Kaner, “Software Testing and Industry Needs,” IEEE Software, Vol. 23, No. 4, 2006, pp. 55-57. doi:10.1109/MS.2006.113
- L. Briand and Y. Labiche, “Empirical Studies of Software Testing Techniques: Challenges, Practical Strategies, and Future Research,” ACM SIGSOFT Software Engineering Notes, Vol. 29, No. 5, 2004, pp. 1-3. doi:10.1145/1022494.1022541
- T. Parveen, S. Tilley and G. Gonzalez, “A Case Study in Test Management,” Proceedings of the 45th Annual Southeast Regional Conference, Winston-Salem, 23-24 March 2007, pp. 82-87.
- A. Bertolino, “The (Im)maturity Level of Software Testing,” ACM SIGSOFT Software Engineering Notes, Vol. 29, No. 5, 2004, pp. 1-4. doi:10.1145/1022494.1022540
- J. J. Ahonen, T. Junttila and M. Sakkinen, “Impacts of the Organizational Model on Testing: Three Industrial Cases,” Empirical Software Engineering, Vol. 9, No. 4, 2004, pp. 275-296. doi:10.1023/B:EMSE.0000039880.99096.af
- N. Juristo, A. M. Moreno and W. Strigel, “Guest Editors’ Introduction: Software Testing Practices in Industry,” IEEE Software, Vol. 23, No. 4, 2006, pp. 19-21. doi:10.1109/MS.2006.104
- CMMI Product Team, “CMMI for Acquisition, Version 1.3,” Technical Report, Carnegie Mellon University, Pittsburgh, 2010.
- CMMI Product Team, “CMMI for Development, Version 1.3,” Technical Report, Carnegie Mellon University, Pittsburgh, 2010.
- CMMI Product Team, “CMMI for Services, Version 1.3,” Technical Report, Carnegie Mellon University, Pittsburgh, 2010.
- B. Curtis, B. Hefley and S. Miller, “People Capability Maturity Model (P-CMM) Version 2.0,” Technical Report, Carnegie Mellon University, Pittsburgh, 2009.
- H. F. Kaiser, “An Index of Factorial Simplicity,” Psychometrika, Vol. 39, No. 1, 1974, pp. 31-36. doi:10.1007/BF02291575
- http://www.tmmifoundation.org/downloads/tmmi/TMMi%20Framework.pdf