Journal of Service Science and Management
Vol.7 No.3(2014), Article
ID:47255,13
pages
DOI:10.4236/jssm.2014.73020
Using Modified IPA to Improve Service Quality of Standard Hotel in Taiwan
Li-Hsing Ho1, Shu-Yun Feng2, Tieh-Min Yen1*
1Department of Technology Management, Chung-Hua University, HsinChu, Taiwan
2Departmant of Hospitality Management, Chung-Hua University, HsinChu, Taiwan
Email: *ytm1129@ms48.hinet.net
Copyright © 2014 by authors and Scientific Research Publishing Inc.
This work is licensed under the Creative Commons Attribution International License (CC BY).
http://creativecommons.org/licenses/by/4.0/


Received 18 October 2013; revised 16 November 2013; accepted 11 December 2013
ABSTRACT
The purpose of this paper is to establish the modified IPA (Importance-Performance Analysis) methodology for service quality characteristics and improvements in the hotel industry. Traditional IPA methodology has its shortcoming as it assumes that importance-performance is a normal distribution. However, if that is not the case, the traditional IPA model cannot correctly identify the priority for improvements. Therefore, this paper runs Box-Cox Transformation to convert data into normal distributions, in order to perform statistical analyses and comparisons on a likefor-like basis. This approach avoids the potential problem of the IPA model but maintains its simple and intuitive decision-making model. This paper examines standard hotels and performs literature reviews and experts’ interviews in order to establish the list of service quality characters for the hotel industry. It also conducts a survey to illustrate the application and benefits of the modified IPA method, so as to identify the key characteristics of the service quality and the ways to improve service quality of standard hotels.
Keywords:Standard Hotels, Service Quality, Importance-Performance Analysis, Box-Cox Transformation, SERVQUAL

1. Introduction
Most of the studies on the constructs of service quality of hotels are based on SERVQUAL, a service quality framework developed by Parasuraman et al. [1] . Many scholars examine the constructs and characteristics of service quality of hotels and they find that there are large variances in such constructs and characteristics [2] -[9] . Some scholars establish service quality measurements exclusively for the hotel industry, e.g. LODGQUAL developed by Getty and Thompson [10] and HOLSERV developed by Wong et al. for Australian hotels [11] . However, there is no established list of constructs and characteristics of service quality for standard hotels in the context of international perspectives so that this list can serve as a benchmark for consumers, hoteliers and government agencies in the assessment of hotel performances and service quality in Taiwan.
The basic concept of IPA is to gain an understanding of the perceived importance of service quality from the customers’ perspectives and experience via market surveys. The purpose is to measure the levels of satisfaction and perceived quality characteristics, establish a two-dimension analysis of importance-performance and identify the strategic actions required [12] -[14] . Since the development of marketing strategies with the use of the IPA method by Martilla and James [15] , this method has been widely applied in many industries [14] [16] -[21] . Martilla and James emphasize that the IPA model boasts a number of advantages, i.e. low costs, ease of applications, better focuses and strategic recommendations [15] . It is also possible to analyze the strengths and weaknesses of an organization based on market surveys. Therefore, this paper adopts the IPA decision-making methodology as the tool to examine the service quality of standard hotels.
Over the recent years, some scholars attempt to modify the traditional IPA model in order to make it more realistic. These innovative researches on IPA find that importance and performance are correlated [22] -[24] . Matzler et al. apply multiple regression analyses to deduct the relative importance of quality characteristics, i.e. implicit importance [25] . It is a relative importance based on coefficients.
All these scholars make significant contributions to the IPA methodology. However, the traditional IPA model has potential problems: statistical analyses and scale-based data collected usually do not meet its assumption of normal distributions [13] [16] . Garver also believes that the assumption of normal distributions is seldom realistic [26] . As a result, the use of arithmetic means of skewed data as a benchmark makes it difficult to correctly identify the priority for service quality improvements [16] . This paper proposes an IPA methodology modified with Box-Cox Transformation and illustrates its applications and benefits by examining the service quality of standard hotels.
2. Literature Review
2.1. Service Quality of Hotel Industry
The discussion of service quality has been based on PZB model over the recent years. Parasuraman et al. believe that service quality is measured by the gap between ex-ante expectations and ex-post perceptions [27] . They perform an exploratory study on four service industries, i.e. banking, credit cards, securities brokerage and product maintenance and establish the PZB service quality model. Parasuraman et al. conduct factory analyses to establish a service quality measurement of good credibility and validity [1] [28] . This measurement, known as SERVQUAL, consists of 5 constructs and 22 service quality questions. The five constructs are tangibility, reliability, responsiveness, assurance and empathy.
Most of the studies on the quality constructs and characteristics of the hotel industry are based on SERVQUAL developed by Parasuraman et al. [1] [28] . Akan modifies the SERVQUAL measurement with Likert 4 scales and 30 service quality constructs for the study on the hotels in Istanbul [2] . In his model, there are three service quality constructs, i.e. facilities, staff and service flows. Juwaheer examine the service quality of hotels in the perspective of international travellers with modified SERVQUAL [3] . He performs a Principal Component Analysis in order to extract 9 key characteristics from 39 service quality constructs for the hotel industry. These characteristics are reliability, assurance, perks, communication skills and values, accommodation attractiveness, considerate and accurate services, food and beverage, landscape and environments. Antony et al. examine the operational performances of hotels in the UK by adopting the PZB Gap Model and SERVQUAL to establish a list of 16 service quality characteristics [4] . They also conduct studies on service quality and operational performances from Gap 1 to Gap 4. Eccles and Durand explore the methods to improve service quality of hotels by referring Gap 5 of the PZB model and SERVQUAL and addressing practical issues [5] .
In addition to SERVQUAL and PZB model, literature reviews and experts’ opinions can also derive a list of service quality characteristics. Min and Min perform a study on service quality benchmarking of the hotel industry and comes up with two service quality constructs and 14 indicators [6] . They are 1) room values: cleanness, comfort, atmosphere, toiletry, prices, space and giveaways; 2) front-desk services: manner, real-timeliness, complaint processing, reservation, reception, leisure activities and relevant guidance and services. Min et al. perform a dynamic benchmarking of service quality of the hotel industry and divide service quality characteristics into two categories with a total of 20 items [7] . The additional items for room values are quietness, desk facilities, Internet, faxing and free local calls. The additional items for front-desk services are discounts and benefits of regular customers and flexible hotel policies. Desombre and Eccles refer to the service quality studies on the hotel industry as the reference for the improvements of medical service quality [8] . They come up with 12 service quality constructs, i.e. accessibility, visibility, usability, cleanness, comfort, communication, ability, etiquette, friendliness, reliability, responsiveness and safety. Tsang and Qu perform a study on the perspectives of travellers and hoteliers regarding service quality of hotels in China and summarize 35 service quality characteristics via literature reviews and experts’ opinions [9] . They are comforts and welcoming feelings, availability of service staff, professionalism, multiple languages, friendliness, etiquette, conference facilities and locations, etc. Knutson et al. develop LODGSERV, a service quality measurement for hotels [29] . Knutson et al. develop a list of 26 service quality characteristics for luxury hotels in order to measure the expectations of consumers [30] . Getty and Thompson formulate LODGQUAL, a service quality measurement for standard hotels in the US [10] . Getty and Getty come up with a list of 26 service quality characteristics in order to evaluate the quality perceived by consumers [31] . Wong et al. propose HOLSERV, a service quality measurement for hotels in Australia [11] . According to the above literature review, this paper finds large variances in service quality characteristics of the hotel industry as a whole. Due to a lack of service quality standards for hotels in Taiwan, it is hence necessary to establish a list of service quality constructs and characteristics of international perspectives, in order to facilitate the research work of this paper.
2.2. IPA Model
Martilla and James believe that market surveys can establish an understanding of the level of acceptance of specific quality characteristics by customers [15] . IPA provides a perfect solution. Data processing alone can analyze and understand four types of quality characteristics and develop strategic actions for the quality characteristics in each of the four quadrants. It is easy to interpret and formulate strategic actions accordingly, as shown in Figure 1. The interpretation of the IPA matrixes is defined with the four quadrants:
Concentrate here, C: Customers believe the product or service quality characteristic is highly important, but the organization fails to perform.
Keep up the good work, K: Customers believe the product or service quality characteristic is highly important, and the organization performs well.
Low priority, L: Customers do not think the product or service quality characteristic is important and the organization fails to perform too.
Possible overkill, P: Customers do not think the product or service quality characteristic is important, but the organization performs well.
After the publication of IPA Analysis by Martilla and James, many renowned scholars come up with modified statistical models. Yavas and Shemwell refer to the integrated relative importance as a weighted indicator to replace the importance represented with the vertical axis [32] . They also use relative performance by measuring the variance in performance of quality characteristics between the organization in question and its competitors. This is then multiplied with importance. The product is used to replace the performance represented with the

Figure 1. Importance-performance matrix.
vertical axis. Tarrant and Smith refer the standard deviations of the mean of quality characteristics to modify IPA [33] . Matzler and Sauerwein believe that self reports by customers cannot represent the true importance of quality characteristics [25] . They also prove that the importance as described by customers themselves is not a function of the satisfaction with quality characteristics. Explicit importance is the function of the satisfaction with quality characteristics. This is deducted from a multiple regression equation for k number of quality characteristics as performance as an independent variable (Xi) and overall satisfaction as a dependent variable (Y). The function can be expressed as , with ε denoting the error item. The coefficient βi indicates the influence of the i-th quality characteristic on the overall satisfaction. Matzler and Sauerwein believe that the importance of quality characteristics perceived by customers should be measured with the coefficients derived with multiple regression equations [25] . Lee et al. argue that the absolute values of the coefficients should be used [19] . Meanwhile, the model fit of the regression equation is the key because it indicates the credibility of importance. Sampson and Showalter propose a dynamic model to prove the changes of organizational performances because it will also change the importance perceived by customers [24] . This is mainly because the coefficient between importance and performance is not zero.
Despite the major contributions from many scholars to the IPA methodology, the problem remains: questionnaire surveyed data do not meet with the assumption of a normal distribution [16] [18] . Therefore, this paper converts data with Box-Cox Transformation so that the converted data meet the assumption of a normal distribution. This approach modifies the traditional IPA model and avoids analysis errors and decision mistakes.
3. Research Design
3.1. Research Subjects
This paper intends to construct a list of service quality constructs for standard hotels in Taiwan in order to assist them to improve service quality and satisfy the accommodation needs of customers. The research subjects include hotels, hostels, homestays, vacation centers, motels and guest houses.
3.2. Research Method
This paper sources data of the past 20 years from Emerald and Science Direct, two databases for literature analyses and generalizations. Interviews with experts are performed in order to gather opinions from consumers, hoteliers, scholars and government officials about service quality required for standard hotels. This paper summarizes a list of service quality characteristics as a basis for the questionnaire survey and issues the questionnaires on a random-sampling basis in accordance with the number of hotels in different regions. The gathered data is converted with Box-Cox Transformation to facilitate analyses in the modified IPA model. The purpose is to formulate strategies to improve service quality of standard hotels.
3.3. Questionnaire Design
The questionnaire on the importance and performance of service quality characteristics for standard hotels is measured with Likert 5 scale. The purpose is to gain an understanding of the quality perceived by customers and the performance of standard hotels. The performance is measured with the scale of 1 to 5, with 1 indicating very much dissatisfied and 5 indicating very satisfied. Similarly, the importance is also measured with the scale of 1 to 5, with 1 indicating very unimportant and 5 indicating very important. Basic data of the respondents is also required.
3.4. Box-Cox Transformation
Data conversion is critical to statistical analyses. If data is not in a normal distribution, the analysis will be biased. Data comparisons are only possible when linear relationships, independence and normality are in line. It is necessary to test data before any statistical analyses. If data are not in compliance with assumptions, data conversions become necessary [34] .
It is usually desired that converted data is close to a normal distribution and the mean and variances are independent from each other. In other words, converted data have fixed error variances. Table 1 list a number of frequently seen data conversion modes [34] :

Table 1. Commonly seen data conversion methods.
It is necessary to understand the relationship between the means and variances of the data in order to select an appropriate data transformation mode. However, it is still difficult to perform analyses. Therefore, Box and Cox applies maximum likelihood method to deduct Equation (1) for data conversion and to estimate parameter  [35] .
 (1)
(1)
Let  be the geometric mean of the observed values.
  method identified the
  value that minimizes the square sum of errors, i.e.
 . Usually, a graph is plotted with
  vs.
vs.  to facilitate the identification of the
  value that minimizes
  or deduct
 , the maximum log-likelihood function of
 . The best conversion value can maximize
  value of the maximum log-likelihood function
 , as shown in Equation (2).
 (2)
(2)
Let 
Box-Cox Transformation is known for its compliance of the basis assumption for linearility, normality and homomoscedasticity. It is also a widely applied method [36] . This paper converts the data collected with IPA questionnaires with Equation (1) and Equation (2) on important-performance, so that the data become compliant with the statistical assumptions.
3.5. IPA Model Modified with Box-Cox Transformation
Hansen and Bush suggest that IPA is considered a simple and effective tool [37] . It can help to decide how to effectively utilize limited resources and achieve the maximum customer satisfaction. This paper converts the two-axis IPA dimensions into statistics of normal distributions, as shown in Figure 2. Central tendency is measured with means, and means are referred to as the cut-off values for the two axes forming four quadrants. The definitions of the four quadrants are the same as the IPA proposed by Martilla and James [15] . This makes interpretation and decision-making easy and straightforward.
This paper recovers the questionnaires and converts the data with Equations (1) and (2), in order to establish a modified IPA matrix for analyses and comparisons. The purpose is to provide the information required for service quality improvements and action plans in the hotel industry.
4. Results & Analysis
4.1. Service Quality Characteristics of Standard Hotels
This paper refers to the five service quality constructs developed by Parasuraman et al. [1] [28] and develops the list of service quality characteristics by sourcing data of the past 20 years from Emerald and Science Direct. Table 2 shows the list of service quality characteristics established with literature reviews and interviews with

Figure 2. IPA matrix modified with Box-Cox Transformation.
12 experts, hoteliers, scholars and government officials [7] [9] [31] [38] [39] .
Most of the interviewed hoteliers, scholars and government officials indicate that the list of service quality characteristics summarized on the basis of literature reviews can serve as a starting point for service quality assessments. However, some hoteliers, scholars and government officials suggest that “hotel marketing” and “merchandize selling” should be added to the construct of “tangibility”. Hotel marketing refers to advertising and websites. Merchandize selling refers to the sale of souvenirs. Hoteliers interviewed suggest that “appropriate support to staff to provide better services” should be added to the construct of “assurance”. Scholars and government officials recommend that “deployment of barrier-free space and toilets for mother and children” should be added to the construct of “empathy”. Table 2 summarizes the list of service quality characteristics for the questionnaire survey based on the interviews with experts.
4.2. Reliability & Validity Analysis
This paper performed random sampling of standard hotels in different regions by issuing 350 questionnaires in Taiwan. With 317 questionnaires recovered, the recovery rate was 90.571%. After the elimination of 39 invalid questionnaires, this paper has 278 valid questionnaires.
This paper performs analyses on reliability and validity after the recovery of the questionnaires. The Cronbach’s α values of respective importance constructs are 0.768 for tangibility, 0.757 for reliability, 0.955 for responsiveness, 0.931 for assurance and 0.882 for empathy. The Cronbach’s α for importance, 0.920, is higher than 0.7, and hence it is considered to be of high reliability [40] . This shows that the research content has a high degree of internal consistency. The factor loading of respective constructs is 0.448 for tangibility, 0.351 for reliability, 0.849 for responsiveness, 0.876 for assurance and 0.384 for empathy. The values for reliability and empathy are close to 0.4, and the values for the other three constructs are all above 0.4. The P-value of the reliability construct is 0.062, but those of other constructs are all 0.000 < 0.001, reaching statistical significance. This shows that these variables carry convergent validity.
Similarly, the Cronbach’s α values of respective satisfaction constructs are 0.897 for tangibility, 0.842 for reliability, 0.909 for responsiveness, 0.918 for assurance and 0.860 for empathy. The Cronbach’s α for satisfaction, 0.950, is higher than 0.7, and hence it is considered to be of high reliability [40] . This shows that the research content has a high degree of internal consistency. The factor loading of respective satisfaction constructs is 0.651 for tangibility, 0.751 for reliability, 0.816 for responsiveness, 0.817 for assurance and 0.824 for empathy. All the values are above 0.4 and P-values are all 0.000 < 0.001, reaching statistical significance. This shows that these variables carry convergent validity.
4.3. IPA Analysis Post Box-Cox Transformation
Take room comfort and atmosphere perceived by customers (T1) for example, the Kolmogorov-Smirnov test on importance and performance results in P-values of 0.118 > 0.05 and 0.010 < 0.05, respectively. Apparently, the
Table 2 . Service quality characteristics of standard hotels.
importance of room comfort and atmosphere (T1) meets the assumption of a normal distribution, but the performance does not. This paper calculates the means of importance and performance of service quality perceived by customers according to the traditional IPA method and the results are summarized in column 3 (importance) and column 4 (performance) in Table3 As Table 2 shows, the mean values of importance and performance of room comfort and atmosphere (T1) perceived by customers are 4.270 and 3.766, respectively. The mean values of importance and performance of quality characteristics are 3.995 and 3.658, respectively. The numbers are referred to as the basis for IPA quadrants. The service quality characteristics are divided into four categories. Take room comfort and atmosphere (T1) for example, this quality characteristic falls in the quadrant of high importance (4.270 > 3.995) and high performance (3.766 > 3.658). This means hotels should keep up the good work (K Strategy) for this service quality. Column 5 of Table 2 shows the strategic actions for other service quality characteristics.
Figure 3 illustrates a traditional IPA matrix, with most of the quality characteristics falling into K (Keep up the good work) and L (Low priority). Few of them are in C (Concentrate here) or P (Possible overkill) and all close to the intersection at the central point. It is difficult to determine, in Tarrant and Smith [33] , what the strategic actions should be called for. This paper refers to the average performance of quality characteristics as the independent variable and the average importance of quality characteristics as the dependent variable for the regression analysis. Adjusted R2 is 0.747. The F value in the ANOVA is 110.334, reaching statistical significance. This proves that importance and performance are correlated [22] -[24] , and hence it is difficult to determine strategic actions in a traditional IPA matrix, as argued by Sampson and Showalter [24] .
This paper converts the data with Box-Cox Transformation into 5 scales and normal distributions, in order to modify the IPA model. Take the importance of room comfort and atmosphere (T1) for example, this paper calculates the best conversion value with Equation (2) that allows the  to be at the maximum of 1.965 in maximum log-likelihood function of
 . This value introduced in Equation (1) derives the Box-Cox Transformation value of 2.720. This paper calculates the mean of the importance of room comfort and atmosphere (T1) perceived by customers to be 3.200. The means of the perceived importance of other service quality characteristics are calculated in the same way and the results are shown in Column 6 of Table3 Similarly, the performance of room comfort and atmosphere (T1) is calculated with Equation (2). The best conversion value allows the
  to be at the maximum of 2.052 in maximum log-likelihood function of
 . This value introduced in Equation (1) derives the Box-Cox Transformation value of 1.905. This paper calculates the mean of the performance of room comfort and atmosphere (T1) perceived by customers to be 1.765. The means of the perceived performance of other service quality characteristics are calculated in the same way and the results are shown in Column 7 of Table3
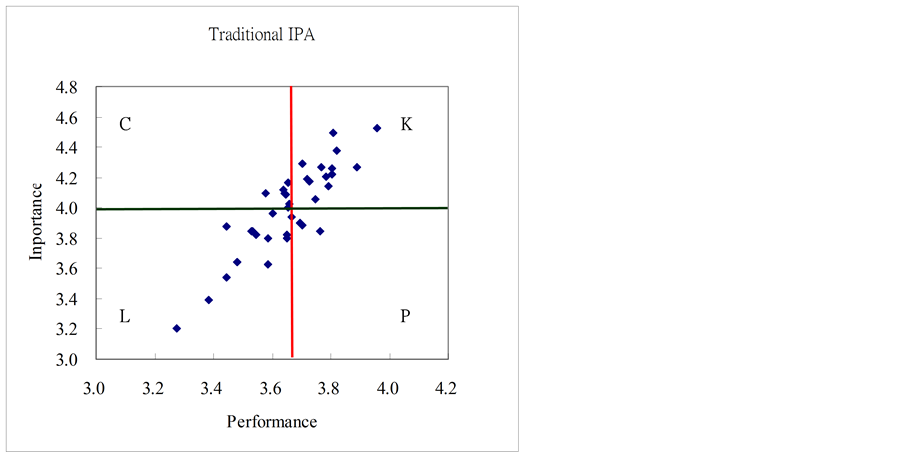
Figure 3. Traditional IPA matrix.
Table 3. IPA and BC-IPA analysis results.
According to Figure 4 and Table 3, the analysis based on the modified IPA model shows that safety (REL1), room privacy (REL3), and timely completion of promises made to customers (REL4) are in the quadrant of high importance and high performance. This means hotels should keep up the good work (K) in order to maintain competitive advantages. The service quality characteristics falling into the quadrant of high importance but low performance are neatness (T4), merchandize selling (souvenirs and specialty, T12), and hotel publicity (REL2). This means should concentrate her (C) immediately. The service quality characteristics falling into the quadrant of low importance and low performance are room comfort and atmosphere (T1), unique décor (T2), good views and landscape (T3), Parking space, size and convenience (T6), Modern facilities (Karaoke, TV, newspapers and magazines, T9), Comprehensive facilities (swimming pools, air-conditioners, conference rooms, saunas and Internet, T10), hotel marketing (advertising, websites, etc., T11), Ability of service staff to provide correct information (A1), professionalism of service staff (A2), trustworthiness of service staff (A3), consultation in sightseeing (E4), Deployment of barrier-free space and toilets for mother and children (E5), Whether employees speak foreign languages (E7), personalized attention to customers (E8), prioritization of customers’ best interest (E9) and understanding of special needs of customers (E11). These items are low priorities (L) that do not have high business risks. The service quality characteristics falling into the quadrant of low importance but high performance are geographic locations (T5), low prices (T7), well-groomed staff (T8), quiet rooms (T13), friendly staff (RES1), willingness to assist customers (RES2), ability to resolve problems for customers in a timely manner (RES3), services meeting the expectations of customers (RES4), customers feeling secure when interacting with service staff (A4), appropriate support to staff to provide better services (A5), mutual assistance among service staff to facilitate better services (A6), simple procedures to make reservations (E1), convenient accommodation (E2), convenient transportation (E3), food & beverages (E6), and service hours addressing the needs of customers (E10). These items are possible overkills (P). There is no need to invest any additional resources, but efforts should be made to other areas such as C and K [14] [18] .
4.4. Discussion
This paper refers to Tarrant and Smith [33] for the consideration of standard errors of the means of service quality characteristics, and focuses its discussion on the service quality characteristics falling into specific quadrants based on the data converted with Box-Cox Transformation. Neatness (T4) falls into K (Keep up the good work) in the traditional IPA analysis. However, the IPA analysis modified with Box-Cox Transformation finds it in the quadrant of C (Concentrate here). According to a study by Lewis and McCann [41] on failed services of hotels, business and leisure travellers think dirty rooms are the worst problem of all. Min et al. suggest that room neatness is the most important factor perceived by customers [7] . Tsang and Qu argue that there is a gap, statistically significant, between their expectations and the perception of room neatness [9] . Therefore, hoteliers must focus on this quality in order to avoid complaints from customers. Yang et al. examine business and leisure hotels in
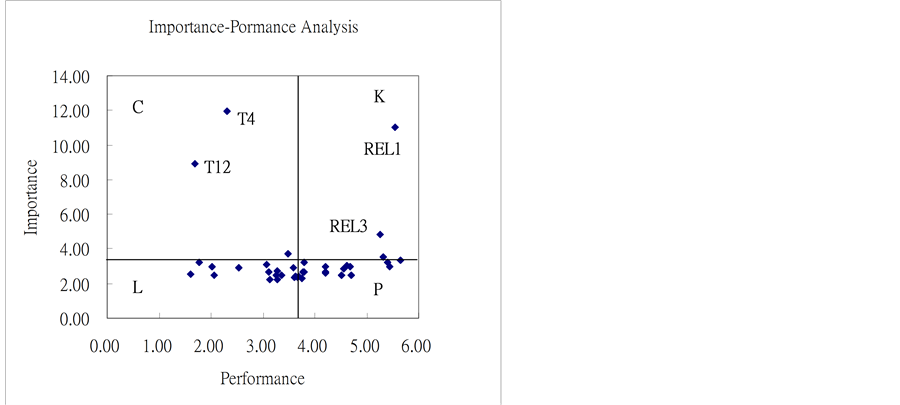
Figure 4. IPA matrix converted with Box-Cox Transformation.
Taiwan and find that neatness is a one-dimensional quality [38] . The better the neatness (T4), the higher customers’ satisfaction is. The traditional IPA decision-making model will determine it is to keep the good work. However, the IPA analysis with data converted with Box-Cox Transformation prompts hoteliers to continue to invest resources to improve neatness (T4), in order to develop differentiation and create competitive advantages [14] [42] [43] .
Merchandize selling (souvenirs and specialty, T12) falls into L (Low priority) in the traditional IPA analysis. However, the IPA analysis based on data converted with Box-Cox Transformation finds it fall into C (Concentrate here). This paper refers to the literature on service quality of hotels during the past 20 years and does not find the establishment of merchandize selling (souvenirs and specialty) as a service item. Meanwhile, according to the interviewed experts, most of the hotels do not sell merchandize (souvenirs and specialty, T12). Ottenbacher and Harrington believe that the servicing process is one of the innovations for hotels [44] . Therefore, they should sell merchandize (souvenirs and specialty, T12). The changes in customers’ perceptions can also be a source of service quality innovations. It is possible to improve performance of particular services and develop differentiation to create competitive advantages [14] . IPA analysis based on the data converted with Box-Cox Transformation highlights the importance of merchandize selling (souvenirs and specialty, T12).
Safety (REL1) and room privacy (REL3) fall into K (Keep up the good work) under both the traditional IPA analysis and the modified IPA analysis based on the data converted with Box-Cox Transformation. Tsang and Qu examine the hotel industry in China and find that the gap between the expectation and perception of safety (REL1) is small [9] . This means Chinese hotels perform well on this score. According to a study by Lewis and McCannon failed services of hotels, dangerous facilities and environments do not rank at the top of the complaint list of business and leisure travellers [41] . This means this quality meets the expectations of customers. Tseng examine the tourism hotels in Taiwan and suggest that safe environments and room privacy are causal criteria that influence the changes of other factors and serve as a competitiveness benchmark [39] . Yang et al. investigate the business and leisure hotels in Taiwan and find that safety (REL1) is a one-dimensional factor [38] . The safer it is, the higher the customers’ satisfaction. It is important and valuable to customers so hotels should keep up the good work to maintain competitive advantages [13] [45] .
5. Conclusions
This paper established 38 service quality characteristics for standard hotels after literature reviews and interviews with industry representatives, government officials, scholars and experts. Questionnaires were issued to consumers, and the service quality of the hotels was analyzed with the IPA model modified with Box-Cox Transformation. This paper concludes the following: It is necessary to “keep up the good work” (K) in safety (REL1) and privacy (REL3) of accommodation, in order to maintain competitive advantages. It is necessary to “concentrate here” (C) in neatness (T4) and sale of merchandize (souvenirs) (T212), in order to create differentiated market segments or the source of innovation.
This paper makes the following contributions: 1) Establishment of the list of constructs and service quality characteristics for standard hotels, as a reference for consumers, hoteliers and government agencies in terms of performance assessments; 2) The IPA method modified with Box-Cox Transformation to make data in compliance with the assumption for a normal distribution. This approach lays out the foundation for the IPA method in statistical analyses.
This paper establishes a measurement for service quality of standard hotels via literature reviews and experts’ interviews. Perspective of consumers is referred to in order to ensure the robustness of this list. It is suggested that future studies can perform factory analyses for exploratory analyses and empirical studies, in order to establish measurements of service quality for standard hotels. The IPA methodology modified with Box-Cox Transformation enables data to be in compliance with the assumption for a normal distribution. It is possible to apply the data converted with Box-Cox Transformation in the IPA linear model proposed by Matzler and Sauerwein [25] , Kano Model proposed by Lee et al. [16] and Gap Analysis suggested by Parasuraman et al. [1] [28] . Meanwhile, this paper only focuses on the constructs and assessment items of service quality for standard hotels in Taiwan. It is recommended that future studies can expand the scope of service quality research to the hotel industry as whole, in order to enhance the service quality of hotels in Taiwan.
References
- Parasuraman, A., Zeithaml, V.A. and Berry, L.L. (1988) SERVQUAL: A Multi-Item Scale of Measuring Consumer Perceptions of Service Quality. Journal of Retailing, 64, 12-41.
- Akan, P. (1995) Dimensions of Service Quality: A Study in Istanbul. Managing Service Quality, 5, 39-43.http://dx.doi.org/10.1108/09604529510796575
- Juwaheer, T.D. (2004) Exploring International Tourist’s Perceptions of Hotel Operations by Using a Modified SERVQUAL Approach—A Case Study of Mauritius. Managing Service Quality, 14, 350-364.http://dx.doi.org/10.1108/09604520410557967
- Antony, J., Antony, F.J. and Ghosh, S. (2004) Evaluating Service Quality in a UK Hotel Chain: A Case Study. International Journal of Contemporary Hospitality Management, 16, 380-384. http://dx.doi.org/10.1108/09596110410550833
- Eccles, G. and Durand, P. (1997) Improving Service Quality: Lessons and Practice from the Hotel Sector. Managing Service Quality, 7, 224-226. http://dx.doi.org/10.1108/09604529710172845
- Min, H. and Min, H. (1997) Benchmarking the Quality of Hotel Services: Managerial Perspectives. International Journal of Quality & Reliability Management, 14, 582-597. http://dx.doi.org/10.1108/02656719710186209
- Min, H., Min, H. and Chung, K. (2002) Dynamic Benchmarking of Hotel Service Quality. Journal of Service Marketing, 16, 302-321. http://dx.doi.org/10.1108/08876040210433211
- Desombre, T. and Eccles, G. (1998) Improving Service Quality in NHS Trust Hospitals: Lessons from the Hotel Sector. International Journal of Health Care Quality, 11, 21-26. http://dx.doi.org/10.1108/09526869810199610
- Tsang, N. and Qu, H. (2000) Service Quality in China’s Hotel Industry: A Perspective from Tourist and Hotel Managers. International Journal of Contemporary Hospitality Management, 12, 316-326. http://dx.doi.org/10.1108/09596110010339706
- Getty, J.M. and Thomson, K.N., (1994) A Procedure for Scaling Perceptions of Lodging Quality. Hospitality Research Journal, 18, 75-96.
- Wong, A.O.M., Dean, A.M. and White, C.J. (1999) Analyzing Service Quality in the Hospitality Industry. Measuring Service Quality, 9, 136-143. http://dx.doi.org/10.1108/09604529910257920
- Hu, H.Y., Chiu, S.I., Cheng, C.C. and Yen, T.M. (2011) Applying the IPA and DEMATEL Models to Improve the Order-Winner Criteria: A Case Study of Taiwan’s Network Communication Equipment Manufacturing Industry. Expert Systems with Applications, 38, 9674-9683. http://dx.doi.org/10.1016/j.eswa.2011.01.147
- Hu, H.Y., Lee, Y.C. and Yen, T.M. (2009) Amend Importance-Performance Analysis Method with Kano’s Model and DEMATEL. Journal of Applied Sciences, 9, 1833-1846. http://dx.doi.org/10.3923/jas.2009.1833.1846
- Lee, Y.C., Cheng, C.C. and Yen, T.M. (2008) Integrate Kano’s Model and IPA to Improve Order-Winner Criteria: A Study of Computer Industry. Journal of Applied Sciences, 9, 38-48.
- Martilla, J.A. and James, J.C. (1977) Importance-Performance Analysis. Journal of Marketing, 41, 77-79.
- Lee, Y.C., Yen, T.M. and Tsai, C.H. (2008) Modified IPA for Quality Improvement: Taguchi’s Signal-to-Noise Ratio Approach. The TQM Journal, 20, 488-501. http://dx.doi.org/10.1108/17542730810898458
- Huang, Y.C., Wu, C.H. and Hsu, C.J. (2006) Using Importance-Performance Analysis in Evaluating Taiwan Medium and Long Distance National Highway Passenger Transportation Service Quality. Journal of American Academy of Business, 8, 98-104.
- Lee, Y.C., Hu, H.Y., Yen, T.M. and Tsai, C.H. (2008) Kano’s Model and Decision Making Trial and Evaluation Laboratory Applied to Order-Winners and Qualifiers Improvement: A Study of Computer Industry. Information Technology Journal, 7, 702-714. http://dx.doi.org/10.3923/itj.2008.396.408
- Lee, Y.C., Yen, T.M. and Tsai, C.H. (2008) Using Importance-Performance Analysis and Decision Making Trial and Evaluation Laboratory to Enhance Order-Winner Criteria: A Study of Computer Industry. Information Technology Journal, 7, 396-408. http://dx.doi.org/10.3923/itj.2008.396.408
- Tonge, J. and Moore, S.A. (2007) Importance-Satisfaction Analysis for Marine-Park Hinterlands: A Western Australian Case Study. Tourism Management, 28, 768-776. http://dx.doi.org/10.1016/j.tourman.2006.05.007
- Lee, Y.C., Yen, T.M. and Tsai, C.H. (2008) The Study of an Integrated Rating System for Supplier Quality Performance in the Semiconductor Industry. Journal of Applied Sciences, 8, 453-461.http://dx.doi.org/10.3923/jas.2008.453.461
- Oh, H. (2001) Revisiting Importance-Performance Analysis. Tourism Management, 22, 617-627.http://dx.doi.org/10.1016/S0261-5177(01)00036-X
- Ryan, C. and Huyton, J. (2002) Tourists and Aboriginal People. Annals of Tourism Research, 29, 631-647.http://dx.doi.org/10.1016/S0160-7383(01)00073-1
- Sampson, S.E. and Showalter, M.J. (1999) The Performance-Importance Response Function: Observations and Implications. The Service Industry Journal, 19, 1-25. http://dx.doi.org/10.1080/02642069900000027
- Matzler, K. and Sauerwein, E. (2002) The Factor Structure of Customer Satisfaction: An Empirical Test of Importance Grid and the Penalty-Reward-Contrast Analysis. International Journal of Service Industry Management, 13, 321-332.http://dx.doi.org/10.1108/09564230210445078
- Garver, M.S. (2002) Using Data Mining for Customer Satisfaction Research. Marketing Research, 14, 8-12.
- Parasuraman, A., Zethaml, V.A. and Berry, L.L. (1985) A Conceptual Model of Service Quality and Its implications for Future Research. Journal of Marketing, 49, 41-50. http://dx.doi.org/10.2307/1251430
- Parasuraman, A., Zeithaml, V. and Berry, L.L. (1991) Refinement and Reassessment of the SERVQUAL Scale. Journal of Retailing, 67, 420-450.
- Knutson, B., Stevens, P., Wullaert, C., Patton, M. and Yokoyama, F. (1991) Lodgserv a Service Quality Index for the Lodging Industry. Hospitality Research Journal, 14, 277-284.
- Knutson, B., Stevens, P., Patton, M. and Thompson, C. (1993) Consumers’ Expectation for Service Quality in Economy, Mid-Price and Luxury Hotels. Journal of Hospitality and Leisure Marketing, 1, 27-43.http://dx.doi.org/10.1300/J150v01n02_03
- Getty, J.M. and Getty, R.L. (2003) Lodging Quality Index (LQI): Asseeeing Customers’ Perceptions of Quality Delivery. International Journal of Contemporary Hospitality Management, 15, 94-104.http://dx.doi.org/10.1108/09596110310462940
- Yavas, U. and Shemwell, D.J. (2001) Modified Importance-Performance Analysis: An Application to Hospitals. International Journal of Health Care Quality Assurance, 14, 104-110. http://dx.doi.org/10.1108/09526860110391568
- Tarrant, M.A. and Smith, E.K. (2002) The Use of a Modified Importance-Performance Framework to Examine Visitor Satisfaction with Attributes of Outdoor Recreation Settings. Managing Leisure, 7, 69-82.http://dx.doi.org/10.1080/13606710210137246
- Montgomery, D.C. (2007) Introduction to Statistical Quality Control. Wiley India Pvt. Ltd., New Delhi.
- Box, G.E.P. and Cox, D.R. (1964) An Analysis of Transformation. Journal of the Royal Statistical Society, Series B (Methodological), 26, 211-252.
- Sakia, R.M. (1992) The Box-Cox Transformation Technique: A Review. Journal of the Royal Statistical Society, Series D (The Statistician), 41, 169-178. http://dx.doi.org/10.2307/2348250
- Hansen, E. and Bush, R.J. (1999) Understanding Customer Quality Requirements: Model and Application. Industrial Marketing Management, 28, 119-130. http://dx.doi.org/10.1016/S0019-8501(98)00007-8
- Yang, C.C., Jou, Y.T. and Cheng, L.Y. (2009) Using Integrated Quality Assessment for Hotel Service Quality. Quality and Quantity, 24, 349-364.
- Tseng, M.L. (2009) Using the Extension of DEMATEL to Integrate Hotel Service Quality Perceptions into a Cause-Effect Model in Uncertainty. Expert Systems with Applications, 36, 9015-9023. http://dx.doi.org/10.1016/j.eswa.2008.12.052
- Nunnally, J.C. (1967) Psychometric Methods. McGraw-Hill Book Company, New York.
- Lewis, B.R. and McCann, P. (2004) Service Failure and Recovery: Evidence from the Hotel Industry. International Journal of Contemporary Hospitality Management, 16, 6-17. http://dx.doi.org/10.1108/09596110410516516
- Kano, N., Seraku, N., Takanashi, F. and Tsjui, S. (1984) Attractive Quality and Must-be Quality. The Journal of the Japanese Society for Quality Control, 14, 39-48.
- Matzler, K., Hinterhuber, H.H., Bailon, F. and Sauerwein, E. (1996) How to Delight your Customers. Journal of Product Brand Management, 5, 6-18. http://dx.doi.org/10.1108/10610429610119469
- Ottenbacher, M.C. and Harrington, R.J. (2010) Strategies for Achieving Success for Innovative Versus Incremental New Service. Journal of Services Marketing, 24, 3-15. http://dx.doi.org/10.1108/08876041011017853
- Hu, H.Y., Lee, Y.C., Yen, T.M. and Tsai, C.H. (2009) Using BPNN and DEMATEL to Modify Importance-Performance Analysis Model: A Study of Computer Industry. Expert Systems with Applications, 36, 9969-9979.http://dx.doi.org/10.1016/j.eswa.2009.01.062
NOTES

*Corresponding author.