Journal of Biomedical Science and Engineering
Vol.08 No.10(2015), Article ID:60389,9 pages
10.4236/jbise.2015.810068
Modelling and Simulation of Pressure Controlled Mechanical Ventilation System
Noman Q. Al-Naggar
Biomedical Engineering Department, University of Science and Technology, Sana’a, Yemen
Email: noman_qaed@yahoo.com
Copyright © 2015 by author and Scientific Research Publishing Inc.
This work is licensed under the Creative Commons Attribution International License (CC BY).
http://creativecommons.org/licenses/by/4.0/


Received 30 June 2015; accepted 17 October 2015; published 20 October 2015
ABSTRACT
A mathematical model of mechanical ventilator describes its behavior during artificial ventilation. This paper purposes to create and simulate Mathematical Model (MM) of Pressure Controlled Ventilator (PCV) signal. This MM represents the respiratory activities and an important controlled parameter during mechanical ventilation―Positive End Expiration Pressure (PEEP). The MM is expressed and modelled using periodic functions with inequalities to control the beginning of inspiration and expiration durations. The created MM of PCV signal is combined with an existing multi compartmental model of respiratory system that is modified and developed in the internal parameters―compliances (C) to test created MM. The created MM and model of respiratory system are constructed and simulated using Simulink package in MATLAB platform. The obtained simulator of mechnical ventilation system could potentially represent the pressure signal of PVC as a complete respiratory cycle and continuance waveform. This simulator is also able to reflect a respiratory mechanic by changing some input variables such as inspiration pressure (IP), PEEP and C, which are monitored in volume, flow, pressure and PV loop waveforms. The obtained simulator has provided a simple environment for testing and monitoring PCV signal and other parameters (volume, flow and dynamic compliance) during artificial ventilation. Furthermore, the simulator may be used for studying in the laboratory and training ventilator’s operators.
Keywords:
Mechanical Ventilator, Mathematical Model, Pressure Controlled Ventilator, PEEP, PV Loop, Compliance

1. Introduction
Mathematical model (MM) of the respiratory system plays an actual important role in developing and correcting ventilators work that supports breathing during patient’s treatment. The pressure controlled ventilation (PCV) is considered as one of mechanical ventilators, used for supporting many respiratory failures. The MM of mechanical ventilations has been proposed in several medical and scientific studies [1] -[4] .
Previous studies [5] [6] have shown interest of using a multi compartment model, which focuses on small detail behaviors of respiratory system anatomy, considered lungs as a series of electrical resistances and capacitances. This method has been converted to MM using Laplace [5] . On the other hand, another researcher [7] has been presented the inspiration and the expiration activities modelling of the pressure signal by a quadratic equation and an exponential equation.
Recently, modelling and representation of the dynamic characteristics of PCV signal have considered mechanical ventilation system as a pure pneumatic system [3] . Moreover, a nonlinear mathematical model with variable compliance for PCV study has been proposed to investigate the effects of recruitment maneuvers on output variables [1] . These models have certain advantages, i.e. helping in diagnosis and treatment of some respiratory diseases by studying the effectiveness and accuracy of change some variables. However, they could not build a comprised simulator that mimicked PCV signal and its dynamic characteristics.
This paper demonstrates a modelling and simulation of PCV signal, which includes the respiratory activities and an important controlled parameter during ventilator support―Positive End Expiration Pressure (PEEP) [8] . The MM is applied using simple periodic functions with inequalities to control the beginning of inspiration and expiration durations. This method offers a simple MM expression over related works that have been developed in the same trend [1] [7] . In order to present full simulator for mechanical ventilation system, the new MM is combined with an existing multi-compartment model of respiratory system [5] that has developed and modified some parameters (compliances) to fit in with new MM testing. The changing in the input variables such as inspiration pressure (IP) and PEEP, and then monitoring the output behavior are used to measure the effectiveness of the suggested method [9] . The MM modelling and simulation are applied using Simulink package in MATLAP platform.
The main novelty of this work is the new method of MM and its simulation. Moreover, it is combined with developed lung simulator to obtain mechanical ventilation system simulator. This new simulator can monitor the modeled pressure signal of PCV and output modulated signal (flow and volume) as continuous waveforms. Also, it can present the pressure wave of respiratory cycle and PV loop, which are viewed as important indicators of the patient’s response to mechanical ventilation [10] [11] . The obtained simulator may be used for studying the lung behavior in laboratory and training ventilator’s operators that match the purposes of a similar previous study [12] .
The rest of this paper consists of two sections and a conclusion. The first section describes the detailed process of MM, followed by an MM simulation process. The second section presents the results through illustration curves e.g. volume and flow, followed by the interpretation of the obtained results. The conclusion provides the significant achievements and suggestions for future work.
2. Methods and Tools
The mathematical model for mechanical ventilation system in this work includes the pressure support signal from pressure controlled ventilation (PCV) device, which is applied to a modified compartment model of respiratory system. Figure 1 shows the block diagram of the proposed method of MMs combination to represent the simulator of mechanical ventilation system.
2.1. Modelling PCV Signal
The pressure signal generated by PCV in reality takes the same breathing behavior as the respiratory activities. The suggested MM for the PCV pressure signal should also represent the breathing behavior and activities.
Figure 2 shows the typical waveform of pressure signal and its components that is intended to represent by MM. Also, it clarifies the setting variables in PCV device such as: inspiratory pressure (IP), breaths per minute (BPM), inspiratory time (Tin), and rise time of pressure (t).
The Mathematical Model for Pressure Controlled Ventilation Signal
The pressure signal of PCV depends on setting parameters in real PCV device that formulates the typical waveform shown in Figure 2. Therefore, the MM was formulated to represent the inspiration and the expiration activities and reflect the main input parameters during pressure support using PCV. The periodic functions method
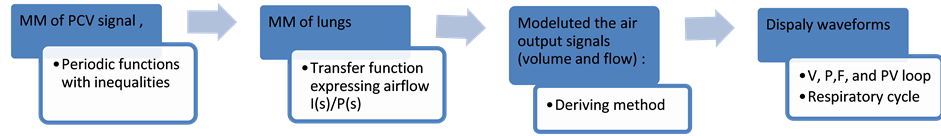
Figure 1. Block diagram of MMs combination.

Figure 2. Typical waveform of pressure signal for PCV.
was used to express MM of PCV pressure signal as seen in the Equations (1), (2) and (3).

where
P(t)―the pressure signal of PCV, PEEP―positive end-expiratory pressure, Paw―the pressure in respiratory airway;
t―time equal to (Tin-t), and Tex―expiration time.
As shown from these equations, the ventilation pressure or supported pressure of PCV was represented as time based function P(t) to reflect the respiratory activities―inspiration and expiration during ventilation. These activities are generated from a change in the pressure amount in lungs during inspiration and expiration pro- cesses. The inspiratory pressure (IP) and expiration pressure (EP) were represented in mathematical model by Paw and PEEP. Thus, the IP was represented using Equation (1) and (2), during inspiration time (Tin), whereas EP was represented using Equation (3) assuming that EP = PEEP.
The parameter values of the new MM are variables and have some limits in this research work initial as values for normal adult and this can be clarified as follows:
Inspiratory time is usually set for adult in average 0.7 to 1.0 second, but can be increased to reach the targeted tidal volume (VT) or when the patient remains hypoxic in spite of a plateau pressure (Pplat) > 30 cm H2O; and usually keeps the I/E ratio at 1:2 or 1:3 [13] .
The total cycle time (TCT) equals inspiratory time plus expiratory time (Tin + Tex = TCT), then the TCT for one breath could be written by Equation (4)
 (4)
(4)
The respiratory rate (RR) or frequency is obtained by dividing the number of breaths per minute to TCT as shown in Equation (5). Practically, the normal RR is 12 - 18 or 10 - 20 breaths/min [13] .
 (5)
(5)
The rise time of pressure (t) is one of the setting variables in PCV shown in Figure 2 and represented in Equations (1) and (2). This time is taken by the ventilator to reach the set pressure at the beginning of inspiration. In ventilators, the t controls the adjustment of the inspiratory flow delivery by clinician. It has proportional relation with flow i.e. a fast rise time associated with high flow at the beginning of inspiratory and vice versa. The rise time was defined in old generation ventilators as ventilator time constant (tv), which has a value ≥ 0 (e.g. 0.01 s, 0.2, …, 1 sec.) [14] .
The IP is based on the setting pressure value that considers the working pressure on the supplying system. Practically, it is determined by looking for a VT of 5 - 6 ml/kg [15] . The IP for PCV is set 15 - 20 cm H2O taking into account its peak or plateau pressure (Pplat)―PEEP used as a starting point and modified to reach desired VT [13] , whereas Pplat does not exceed 30 cm H2O (in some cases 35 cm H2O as maximum) to prevent lung from injury.
PEEP set 5 - 10 cm H2O, initially, has a value depending on other variables such the degree of hypoxemia and the expiration tidal volume, which keeps the range between 4 - 6 mL/kg [15] . Obviously, any an increment in PEEP value should be dropped in the driving pressure to keep the IP at 30 cm H2O.
Knowing all parameters related to time (Tin, Tex, RR, ratio I/E), and other setting variables will determine the beginning of each breathing cycle as well as the beginning of inspiration and expiration using shown Inequalities (6), (7) and (8).
 (6)
(6)
 (7)
(7)
 (8)
(8)
where n is the number of breathing cycle and T equals to 1 sec.
2.2. The Multi Compartment Model for Lungs.
The suggested MM for PCV was integrated as a pressure that is applied to a multi compartment model for lungs. This model has been suggested by Michael C. [5] . It demonstrates the electric model for respiratory system as a multi compartment model shown in Figure 3. This model has been converted to the mathematical model using transfer functions that represent the airflow (output) changes as a function of input pressure shown in Equation (9).
Where: all parameters refer to normal lungs:
The current flow (I) represents airflow, and the voltage source (V) demonstrates the applied pressure produced by the ventilator.
RC = 1 cm H2O/L/s, shows the airflow resistance of the central airways.
RP = 0.5 cm H2O/L/s, demonstrates the resistance of the peripheral airways.
CL = 200 ml/cm H2O, represents the capacity of the alveoli.
CW = 200 ml/cm H2O, indicates the chest wall capacity, which is in series with the alveoli
CS = 5 ml/cm H2O represents a shunt capacitance known as “dead space” of air, which does not participate in the exchange of oxygen and carbon dioxide between air and blood.
CT demonstrates the total compliance of airways and has variation values that depend on CL and CW.
 (9)
(9)
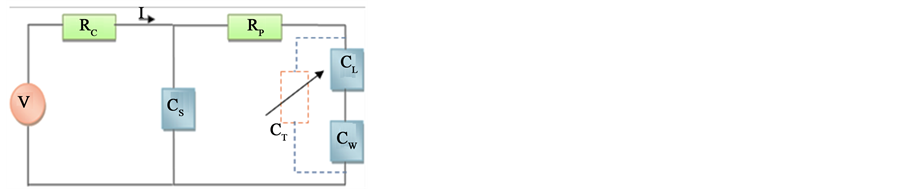
Figure 3. The equivalent electrical model of respiratory system―multi compartments.
Therefore, the transfer function has expressed the airflow output as a function of pressure input I(s)/P(s) using the transform function in Equation (10). This equation is assumed to represent a healthy respiratory system with above stated parameters as well as the total capacity of lungs equal to
 (10)
(10)
Equations (9) and (10) can be modified to represent other cases of lungs. Basically, the change in lung status is associated with two airway categories: the larger or central airways and the smaller or peripheral airways. The incoming air in these ways is shown by the connection of the lung (CL) and chest-wall (Cw) compliances in series [5] . Hence, we assume that these compliances in series represent the total compliance of respiratory system airways (CT). Figure 3 demonstrates CT in denoted and dashed line as a variable and therefore CT is calculated according to Figure 3 by Equation (11).
 (11)
(11)
Thus, to get CT, we make change in CL and Cw, which were modified to reflect the lung mechanic status and examine the behavior of the created MM using lung simulator. In PCV case, the compliance is called elastic compliance because the IP is kept during the entire set inspiratory time and the driving pressure set on the ventilator corresponds to the alveolar pressure [15] . CT has been calculated experimentally for lung simulator at about 10 mL/cm H2O in normal case [3] and it can be low with limiting VT, initially 6 mL/kg ideal body weight [13] [16] .
PCV parameters, particularly, IP and PEEP, were modified according to lung mechanic taking into account that the maximal lung distending pressures is 25 - 35 cm H2O plateau [16] . For PEEP there is no optimal value for particular pathology but there is a range between 5 - 10 cm H2O for some cases such patients with acute respiratory distress syndrome (ARDS) [17] [18] .
Table 1 summarizes the parameters values that are set in the created MM in assumed normal case and values out of normal case.
2.3. Deriving Output Signals and Displaying Curves
The proposed method is based on deriving displaying signals and waveforms developed simulator to monitor dynamic characteristics behavior. This research work was limited to show the pressure wave of complete respiratory cycle and its activities and waveforms of P, V, F. In addition the dynamic compliance was provided to demonstrate the dynamic effect of change in PV loop that refers to the ratio change of applied pressure to the change of applied volume as shown in Equation (12).
 (12)
(12)
The F, V and P signals were simulated as continuous waveforms with time course similar to reality; however, their simulation are based on the modelling of pressure as input signal presented in Section 2.1.
2.4. Simulator Construction
The created MM of PCV signal was modelled and simulated as a generator for the pressure, which was combined with developed lung simulator to obtain simulator of the mechanical ventilation system. Figure 4 shows a block diagram of building simulator and demonstrates the simulation sequences that were applied and constructed using Simulink tools in MATLAB platform.

Table 1. The parameters values setting of PCV MM.

Figure 4. Block diagram of building simulator.
3. Results and Discussion
The results of study shown that the results of new MM of PCV signal and its simulator are linked with respiratory system to represent the artificial mechanical ventilation system and illustrate the curves of input pressure wave over complete respiratory cycle, waveforms of P, V, F and PV loop.
3.1. The Obtained Complete Respiratory Cycle
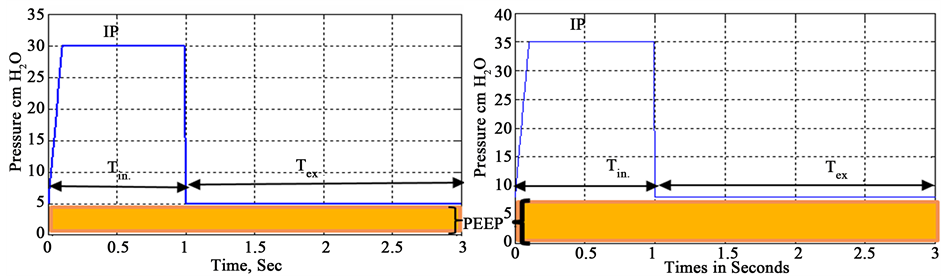
Figure 5(a) and Figure 5(b), illustrate graphically the simulation PCV pressure wave of the complete respiratory cycle for assuming normal values and other values that are not related to normal values, as seen in Table 1.
The setting parameter values illustrated in Table 1, are set according to respiratory system status. The unchanging parameters are Tin, Tex, as well as complete cycle time (3 seconds) and RR, whereas IP and PEEP are changed as seen in Figure 5(b). The different values of IP and PEEP are set in a way that Pplat does not exceed more than 35 cm H2O to prevent lungs from injuries.
The created and simulated MM reflected the different values in waveforms and showed convergence of the pressure waves of complete respiratory cycle and its activities with waveforms in reference standards [10] . Furthermore, this result appears significant ability over related works that have been developed in [3] [5] [7] .
3.2. Following up the P, V and F Waveforms Characteristics
Following up the waveforms of P, V and F is intended to test the effectiveness of created MM combined with lung simulator by changing their input parameters. Figure 6 illustrates the waveforms of P, V and F obtained at parameter values shown in the first line of Table 1 and at CT 10 ml/cm H2O. In this figure, time duration equals approximately 21 sec. for 7 complete respiratory cycles illustrating that RR repeats 20 per 60 sec. Also, this figure represents the pressure waveform (the first waveform from above) of created MM, which has constant pressure at 30 cm H2O and constant width of inspiration and expiration time during the entire course (Tin = 1 sec. and Tex = 2 sec.).
The general view of flow waveform in Figure 6 shows that the flow rapidly returns to zero at the beginning of plateau time then the flow at the end of the pause expiratory time takes the shown course. The flow waveform in this figure takes the same amplitude level (150 L/m) at inspiration or expiration, which is different from the flow behavior of PCV. Such flow must have the highest numeric value at the beginning of inspiration in such case [10] . The same amplitude level of flow wave of inspiration and expiration in this work may be obtained because the created MM has used constant inspiration and expiration durations.
Also, Figure 6 shows volume waveform, which does not have inspiratory pause, and the expiration follows immediately after inspiration and value equals 500 mL, which is characteristic of a natural healthy adult in 400 to 500 mL supported by PCV.
The obtained result of P, F, V waveforms showed convergence and corresponding in their shapes and characteristics with standard reference curves [10] . Moreover, the general shapes of obtained waves shows similarities to real PVC waves over related work that has been developed in [3] .
 (a) (b)
Figure 5. Simulated pressure wave of complete resiperatory cycle. (a) Normal case; (b) Another case.
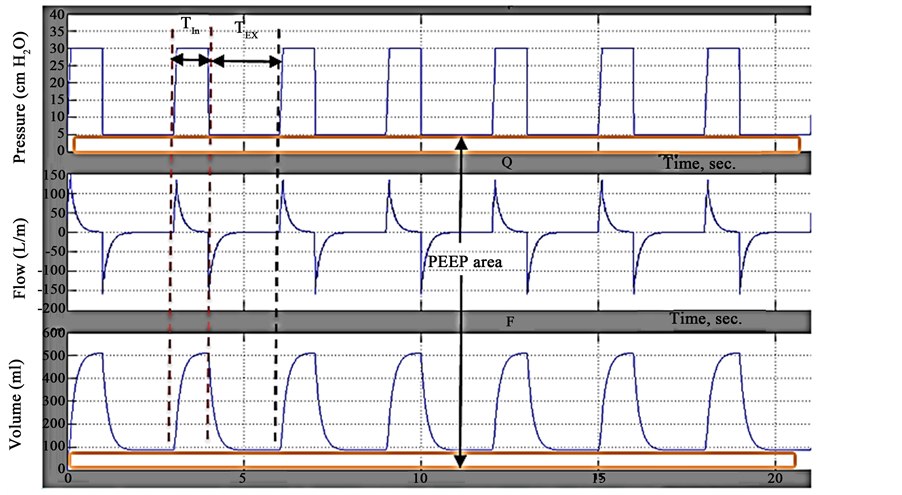
Figure 6. Waveforms of pressure, volume and flow at PEEP = 5 cm H2O and IP = 25 cm H2O.
Figure 7 shows the P, V and F waveforms of PCV with changing in IP and PEEP values of created MM that are set to IP = 27 cm H2O, PEEP = 8 cm H2O and CT = 10 mL/cm H2O. The shown duration equals approximately 21 sec. for 7 complete respiratory cycles.
The P, V and F waveforms in this figure remain unchanged in time course. Pplat increased compared to P waveform in Figure 6, whereas the dependent variable (V) increased to 800 ml and this resulted from increasing IP and PEEP setting values in the created MM.
The obtained results show clearly the ability of obtained simulator to reflect and represent the changes in its input parameters.
3.3. Following up the PV Loop Characteristics
The PV loop of PCV is studied with different CT values to test the ability of proposed method by monitoring the output variables behavior. Figure 8 shows a PV curve obtained by developed method. This curve clearly demonstrates the inputs values of PEEP and PIP, and reflects the tidal volume, VT at 0.5 L. In addition, Figure 8 shows that there is no difference between PV curves of inflation and deflation. This limitation does not help in getting useful information from the inspiratory part of the curve, which can be related to the use of constant duration time of inspiration and expiration.
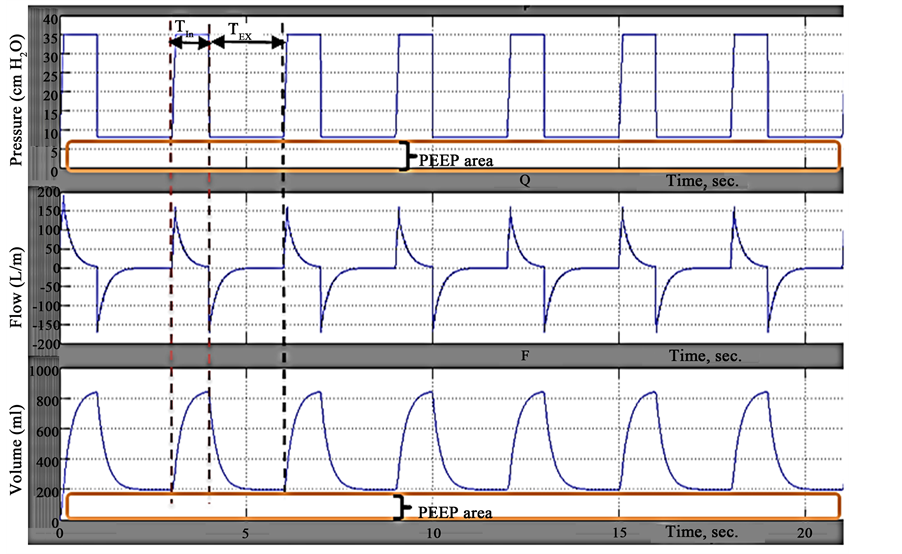
Figure 7. Waveforms of pressure, volume and flow at PEEP = 8 cm H2O and IP = 27 cm H2O.

Figure 8. PV loop of PCV.
Figure 9 shows the different PV loops with IP = 25 cm H2O, PEEP = 5 cm H2O, Tin = 1 sec., t = 0.1, and CT given in Table 2. The CT is set with different values as a change in lung mechanic to monitor the response of created MM and simulator. Table 2 demonstrates the calculated elastic compliance  that has been set in lung simulator and considered to be the inverse of total compliance CT. The value of
  is divided into two values for CL and CW in simulator as seen in Figure 4.
The obtained curves, seen in Figure 9, demonstrate change in behavior of PV loop curves particularly in tidal volume axis, in which the increment of  led to the increment of VT (look at cases No. 1, 2, 3 in Table 2), whereas the driving pressure remains constant. Therefore, the PV loops of PCV obtained by the proposed

Figure 9. PV loop of PCV at different CT.
Table 2. The parameters values changed in Lung simulator.
method are reflected the changes in lung mechanic.
The created MM of PCV signal and developed lung simulator composed the mechanical ventilation system simulator. This simulator provides the significant results of representation pressure signal of PCV and displays the output dynamic characteristics of pressure (flow and volume waveforms) and monitors them as the continuous waveforms.
Furthermore, simulator has the ability to monitor the PV loop through which approved it is that the proposed method reflects the changes in the lung mechanic.
4. Conclusions and Future Work
In this work, we developed and simulated the mathematical model of the PCV pressure signal and combined it with modified lung simulator to obtain the mechanical ventilation system simulator. The MM is able to represent setting parameters and its limit values, and therefore represents the real PCV device by simulator. This simulator is able to monitor the input and output signals as continuous waveforms to mimic the real artificial ventilation process. Thus, it leads to the use of the simulator as a tool for studying the behavior of PCV ventilators in training students in laboratories to be familiar with curves and variables.
These model and simulator demonstrated the ability to reflect the changes in lung mechanic. However, the simulator requires expansion of the modulated internal parameters of respiratory mechanic. Thus, this new model requires further investigation and validation.
Cite this paper
Noman Q.Al-Naggar, (2015) Modelling and Simulation of Pressure Controlled Mechanical Ventilation System. Journal of Biomedical Science and Engineering,08,707-716. doi: 10.4236/jbise.2015.810068
References
- 1. Crooke, P.S., Marini, J.J. and Hotchkiss, J.R. (2002) Modeling Recruitment Maneuvers with a Variable Compliance Model for Pressure Controlled Ventilation. Journal of Theoretical Medicine, 4, 197-207.
http://dx.doi.org/10.1080/1027366021000023124 - 2. Hess, D.R. (2005) Ventilator Waveforms and the Physiology of Pressure Support Ventilation. 34th Respiratory Care Journal Conference, 50, 166-183.
- 3. Shi, Y., Ren, S., Cai, M.L., Xu, W.Q. and Deng, Q.Y. (2014) Pressure Dynamic Characteristics of Pressure Controlled Ventilation System of a Lung Simulator. Computational and Mathematical Methods in Medicine Online, Hindawi, 1-10.
http://dx.doi.org/10.1155/2014/761712 - 4. Steimle, K.L., Mogensen, M.L., Karbing, D.S., Bernardino de la Serna, J. and Andreassen, S. (2011) A Model of Ventilation of the Healthy Human Lung. Computer Methods and Programs in Bio-medicine, 101, 144-155.
http://dx.doi.org/10.1016/j.cmpb.2010.06.017 - 5. Khoo, M.C.K. (2001) Physiological Control Systems: Analysis, Simulation, and Estimation. IEEE Press Series on Biomedical Engineering, New York, 1-319.
- 6. Lakshmi, K.V. and Srinivas, P. (2012) Modeling, Simulation and Analysis of Lung Mechanics Using Labview. IJERT, 1, 1-8.
- 7. Lin, S.-L., Guo, N.-R. and Chiu, C.-C. (2010) Modeling and Simulation of Respiratory Control with Labview. Journal of Medical and Biological Engineering, 32, 51-60.
http://dx.doi.org/10.5405/jmbe.829 - 8. Chiew, Y.S., Chase, J.G., Shaw, G., Sundaresan, A. and Desaive, T. (2011) Model-Based PEEP Optimization in Mechanical Ventilation. Biomedical Engineering Online, 10, 111.
http://www.biomedical-engineering-online.com/content/10/1/111
http://dx.doi.org/10.1186/1475-925X-10-111 - 9. Sargent, R.G. (2013) Verification and Validation of Simulation Models. Journal of Simulation, 7, 12-24.
http://dx.doi.org/10.1057/jos.2012.20 - 10. Rittner, F. and Doring, M. (2005) Curves and Loops in Mechanical Ventilation. Drager Medical AG & Co. KG, Germany, 1-59.
- 11. Ahluwalia, J., Morley, C. and Wahle, H.G. (2014) Volume Guarantee New Approaches in Volume Controlled Ventilation for Neonates. DRAGER Corporation, Germany, 1-65.
- 12. Hernandez, A.M., Maanas, M.A. and Costa-Castelló, R. (2008) Learning Respiratory System Function in BME Studies by Means of a Virtual Laboratory: RespiLab. IEEE Transactions on Education, 51, 24-34.
http://dx.doi.org/10.1109/TE.2007.893355 - 13. Grossbach, I., Chlan, L. and Tracy, M.F. (2011) Overview of Mechanical Ventilatory Support and Management of Patient- and Ventilator-Related Responses. Critical Care Nurse, 31, 30-44.
http://dx.doi.org/10.4037/ccn2011595 - 14. Hess, D.R. (2005) Ventilator Waveforms and the Physiology of Pressure Support Ventilation. Respiratory Care, 50, 166-186.
- 15. Lucangelo, U., Bernabé, F. and Blanch, L. (2005) Respiratory Mechanics Derived from Signals in the Ventilator Circuit. Respiratory Care, 50, 55-67.
- 16. Tidal, L. (2000) Ventilation with Lower Tidal Volumes as Compared with Traditional Tidal Volumes for Acute Lung Injury and the Acute Respiratory Distress Syndrome. New England Journal of Medicine, 342, 1301-1308.
http://dx.doi.org/10.1056/NEJM200005043421801 - 17. Sundaresan, A., Yuta, T., Hann, C.E., Chase, J.G. and Shaw, G.M. (2009) A Minimal Model of Lung Mechanics and Model-Based Markers for Optimizing Ventilator Treatment in ARDS Patients. Computer Methods and Programs in Biomedicine, 95, 166-180.
http://dx.doi.org/10.1016/j.cmpb.2009.02.008 - 18. Britos, M., Smoot, E., Liu, K.D., Thompson, B.T., Checkley, W. and Brower, R.G., National Institutes of Health, Acute Respiratory Distress Syndrome Network (ARDS Network) Investigators (2011) The Value of PEEP and FiO2 Criteria in the Definition the Acute Respiratory Distress Syndrome. Critical Care Medicine, 39, 2025-2030.
http://dx.doi.org/10.1097/CCM.0b013e31821cb774