Journal of Biomedical Science and Engineering
Vol.7 No.10(2014), Article ID:48523,7 pages
DOI:10.4236/jbise.2014.710081
A New Pattern Recognition Method for Detection and Localization of Myocardial Infarction Using T-Wave Integral and Total Integral as Extracted Features from One Cycle of ECG Signal
Naser Safdarian1*, Nader Jafarnia Dabanloo2, Gholamreza Attarodi2
1Department of Biomedical Engineering, Dezful Branch, Islamic Azad University, Dezful, Iran
2Department of Biomedical Engineering, Science and Research Branch, Islamic Azad University, Tehran, Iran
Email: *Naser.Safdarian@yahoo.com
Copyright © 2014 by authors and Scientific Research Publishing Inc.
This work is licensed under the Creative Commons Attribution International License (CC BY).
http://creativecommons.org/licenses/by/4.0/


Received 6 June 2014; revised 23 July 2014; accepted 3 August 2014
ABSTRACT
In this paper we used two new features i.e. T-wave integral and total integral as extracted feature from one cycle of normal and patient ECG signals to detection and localization of myocardial infarction (MI) in left ventricle of heart. In our previous work we used some features of body surface potential map data for this aim. But we know the standard ECG is more popular, so we focused our detection and localization of MI on standard ECG. We use the T-wave integral because this feature is important impression of T-wave in MI. The second feature in this research is total integral of one ECG cycle, because we believe that the MI affects the morphology of the ECG signal which leads to total integral changes. We used some pattern recognition method such as Artificial Neural Network (ANN) to detect and localize the MI, because this method has very good accuracy for classification of normal signal and abnormal signal. We used one type of Radial Basis Function (RBF) that called Probabilistic Neural Network (PNN) because of its nonlinearity property, and used other classifier such as k-Nearest Neighbors (KNN), Multilayer Perceptron (MLP) and Naive Bayes Classification. We used PhysioNet database as our training and test data. We reached over 76% for accuracy in test data for localization and over 94% for detection of MI. Main advantages of our method are simplicity and its good accuracy. Also we can improve the accuracy of classification by adding more features in this method. A simple method based on using only two features which were extracted from standard ECG is presented and has good accuracy in MI localization.
Keywords:ECG Signal Classification, Signal Processing, Myocardial Infarction, Features Extraction, Neural Network

1. Introduction
The electrocardiogram (ECG) signal is one of the most obvious effects of the human heart operation. The oscillation between systole and diastole states of the heart is reflected in the heart rate (HR) [1] . The surface ECG is the recorded potential difference between two electrodes placed on the surface of the skin at pre-defined points. The largest amplitude of a single cycle of the normal ECG is referred to as the R-wave manifesting the depolarization process of the ventricle [1] . The time between successive R-waves is referred to as an RR-interval, and an RR-tachogram is then a series of RR-intervals. Variability in this time series has been widely used as a measure of heart function, and this helps to identify patients at risk for a cardiovascular event or death [2] .
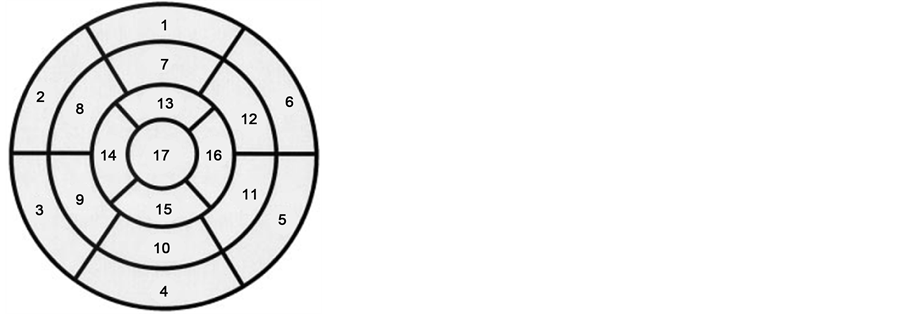
When one of the coronary arteries becomes completely closed, we call that part of the heart have myocardial infarction. There are two main arteries for blood supply to the myocardium. One of them brings blood to the right side of the heart (right coronary artery) and the other artery covers the left side of the heart (left main artery) [3] . The location of Myocardial infarction (MI) can be described in different ways. One is the heart model in 17 segments that is used as an optimal model to predict and determine location of MI in various diagnostic methods such as imaging methods. In this model, the heart was named by being cut horizontally into three sections: Apical, Mid-cavity and Basal. In real, ratio of unit myocardial mass per total mass of myocardial is 42% for basal, 36% for the midcavity, and 21% for apex of heart. In study by Cerqueira et al., model of left ventricular in 17 segments provides the distribution of mass 35%, 35% and 30% respectively, whose values are very close to the anatomical study [4] . This model was shown in Figure 1.
We used the basic description for showing the local of MI. In the basic description we have three main parts: Inferior infarction, lateral infarction, anterior and posterior infarction. We can have the combination of these such as Anterolateral infarction and Inferoposterior infraction. Because of great volume and hard working of left ventricle we see the left ventricle in almost all of MI.
The standard 12-Lead ECG system is widely used for different cardiovascular arrhythmia detection as well as different heart diseases diagnosis and treatment. In [5] the authors discussed the limitation of this standard lead system. Researchers use different lead system to localize the MI and measure the strength of MI e.g. Frank lead, body surface potential Map (BSPM) [3] [5] -[7] . In spite of the limitation of 12-leads standard system, it has been widely used for detection and localization, and to measure the strength of MI because of its simplicity and availability of its data in hospitals.
In 2010, Arif et al. presented an automatic method for MI localization using K-nearest neighbor (KNN). Time domain features like T-wave and Q-wave amplitudes and ST level dispersion were extracted from 12-lead ECG. They used PTB database including 20,160 beats of ECG, and after extracting the above features, they used KNN classifier. The sensitivity was 99.97% and the specificity was 99.9% for detecting MI, and the accuracy was equal to 98.3% for localization [8] .
In 2007, Mneimneh and Povinelli used RPS/GMM, and localized and determined the extent of MI. They used PTB database for training and the four patients in PhysioNet challenge database for testing [9] .
In this paper by standard 12 lead ECG system, data to detect, localize and measure the strength of MI using Neural Network (NN) were presented.
2. Materials and Method
We used the 12-Leads recorded ECG signals that used from PhysioNet PTB Database [10] . The database contains 549 records from 290 subjects. Each subject is represented by one to five records. Each record includes 15 simultaneously measured signals: the conventional 12 leads (I, II, III, AVR, AVL, AVF, V1, V2, V3, V4, V5, V6) together with the 3 Frank leads ECG (Vx, Vy, Vz). Each signal is digitized at 1000 samples per second, with 16 bit resolution over a range of ± 16.384 mV. PTB database prototype recorder has the following specifications:
-16 input channels, (14 for ECGs, 1 for respiration, 1 for line voltage);
-Input voltage: ±16 mV and compensated offset voltage up to ± 300 mV;
-Input resistance: 100 Ω (DC);
-Resolution: 16 bit with 0.5 μV/LSB (2000 A/D units per mV);
-Bandwidth: 0 - 1 kHz (synchronous sampling of all channels);
-Noise voltage: max. 10 μV (pp), respectively 3 μV (RMS) with input short circuit;
-Online recording of skin resistance;
-Noise level recording during signal collection;
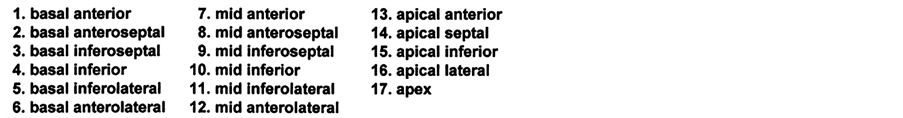
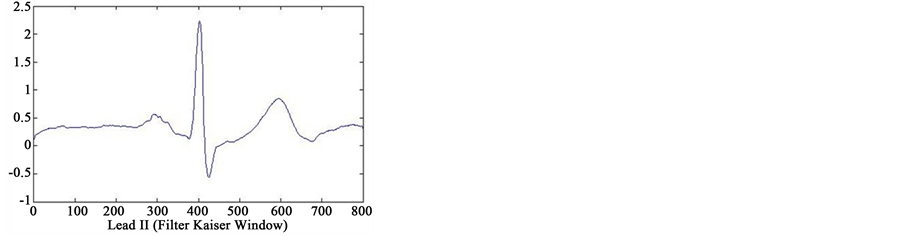
In first step of data processing, all signals are read by MATLAB software. Then we separated various leads of each signals. After removing baseline artifact, we get the clean signals of lead II using four type smoothing filter (Moving Average filter, Kaiser filter, Butterworth filter and Median filter) (see Figure 2). Also we separated several point of each signal, that only one or two cycles from all cycles of signals were detected. We are processing
 (a)
(a) (b)
(b)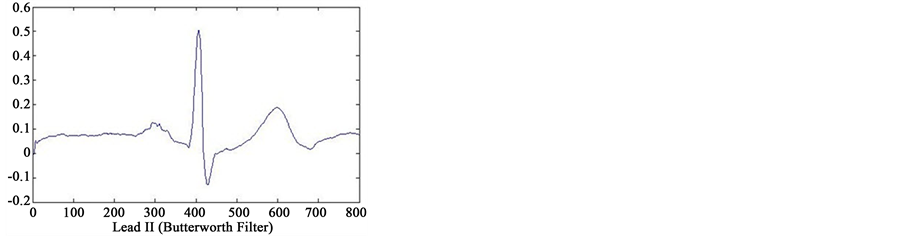 (c)
(c)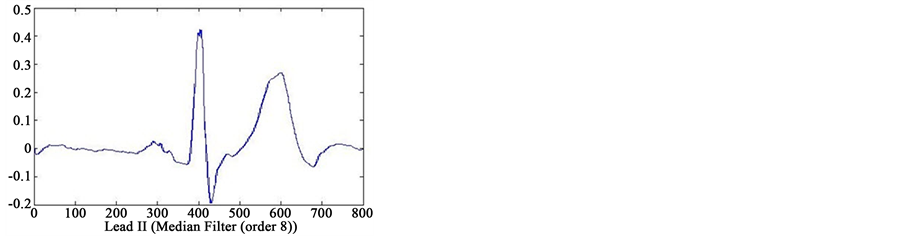 (d)
(d)
Figure 2. Results of feature extraction from Lead II of case 233 (case of Healthy Control in database). The output of four types filters (Kaiser Filter, Moving Average Filter, Butterworth Filter and Median Filter).
on these cycles. Finally, we selected one cycle from results of these feature extraction that reached to information of only one cycle. In Figure 2 can see output of the four type filters.
After reached to ECG cycles of each patient signals isolated, integral value (area under the signal) for each cycle from the initial point to the end point of signal in that cycle are calculated. Now we have the total integral value for each cycle of the ECG signal. Now we will pay to extraction of T-wave integral. The first and end point of the T-wave for each of the ECG cycles are specified and then we proceeded to extraction T-integral. Now, by selection from results of the total integral and T wave-integral of all cycle signals in each patient, we reaching to the information about one cycle of ECG signal.
Now we are ready to apply the features to the pattern recognition system for detecting and localizing the MI and measure the strength of MI. We used 4 kind of pattern recognition system. One of these methods is Radial Basis Function (RBF) as Artificial Neural Network (ANN). This is a kind of supervised ANN. It is widely used in approximation and generalization problems. It has three layers that called input, hidden and output layers. You can see the structure of an RBF NN in Figure 3 and Figure 4.
We also used Probabilistic Neural Network (PNN) because of its nonlinearity property. PNN classifier which is a kind of RBF network was used. PNN used in classification problems. When an input vector is applied to the network, the first layer calculate distance of input vector from the inputs of training data, and thus provides a vector that elements of it will determine the amount of distance between input and input are training data. The second layer using output of first layer will produce the probability vector as output of the network. The competitive transfer function (Compete) in the second layer, can be selected the maximum likelihood of the vector probability, and to exchange it, output is to produce 1 and for other probability, output is to produce zero. The architecture of this type neural network is shown in the Figure 5.
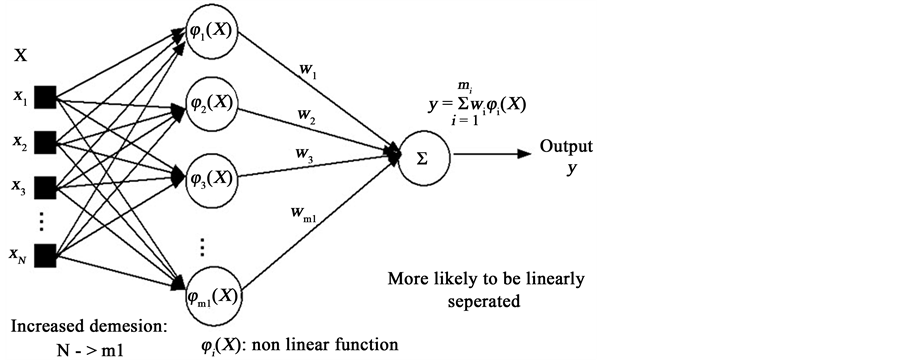
Figure 3. Structure of RBF neural network.
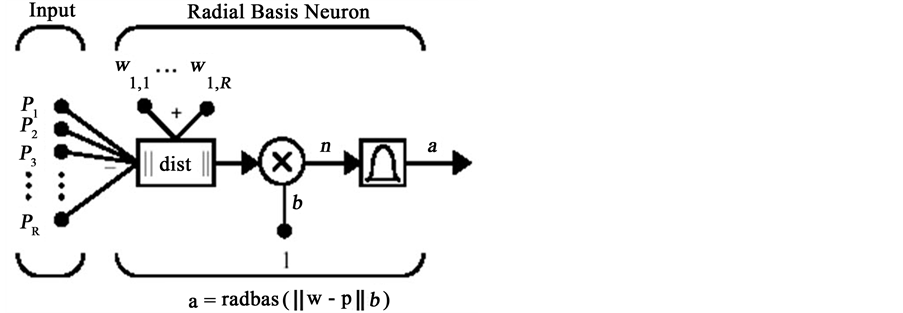
Figure 4. Structure of radial basis network with R inputs.
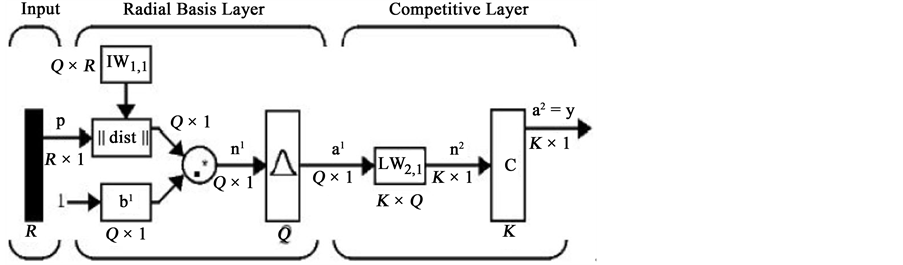
Figure 5. Structure of probabilistic neural network.
The premise here is that the input vectors are different classes of k. Thus, each goal vector has k elements, that one of them is 1 and the others of them are zero.
Also we used other classifier such as k-Nearest Neighbors (KNN), Multilayer Perceptron (MLP) Neural Network and Naive Bayes Classification. The structure of the type MLP neural network and feed forward structure has shown in the Figure 6.
Next classifier that used in this paper was k-Nearest Neighbors (KNN). This classifier given a set X of n points and a distance function D, and also kNN allows you to find the k closest points in X to a query point or set of points. The kNN technique and kNN-based algorithms are widely used as benchmark learning rules. The relative simplicity of the kNN search technique makes it easy to compare the results from other classification techniques to kNN results. They have been used in various areas such as bioinformatics, image processing and data compression, document retrieval, computer vision, multimedia database, and marketing data analysis. Also we can use from kNN for other machine learning algorithms, such as kNN classification, local weighted regression, missing data imputation and interpolation, and density estimation. We can also use kNN with many distance-based learning functions, such as K-means clustering.
Finally last classifier that used in this paper was Naive Bayes Classification. The Naive Bayes classifier is designed for use when features are independent of one another within each class, but it appears to work well in practice even when that independence assumption is not valid. This classifies data in two steps:
1) Training step: using the training samples, the method estimates the parameters of a probability distribution, assuming features are conditionally independent given the class;
2) Prediction step: for any unseen test sample, the method computes the posterior probability of that sample belonging to each class. The method then classifies the test sample according the largest posterior probability.
Now each of the extracted features was stored in a feature vectors. These extracted features as input vectors for each classifier. For detection of MI, we have two classes (Healthy & MI patient). For detection and localization of MI, we have four classes (Healthy & Anterior & Inferior & Posterior). Now feature vectors as input to the Neural Network (or classifier), and we do classification operation. In this study 75% of the all signals in database randomly selected as training set and 25% of the remaining features of signals as determined by test set. We do training network by training set, and we adjust the network parameters to provide maximum accuracy in classification of signals in training set. Then, we do classification of signals in the test set by designed classifiers.
3. Results
Classification results of extracted features from ECG signal to detection and localization of Myocardial Infarction was shown in Table1
Best result for separated healthy and patient with MI (Detection) was obtained by Bayes classifier (equal to 94.74%). Best result for Detection and Localization of MI was obtained by Probabilistic Neural Network (equal to 76.67%).
4. Conclusion and Discussion
In this study, new method to determine and identify the location of the Myocardial Infarction on PhysioNet data
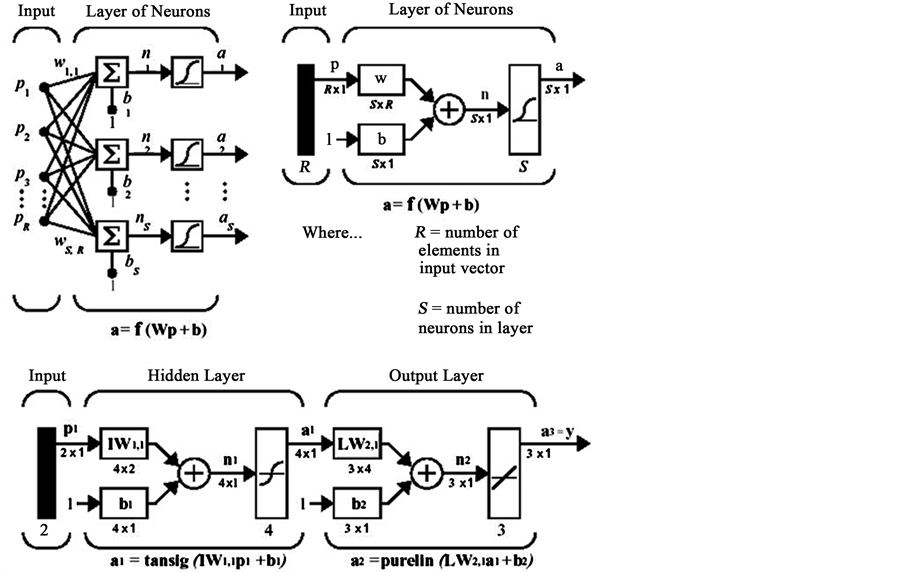
Figure 6. Structure of MLP neural network.

Table 1. Classification results of extracted features from ECG signal to detection and localization of Myocardial Infarction.
(PTB database) by feature extraction from ECG signals and applied several classifiers, was proposed. To estimated detection and localization of MI, results of our method (in testing data) were compared with certain results in database. Finally, the paper relatively well observed that the proposed method is able to accurately estimate the location MI in patients who had been introduced as a test. The main advantage of this method is its simplicity.
In spite of simplicity our method has good accuracy which can be improved by adding more features. Future studies could focus on other parameters such as T-wave amplitude in one cycle of ECG signals, ST-segment dispersion in one cycle of ECG signals, Q-wave amplitude in ECG signals and other parameters, to more precisely locate the area of infarction on heart and used from them to detection extent and location of MI with high accuracy (on database that certain extent of MI).
Acknowledgements
With special thanks from Dezful Branch, Islamic Azad University, Dezful, Iran, which this research was supported by this university. Finally thanks to Science and Research Branch, Islamic Azad University, Tehran, Iran.
References
- Jafarnia-Dabanloo, N., McLernon, D.C., Zhang, H., Ayatollahi, A. and Johari-Majd, V. (2007) A Modified Zeeman Model for Producing HRV Signals and Its Application to ECG Signal Generation. Journal of Theoretical Biology, 244, 180-189. http://dx.doi.org/10.1016/j.jtbi.2006.08.005
- McSharry, P.E., Clifford, G., Tarassenko, L. and Smith, L.A. (2003) A Dynamical Model for Generating Synthetic Electrocardiogram Signals. IEEE Transactions on Biomedical Engineering, 50, 289-294. http://dx.doi.org/10.1109/TBME.2003.808805
- Attarodi, Gh., Jafarnia Dabanloo, N., Safdarian, N. and Matini, S.A. (2012) Detection and Localization of Myocardial Infarction Using Body Surface Potential Map Data. Proceedings of the IASTED International Conference Biomedical Engineering (BioMed 2012), Innsbruck, 15-17 February 2012, 109-113.
- Cerqueira, M.D., et al. (2002) Standardized Myocardial Segmentation and Nomenclature for Tomographic Imaging of the Heart. Circulation, 105, 539-542. http://dx.doi.org/10.1161/hc0402.102975
- Carley, S.D. (2003) Review of the Use of Additional Leads for the Early Electrocardiographic Diagnosis of Acute MI. Emergency Medicine, 15, 143-154. http://dx.doi.org/10.1046/j.1442-2026.2003.00431.x
- Sabouri, S., SadAbadi, H. and Dabanloo, N.J. (2010) Neural Network Classification of Body Surface Potential Contour Map to Detect Myocardial Infarction Location. Computing in Cardiology, 37, 301-304.
- Wilson, F.N. (1934) ECG That Represent the Potential Variations of a Single Electrode. American Heart Journal, 9, 447-458. http://dx.doi.org/10.1016/S0002-8703(34)90093-4
- Arif, M., Malagore, I.A. and Afsar, F.A. (2012) Detection and Localization of Myocardial Infarction Using K-Nearest Neighbor Classifier. Journal of Medical Systems, 36, 279-289. http://dx.doi.org/10.1007/s10916-010-9474-3
- Mneimneh, M.A. and Povinelli, R.J. (2007) RPS/GMM Approach toward the Localization of Myocardial Infarction. Computing Cardiology, 34, 185-188.
- ECG Signals, PTB Database. www.PhysioNet.org
NOTES

*Corresponding author.