Journal of Biomedical Science and Engineering
Vol.6 No.6(2013), Article ID:33684,7 pages DOI:10.4236/jbise.2013.66080
Effects of oleic acid on murine macrophage dysfunction
![]()
School of Human Sciences, Kobe College, Nishinomiya, Japan
Email: n-shiomi@mail.kobe-c.ac.jp
Copyright © 2013 Naofumi Shiomi, Keiko Watanabe. This is an open access article distributed under the Creative Commons Attribution License, which permits unrestricted use, distribution, and reproduction in any medium, provided the original work is properly cited.
Received 25 April 2013; revised 28 May 2013; accepted 7 June 2013
Keywords: Macrophage; Oleic Acid; Cancer; Allergy; Dysfunction
ABSTRACT
Obese individuals exhibit much higher risks not only for metabolic syndrome, but also for cancer and allergies, than normal-weight subjects. This fact suggests that signals secreted from adipocytes change the characteristics of lymphocytes, such as macrophages and T-cells. We focused on a free fatty acid, oleic acid, as a signal inducing such changes and examined its effects on murine J774.2 macrophages. When the cells were cultured in medium containing high concentrations (1, 2 and 4 mM) of oleic acid, apoptosis occurred, and the apoptotic cells were gathered into clusters of very large size by the work of enzymes for phagocytosis. When the cells were cultured in medium containing 0.5 mM of oleic acid, the fatty acid did not affect cell growth; however, it inhibited nitrogen monoxide (NO) secretion and the gene expressions of interleukins and TNF-α. NO disturbs the invasion of macrophages into blood vessels, and interleukins promote the differentiation and proliferation of Tand B-cells. Therefore, these results suggest that the high risks for cancer and allergies observed in obese subjects are associated with the dysfunction of macrophages induced by fatty acids. Moreover, we also examined the protective effects of carnitine against dysfunction. However, carnitine did not exhibit sufficient effects.
1. INTRODUCTION
Recently, great attention has been paid to metabolic syndrome in Japan. Research conducted by the Ministry of Health, Labour and Welfare of Japan in 2006 suggested that half of males and one-fifth of females among those over 40 years of age show signs of metabolic syndrome. In obese individuals with signs of metabolic syndrome, the risk of hyperglycemia, diabetes and heart disease is approximately two to four times higher than that observed in normal-weight individuals [1]. The simultaneous clustering of these diseases is the characteristic of metabolic syndrome. Meanwhile, the risk of cancer and allergies in obese individuals is also higher than that observed in normal-weight persons, although these diseases are not included in the criteria for metabolic syndrome [2,3]. This fact suggests that signals produced in patients with metabolic syndrome act not only to cause metabolic syndrome, but also to decrease the function of the immune system.
One candidate of such signaling is adipocytokines. White adipose tissue (WAT) functions as an endocrine organ secreting many kinds of adipocytokines, including adiponectin, leptin, TNFα and PAI-1 [4]. Hypertrophic WAT in obese subjects secretes undesirable amounts of adipocytokines, which causes insulin resistance and abnormal glucose metabolism, the primary symptoms of metabolic syndrome [5-7]. However, there are few reports showing that adipocytokines directly affect the immune system.
The other candidate of signaling is free fatty acids, one of which we evaluated in this study. The levels of free fatty acids in obese subjects are higher than those observed in standard-weight individuals. The free fatty acids present in blood are usually detoxified both by combining with albumin and being synthesized into triglycerides in the liver and muscles. However, the excessive free fatty acids found in obese subjects are not sufficiently detoxified, which results in harmful effects in various organs due to inhibition of the function of the cell membrane [8]. For example, the lipid levels are correlated with insulin resistance in humans [9,10]. ZDF rats exposed to high concentrations of free fatty acids exhibit decreased secretion levels of insulin by beta cells in the pancreas, because excess amounts of fatty acids inhibit glucosestimulated insulin secretion GSIS [11,12]. Moreover, a relationship between lipids and the immune system in humans has been suggested [13-15]. In particular, macrophages are related to WAT and affected by fatty acids [16,17]. Macrophages are an important monocyte in the immune system. They induce the activation of T-cells and B-cells by secreting interleukins, and undesirable changes in macrophages influence the development of cancer and allergies. Therefore, these results suggest that the signals associated with harmful effects on immunocytes may involve fatty acids.
In this study, we investigated the effects of fatty acids on the activity of macrophages (M1 macrophages) activated by LPS, as previous reports [16,17] have not elucidated this topic. Consequently, high concentrations of oleic acid inhibited the production of NO and interleukins in the M1 macrophages. Therefore, free fatty acids act as a signal to induce decreases in the function of the immune system.
2. MATERIALS AND METHODS
2.1. Cell lines and Medium
The cell line of murine J774.2 macrophages was obtained from Dainippon Sumitomo Pharma Corporation (Osaka, Japan). Dulbecco’s modified Eagle’s medium containing sodium bicarbonate (MP Biomedicals Inc., III kirch, France) and fetal bovine serum (FBS) treated at 56˚C for 30 minutes was mixed at a ratio of 9:1. The mixture (DMEM) was used as a basic culture medium. Oleic acid was dissolved in ethanol at a final concentration of 400 mM, and lipopolysaccharide (LPS) was dissolved in PBS at a final concentration of 500 μg/mL. The cells were cultured in a CO2 incubator at 37˚C.
2.2. Toxicity of Oleic Acid to Macrophages
The toxicity of oleic acid to macrophages was examined using a Cell Counting Kit-8 (DOJINDO Laboratories, Kumamoto, Japan). The J774.2 macrophages (5000 cells/ well) were cultured in 200 μL of DMEM in a 96-well plate for 24 hours. Solutions of 25, 40, 100, 200 and 400 mM of oleic acid were prepared by diluting the 400 mM oleic acid solution with ethanol. Two microliters of each solution was added to the medium, and the mixture was cultured for 16 hours. After the medium in all wells was changed to 100 μL of fresh DMEM containing 5 μL of the Cell Counting Kit-8 solution, the cells were incubated for six hours. The absorbance of the culture broth at 450 nm was measured. A total of four independent experiments were performed, and the average values and standard deviations (SDs) were calculated.
The cell depth was examined using the APOPercentageTM Apoptosis Assay kit (Biocolor Ltd., Newtownabbey, Northern Ireland). The J774.2 macrophages (2 × 10⁵ cells/well) were cultured in 1 mL of DMEM in a 4-well glass slide (Lab-Tek Chamber SlideTM 177399, Nalge Nunc International, New York, USA) for 24 hours, after which the medium was changed to DMEM containing 0.5 mM or 2 mM oleic acid. Following incubation for one hour, the medium was changed to 1 mL of DMEM containing APOPercentage Dye and incubated again for 30 minutes. The cells, which were washed three times with the solution in the kit, were observed with a microscope.
2.3. Preparation of the Culture Broth and Cells for the Examinations of NO and the Gene Expressions
To obtain the culture broth for the examination of NO, the J774.2 macrophages were cultured in a 96-well culture plate under five kinds of culture conditions. The cells (5 × 10³ cells) were cultured in 20 wells containing 200 μL of DMEM for 16 hours to promote cell attachment. Two microliters of ethanol or 50 mM oleic acid solution were added to every eight wells and cultured for another 24 hours. The media were replaced with 200 μL of DMEM or DMEM containing 20 μg/mL of LPS and cultured for 48 hours. In the remaining four wells, 2 μL of 50 mM oleic acid and 2 μL of 50 mM carnitine solution were added and cultured for another 24 hours. The medium was replaced with 200 μL of DMEM containing 20 μg/mL of LPS and cultured for 48 hours. The NO concentrations in the culture broths were determined.
To obtain cells for the examination of the gene expressions, the J774.2 macrophages were cultured in a 24- well culture plate under four kinds of culture conditions. The J774.2 macrophages (5 × 10⁴ cells) were cultured in 12 wells containing 2 mL of DMEM for 16 hours to promote cell attachment. Twenty microliters of two solutions (50 mM oleic acid solution and solution containing both 50 mM oleic acid and 50 mM carnitine) were added to every three wells and cultured for another 24 hours. The media were replaced with 2 mL of DMEM containing 20 μg/mL of LPS and cultured for 48 hours. In the remaining six wells, 20 μL of ethanol was added, and the mixture was cultured for another 24 hours. The medium was replaced with 2 mL of DMEM containing 20 μg/mL of Lipopolysaccharide (LPS) or DMEM medium in every three wells and cultured for 48 hours. The cells obtained under the four kinds of culture conditions were used for the gene expression examinations.
2.4. NO Assay
NO secreted in the culture broth (without cells) rapidly changes to . Therefore, the concentration of NO was determined by measuring the level of
  using the Griess Reagent System (Promega KK, Tokyo, Japan). A total of 50 μL of culture broth was entered into a 96-well flat bottom plate, and 50 μL of Sulfanulamide solution was added to the broth. Following incubation for 10 minutes in the dark, 50 μL of NED solution was added, and the mixture was incubated for another 10 minutes. The solution was determined by measuring the absorbance at 540 nm. A total of four independent experiments were performed, and the average values, SDs and p-values determined according to the t-test were calculated.
2.5. Gene Expression Assay
The gene expression was examined using a real-time RT-PCR method. The total mRNA in the cells was purified, and the cDNA was synthesized using an RNeasy Lipid Tissue Mini Kit and a QuantiTeck Reverse Transcription Kit. The reaction mixture used for real-time RT-PCR was prepared with the Rotor-Gene SYBR Green PCR Kit. QuantiTeck Primer Assays [Mm Aclb 2 SG (QT01136772), Mm_Il1b_2_SG (QT01048355), Mm_Il6_1_SG (QT00098875), Mm_Il10_1_SG (QT00106169) Mm_Il12b_1_SG (QT00153643), Mm_Il15_1_SG (QT00107653), Mm_Il18_1_SG (QT0017129), Mm_Tnf_1_SG (QT00104006), were used as the primers for β-actin, interleukin (IL)-1b, IL-6, IL-10, IL-12b, IL-15, IL-18 and TNFα, respectively. The kits and primers were obtained from Qiagen K. K. (Tokyo, Japan). Real-time PCR was performed using the Rotor-GeneTM device (Qiagen K. K.). The reaction was carried out for 80 cycles of treatment at 95˚C for 5 seconds and 65˚C for 10 seconds. The threshold line and Ct values were determined using the Rotor-Gene 6000 series software program, and the relative amount of mRNA in the target cells in comparison to that observed in the controls was determined according to the ΔΔCt method, followed by calculation of the ΔCt values using β-actin as a housekeeping gene. Three independent experiments were performed, and the average values, SDs and pvalues were calculated.
3. RESULTS
3.1. Toxicity of Fatty Acids to Macrophages
The toxicity of fatty acids to macrophages was examined. We selected oleic acid from the fatty acids because its characteristics in adipocytes were examined in our previous study [18]. J774.2 macrophages were cultured in DMEM containing various concentrations of oleic acid for 24 hours, and then the ratio of surviving cells to total cells was determined using a WST-8 Cell Counting Kit. Figure 1 shows the survival ratio versus the concentration of oleic acid in the medium. Over 90% of the cells survived when cultured in the medium containing 0.1, 0.25 or 0.5 mM oleic acid. However, when the cells were cultured in the medium containing 1, 2 or 4 mM oleic acid, most of the cells died.
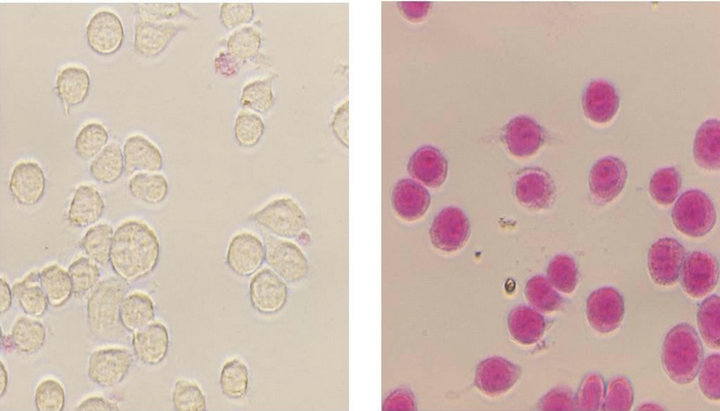
Next, the cells were examined using the APOPercentageTM Apoptosis Assay Kit to determine whether the cell death was caused by apoptosis. Figure 2 shows photographs of the cells stained with the kit after the cells were cultured in DMEM containing 0.5 or 2 mM oleic acid for one hour. If apoptosis was induced, the cells were stained red due to penetration of the APOPercentage dye. As shown in Figure 2(b), apoptosis was induced when the cells were cultured in the medium containing 2 mM oleic acid. Additionally, Figure 3(b) shows the changes in the cells one hour after apoptosis. The apoptosis cells were aggregated to an extremely large size. Meanwhile, apoptosis was not induced in the medium containing 0.5 mM oleic acid (Figure 2(a)), even though the survival ratio decreased by 10%, as shown in Figure 1. As the survival ratio was calculated according to the mitochondrial activity in the WST-8 Cell Counting Kit, the 10% decrease may not have caused the cell death, but rather caused the decrease in the mitochondrial activity.
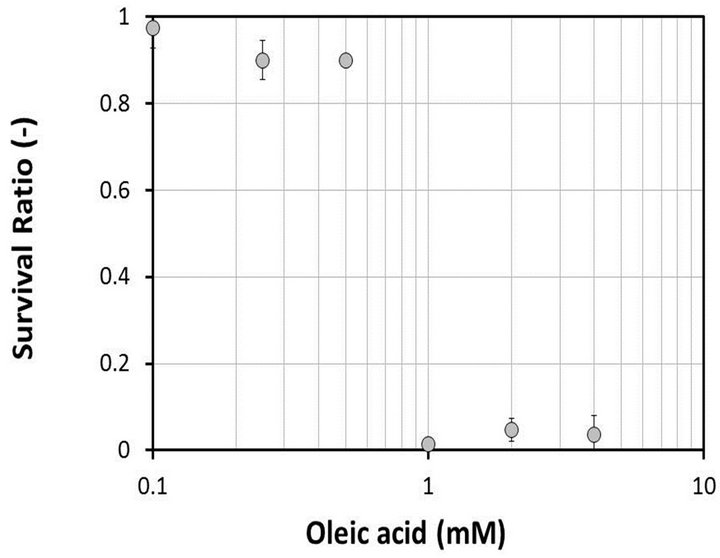
Figure 1. Toxicity of oleic acid to J774.2 macrophages. Macrophages were cultured in DMEM containing various concentrations of oleic acid. Survival ratio, survival cells per total cells. Bars, means ± S.D.
 (a) (b)
Figure 2. Apoptosis of macrophages following the addition of 2 mM oleic acid. J774.2 macrophages cultured in DMEM containing 0.5 mM (a) and 2 mM (b) oleic acid for one hour were stained with APOPercentage Dye.
3.2. Characteristics of M1 Macrophages
Macrophages generally differentiate into M1 macrophages following stimulation of LPS; however, the characteristics of M1 macrophages differentiated from the cell line of J774.2 macrophages have not been sufficiently elucidated. Therefore, we examined these characteristics.
In the preliminary experiment, the optimal concentration of LPS was examined in the media containing various concentrations of LPS, and the best concentration was determined to be 20 μg/mL (data not shown). J774.2 macrophages precultured in DMEM for 24 hours were cultured in DMEM containing 20 μg/mL of LPS or DMEM (without addition) for 48 hours. We named the resultant macrophages “M1 macrophages” and “standard macrophages,” respectively. Figures 3(c) and 4 show a photograph of the M1 macrophages and the concentration of NO in the culture broth. The changes in cell size and the NO level are indicators of differentiation. As shown in Figures 3(a) and (c), the size of the M1 macrophages became several times larger than that of the
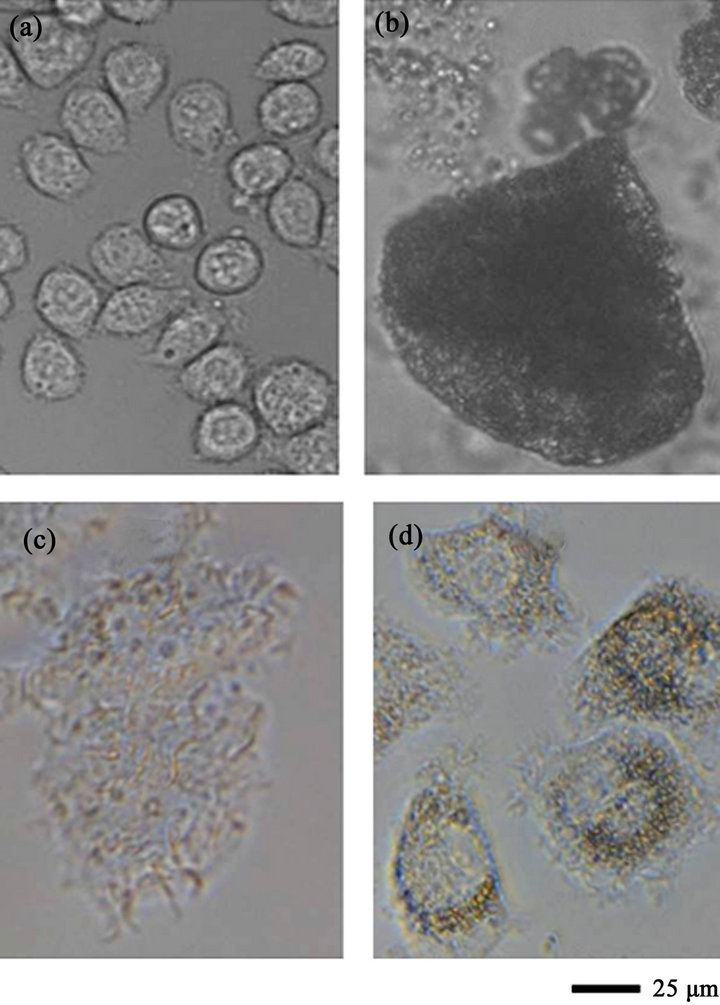
Figure 3. Photographs of the J774.2 macrophages. (a) macrophages cultured in DMEM (standard macrophages); (b) macrophages cultured in DMEM containing 2 mM oleic acid for two hours; (c) macrophages cultured in DMEM containing 20 μg/mL of LPS for 48 hours (M1 macrophages); (d) macrophages cultured in DMEM containing 20 μg/mL LPS for 48 hours after being cultured in medium containing 0.5 mM oleic acid for 24 hours (M1 macrophages treated with oleic acid).
standard macrophages. The NO concentration in the culture broth containing M1 macrophages was 20 μM, which was approximately 11 times higher than that observed in the culture broth containing standard macrophages (Figure 4). Moreover, the expression levels of mRNAs of interleukins and TNFα were examined using a real-time RT-PCR method. Figure 5 shows the ratios of mRNAs of interleukins and TNFα in the M1 macrophages to those observed in the standard macrophages. The expression levels of the mRNAs in the M1 macrophages were much higher than those observed in the standard macrophages, especially the values of IL-1b, IL-6 and IL-12b, which were increased over 100 times. We used the values of the M1 macrophages as positive controls for the next examination.

Figure 4. NO concentration in the culture broth. White bars, culture broth of the cells cultured in DMEM medium for 48 hours following culture in DMEM containing 0 mM oleic acid (a) or 0.5 mM oleic acid (b) for 24 hours. Black bars, culture broth of cells cultured in DMEM medium containing 20 μg/mg of LPS for 48 hours following culture in DMEM containing 0 mM oleic acid (c), 0.5 mM oleic acid (d) or 0.5 mM oleic acid and 0.5 mM carnitine (e) for 24 hours. Bars, means ± S.D. **p < 0.01 vs. control (standard macrophages) and #p > 0.05.
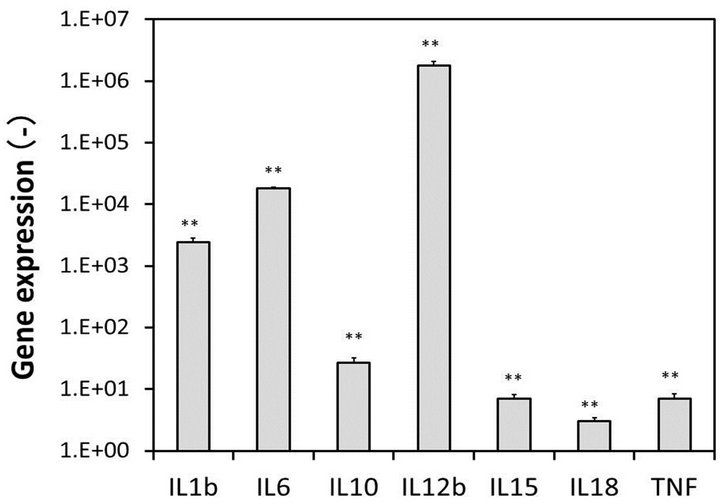
Figure 5. Gene expressions in the M1 macrophages. Gene expressions, the ratios of the mRNA levels of interleukins and TNFα in the M1 macrophages to those observed in the standard macrophages. Bars, means ± S.D. **p < 0.01 vs. control (standard macrophages) and *p < 0.05.
3.3. Inhibition of the M1 Macrophage Activity by Oleic Acid
The 0.5 mM oleic acid solution corresponds to the concentration of free fatty acids in blood in obese individuals (general value: 140 - 850 μEq/L). Therefore, we examined the effects of 0.5 mM oleic acid on the activity of the M1 macrophages.
Initially, J774.2 macrophages were cultured in DMEM containing 0.5 mM oleic acid in a preliminary test. Neither the growth rate nor the survival ratio were affected by 0.5 mM oleic acid (data not shown). Next, J774. 2 macrophages precultured in DMEM containing 0.5 mM oleic acid for 24 hours were cultured in medium containing 20 μg/mL of LPS for 48 hours. We named the resultant macrophages “M1 macrophages treated with oleic acid.” Figures 3(d) and 4 show a photograph and the NO concentration in the M1 macrophages treated with oleic acid. The size of the M1 macrophages treated with oleic acid (Figure 3(d)) was much smaller than that of the M1 macrophages (Figure 3(c)). Furthermore, the NO concentration in the culture broth containing M1 macrophages treated with oleic acid was 38% lower than that observed in the culture broth containing M1 macrophages (Figure 4).
Figure 6 shows the ratio of the mRNAs levels of interleukins and TNFα in the M1 macrophages treated with oleic acid to those observed in the M1 macrophages. All gene expressions in the M1 macrophages treated with oleic acid were inhibited, and the levels of IL-6, IL-12b, IL-15 and IL-18 were decreased by over 80%. These results suggest that 0.5 mM oleic acid inhibits the activity of M1 macrophages.
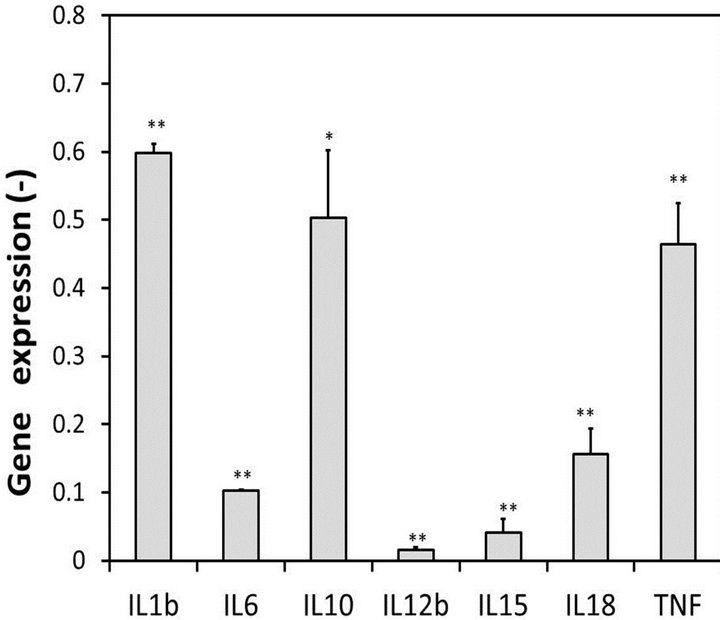
Figure 6. Inhibition of the gene expressions by oleic acid. Gene expressions, the ratios of the mRNA levels of interleukins and TNFα in the M1 macrophages treated with oleic acid to those observed in the M1 macrophages. Bars, means ± S.D. **p < 0.01 vs. control (M1 macrophages) and *p < 0.05.
3.4. Effects of Carnitine on the M1 Macrophage Dysfunction Induced by Oleic Acid
In our previous study, carnitine was effective in decreasing triglyceride accumulation induced by oleic acid in adipocytes [18]. Therefore, we examined the effects of carnitine on the dysfunction of M1 macrophages. Cells precultured in DMEM containing both 0.5 mM carnitine and 0.5 mM oleic acid for 24 hours were cultured in medium containing 20 μg/mL of LPS for 48 hours. We named the resultant macrophages “M1 macrophages treated with carnitine and oleic acid.” As shown in Figure 4, the NO concentration in the M1 macrophages treated with carnitine and oleic acid was slightly lower than that observed in the M1 macrophages treated with oleic acid (p > 0.05). The expression levels of mRNA of interleukins and TNFα were also examined. Figure 7 shows the ratios of the mRNA levels in the M1 macrophages treated with carnitine and oleic acid to those obrved in the M1 macrophages treated with oleic acid. The expression levels of interleukins and TNFα, except for that of IL-6, increased (by approximately 0% - 30%); however, the amounts were not sufficient. These results suggest that the protective effects of carnitine against the dysfunction of M1 macrophages induced by fatty acids are weak.
4. DISCUSSION
The risk of cancer and allergies in obese subjects is much higher than that observed in standard-weight individuals. These statistical data suggest that dysfunction of the immune system occurs in obese persons. Therefore, we examined the effects of high concentrations of free fatty
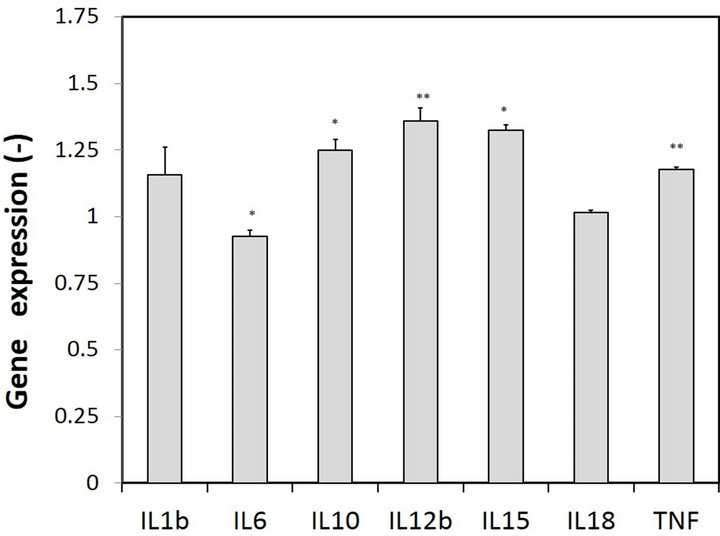
Figure 7. Protective effects of carnitine on the gene expressions. Gene expressions, the ratios of the mRNA levels of interleukins and TNFα in the M1 macrophages treated with 0.5 mM oleic acid and 0.5 mM carnitine to those observed in the M1 macrophages treated with 0.5 mM oleic acid. Bars, means ± S.D. **p < 0.01 vs. control (M1 macrophages treated with 0.5 mM oleic acid) and *p < 0.05.
acids on the activity of macrophages because a high concentration of free fatty acids in the blood is an important signal involved in metabolic syndrome and macrophages are an important monocyte in the immune system.
First, we examined the toxicity of high concentrations of a fatty acid. As shown in Figures 1 and 2, apoptosis was induced when the cells were cultured in the medium containing over 1 mM oleic acid. These results are similar to those of previous reports [16,19]. The interesting finding is that the dead cells constructed huge blocks (Figure 3(b)). This aggregation was thought to be caused by leakage of digestive enzymes contained in macrophages for phagocytosis. The hypertrophic WAT found in obese subjects is constantly disrupted by inflammation and is a gathering site for macrophages. Therefore, more than 1 mM free fatty acids is most likely present in WAT. Apoptosis of the inner wall of blood vessels and blockage due to aggregation may be present.
Next, we examined the effects of 0.5 mM oleic acid on the activity of the M1 macrophages. This concentration corresponds to the level of free fatty acids observed in obese individuals. As shown in Figures 3-6, the size of the M1 macrophages treated with oleic acid was smaller than that of the M1 macrophages, and the NO secretion and expression levels of interleukins, especially IL-6, IL-12, IL-15 and IL-18, were strongly inhibited. These results suggest that the activity of M1 macrophages is inhibited by 0.5 mM oleic acid.
M1 macrophages are an activated type of macrophages and are related to the development of atherosclerosis, cancer and allergies. The NO secreted by macrophages inhibits the adherence and invasion of macrophages to blood vessels; therefore, a decreased NO production promotes atherosclerosis. Moreover, IL-6 and IL-15 induce the differentiation of natural killer T-cells and Bcells. IL-12 and IL-18 enhance the production of IFNγ in T-cells and induce the differentiation of these cells to a Th1 type of T helper cell [20]. The inhibition of IL-6 and IL-15 decreases the body’s defense system against cancer, while the inhibition of IL-12 and IL-18 promotes allergies. Therefore, we suggest that the causes of the high risk of cancer and allergies observed in obese subjects may involve the inhibition of these interleukins.
Finally, the protective effects of carnitine against macrophage dysfunction were examined. Free fatty acids in the blood exhibit dysfunction in many organs, includeing the liver, muscles and pancreas [9-12]. Therefore, compounds inhibiting this dysfunction are very useful. We expected carnitine to act as a protective compound because it promotes the degradation of fatty acids in mitochondria and is useful for treating metabolic syndrome in adipocytes [18]. However, the secretion of NO was not increased by the addition of carnitine, and the gene expressions of interleukins increased by only 0% - 30% (Figure 7). Therefore, the protective effects of carnitine were weak. We are currently investigating more effective compounds derived from components contained in galenicals and vegetables.
5. ACKNOWLEDGEMENTS
Our group sincerely thanks Ms. Miwako Maeda, Saya Yamanishi, Sizuka Morimoto, Izumi Hirose, Sumi Mika, Eri Kitano, Satori Tsuburo and Natsumi Tatsutani for their assistance with our research. This work was supported by a grant-in-aid from the School of Human Sciences and the Research Institute at Kobe College.
REFERENCES
- Chan, J.M., Rimm, E.B., Colditz, G.A., Stampfer, M.J. and Willett, W.C. (1994) Obesity, fat distribution, and weight gain as risk factors for clinical diabetes in men. Diabetes Care, 17, 961-969. doi:10.2337/diacare.17.9.961
- Roberts, D.L. and Dive, A.G. (2010) Biological mechanisms linking obesity and cancer risk: New perspective. Annual Review of Medicine, 61, 301-316. doi:10.1146/annurev.med.080708.082713
- Silverberg, J.I., Silverberg, N.B. and Lee-Wong, M. (2012) Association between atopic dermatitis and obesity in adulthood. The British Journal of Dermatology, 166, 498- 504. doi:10.1111/j.1365-2133.2011.10694x
- Matuzawa, Y. (2006) The metabolic syndrome and adipocytokines. FEBS Letters, 580, 2917-292. doi:10.1016/j.febslet.206.04.028
- Yamaguchi, T., Kamo, J., Waki, H., Terauchi, Y., Kubota, N., Hara, K., Mori, Y., Ide, T., Murakami, K., TsuboyamaKasaoka, N., Ezaki, O., Akanuma, Y., Gavrilova, O., Vinson, C., Reitman, M.L., Kagechika, H., Shudo, K., Yoda, M., Nakano, Y., Tobe, K., Nagai, R., Kimura, S., Tomita, M., Froguel, P. and Kadowaki, T. (2001) The fat-derived hormone adiponectin reverses insulin resistance associated with both lipoatrophy and obesity. Nature Medicine, 7, 941-946. doi:10.1038/090984
- Simomura, I., Hammer, R.E., Ikemoto, S., Brown, M.S. and Gorldstein, J.L. (1999) Leptin reverses insulin resistance and diabetes mellitus in mice with congenital lipodystrophy. Nature, 401, 73-76. doi:10.1038/43448
- Hotamisligil, G.S., Sharg, N.S. and Spiegelman, B.M. (1993) Adipose expression of tumor necrosis factor-α: Direct role in obesity-linked insulin resistance. Science, 259, 87-91. doi:10.1126/science.7678183
- Lowell, B.B. and Shulman G. I. (2005) Mitochondrial dysfunction and type 2 diabetes. Science, 307, 384-387. doi:10.1126/science.1104343
- Lillioja, S., Bogardus, C., Mott, D.M., Kennedy, A.L., Knowler, W.C. and Howard, B.V. (1985) Relationship between insulin-mediated glucose disposal and lipid metabolism in man. The Journal of Clinical Investigation, 75, 1106-1115. doi:10.1172/JCI111804
- Rodern, M., Price, T.B., Perseghin, G., Petersen, K.F., Rothman, D.L. and Cline G.W. (1996) Mechanism of free fatty acid-induced insulin resistance in humans. The Journal of Clinical Investigation, 97, 2859-2865. doi:10.1172/JCI118742
- Corkey, B.E. (2000) The role of long-chain fatty acylCoA esters in beta-cell signal transduction. Journal of Nutrition, 130, 299S-300S.
- Itho, Y. (2003) Free fatty acids regulate insulin secretion from pancreatic beta cells through GPR40. Nature, 422, 173-176. doi:10.1038/nature01478
- Yaqoop, P., Knapper, J.A., Webb D.H., Williams, C.M., Newsholme, E.A. and Calder, P.C. (1998) Effect of olive oil on immune function in middle-aged man. American Journal of Clinical Nutrition, 67, 129-135.
- Otton, R., Graziola, F., Souza, J.A., Curi, T.C., Hirata, M.H. and Curi, R. (1998) Effect of dietary fat on lymphocyte proliferation and metabolism. Cell Biochemistry & Function, 16, 253-259.
- Yaqoob, P. (2003) Lipids and the immune response: From molecular mechanisms to clinical application. Current Opinion in Clinical Nutrition and Metabolic Care, 6, 133- 150.
- Martins de Lima, T., Cury-Boaventura, M.F., Giannocco, G., Nunes, M.T. and Curi, R. (2006) Comparative toxicity of fatty acids on macrophage cell line (J774). Clinical Science, 111, 307-317.
- Weisberg, S.P., McCann, D., Desai, et al. (2003) Obesity is associated with macrophage accumulation in adipose tissue. Journal Clinical Investigation, 112, 1796-1808. doi:10.1172/JCI19246
- Shiomi, N., Maeda, M. and Mimura, M. (2011) Compounds that inhibit triglyceride accumulation and TNFα secretion in adipocytes. Journal of Biomedical Science and Engineering, 4, 684-691. doi:10.4236/jbise.2011.411085
- Kim, H.-K. Della-Fera, M. Linile, J. and Baile, C.A. (2006) Docosahexanoeic acid inhibits adipocyte differentiation and induces apoptosis in 3T3-L1 preadipocytes. The Journal of Nutrition, 136, 2965-2969.
- Hocaoglu, C., Kural, B., Aliyazıcıoglu, R., Deger, O. and Cengiz, S. (2012) IL-1β, IL-6, IL-8, IL-10, IFN-γ, TNF-α and its relationship with lipid parameters in patients with major depression. Metabolic Brain Disease, 27, 425-430. doi:10.1007/s11011-012-9323-9