Journal of Biomedical Science and Engineering
Vol.7 No.1(2014), Article ID:42427,7 pages DOI:10.4236/jbise.2014.71006
Purine nucleotides and their metabolites in patients with type 1 and 2 diabetes mellitus
![]()
Department of Physiology, Faculty of Biology, Szczecin University, Szczecin, Poland
Email: wiola@univ.szczecin.pl
Copyright © 2014 Wioleta Dudzinska. This is an open access article distributed under the Creative Commons Attribution License, which permits unrestricted use, distribution, and reproduction in any medium, provided the original work is properly cited. In accordance of the Creative Commons Attribution License all Copyrights © 2014 are reserved for SCIRP and the owner of the intellectual property Wioleta Dudzinska. All Copyright © 2014 are guarded by law and by SCIRP as a guardian.
Received 23 November 2013; revised 26 December 2013; accepted 15 January 2014
ABSTRACT
We measured the erythrocyte levels of principal nucleotides (ATP, ADP, AMP, GTP, GDP, GMP, IMP), nucleosides (Ado, Guo, Ino) and Hyp with HPLC. Purine concentrations were determined in the erythrocytes of 36 type 1 and 40 type 2 diabetic patients. The increased dephosphorylation of adenine and guanine nucleotides, indicated by increased Ado, Ino, Guo and Hyp concentrations as the products of purine nucleotide degradation, suggests serious energy metabolism disruptions in diabetes. An increase in AMP, GMP, IMP concentrations, as well as a decrease in AEC and GEC values, points to significant alterations in erythrocyte purine nucleotide concentration.
KEYWORDS
Purine Nucleotides; Nucleosides; Purine Bases; Diabetes
1. INTRODUCTION
Purine metabolism involves synthesis and degradation of purine nucleotides and determines the value of the adenylate and guanylate pool. In this way, it is responsible for the absolute value of intracellular ATP and GTP concentrations. The unique erythrocyte structure and metabolism are due, among other things, to a deficiency of glutamine PRPP amidotransferase (EC 2.4.2.14) and its inability to synthesize purine nucleotides in a de novo pathway. Thus, in erythrocytes, these compounds are formed in the reactions of reutilization, i.e. the reutilization of free purine bases (adenine—Ade, hypoxanthine— Hyp, and guanine—Gua) and nucleosides (adenosine— Ado, inosine—Ino and guanosine—Guo). The reutilization of purine nucleosides and bases is a source of erythrocyte purine mononucleotides. The metabolic aim of these reactions is to introduce these compounds into high energy purine nucleotide synthesis pathways (ATP, ADP, GTP and GDP) [1].
Purine metabolism can be evaluated by assessing the intracellular content. Although the study of purine nucleotide metabolism in diabetes is not limited by cell availability, our knowledge in this field is still incomplete. Literature reports the activity of some specific enzymes in diabetes (AK—adenosine kinase, EC 2.7.1.20; ADA—adenosine deaminase, EC 3.5.4.4; 5’-NT—5’- nucleotidase, EC 3.1.3.5; AMP-D—AMP deaminase, EC 3.5.4.6) [2-6]. There have been some studies on erythrocyte glucose, ATP, lactate concentrations and their modifications induced by plasma from normal subjects [7,8]. Some reports refer to the relations between intracellular ATP concentration and membrane ATPases activity [9-13]. However, the reports are not fully consistent.
Therefore, we measured the erythrocyte levels of principal nucleotides (ATP, ADP, AMP, GTP, GDP, GMP, IMP), nucleosides (Ado, Guo, Ino) and the Hyp base with HPLC. We calculated TAN, TGN, AEC and GEC expressed by the ratio of high/low energy nucleotide phosphates.
2. MATERIALS AND METHODS
2.1. Subjects
The subjects selected for this study were 36 (18 men and 18 women, mean age 43.7 ± 5.64 years) type 1 and 40 (20 men and 20 women, mean age 62.5 ± 7.24 years) Type 2 diabetic patients. Because the subjects differed in age (erythrocyte ATP concentration is affected by age [12]), we created control groups. Control subjects included a control for Type 1 diabetic patients (n = 20, 10 men and 10 women, mean age 38.8 ± 7.10 years) and for Type 2 diabetic patients (n = 20, 10 men and 10 women, mean age 61.7 ± 8.76 years). Control subjects were normotensive, drug-free, non-diabetic subjects with a negative family history of diabetes.
2.2. Blood Analysis
Serum glucose was assayed by a standard hexokinase enzymatic method. The value of hemoglobin A1c was determined by high-performance liquid chromatography.
Concentrations of purine (ATP, ADP, AMP), pyridine (GTP, GDP, GMP) and inosine (IMP) nucleotides, adenosine (Ado), inosine (Ino), guanosine (Guo) and hypoxanthine (Hyp) were determined in whole blood using high-performance liquid chromatography. Chromatographic analysis was performed using a Hewlett-Packard series 1100 high-performance liquid chromatograph according to the method used by Smolenski et al. [14]. We also calculated the value of TAN and TGN, and AEC and GEC.
Taking into account the hematocrit values, we were able to calculate the intraerythrocytic nucleotide concentrations (μmol/L RBC) on the assumption that there were no significant concentrations in plasma due to the effects of nucleotidases. The concentrations of nucleosides (Ado, Ino, Guo) and oxypurine (Hyp), which are present in both erythrocytes and plasma, are expressed as μmol/L of whole blood. They are not directly comparable with the concentrations being measured in separated erythrocytes or plasma.
The samples (500 μL) of heparinized blood were deproteinized with an equal volume of 1.3 M perchloric acid in 1.5 mL Eppendorf tubes and centrifuged at 16.000 × g for 10 min, at 4˚C. The supernatant (600 μL) was neutralized with 60 - 90 μL of 3 M potassium orthophosphate solution to a pH within 6.0 - 7.0. The neutralized extract was again centrifuged and filtered through a 0.22 μm nylon filter. The clear filtrate was then used for HPLC assay or stored at −80˚C until analysis.
3. STATYSTICAL ANALYSIS
Statistical analysis software (Statistica v.5.1) was used to analyze the findings. A non-parametric test for small or unequal size groups was used to assess variables regardless of their distribution. The significance of differences between groups was tested with non-parametric ANOVA tests: Kruskal-Wallis rank sum test and Mann-Whitney U-test. Since the data were not generally normally distributed according to the Shapiro-Wilk’s test (except glucose, hemoglobin A1c and age), a test for the Spearman’s rank correlation coefficient (rs) was used to verify the statistical significance of observed correlations. The accepted level of significance was defined as P < 0.05.
4. RESULTS
Mean fasting serum glucose concentration (mM) in type 1 (8.1 ± 3.44) and type 2 (8.4 ± 3.60) diabetic subjects was significantly higher (P < 0.01) compared with C1 (4.9 ± 0.26) and C2 (4.9 ± 0.25), respectively.
An increase in hemoglobin A1c (%) was also significantly different between diabetic patients and respective control groups. Hemoglobin A1c levels in type 1 (9.3 ± 4.04) and type 2 (9.4 ± 4.21) diabetic subjects were significantly higher (P < 0.01) compared with C1 (5.4 ± 0.40) and C2 (5.2 ± 0.36). No significant differences in glucose and hemoglobin A1c levels between both studied types of diabetic patients were observed.
We did not observe any significant changes in erythrocyte ATP and ADP concentrations in the subjects being selected for this study (Table 1).
The erythrocyte AMP significantly increased (P < 0.0001) in type 1 diabetic patients compared with the C1, and type 2 diabetic patients compared with the C2. Type 2 diabetic patients showed a higher cellular AMP concentration than type 1 ones (P < 0.01) (Table 1).
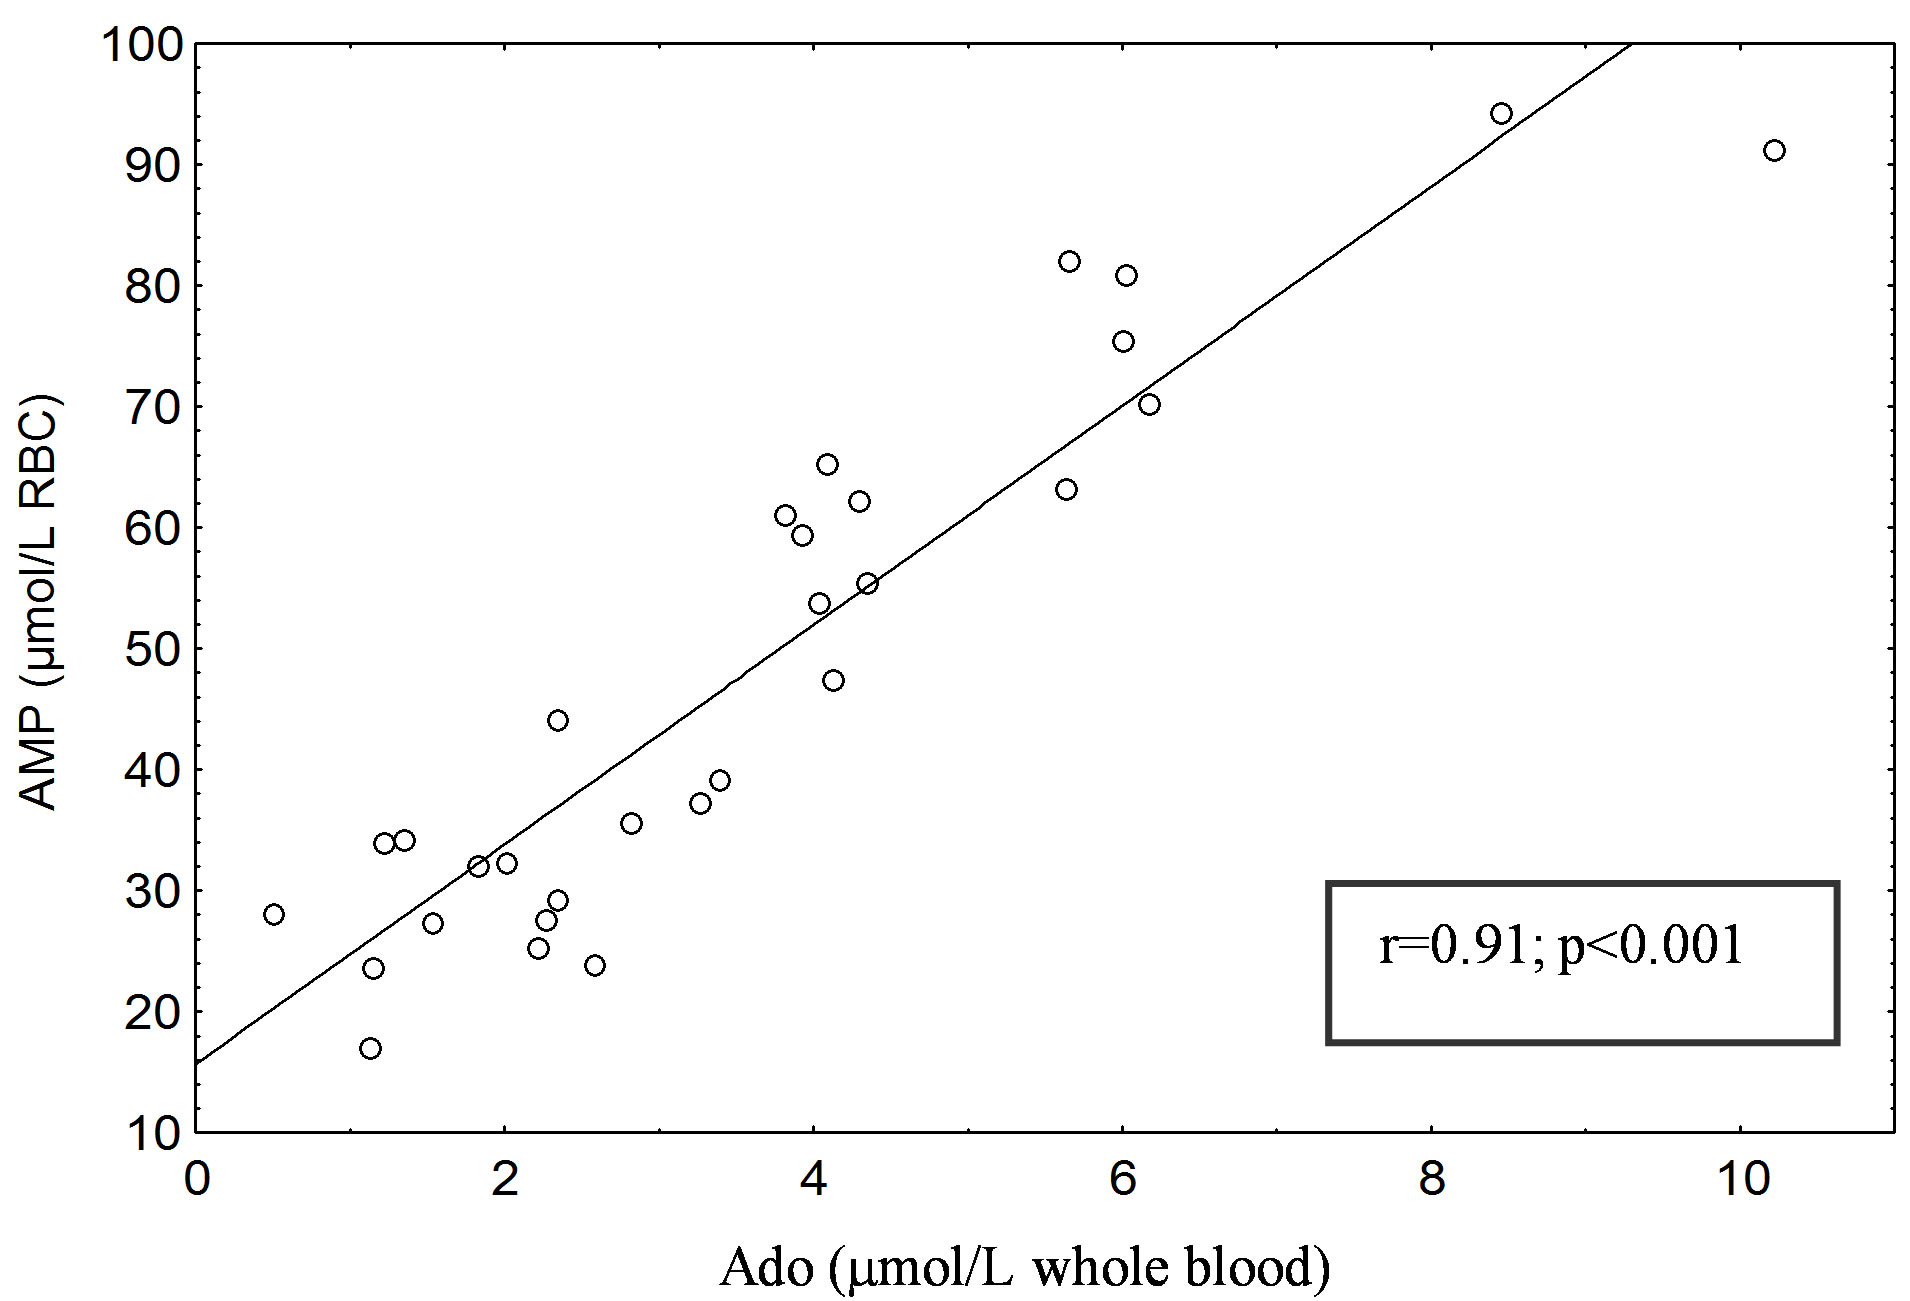
A significant positive correlation was found between erythrocyte AMP and blood Ado concentrations in type 1 (r = 0.94; P < 0.001) (Figure 1(a)) and type 2 diabetic subjects (r = 0.91; P < 0.001) (Figure 1(b)). No correlation was found between erythrocyte AMP and blood Ado levels in healthy subjects (C1 and C2), either between erythrocyte AMP level and that of glucose and hemoglobin A1c in patients with type 1 and 2 diabetes mellitus.
No significant differences were found in TAN. AEC values decreased by 10% (P < 0.0001) in type 1 and 2 diabetic subjects compared with controls C1 and C2, respectively (Table 2).
An increase in AMP concentrations, as well as a decrease in AEC values, points to significant alterations in the concentration of adenine nucleotides in diabetes.
The GTP level in erythrocytes from type 1 diabetic subjects was 127.15 µmol/L RBC and 126.31 µmol/L RBC from type 2 ones, which was significantly higher (P < 0.05) than in control groups: 59.45 15 µmol/L RBC (C1) and 58.15 µmol/L RBC (C2) (Table 1). GTP concentrations increased 2.1-fold in both groups of diabetic subjects, while GDP concentrations were increased (P < 0.05) in type 2 diabetic patients compared with the C2 but not in type 1 ones (Table 1).
Erythrocyte GMP level was significantly increased (P < 0.0001) in type 1 diabetic patients compared with the C1 and in type 2 diabetic patients (P < 0.001) compared with the C2 (Table 1). A significant positive correlation was found between erythrocyte GMP and blood Guo concentrations in type 1 diabetic subjects (r = 0.88; P < 0.0001) (Figure 2) but not in type 2 ones.
Erythrocyte TGN level was significantly increased (P < 0.001) in type 1 diabetic patients compared with the C1 and in type 2 diabetic patients (P < 0.001) compared with the C2 (Table 2). GEC values decreased by 5% (P < 0.01) in type 1 and 2 diabetic subjects compared with controls C1 and C2, respectively (Table 2).
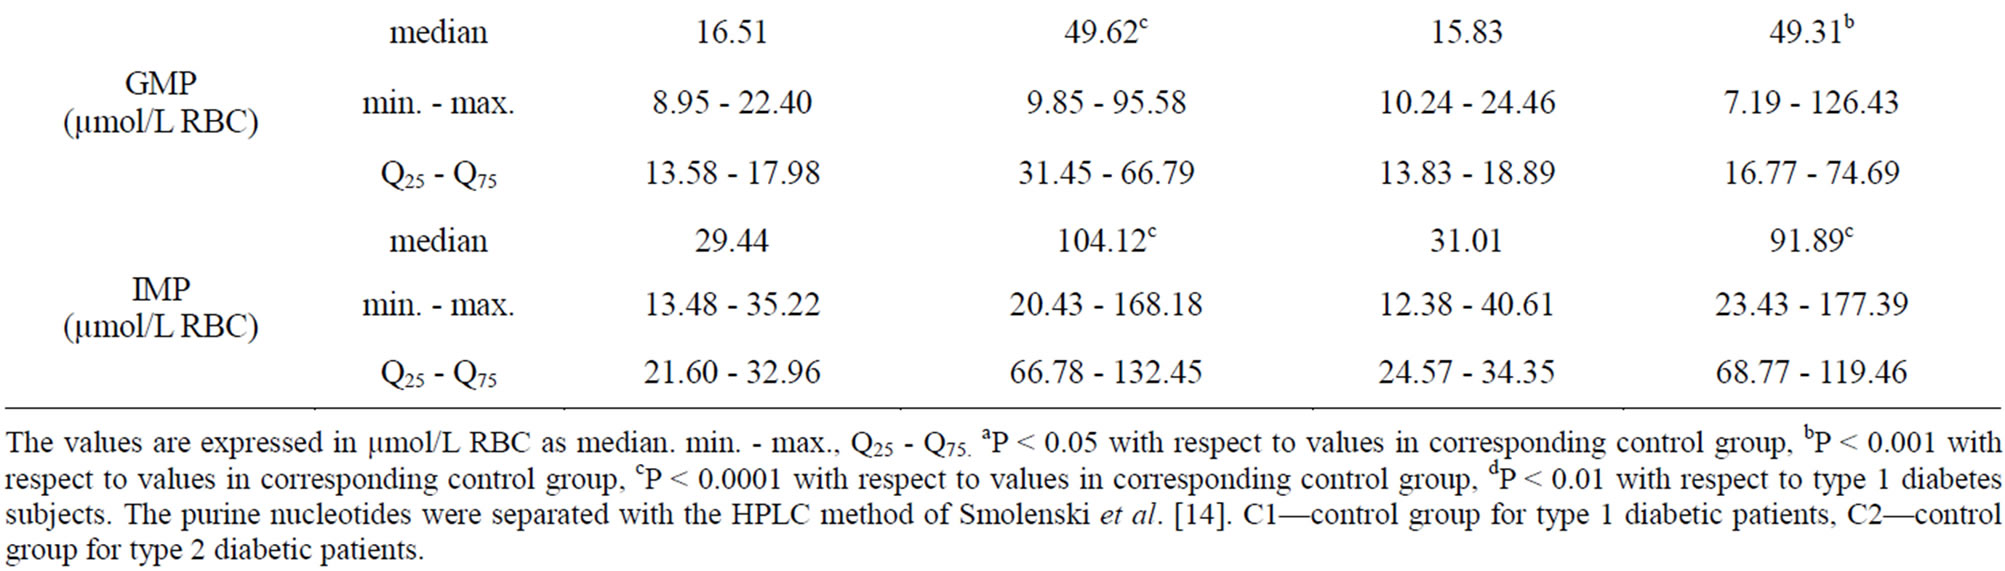
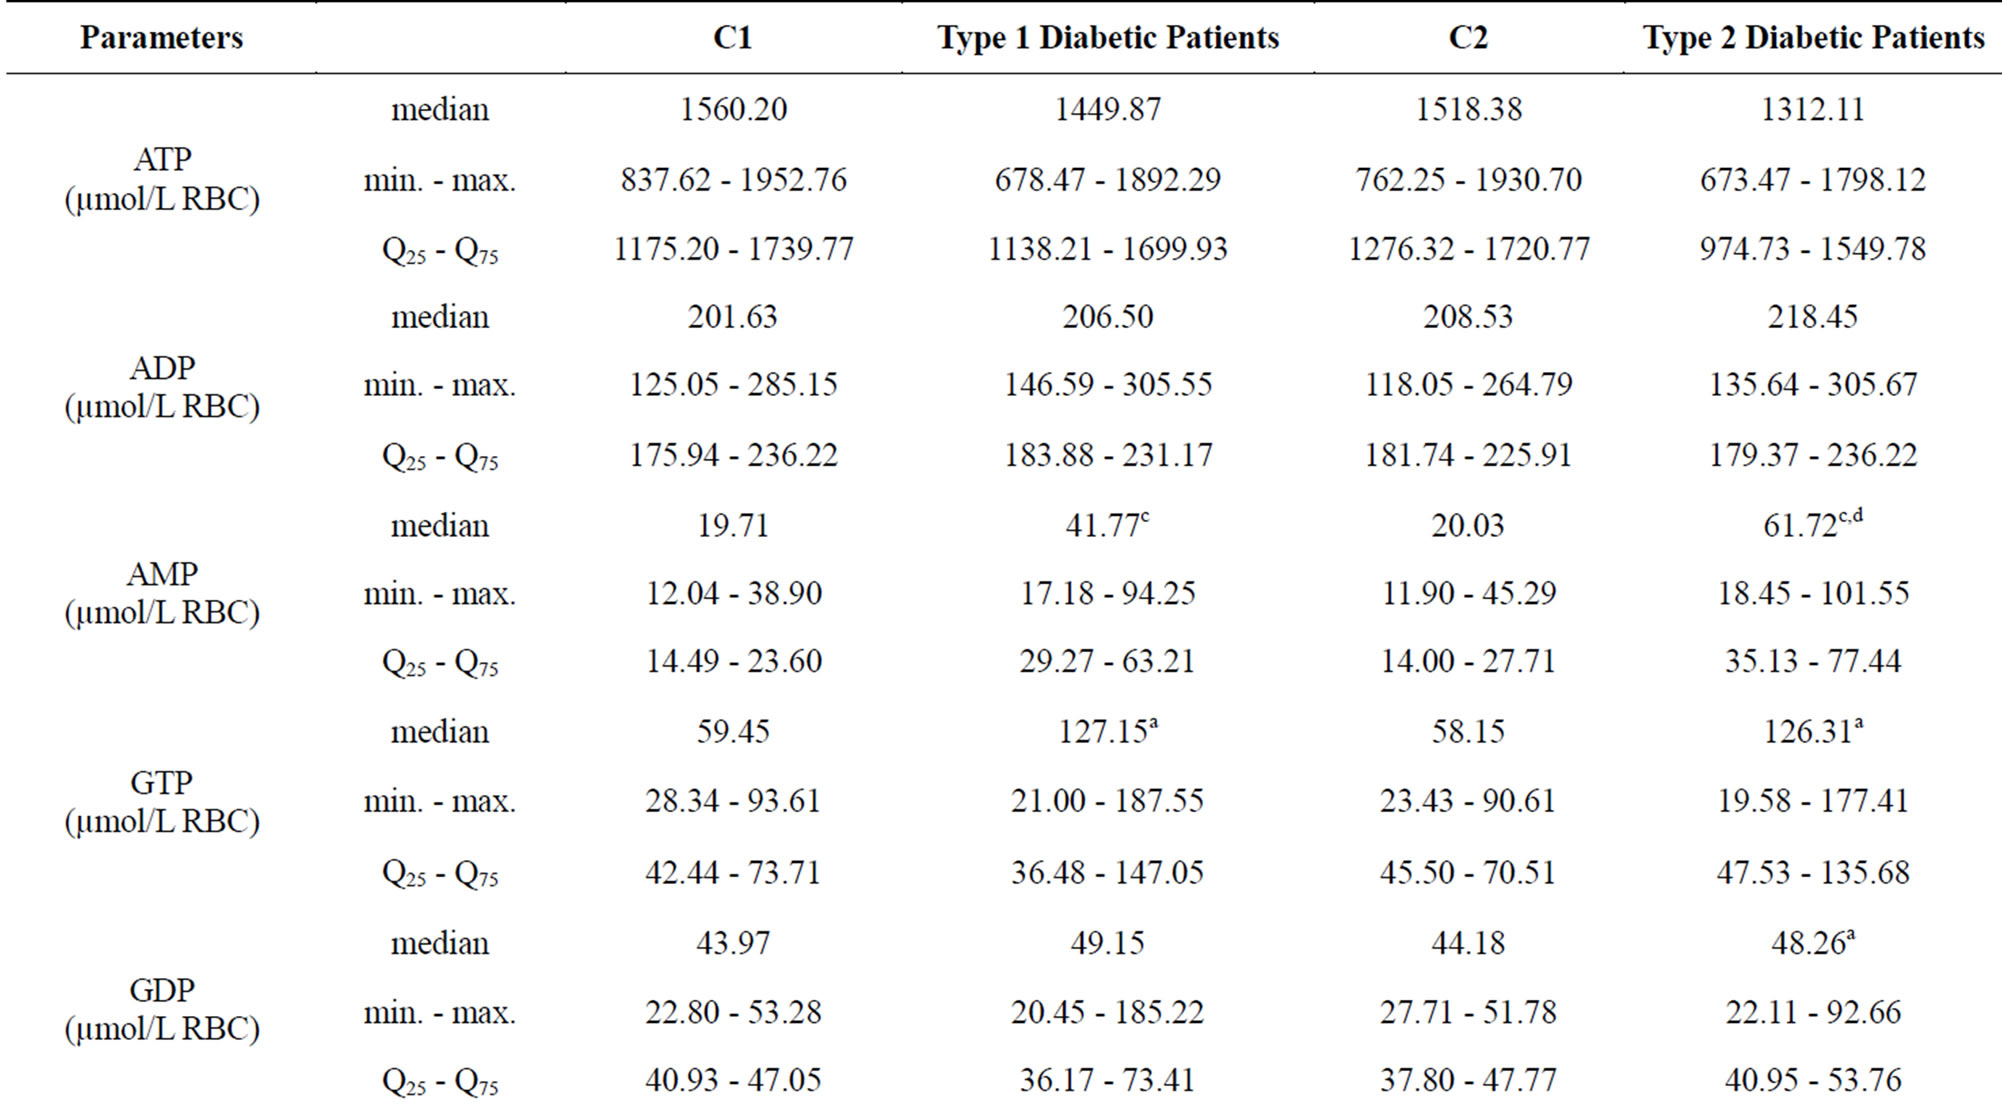
Table 1. Purine nucleotides content of erythrocytes in corresponding control group (C1 and C2) and Type 1 and Type 2 diabetic patients.
The values are expressed in µmol/L RBC as median. min. - max., Q25 - Q75. aP < 0.05 with respect to values in corresponding control group, bP < 0.001 with respect to values in corresponding control group, cP < 0.0001 with respect to values in corresponding control group, dP < 0.01 with respect to type 1 diabetes subjects. The purine nucleotides were separated with the HPLC method of Smolenski et al. [14]. C1—control group for type 1 diabetic patients, C2—control group for type 2 diabetic patients.
 (a)
(a)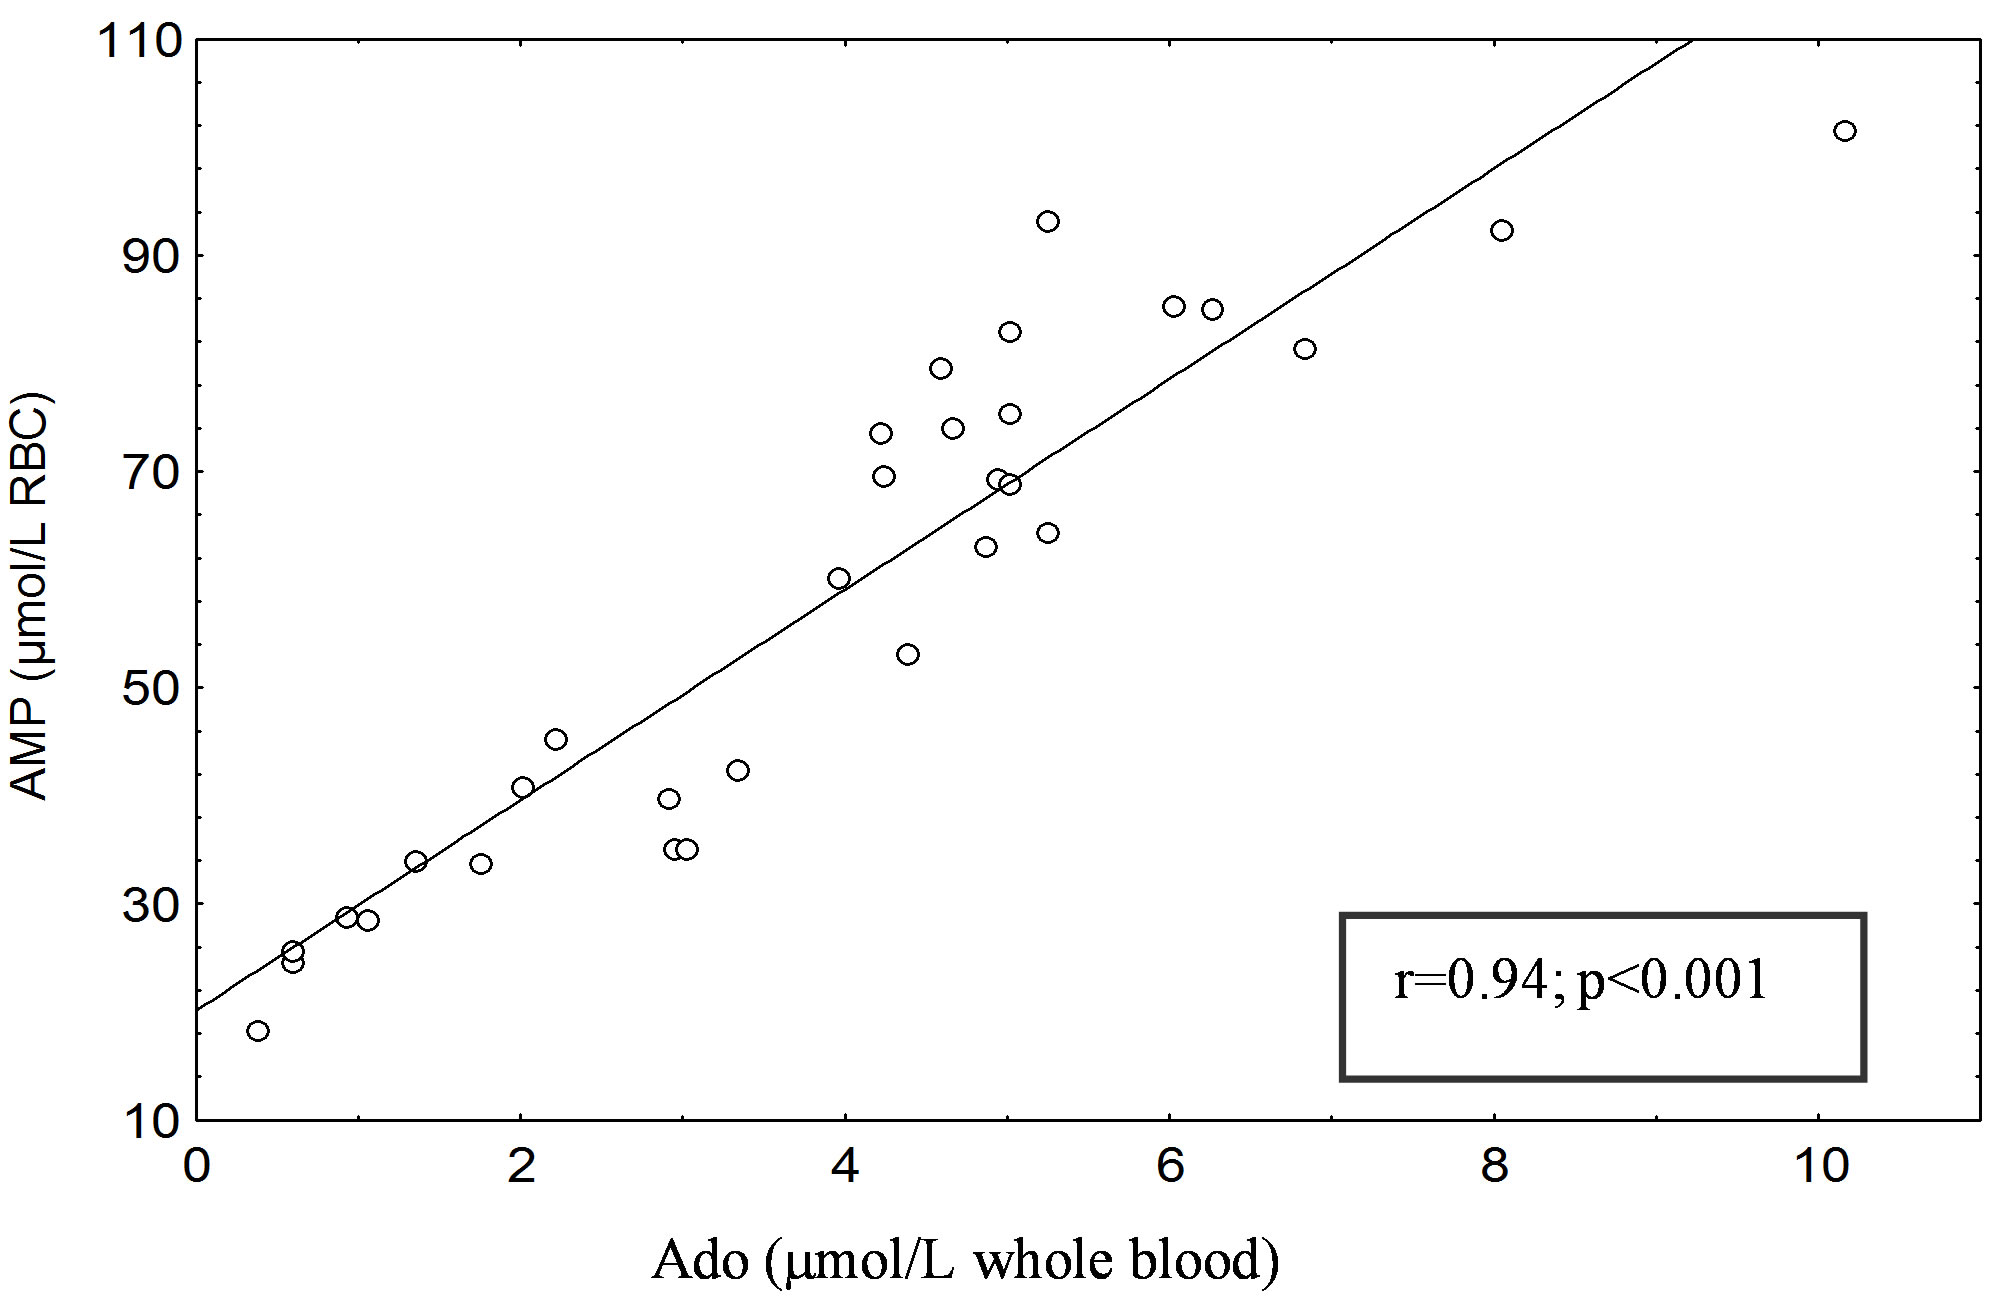 (b)
(b)
Figure 1. (a) Correlation between erythrocyte AMP content (µmol/L RBC) and blood Ado (µmol/L whole blood) in Type 1 diabetic patients. (b) Correlation between erythrocyte AMP content (µmol/L RBC) and blood Ado (µmol/L whole blood) in Type 2 diabetic patients. The AMP and Ado was separated with the HPLC method of Smolenski et al. [14].
No correlation was found between erythrocyte GMP and blood Guo levels in healthy subjects (C1 and C2), either between erythrocyte GMP level and that of glucose and hemoglobin A1c in patients with type 1 and 2 diabetes mellitus.
This study showed that the level of erythrocyte IMP increased in patients with diabetes.
IMP metabolism involves IMP degradation (by 5’- nucleotidase; EC 3.1.3.5) and the purine salvage pathway (by hypoxanthine-guanine phosphorybosyltransferase; EC 2.4.2.8). IMP degradation results in a decrease in the IMP levels. In contrast, the purine salvage pathway plays a role in the re-synthesis of IMP from Hyp. In theory, alteration in the level of erythrocyte IMP must involve a balance between the IMP removal pathways (degradation) and the IMP-producing pathway (purine salvage). The concentration of IMP in erythrocytes was significantly higher (P < 0.0001) in patients with type 1 and 2 diabetes mellitus. The IMP level was increased in type 1 and type 2 diabetic patients, 3.5-fold and 2.9-fold, respectively, compared with the control group (Table 1).
Table 3 shows differences in the level of nucleosides and Hyp. A significant increase (P < 0.00001) in Ado Ino, Guo and Hyp concentrations in blood was observed in diabetic subjects. No correlation was found between these parameters and glucose or hemoglobin A1c.
5. DISCUSSION
Results from this study are consistent with our previously reported [15] analysis of Ado, Ino and Guo concentrations in the blood of diabetic rats in which all the compounds were found to be increased. Changes in the nucleoside concentration in cells depend on the activity of the enzymes metabolizing these nucleosides and on the transport through the plasma membranes into extracellular fluid [16,17]. That is why increased nucleosides concentrations could be a result of accelerated purine nucleotide degradation under diabetic conditions [18], decrease in AK activity [19], and change in the expression level of nucleoside transporters [20]. It has been reported that the breakdown of ATP is increased in erythrocytes
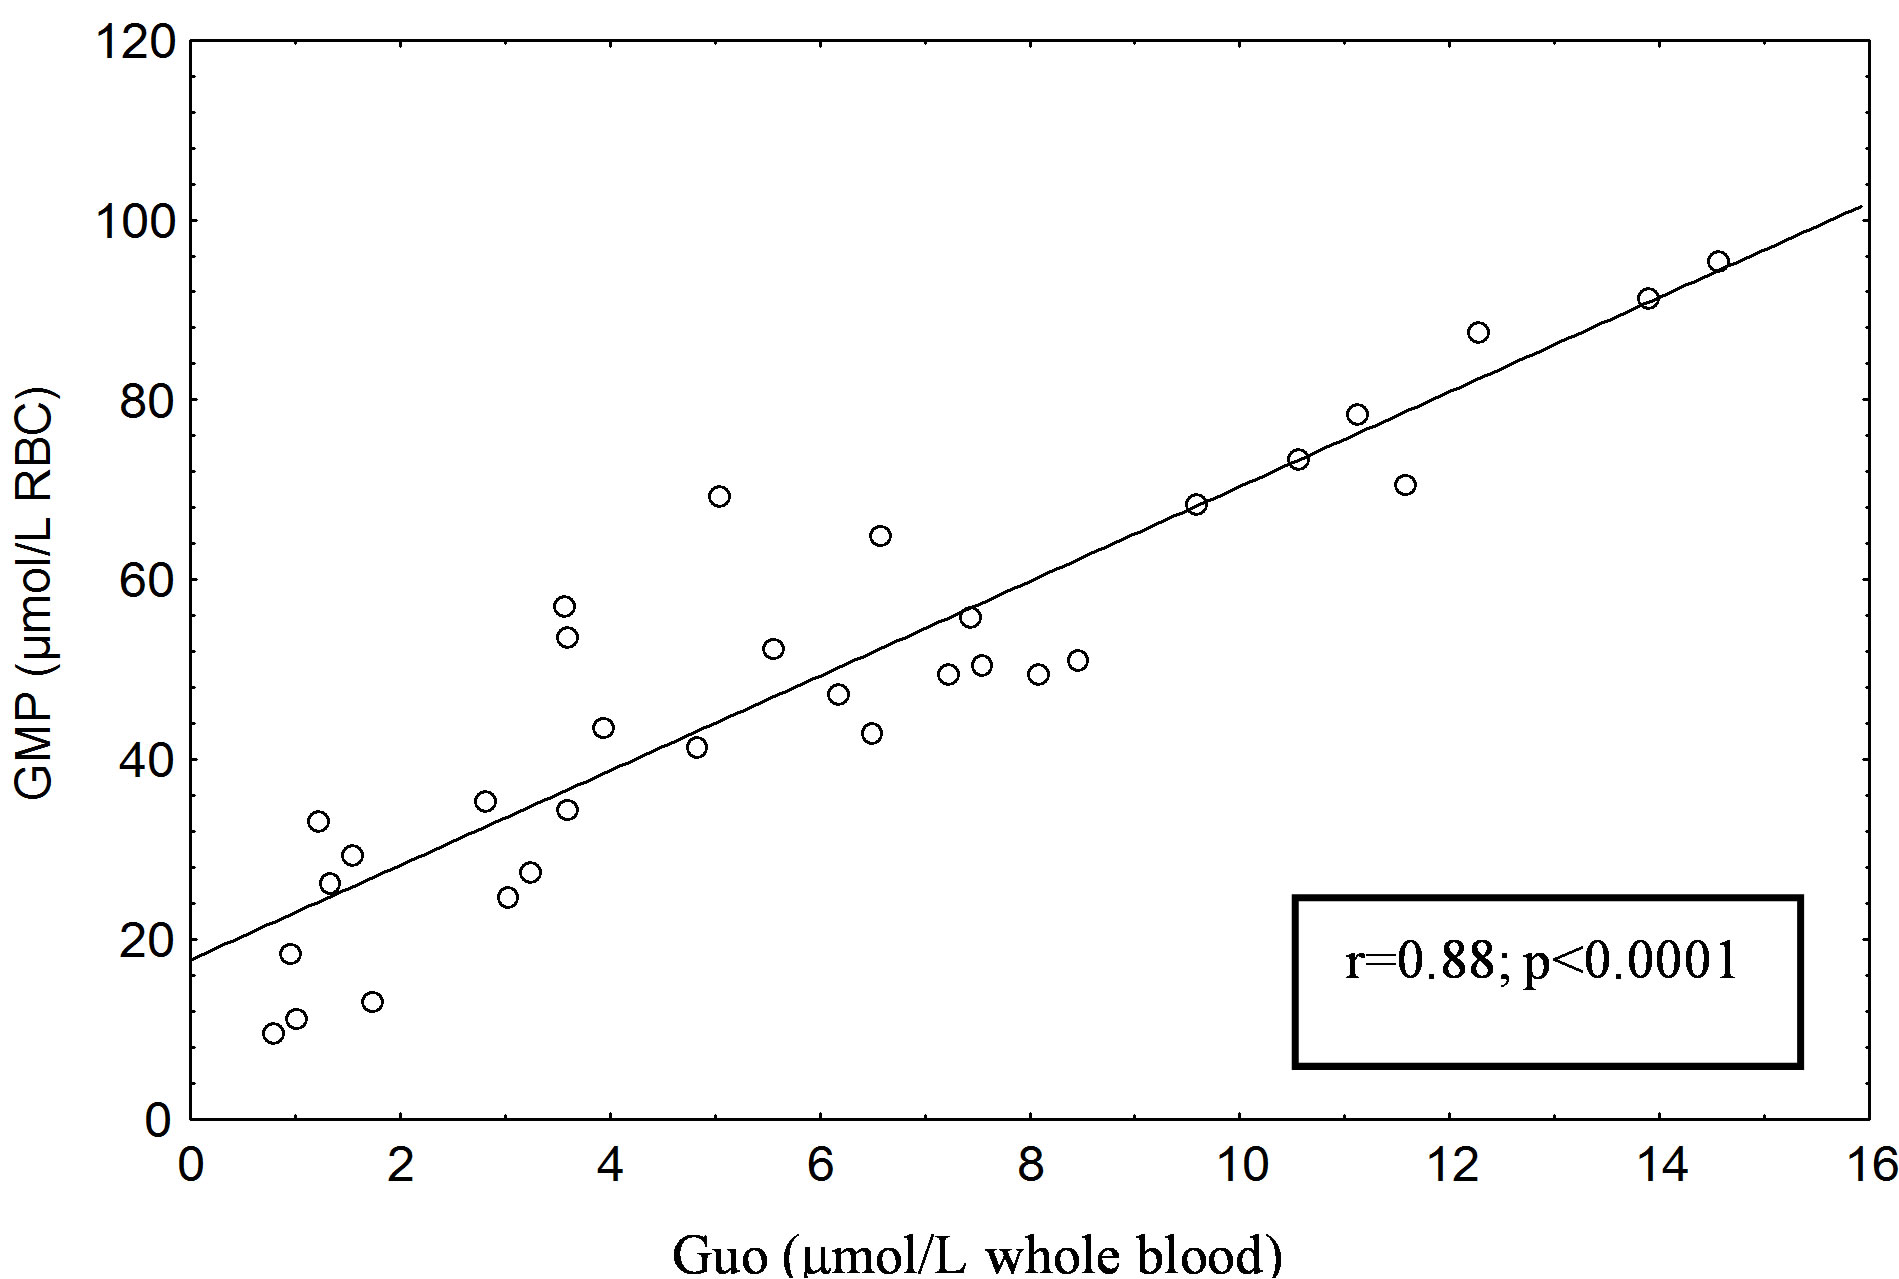
Figure 2. Correlation between erythrocyte GMP content (µmol /L RBC) and blood Guo (µmol/L whole blood) in Type 1 diabetic patients. The GMP and Guo was separated with the HPLC method of Smolenski et al. [14].

Table 2. Total adenine (guanine) nucleotides TAN (TGN) and adenylate (guanylate) charge AEC (GEC) values of erythrocytes in corresponding control group (C1 and C2) and Type 1 and Type 2 diabetic patients.
TAN (TGN) = [ATP] ([GTP]) + [ADP] ([GDP]) + [AMP] ([GMP]). AEC was evaluated according to the formula by Atkinson:  ;
; . The values of TAN and TGN are expressed in µmol/L RBC as median. min. - max. Q25 - Q75. aP < 0.01 with respect to values in corresponding control group, bP < 0.001 with respect to values in corresponding control group, cP < 0.0001 with respect to values in corresponding control group. The purine nucleotides were separated with the HPLC method of Smolenski et al. [14]. C1—control group for type 1 diabetic patients, C2—control group for type 2 diabetic patients.
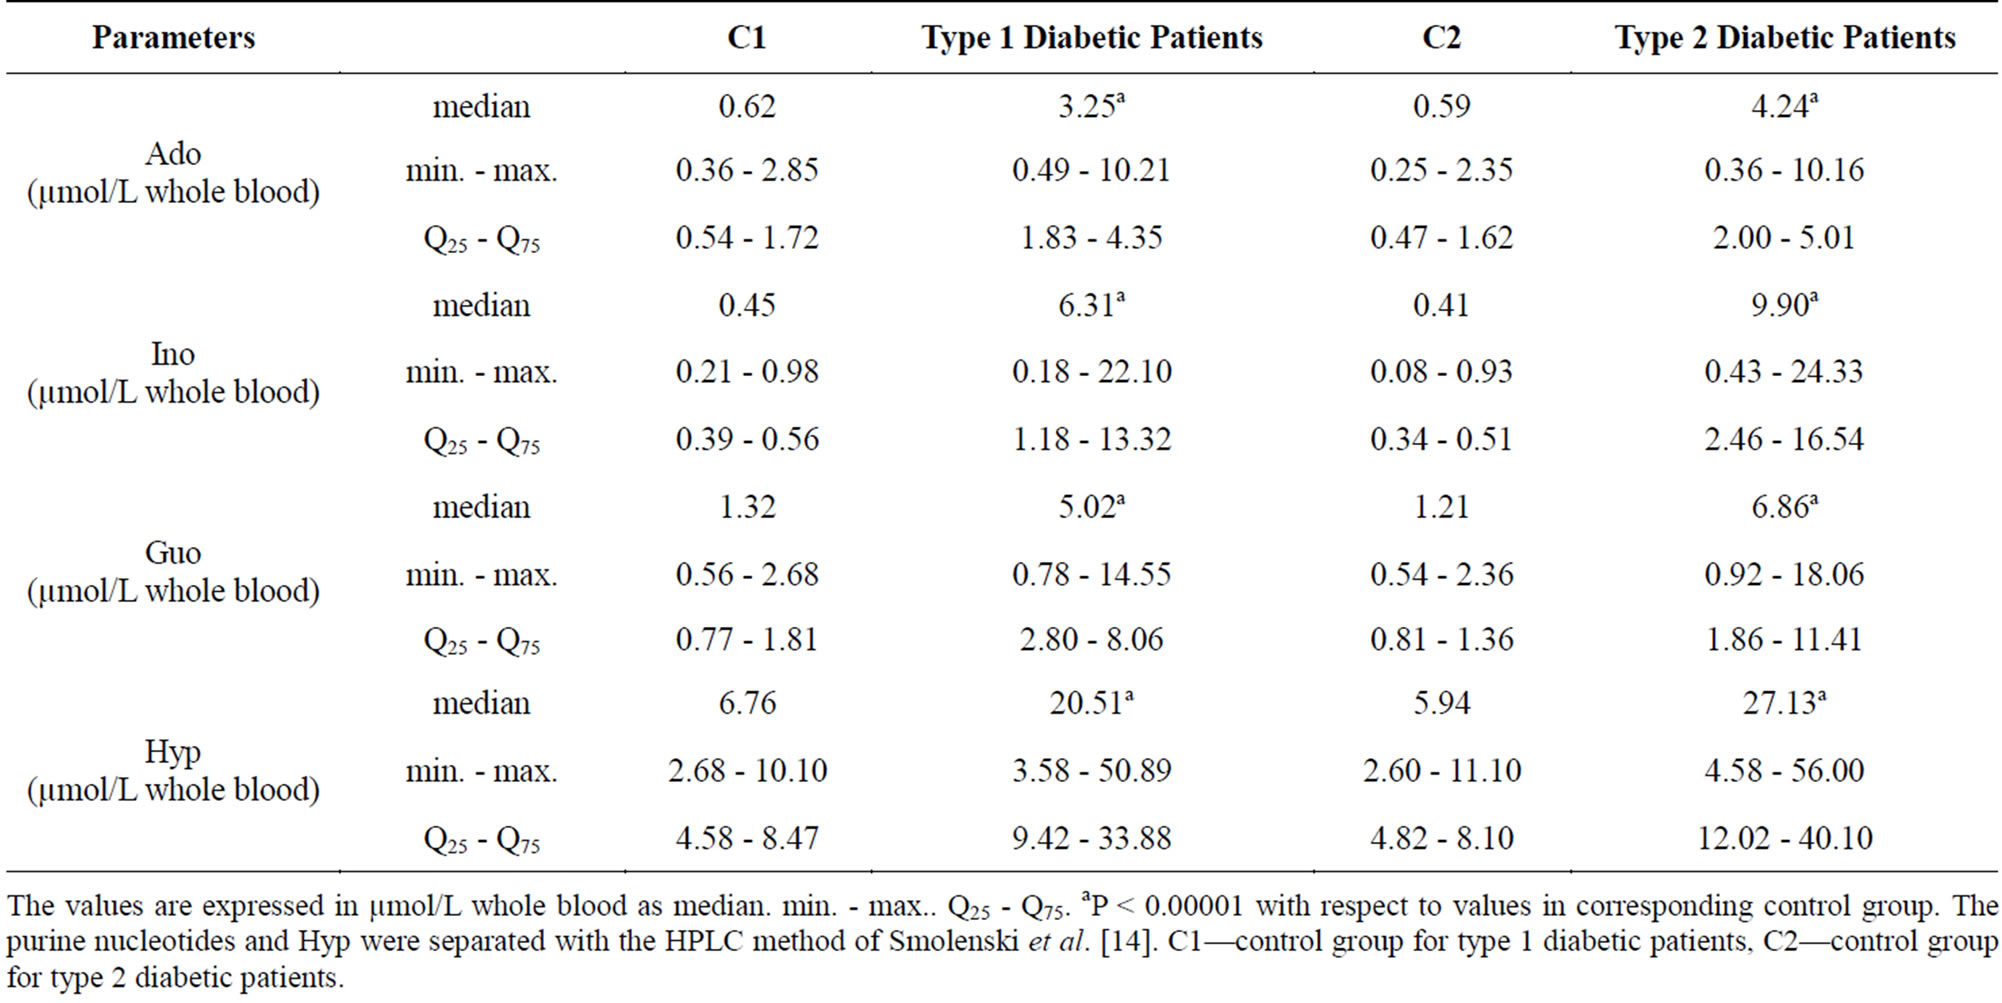
Table 3. Purine nucleosides (Ado. Ino. Guo) and hypoxanthine (Hyp) content in blood in corresponding control group (C1 and C2) and Type 1 and Type 2 diabetic patients.
The values are expressed in µmol/L whole blood as median. min. - max.. Q25 - Q75. aP < 0.00001 with respect to values in corresponding control group. The purine nucleotides and Hyp were separated with the HPLC method of Smolenski et al. [14]. C1—control group for type 1 diabetic patients, C2—control group for type 2 diabetic patients.
[15] and endothelial cells from animals with experimental diabetes mellitus, which could lead to the accumulation of extracellular Ado in diabetes and/or hyperglycemia [18]. Pawelczyk et al. [19] showed that also phosphorylation of Ado to AMP is significantly impaired in diabetic tissues (kidney, heart, liver) due to the reduced activity of AK, which correlates with decreased expression of AK gene. These changes lead to increased Ado concentration in cells.
Intracellular increase in Ado concentration may result in Ado release into the extracellular space. From the extracellular space, Ado then enters the peripheral circulation and is taken up by red blood cells or vascular endothelial cells, the latter having a particularly high density of nucleoside transporters [21]. In this manner, endothelial cells are capable of influencing extracellular Ado concentration and thereby many biological activities of Ado that are mediated by specific plasma membrane receptors. It has been demonstrated that Ado transport and the number of transporters are reduced in human umbilical vein endothelial cells isolated from gestational diabetic pregnancies [21].
Adenosine uptake is present in red blood cells and it is possible that, in view of their number, cells act as a sink for Ado. The half-life of Ado in human blood is estimated to be less than 10 seconds [22] because of cellular (also erythrocyte) uptake of Ado through a high-affinity nucleoside transporter.
A significant increase in Ado, Ino and Guo concentrations observed in our study puts forth a question about the role of these nucleosides in erythrocyte purine metabolism in diabetes. It has been reported that increased Ado concentration increases the concentration of adenine nucleotides in erythrocytes [23]. Komarova et al. [24] observed an increase in ATP and TAN after adding Ado into the erythrocyte hemolysate. According to these authors, ATP and TAN are dependent on the Ado concentration and the kinetic characteristics of AK, the activity of which increases proportionally to the supply of Ado. Ataullakhanov et al. [25], after stimulating erythrocytes in vitro to utilize ATP (through an increase in ATPdependent Na+, K+-ATP-ase activity), showed that exogenous Ado at the concentration of 0.4 - 0.8 mM also also enabled reinstatement of the adenine nucleotide pool. Reports by Kim [26] and Komarova et al. [24] suggest participation of Ado in the re-synthesis of the adenine nucleotide pool, especially at high Pi concentrations.
A significant increase in AMP, GMP and IMP concentrations in our study, together with a significant increase in Ado, Guo and Ino concentrations, suggests that accelerated mononucleotide re-synthesis is a primary cause for the erythrocyte mononucleotide pool increase in patients with type 1 and 2 diabetes.
It is possible that increased AMP and GMP in the erythrocytes of patients with type 1 and type 2 diabetes is a result of an increase in Ado and Guo. Correlation coefficients between AMP and Ado, and GMP and Guo show statistical variability, which confirms the hypothesis. It does not seem that the degree of good metabolic glycemic control in diabetes could have any influence on the analyzed parameters because no significant correlations were found between them and glucose and hemoglobin A1C concentrations.
An increase in the mononucleotide re-synthesis in the kinase pathways is indicated by decreased AEC and GEC in this study, as the energy charge of erythrocytes has been proven to decrease in the presence of Ado. Apparently, ATP consumption that is required for the adenine nucleotide synthesis from Ado significantly influences erythrocyte energy metabolism [25].
An increased level of Ado in the blood of patients with type 1 and type 2 diabetes may drive the metabolism of Ado towards deamination to Ino and Hyp. Therefore, in the degradation pathways, Ado is deaminated by ADA to give Ino.
Namiot et al. [27] observed increased ADA activity in the tissues of rats with STZ-induced diabetes. Rutkiewicz et al. [28] noticed a direct connection between insulinemia and ADA activity. Hoshino et al. [5] observed that ADA activity in serum is increased in diabetes. However, in their study, normalization of the blood glucose level was associated with a decrease in ADA2 activity. Moreover, ADA2 activity in poorly controlled type 2 diabetic patients directly correlated with the level of hemoglobin A1c. These findings indicate that under diabetic conditions an increase in ADA activity may lead to an increase in Ino, which was long considered to be an inactive metabolite of Ado. However, recently, Ino has been shown to be an immunomodulator and anti-inflammatory agent [29]. Therefore, we have drawn a conclusion that increased levels of Ado and ADA in the blood of patients with type 1 and type 2 diabetes drive the metabolism of Ado to the degradation pathway, resulting in Ino and Hyp.
6. CONCLUSIONS
This study showed that the level of erythrocyte IMP is increased in patients with diabetes. IMP metabolism involves IMP degradation (by 5’-NT) and the purine salvage pathway (by HGPRT). IMP degradation results in a decrease in the IMP levels. In contrast, the purine salvage pathway plays a role in the re-synthesis of IMP from Hyp. In theory, alteration in the level of erythrocyte IMP must involve a balance between the IMP removal pathways (degradation) and the IMP-producing pathway (purine salvage). In this study, the accumulation of Ado, Ino, and Hyp in whole blood and the increased IMP concentration in erythrocytes suggest that the activity of the purine salvage pathway is likely to be even higher than the IMP degradation pathway.
The data presented in this paper clearly indicate that erythrocytes obtained from the patients with type 1 and type 2 diabetes exhibit higher concentrations of AMP, IMP and GMP than those obtained from healthy subjects. The GMP concentration increase was accompanied by an increase in GDP, GTP and TGN.
Since AMP is a component of the adenylate pool, then under physiological conditions, even small variations in ATP concentration lead to changes in AMP concentrations. However, an increase in AMP concentration in our study did not lead to a decrease in ATP. Such changes could only be explained by disruption in the pathway of purine nucleotide resynthesis or degradation.
The increased dephosphorylation of adenine and guanine nucleotides, indicated by the increased concentration of Ado Ino, Guo and Hyp as the products of purine nucleotide degradation, suggests serious energy metabolism disruptions in diabetes. An increase in AMP and GTP, GMP, IMP concentrations, as well as a decrease in AEC and GEC values, points to significant alterations in the erythrocyte concentration of purine nucleotides in diabetes.
The results presented in this paper suggest that a primary cause for the adenine mononucleotide and guanylate nucleotide pool increase is accelerated nucleotide synthesis in diabetic erythrocytes. Nucleotide synthesis acceleration also seems to lead to the stimulation of nucleotide breakdown being visible due to the increased concentration of nucleotide degradation products.
The acceleration of the purine nucleotide pool turnover makes it possible to classify diabetic erythrocytes as hypermetabolic cells.
REFERENCES
- Dudzinska, W., Hlynczak, A.J., Skotnicka, E., et al. (2006) The purine metabolism of human erythrocytes. Biochemistry (Moscow), 71, 467-475. http://dx.doi.org/10.1134/S0006297906050014
- Baldini, P., Incerpi, S., Pascale, E., et al. (1986) Insulin effects on human red blood cells. Molecular and Cellular Endocrinology, 46, 93-102. http://dx.doi.org/10.1016/0303-7207(86)90087-0
- Jamal, Z. and Saggerson, E.D. (1987) Enzymes involved in Ado metabolism in rat white and brown adipocytes. Effects of streptozotocin-diabetes, hypothyroidism, age and sex differences. Biochemical Journal, 245, 881-886.
- Jenkins, R.L., Daniel, M.C., Digernes, S., et al. (1988) Adenine nucleotide metabolism in hearts of diabetic rats. Comparision to diaphragm, liver and kidney. Diabetes, 37, 629-636. http://dx.doi.org/10.2337/diab.37.5.629
- Hoshino, T., Yamada, K. and Masuoka, K. (1994) Elevated adenosine deaminase activity in the serum of patients with diabetes mellitus. Diabetes Research and Clinical Practice, 25, 97-102. http://dx.doi.org/10.1016/0168-8227(94)90034-5
- Sakowicz, M. and Pawelczyk, T. (2002) Insulin restores expression of adenosine kinase in streptozotocin-induced diabetes mellitus rats. Molecular and Cellular Biochemistry, 236, 163-171. http://dx.doi.org/10.1023/A:1016163517896
- Donatelli, M., Russo, V. and Bucalo, M.L. (1990) Increase in red cell lactate concentration and its reduction by isologus plasma in NIDDM subjects. Diabetes Research, 15, 33-35.
- Donatelli, M., Russo, V., Bucalo, M.L., et al. (1989) Erythrocyte glucose, ATP, lactate concentration and their modifications induced by isologus plasma in non-insulindependent diabetes mellitus. Diabetes Research, 16, 121- 125.
- Suhail, M. and Rizvi, S. (1989) Effectt of type I diabetes mellitus on key glicolytic enzymes of red blood cells. Acta Diabetologica Latina, 26, 315-320. http://dx.doi.org/10.1007/BF02624643
- Bettini, D., Kloting, I. and Kohner, K.D. (1996) Alterations in erythrocyte plasma membrane ATPase activity and adenine nucleotide content in spontaneously diabetic subline of the Chinese hamster. Hormone and Metabolic Research, 28, 1-6. http://dx.doi.org/10.1055/s-2007-979119
- Rabini, R.A., Fumelli, P. and Staffolani, R. (1996) Effects of diabetes mellitus on structural and functional properties of erythocyte membranes. Molecular Membrane Biology, 10, 71-79. http://dx.doi.org/10.3109/09687689309150254
- Rabini, R.A., Petruzzi, E., Staffolani, R., et al. (1997) Diabetes mellitus and subjects’ ageing: A study on the ATP content and ATP-related enzyme activites in human erythrocytes. European Journal Clinical Investigation, 27, 327-332. http://dx.doi.org/10.1046/j.1365-2362.1997.1130652.x
- Garner, M.H. (1996) Changes in Na, K-ATPase concentration and Na, K-ATPase—Dependent adenosine triphosphate turnover in human erythrocytes in diabetes. Metabolism, 45, 927-934. http://dx.doi.org/10.1016/S0026-0495(96)90257-7
- Smolenski, R.T., Lachno, D.R., Ledingham, S.J.M., et al. (1990) Determination of sixteen nucleotides, nucleosides and bases using high-performance liquid chromatography and its application to the study of purine metabolism in heart for transplantation. Journal of Chromatography, 527, 414-420.
- Dudzinska, W. and Hlynczak, A.J. (2004) Purine nucleotides and their metabolites in erythrocytes of streptozotocin diabetic rats. Diabetes Metabolism, 30, 557-567. http://dx.doi.org/10.1016/S1262-3636(07)70155-6
- Olah, M.E. and Stiles, G.L. (2000) The role of receptor structure in determining adenosine receptor activity. Pharmacology & Therapeu, 85, 55-75. http://dx.doi.org/10.1016/S0163-7258(99)00051-0
- Stiles, G.L. (1992) Adenosine receptors. Journal of Biological Chemistry, 267, 6451-6454.
- Cassar, M., Jones, M.G. and Szatkowski, M. (1998) Reduced adenosine uptake accelerates ischaemic block of population spicas in hippocampal slices from streptozotocin-treated diabetic rats. European Journal of Neuroscience, 10, 239-245. http://dx.doi.org/10.1046/j.1460-9568.1998.00035.x
- Pawelczyk, T., Sakowicz, M., Szczepanska-Konkel, M., et al. (2000) Decreased expression of adenosine kinase in streptozotocin-induced diabetes mellitus rats. Archives of Biochemistry and Biophysics, 375, 1-6. http://dx.doi.org/10.1006/abbi.1999.1548
- Pawelczyk, T., Podgorska, M. and Sakowicz, M. (2003) The effect of insulin on expression level of nucleoside transporters in diabetic rats. Molecular Pharmacology, 63, 81-88. http://dx.doi.org/10.1124/mol.63.1.81
- Sobrevia, L., Jarris, S.M. and Yudibevich, D.L. (1994) Adenosine transport in culture human umbilical vein endothelial cells is reduced in diabetes. Cell Physiology, 36, 39-47.
- Klabunde, R.E. (1983) Effects of dipyridamole on postischemic vasodilation and extracellular adenosine. American Journal of Physiology, 244, 273-278.
- Bontemps, F., Van den Berghe, G. and Hers, G. (1986) Pathways of adenine nucleotide catabolism in erythrocytes. The Journal of Clincal Investigation, 77, 824- 830. http://dx.doi.org/10.1172/JCI112379
- Komarova, S., Mosharov, E.V., Vitvitskii, V., et al. (1999) Adenine nucleotide synthesis in human erythrocytes depends on the mode of supplementation of cell suspension with adenosine. Blood Cells, Molecules & Diseases, 25, 170-179. http://dx.doi.org/10.1006/bcmd.1999.0243
- Ataullakhanov, F.I., Vitvitskii, V.M. and Komarova, S.V. (1996) Energy dependent processes and adenylate metabolism in human erythrocytes. Biochemistry (Moscow), 61, 197-203.
- Kim, H.D. (1990) Is adenosine a second metabolic substrate for human red blood cells. Biochimica et Biophysica Acta, 1036, 113-120. http://dx.doi.org/10.1016/0304-4165(90)90022-O
- Namiot, Z., Baranczuk, E. and Wojcik, B. (1993) Adenosine deaminase activity in various parts of the gastrointestinal tract of streptozotocin treated rats. Pharmazie, 48, 950-954.
- Rutkiewicz, J. and Górski, J. (1990) On the role of insulin in regulation of adenosine deaminase activity in rat tissue. FEBS Letter, 271, 79-80. http://dx.doi.org/10.1016/0014-5793(90)80376-T
- Mabley, J.G., Rabinovitch, A., Suarez-Pinzon, W., et al. (2003) Inosine protects against the development of diabetes in multiple-low-dose streptozotocin and nonobese diabetic mouse models of type 1 diabetes. Molecular Medicine, 9, 96-104. http://dx.doi.org/10.2119/2003-00016.Mabley