Journal of Biomedical Science and Engineering
Vol.6 No.4(2013), Article ID:30509,5 pages DOI:10.4236/jbise.2013.64059
Evaluation of RNA-Seq software in gene expression quantification
![]()
1R & D Information, AstraZeneca, Shanghai, China
2Innovation Center China, AstraZeneca, Shanghai, China
Email: jenny.wei@astrazeneca.com
Copyright © 2013 Yan Ji et al. This is an open access article distributed under the Creative Commons Attribution License, which permits unrestricted use, distribution, and reproduction in any medium, provided the original work is properly cited.
Received 22 February 2013; revised 27 March 2013; accepted 6 April 2013
Keywords: RNA-Seq; Next Generation Sequencing
ABSTRACT
High-throughput RNA sequencing (RNA-Seq) promises a complete annotation and quantification of all genes and their isoforms across samples. Because sequencing reads from this new technology are shorter than transcripts from which they are derived, expression estimation with RNA-Seq requires increasingly complex computational methods. In recent years, a number of expression quantification methods have been published from both public and commercial sources. Here we presented an overview of these attempts on quantifying gene expression. We then defined a set of criteria and compared the performance of several programs based on these criteria, and we further provided advices on selecting suitable tools for different biological applications.
1. INTRODUCTION
Next-generation sequencing (NGS) platforms have been widely available recently [1]. A massively parallel sequencing technology termed RNA-Seq has made it possible to sequence cDNA derived from cellular RNA [2]. Compared to previous technologies for gene mapping with their alternative isoforms and expression detection across diverse cell types, RNA-Seq is more promising in building a complete transcriptome across cell types and states.
Recently, many studies have applied RNA-Seq to various biological and medical research. Quantification of alternative splicing in tissues [3], discovery of new fusion genes in cancer [4], and new transcript identification [5] have all benefited from this new technology. To fully enable RNA-Seq technology to solve biological problems, powerful computational tools are required. In the past two years, software applications for RNA-Seq analysis have been flooding the market from public domains as well as commercial organizations. How to identify and use the suitable tools for RNA-Seq analysis becomes critical.
Here we focus on the computational methods for gene expression quantification by RNA-Seq. Using Google Scholar citation, as shown in Table 1, we selected two popular analysis pipelines from public domains and two workflows from commercial products. We applied them to a human gastric cancer RNA-Seq dataset consisting of 40 million paired-end 100-base reads from Illumina Hiseq 2000 platform. We also compared RNA-Seq quantification with Affy quantification using Affymetrix human genome U133A2.0 array on the same human gastric cancer sample.
2. RESULTS
2.1. Descriptions of Chosen RNA-Seq Quantification Tools
In general, current transcriptome assembly tools belong to either a reference-based strategy or de novo strategy or both [6]. When a reference genome is available, RNASeq reads are firstly mapped by a splice-aware aligner and an output alignment file is used as the input file of a transcriptome assembly tool. Two reference-based transcriptome assembly tools, Cufflinks [7] and Scripture [5], are selected according to their average citation numbers per month (CPM) calculated by the total number of citations retrieved from Google Scholar divided by the number of months since their publication date. Another tool Alexa-seq [8] is not chosen because of both the small CPM 1.6 and difficulties to install it on a Linux server.
Cufflinks can be launched in two modes using options -G/--GTF and -g/--GTF-guide. Both modes need a reference GFF annotation file from mainly three data sources Ensembl (www.ensembl.org), NCBI (www.ncbi.nlm.nih.gov) and UCSC (http://genome.ucsc.edu/). The first option -G/--GTF tells Cufflinks to use the supplied reference annotation to estimate isoform expression. The latter option -g/--GTFguide tells Cufflinks to use the supplied reference annotation to guide RABT assembly [9]. However, Scripture is a method for transcriptome reconstruction that relies solely on RNA-Seq reads and an assembled genome to build a transcriptome ab initio.
Array Studio is a suite of tools developed by OmicSoft (www.omicsoft.com) in which an RNA-Seq analysis workflow is provided. Expression quantification analysis of RNA-Seq can be performed in two ways by mapping to either genome or transcriptome.
CLC Genomics Workbench is a Desktop application for NGS analysis developed by CLCbio (www.clcbio.com).
2.2. Summaries of Results of RNA-Seq Analysis
An in-house RNA-Seq dataset was used and six types of results were generated. For Cufflinks, two results from both -G/--GTF and -g/--GTF-guide modes which are denoted by Cuff.(-G) and Cuff.(-g). For Array Studio, by against both genome and transcriptome, two results were shown and denoted by OMIC(G) and OMIC(T). The result of CLC Genomics Workbench was CLC GW, and the last result is from Scripture. Summaries about the six results can be found in Tables 2 and 3. Note that CLC Genomics Workbench only gives gene information, so genes with only one transcript were counted.
There are some differences between Tables 2 and 3. In
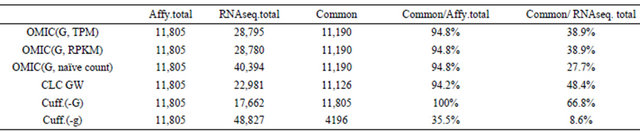
Table 2, numbers of total features found by tools are directly counted from their output files without any preprocessing. Transcripts are features with at least two exons. Most of results of OMIC(G) are transcripts. Results of OMIC(T), Cuff.(-G), Cuff.(-g) and Scripture are transcripts and exons. Results of CLC GW are genes, and only genes with only one transcript were counted. In Table 3, genes of non-zero expression values are counted. The cell values of OMIC(G) and “RNAseq.total” are numbers of features which can be annotated with known gene names by ArrayStudio. Cufflinks can output a file recording both gene names and their FPKM values.
In Table 3, Affy data were processed using Affymetrix Expression Console. Most of genes in Affy are included by RNA-Seq results. Cufflinks adopts a naming mechanism when -g/--GTF-guide option is turned on, so the number of common genes is very small when merging two datasets according gene names. Actually, we showed that 77% of results of Cuff(-g) can reflect (i.e., match or include) 100% of that of Cuff(-G).
2.3. Comparisons between RNA-Seq and Affy in Terms of Expression Values
There are always three types of expression values used in the RNA-Seq analysis, RPKM/TPKM, TPM and naïve counts. Because Affy presents expression values on the gene level, only expression values of RNA-Seq on the gene level were shown in Table 3.
In Figure 1, six correlation scatter plots and their Pearson values were shown. The y-axis values of Figures 1(a) and (b) are calculated by Cufflinks with dif-
Table 1. Open source tools selection criteria.
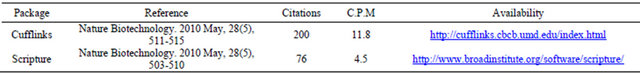
Table 2. Numbers of total features and transcripts given by tools.
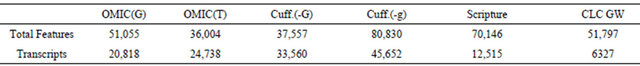
Table 3. Comparisons of numbers of genes of Affy and numbers of genes found by tools.
ferent parameters. The y-axis value of figure C is calculated by CLC Genomic workbench. The y-axis values of Figures 1(d)-(f) are calculated by OmicSoft software with different calculation methods for gene expression values based on RNA-Seq reads. Because the biggest two correlation values with Affy are Cuff.(-g) and Cuff. (-G), Cufflinks has the best performance for the calculations of expression values from RNA-Seq reads. Except OMIC(G, naïve count) with Pearson value 0.68, Array studio (OMIC(G, TPM), OMIC(G, RPKM)) has a better performance than CLC Genomics Workbench (CLC GW).
2.4. Comparisons between RNA-Seq and Public Annotations for Gene Structures
In this section, results of RNAseq analysis were assessed from the perspective of the linear structure of genomic
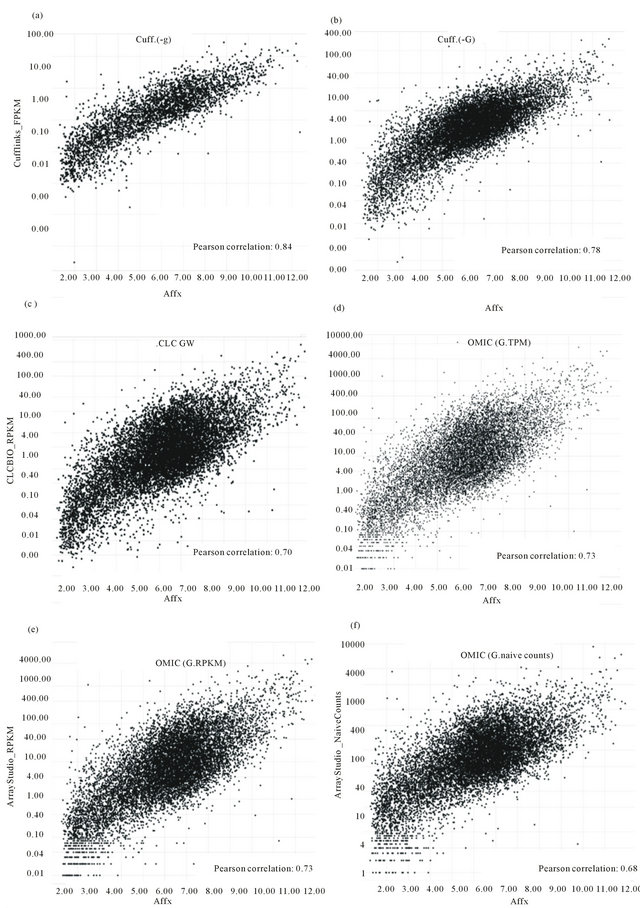
Figure 1. Correlation scatter plots between Affy and six sets of expression values of RNA-Seq.
features on the level of transcripts. In this paper, USSC hg19 annotation file was used (ftp://igenome:G3nom3s4u@ftp.illumina.com/Homo_sapiens/UCSC/hg19/Homo_sapiens_UCSC_hg19.tar.gz).
In order to explore differences among results of chosen RNA-Seq analysis, four aspects were illustrated by following terms. First, “Match” means transcripts of both the result and public annotations are the same if all their exons are matched according to chromosome coordinates. Second, “Including” means exons of a transcript in the public annotations contains exons of a transcript in the results of RNA-Seq analysis. Third, “Included” means exons of a transcript in the public annotations are a subset of exons of a transcript in the result of RNA-Seq analysis. Fourth, “Overlap” means they share common exons.
As shown in Figure 2, the x-axis values of Figure 2(a)
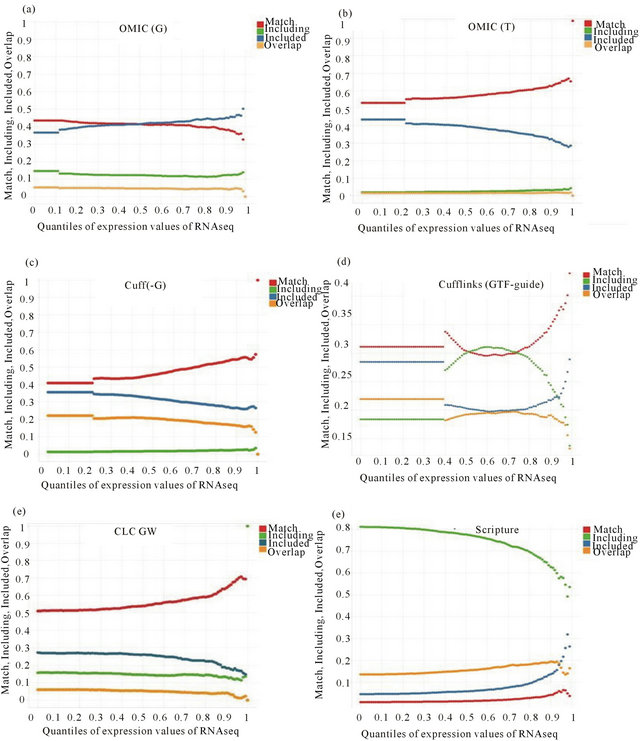
Figure 2. Comparisons between RNA-Seq and public annotations for gene structures on the level of transcript. See Section D in RESULTS for the definition of “Match”, “Including”, “Included”, “Overlap”.
and (b) are calculated by Omicsoft software with different parameters. The x-axis values of Figures 2(c) and (d) are calculated by cufflinks with different parameters. The x-axis values of Figures 2(e) and (f) are respectively calculated by CLC Genomic workbench and Scripture. From comparisons between Cuff.(-G) and OMIC(G) on the “Match” aspect, the bigger values of Cuff.(-G) may explain its higher correlation scores with expression values of Affy than OMIC(G). On the “Including” aspect, both Cuff(-G) and OMIC(T) have very small values; Scripture has the biggest values. This can be explained by Scripture using only RNA-Seq data without public annotations as reference. Both Cuff(-G) and OMIC(T) fully utilize reference annotations for transcriptome assembly.
3. CONCLUSION
In this article, we have shown the evaluation results of a set of public and commercial tools for gene expression quantification by RNA-Seq. Because of rapid improvements in RNA-Seq data generation, more efforts need to be done in the areas of transcriptome analysis, mutation detection, and fusion identification. New questions will continue to emerge and novel programs will evolve. The tool evaluation needs to keep up with the pace of these changes in order to apply RNA-Seq technologies to drug discovery and development.
4. ACKNOWLEDGEMENTS
This work was supported in part by a project from AstraZeneca.
REFERENCES
- Metzker, M.L. (2010) Sequencing technologies—The next generation. Nature Reviews Genetics, 11, 31-46. doi:10.1038/nrg2626
- Mortazavi, A., Williams, B.A., McCue, K., Schaeffer, L. and Wold, B. (2008) Mapping and quantifying mammalian transcriptomes by RNA-Seq. Nature Methods, 5, 621- 628. doi:10.1038/nmeth.1226
- Wang, E.T., Sandberg, R., Luo, S., Khrebtukova, I., Zhang, L., Mayr, C., et al. (2008) Alternative isoform regulation in human tissue transcriptomes. Nature, 456, 470-476. doi:10.1038/nature07509
- Maher, C.A., Kumar-Sinha, C., Cao, X., Kalyana-Sundaram, S., Han, B., Jing, X., et al. (2009) Transcriptome sequencing to detect gene fusions in cancer. Nature, 458, 97-101. doi:10.1038/nature07638
- Guttman, M., Garber, M., Levin, J.Z., Donaghey, J., Robinson, J. and Adiconis, X. (2010) Ab initio reconstruction of cell type-specific transcriptomes in mouse reveals the conserved multi-exonic structure of lincRNAs. Nature Biotechnology, 28, 503-510. doi:10.1038/nbt.1633
- Martin, J.A. and Wang, Z. (2011) Next-generation transcriptome assembly. Nature Reviews Genetics, 12, 671- 682. doi:10.1038/nrg3068
- Trapnell, C., Williams, B.A., Pertea, G., Mortazavi, A., Kwan, G., van Baren, M.J., et al. (2010) Transcript assembly and quantification by RNA-Seq reveals unannotated transcripts and isoform switching during cell differentiation. Nature Biotechnology, 28, 511-515. doi:10.1038/nbt.1621
- Griffith, M., Griffith, O.L., Mwenifumbo, J., Goya, R., Morrissy, A.S., Morin, R.D., et al. (2010) Alternative expression analysis by RNA sequencing. Nature Methods, 7, 843-847. doi:10.1038/nmeth.1503
- Roberts, A., Pimentel, H., Trapnell, C. and Pachter, L. (2011) Identification of novel transcripts in annotated genomes using RNA-Seq. Bioinformatics, 27, 2325-2329. doi:10.1093/bioinformatics/btr355