Journal of Biomedical Science and Engineering
Vol. 5 No. 12A (2012) , Article ID: 26206 , 14 pages DOI:10.4236/jbise.2012.512A100
Phantom study of the impact of adaptive statistical iterative reconstruction (ASiR™) on image quality for paediatric computed tomography
![]()
1Department of Physics, Ryerson University, Toronto, Canada
2Department of Medical Imaging, University of Toronto, Toronto, Canada
3Department of Medical Imaging, University of Saskatchewan, Saskatoon, Canada
4Department of Oral Biological and Medical Sciences, University of British Columbia, Vancouver, Canada
Email: nlford@dentistry.ubc.ca
Received 6 October 2012; revised 13 November 2012; accepted 28 November 2012
Keywords: Image Analysis; CT; Optimization; ASiR™; Paediatric Imaging
ABSTRACT
Quantitative analysis of image quality will be helpful for designing ASiR™-enhanced paediatric CT protocols, balancing image quality and radiation dose. Catphan®600 phantom studies were performed on a GE Discovery HD750 64-slice CT scanner. Images were reconstructed with 0% - 100% ASiR™ (tube current 150 mA, variable kVp 80 - 140) in order to determine the optimal ASiR™-Filtered Back Projection (FBP) blend. Images reconstructed with a 50% ASiR™-50% FBP blend were compared to FBP images (0% ASiR™) over a wide range of kVp (80 - 140) and mA (10 - 400) values. Measurements of image noise, CT number accuracy and uniformity, spatial and contrast resolution, and low contrast detectability were performed on axial and reformatted coronal images. Improvements in CNR, low contrast detectability and radial uniformity were observed in ASiR™ images compared to FBP images. 50% ASiR™ was associated with a 26% - 30% reduction in image noise. Changes in noise texture were observed at higher % ASiR™ blends with impact on visualisation of low and high contrast objects. A small decrease in limiting spatial resolution was detected with addition of ASiR™, more appreciable at very low tube currents. The preferred blend for paediatric body protocols in our study, as determined by the image quality parameters investigated, was 50% ASiR™ when used with tube currents greater than 50 mA.
1. INTRODUCTION
The proliferation of paediatric CT scanning, now numbering more than 7 million exams annually in the United States [1], combined with a heightened awareness of the potential of increased malignancy risk from radiation exposure [2] has led to demands for new strategies to reduce CT dose in children. Obtaining the desired diagnostic image quality at the lowest possible radiation dose is essential. A variety of dose reduction techniques including sizeor weight-based technique charts, limiting scan coverage, and avoiding multiphase scanning where possible can help minimize unnecessary radiation exposure to children undergoing CT examinations.
A recent development is the implementation of alternate CT reconstruction algorithms. Conventional filtered back projection (FBP) algorithms are unable to consistently generate diagnostic quality images if tube current (mA) is significantly decreased from conventional levels due to increased image noise [3]. Several CT vendors have recently developed sophisticated noise reduction algorithms based on the principles of iterative reconstruction and the statistical behaviour of the measurements. General Electric (GE) Healthcare product Adaptive Statistical Iterative Reconstruction (ASiR™) is available for CT750HD and Light Speed VCT scanner models and was the subject for this study.
The principal advantage of statistical modeling in ASiR™ images is a reduction in noise compared to FBP images [4-8]. The ASiR™ technique uses the FBP image as an initial estimate of the reconstruction and subsequently models the photon statistics at each projection with repeated iterations, comparing the synthesized projection with the actual (raw) projection. In the reconstruction process image pixels are measured, compared, and adjusted producing an accurate representation of the object being imaged. Using this iterative mathematical modeling, ASiR™ is able to reduce the noise in the reconstructed image. The images are reconstructed with lower image noise but also a visual texture that differs from conventional FBP. To restore the more classical appearance of CT image noise, a linear blend of ASiR™ with FBP is employed. The reconstructed image can be obtained with a user defined blend in 10% increments between 0 and 100% ASiR™ where 0% corresponds to a conventional FBP image and 100% represents a pure ASiR™ image.
Several studies have been published relating to ASiR™ [4-8] and have reported potential for image quality improvements while reducing radiation dose, although also noting some image over-smoothing and blotchy pixelation with 100% ASiR™. With respect to specific application in paediatrics, a study of cardiac CT performed at 80 kVp in 2 - 3 years old children, demonstrated a dose reduction of 36% using 40% ASiR™ [9], and suggested that optimal image quality for clinical images was associated with 20% or 40% ASiR™. However, to the best of our knowledge, there is little quantitative image quality data examining the impact of ASiR™ over a range of kVp and tube current settings. This data is of particular relevance to current clinical paediatric CT practice as there is an ongoing drive to use lower kVp when scanning smaller children or performing specialised protocols such as CT Angiography, in addition to a continual effort to reduce tube current in all pediatric scans. Scanning protocols are now entering clinical pediatric practice using significantly lower kVp and tube current than were utilised a decade ago, and with hope that the addition of iterative reconstruction techniques may allow further dose reduction. Such approaches to minimise radiation exposure from CT examinations should reduce the potential risk to children from ionising radiation [10], but it is also important that diagnostic image quality is maintained. The authors are not aware of image quality assessments of the ASiR™ algorithm using phantom images that have been performed based on paediatric scanning protocols.
To investigate the image quality using ASiR™ for paediatric patients, a wide range of technique factors (kVp and mA) were studied, consistent with the range of values used in current paediatric CT protocols and including lower mA values to assess the potential for dosesavings with reduced current. In this study, we measured image quality parameters describing noise, uniformity, contrast and spatial resolution from phantom images acquired with paediatric imaging protocols and varying application of ASiR™. We identified the optimal blend of ASiR™ and investigated image quality over a wide range of kVp and mA settings using this blend. Image series were selected to allow analysis of raw data, acquired by scanning the phantom at 0.625 mm slice thickness, and of reconstructed multi-planar reformats (MPR) with 0.625 mm axial, 5 mm axial MPR and 2 mm coronal MPR slices.
2. MATERIALS AND METHODS
2.1. Scanner Description
Two experiments were performed on a Discovery™ CT- 750HD (GE Healthcare, Milwaukee) 64 multislice CT scanner (MSCT) with varying kVp, mA and % ASiR™ as described under Experimental Design (below). The remaining scanning parameters were maintained for all scans in order to standardize acquisitions. Parameters were chosen to reproduce those currently utilised for routine abdominal scanning in children at the study institution (Hospital for Sick Children, Toronto, ON), a large paediatric teaching hospital.
• Pitch of 1.375;
• Rotation time of 0.5 s;
• Acquisition field of view (FOV) SFOV, adjusted for small body;
• Detector width 40 mm ;
• Display FOV (DFOV) 250 mm;
• Standard Reconstruction Algorithm.
2.2. Experimental Design
2.2.1. Incorporation of Varying % ASiR™ on Image Quality
To assess the impact of varying % ASiR™ on image quality in paediatric CT, we examined a variety of FBPASiR™ blends. Our aim was to establish the preferred FBP-ASiR™ blend for a range of clinically relevant kVp settings. Images were acquired as 0.625 mm axial slices that were subsequently reformatted into 5 mm axial multiplanar reformats (MPR) and 2 mm coronal MPR series, reproducing the standard choice of display MPR parameters at the study institution. Phantom images were acquired using 150 mA at three kVp settings (80, 100 and 120 kVp). For each kVp setting, images were reconstructed 5 times with ASiR™ blends of 0%, 30%, 50%, 70% and 100%. For each reconstruction three image datasets (0.625 mm axial, 5 mm axial MPR and 2 mm coronal MPR) were obtained and stored for analysis. CT number accuracy, uniformity, noise, contrast and spatial resolution were analysed.
2.2.2. Image Quality Measurements for a Range of kVp/mA Settings in Images with 50% ASiR™
To further investigate the effects of the preferred blend of ASiR™ on image quality, additional phantom scans were performed at each combination of kVp (80, 100, 120, 140) and mA (10, 50, 100, 200, 300, 400) with the preferred blend (50% ASiR™) and without ASiR™ (FBP). For each scan, three image series were again acquired
(0.625 mm axial, 5 mm axial MPR and 2 mm coronal MPR), and analysis of CT number accuracy, uniformity, noise, contrast and spatial resolution performed.
2.3. Phantom Description
The Catphan®600 phantom has multiple test modules for assessing various image quality parameters. Detailed description of the modules used for measuring CT number accuracy, image noise and uniformity, Noise Power Spectrum (NPS), Modulation Transfer Function (MTF), low and high contrast resolution are provided in the Catphan manual [11].
2.4. Image Quality Measurements
The ImageJ (version 1.43u; National Institutes of Health, Bethesda, MD, USA) software was used for viewing and analysis of the images for the following tests: CT number accuracy, Image noise and uniformity, Low Contrast Detectability, Contrast to Noise Ratio and limiting spatial resolution. Matlab®7.7 (The MathWorks, Inc., Natick, MA) was used to perform the spectral analysis measurement of high contrast spatial resolution in terms of Modulation Transfer Function (MTF) and Noise Power Spectra (NPS).
CT number accuracy was characterized by the mean voxel value (CT#) in the ROI of each of the 7 material inserts in the CTP404 module. The materials include Teflon, polystyrene, acrylic, air, delrin, polymethylpentene (PMP) and low density polyethylene (LDPE), which mimic a range of biological tissues ranging from fat and soft tissue to bone. The area of each ROI was 20 × 20 pixels placed inside each material. Measurements were made for each kVp/mA settings. Mean CT# in HU for each of 80, 100, 120 and 140 kVp settings were reported.
Image Noise and Uniformity were evaluated using the CTP486 uniformity module. The image noise was reported as the mean calculated from five standard deviation measurements on pixels located in a circular ROI. The four peripheral ROIs were approximately 90 mm2 and were located near the edges of the phantom in ±x and ±y directions and the fifth ROI was placed in the centre. ROI measurements were averaged from three separate slices in the uniformity module. The area and locations of the circular ROI were consistent for each slice. In all five ROIs, the mean CT number values were also measured for uniformity evaluation. Uniformity measurements were expressed as the largest signal difference (in HU) between the maximum and minimum CT number values measured in the five ROIs. To illustrate the signal variation across the Field of View (FOV) a signal profile was taken across the center of the phantom. The CT numbers along the diameter of the phantom were plotted versus position to show the radial signal uniformity.
Noise Power Spectrum (NPS) analysis was performed with our own MATLAB®7.7 code developed following the methods described by Boedeker et al. [12] The noise image data was acquired from the uniformity module CTP486 in Catphan®600 phantom for each kVp/mA setting, with 0.625 mm collimation, with and without ASiR™. From each slice in the uniformity module a centered 128 × 128 square matrix ROI was isolated. The Direct Current (DC) component was removed by subtracting the mean pixel value of the ROI from each pixel in the ROI. The NPS was normalized in order to determine the effect of reconstruction algorithm on the noise texture independent of the noise magnitude. To improve the accuracy and account for statistical uncertainties, the 2D NPS was calculated and averaged over all 60 slices from the uniform module CTP486 and the 2D NPS was radially averaged to produce a1D NPS.
Low Contrast Detectability (LCD) was measured using the CTP515 low contrast module. The ability to distinguish between the object and the background is limited by object size and image noise. LCD measurements were reported as the diameter of the smallest target object that could be observed at each contrast level.
Limiting Spatial Resolution. Subjective assessment of the limiting resolution was made with bar-pattern method in ImageJ (version 1.43u; National Institutes of Health, Bethesda, MD, USA) software by finding the smallest visible repeating pattern on the high resolution module CTP528. The line was drawn on the smallest resolvable pattern, its length in cm was recorded and the number of line pairs was counted. The results were reported in lp/cm.
Modulation Transfer Function (MTF) provides frequency domain analysis of the image resolution. MTF was calculated using a 0.28 mm diameter tungsten carbide bead cast in the CTP528 module. The raw data image matrix (512 × 512) was loaded in Matlab and the slice containing the bead was selected. On the slice a square ROI (128 × 128) was drawn around the bead. This created a 2D array of CT values from the impulse source, the bead in our case, which corresponds to the Point Spread Function (PSF). The Line Spread Function (LSF) was derived from the PSF profile (as suggested in the Catphan® manual) by summing the CT numbers in each column of the 2D PSF array. The MTF was calculated as absolute value from a FFT of the LSF and normalized to 1 at zero spatial frequency. The results were reported as 10% and 5% signal modulation for each scanning protocol.
Contrast to Noise Ratio (CNR) was measured on the CTP515 low contrast module. The ROI was placed on the largest low contrast object and the mean CT number recorded. A ROI of the same size was selected from the background and the mean CT number and standard deviation recorded.
3. RESULTS
3.1. Results from Incorporation of Varying % ASiR™ on Image Quality
CT numbers were not affected by the incorporation of ASiR™ in image reconstruction. An increase in % ASiR™ does not modify the mean CT number (HU values) measured in the 7 test materials compared to the standard reconstruction methods (FBP).
A stepwise reduction in noise (Figure 1) and an improvement in contrast to noise ratio (Figure 2) were observed with increasing percentage ASiR™ compared to baseline FBP images. Measurements were averaged over three slices from the corresponding modules and compared to baseline FBP images. The use of 30% ASiR™ resulted in a 20%, 18% and 16% noise reduction in 0.625 mm axial, 2 mm coronal MPR and 5 mm axial MPR images respectively. When 100% ASiR™ was introduced the noise reduction increased to 57%, 53% and 51% respectively. Noise reduction between datasets acquired with varying kVp settings (80, 100, 120), percentage noise reduction did not vary substantially, as given in Table 1.
Uniformity improved with smaller statistical fluctuations in mean CT number as % ASiR™ increased (Figure 3). For example, on images acquired at 80 kVp - 150 mA with 0% ASiR™, CT numbers obtained from the line profile across the phantom demonstrated fluctuations of 290HU with attenuation values differing by 29%. With 30%, 50%, 70% and 100% ASiR™, fluctuations were reduced to 180HU, 145HU, 128HU and 115HU respectively.
Noise Power Spectrum analysis for 0.625 mm axial images obtained at 80 kVp/150 mA and reconstructed with varying percentage of ASiR™ is presented in Figure 4. Shape analysis demonstrates a peak shift towards the lower frequencies and diminishing magnitude or variance with increase in the percentage of ASiR™. Similar shift and diminishing noise magnitude was demonstrated for axial and coronal MPRs, and for images obtained at 100 and 120 kVp.
For low contrast detectability (LCD) analysis, the smallest observable diameter was recorded for each contrast level on images acquired at 80 kVp/150 mA, 100 kVp/150 mA and 120 kVp/150 mA settings for each % ASiR™. LCD is affected by noise and object size, thus it was increasingly difficult to identify the smallest low contrast target objects in noisy images. Figure 5 illustrates the results for the image set with the lowest noise; the 120 kVp/150 mA setting. As expected from its noise reduction capability, comparison between any image including ASiR™ (30% - 100%) and the corresponding FBP (0% ASiR™) image demonstrated improved LCD in ASiR™ images. However, LCD did not uniformly

Figure 1. Stepwise noise reduction in images reconstructed with varying % ASiR™.
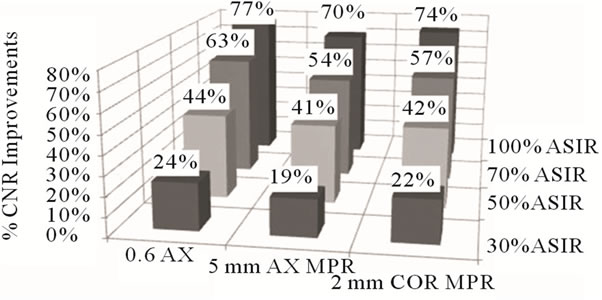
Figure 2. Percentage CNR improvement observed with incremental increase in % ASiR™ relative to FBP images.
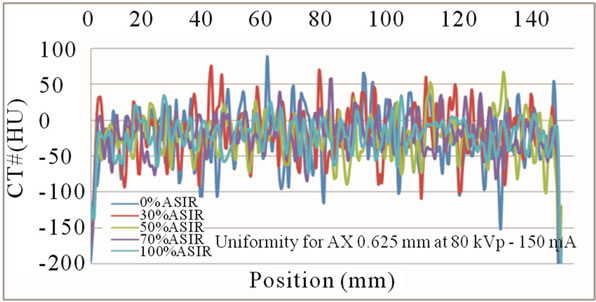
Figure 3. Mean CT number fluctuations for images generated at 80kVp-150mA, reconstructed with 0%, 30%, 50%, 70% and 100% ASiR™. Note that images with increased ASiR™ demonstrate smaller variance in mean pixel values.
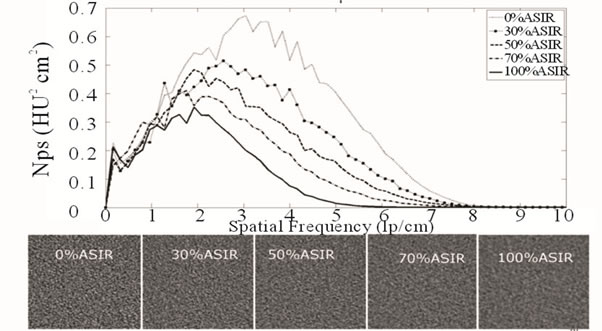
Figure 4. NPS for 0.625 mm axial images acquired at 80 kVp/150 mA with varying % ASiR™. Note the shift in the peak of the noise magnitude, which coincides with the change in noise texture as % ASiR™ increases from 0% - 100%.

Figure 5. Low Contrast Detectability (LCD) results for (a) 0.625 mm axial slice; (b) 5 mm axial MPR slice and (c) 2 mm coronal MPR slice at 120 kVp/150 mA with varying % ASiR™; (a) 0.625 mm AX LCD 120 kVp - 150 mA; (b) 5 mm AXMPR LCD 120 kVp - 150 mA; (c) 2 mm CORMPR LCD 120kVp - 150 mA.

Table 1. Noise reduction for images acquired with increasing % ASiR™ for three kVp settings expressed relative to FBP images (0% ASiR™).
increase with increase in the % ASiR™. Comparison of images reconstructed with varying % ASiR™ showed some instances of loss of visualisation of very low contrast target objects, particularly when images were reconstructed with greater than 50% ASiR™. This was observed on both axial 0.625 mm and MPR series. In Figure 5, the lowest line on each graph represents the best LCD. For example, for 0.625 mm axial slices and 70% ASiR™, the minimum diameter detectable object was as follows; 4 mm at a contrast level of 1%, 6 mm at a contrast level of 0.5% and 9 mm at a contrast level of 0.3%. On the same slice width, using 50% ASiR™, the minimum detectable diameter was 5 mm, 7 mm and 8 mm for contrast levels 1%, 0.5% and 0.3%. At higher percentages of used ASiR™ some small targets were not visualised. For example, on the images with 70% ASiR™ the 8 mm object was not visible at 0.3% contrast level but it was detectable on the images with 50% ASiR. The 8 mm object at 0.3% contrast level, 6 mm object at 0.5% and 4 mm object at 1% contrast level were visible on the images with 70% ASiR™ but 6 mm object at 0.5% and 4 mm object at 1% contrast level could not be visualised on the images with 100% ASiR™. For 5 mm axial MPRs the 8 mm object at 0.3% contrast level was not visualised in images with 50% ASiR™. This issue was again even more pronounced with 70% and 100% ASiR™ in 5 mm axial MPR and 2 mm coronal MPR images.
Limiting spatial resolution was assessed objectively by MTF and more subjectively by visual analysis of the bar pattern. Both demonstrated a small but consistent stepwise loss of resolution with increase in % ASiR™. Figure 6 illustrates the bar pattern method results. The percentage of limiting resolution loss (up to 5%) with increasing % ASiR™ compared to baseline FBP image is given in Table 2 for both methods. The averaged MTF10% values in ASiR™ images are slightly less or comparable to the resolution in FBP images. On 0.625 mm axial images with increasing % ASiR™ (30%, 50%, 70% and 100%), very small (0.3%, 2.1%, 2.5% and 3.9%) stepwise reductions in MTF10% values were observed compared to FBP baseline. For 5 mm axial MPR the reductions in MTF10% were 0.7%, 4.3%, 6.9% and 9.4% accordingly. For 2 mm coronal MPR the reductions were 0.7%, 2%, 4.6% and 7.1% (Table 2).

Figure 6. Limiting spatial resolution (bar pattern method) demonstrating a small consistent decrease with higher % ASiR™.
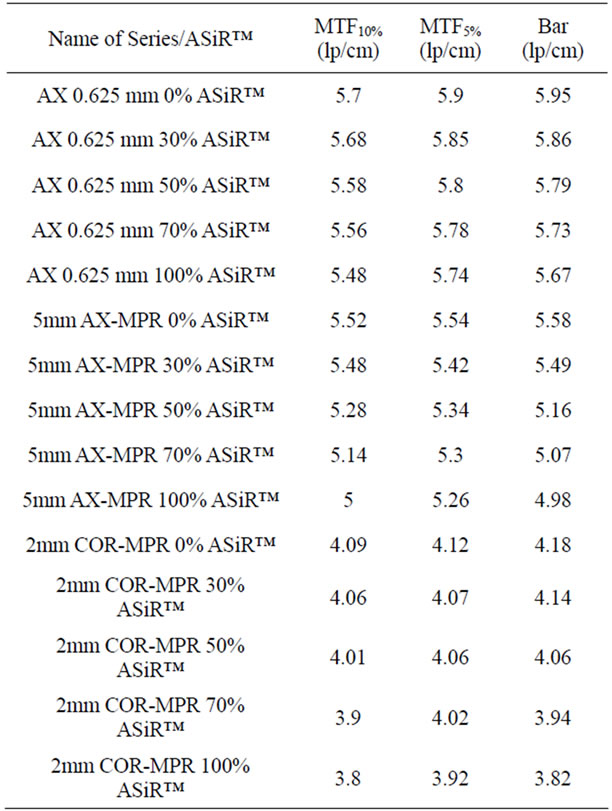
Table 2. Comparison between limiting resolution measurements with MTF and bar pattern methods for images acquired with increasing % ASiR™.
3.2. Image Quality Measurements for a Range of kVp/mA Settings in Images with 50% ASiR™
For all kVp and mA combinations, the addition of 50% ASiR™ did not affect the CT number values of 7 test materials. Averaged CT numbers measured for all test materials were in the suggested ranges [13] and showed expected variation with kVp. Figure 7 illustrates the CT number (HU) dependence on kVp for axial 0.625 mm images with FBP (0% ASiR™) and 50% ASiR™ for the 7 materials. Reformatted 5 mm axial MPR and 2 mm coronal MPR images showed the same dependency.
Noise reduction associated with 50% ASiR™ for the wide range of kVp and mA settings was slightly greater for 0.625 mm axial images (30% noise reduction) than for 2 mm coronal MPR (28%) and 5 mm axial MPR images (26%). This may reflect a greater efficacy in noise reduction proportional to initial noise levels, which are highest on the thinner 0.625 mm slices and lowest on 5 mm axial MPR. Contrast to noise ratio (CNR) improved with 50% ASiR™ in all series (axial 0.625 mm, 5 mm axial MPR and 2 mm coronal MPR) as expected. CNR values were calculated for each kVp/mA combination and averaged for each of the four beam energies (80100, 120 and 140 kVp) as recommended by Shikhaliev [14]. Arithmetic mean values of the calculated CNR improvements in images with 50% ASiR™ were 43%, 41%, and 39% in axial 0.625 mm, 2 mm coronal MPR and 5 mm axial MPR respectively, with slightly greater percentage CNR gain demonstrated in the thinner slices with greater initial noise. The change in noise texture associated with images reconstructed with ASiR™ is illustrated in Figure 8. For each pair of images, the 50% ASiR™ panel (b, d and f) show a change in noise texture when compared with the 0% ASiR™ (FBP) panel (a, c and e) accordingly. The images are represented on the same intensity scale. NPS analysis is illustrated in Figure 9. Two arbitrary kVp/mA settings have been selected for illustration purposes. In addition to a decrease in the magnitude of image noise for all spatial frequencies, there was a shift in the noise power spectral peak towards the lower frequencies for all 50% ASiR™ images. This shift coincided with a visually coarser or more ‘blotchy’ noise texture (Figure 9), which was especially visible at the lower mA range (10 - 100 mA). NPS analysis also demonstrated that noise reduction with ASiR™ was greater in the mid to higher spatial frequencies, corresponding to medium to small structures, compared to lower frequencies or larger structures.
LCD was assessed using smallest detected disc diameter at each contrast level, comparing 50% ASiR™ to FBP (0% ASiR™). For mA settings less than 100 mA, the images were too noisy for low contrast objects to be readily detected. For all images where the target objects could be visualized at each contrast level, there was overall improvement in LCD with 50% ASiR™. Figure 10 demonstrates results for the highest kVp/mA combination (120 kVp/400 mA). For axial 0.625 mm and coronal MPR slices at all contrast levels (0.3, 0.5 and 1%) LCD was improved on 50% ASiR™ images compared to FBP. On 0.625 mm axial slices, the 3 mm target object was identified at contrast level 1%, 6 mm object at 0.5% and 9 mm object at 0.3% compared to the FBP image where the 4 mm object was identified at 1% contrast level, the 7 mm object at 0.5%, with no target object detectable at 0.3% contrast level. For 2 mm coronal MPR with 50% ASiR™, the smallest detectable diameter was the 3 mm object at contrast level 1%, 7 mm at 0.5% and 9 mm at 0.3%, compared to 3 mm at 1%, 8 mm at 0.5% and no detectable objects at 0.3% level on FBP images. However, some of the low contrast objects were not visible on the thicker 5 mm axial MPR slices with 50% ASiR™. At the lowest contrast level of 0.3%, the 5 mm diameter object was detectable in FBP images but not on 50% ASiR™ images. The sub-slice target analysis demonstrated that at contrast level 1% the smallest 3 mm target object was not detectable on 50% ASiR™ 5 mm axial MPR, although it could be identified on the thinner
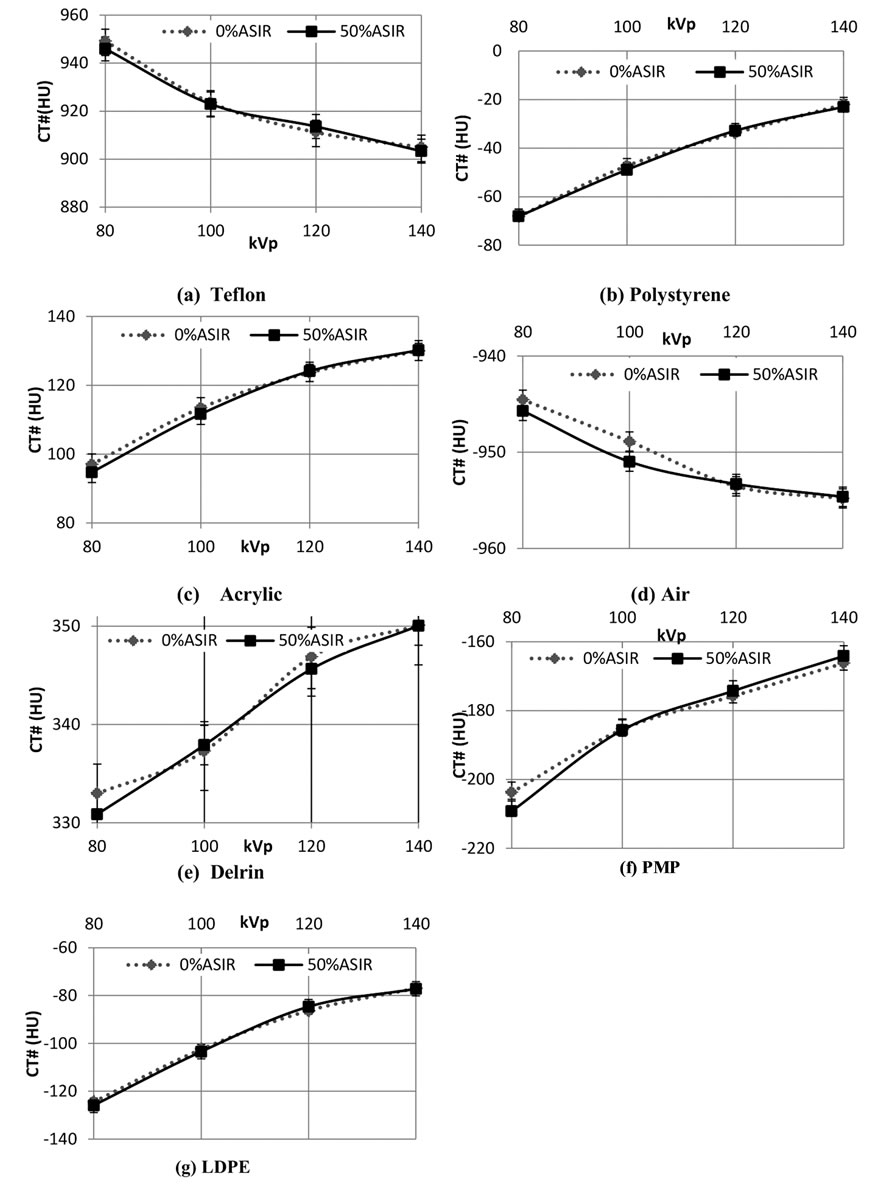
Figure 7. Mean CT numbers and SD for axial 0.625mm slices with and without 50% ASiR™ for test materials (a)Teflon; (b) Polystyrene; (c) Acrylic; (d) Air; (e) Delrin; (f) Poly-Methyl-Pentene (PMP) and (g) Low Density Polyethylene (LDPE).
0.625 mm axial and 2 mm coronal MPR images. The loss of sub-slice visualization in 5 mm axial MPRs is due to the 5 mm slice distance that is introduced in the reformatting process.
For the wide range of kVp and mA settings tested, a small reduction in visually detected limiting spatial resolution was present on 50% ASiR™ images. Averaged results from 50% ASiR™ series demonstrate a 3.7% reduction in 0.625 mm axial slices, 8.9% in 5 mm axial MPR and 3.1% in 2 mm coronal MPR (Figure 11). The impact of 50% ASiR™ on spatial resolution was greater for very noisy images generated at low current settings less than 50 mA. For images with ASiR™ at current settings greater than 50 mA the limiting resolution was comparable to although never better than the FBP images. The in-plane limiting spatial resolution in 0.625 mm axial, 5 mm axial MPR and 2 mm coronal MPR slices obtained from MTF analysis is presented in Table 3. The limiting spatial resolution for the CT system is specified at 5% MTF level. The carbide bead at 80 kVp/10 mA was not visible in either of the images reconstructed with or without ASiR™; as a result we were unable to measure MTF for this kVp/mA combination. At this low dose of 80 kVp/10 mA, the limiting spatial resolution from bar pattern method exhibited the lowest lp/cm value. The MTF5% test approximates the visual limiting resolution

Figure 8. Noise texture change demonstrated on images generated at 120 kVp - 400 mA: (a) 0.625mm axial with 0% ASiR™ and 50% ASiR™; (b) 5 mm axial MPR slice, with 0% ASiR™ and 50% ASiR™; (c) 2 mm coronal MPR slice with 0% ASiR™ and 50% ASiR™.
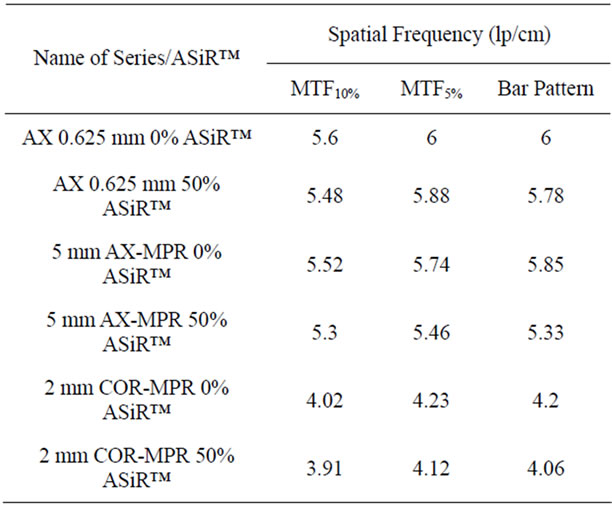
Table 3. Mean high contrast spatial resolution measurements with MTF and bar pattern method over all kVp/mA settings with and without 50% ASiR™.
and demonstrated resolution loss in ASiR™ images of 2% in axial 0.625 mm, 4.9% in 5 mm axial MPR and 2.6% in 2 mm coronal MPR. The MTF5% results reported are averages from all other kVp/mA settings. Table 4 gives spatial resolution measurements at 10 and 50 mA, averaged from all kVp settings, demonstrating a small spatial resolution loss on images generated with 50% ASiRTMat 10 mA, and minimally lower or comparable spatial resolution values at 50 mA.
4. DISCUSSION
Reduction in image noise associated with ASiR™ is a result of the statistical noise modeling incorporated into the reconstruction algorithm. Our CT phantom study confirms improvement in noise measurements on axially acquired images and multiplanar reformats when reconstructed with ASiR™ compared to FBP reconstructed images, with incremental increase in % ASiR™ resulting in further stepwise reductions in noise. ASiR™ efficacy as determined by percentage noise reduction varied to a small degree depending on initial image noise, the highest % reduction being achieved on 0.625 mm slices, then 2 mm coronal MPR, and slightly less on axial 5 mm MPR slices (Figure 1).
Noise Power spectrum analysis confirms a decrease in the magnitude of image noise with incremental reduction associated with increasing percentage of ASiR™. The effect of noise reduction from ASiR™ is not uniform across the spatial frequency spectrum. ASiR™ yields more pronounced noise reduction at higher spatial frequencies (fine detailed texture features) than at lower spatial frequencies (broad texture features). In our study we only removed the direct current (DC) component of the noise by subtracting the mean pixel value from the ROI prior to calculating the NPS; this structured noise component was observed at very low frequencies as a peak on the NPS graphs (Figures 4 and 9) and was not
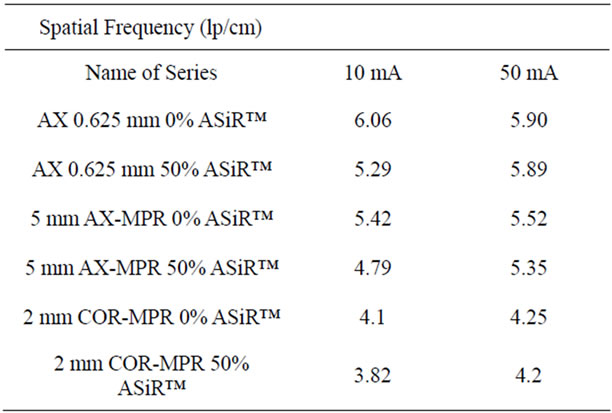
Table 4. Mean high contrast spatial resolution measurements with the bar pattern method at low mA settings, averaged from all kVp values.

Figure 9. Noise power spectra acquired at (a) 80kVp-10mA and (b) 100kVp-300mA reconstructed with 50% ASiR™ and without ASiR™ for 0.625mm axial slice. In panel (c) the noise texture is displayed for both kVp/mA settings with 50% ASiR™ and without ASiR™.

Figure 10. LCD for images acquired at 120 kVp-400 mA with and without ASiR™ for (a) 0.625 mm axial slice, (b) 5 mm axial MPR slice, and c) 2 mm coronal MPR slice.
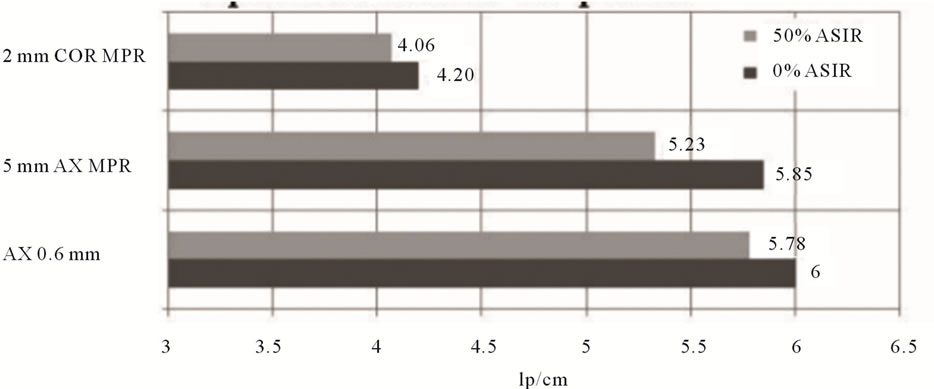
Figure 11. Small but consistent visual spatial resolution loss (bar pattern method) in 0.625 mm axial slices, axial and coronal MPRs when reconstructed with 50% ASiR™.
affected by ASiR™. The low-frequency portion of the NPS determines the detectability of large, low-contrast objects [15-18]. NPS analysis demonstrates a shift of the peak towards lower frequency in ASiR™ images, which coincides with changes in noise texture. As the % ASiR™ increases, the coarseness of the noise texture is amplified. The degree of overlap between the spatial frequencies of the noise and any lesion determines the degree to which the noise texture affects diagnostic accuracy. In images with 50% ASiR™ a “blotchy” pixelated noise appearance was detectable especially at the lower end of the dose range (10 to 100 mA), which may interfere with diagnostic image quality (Figure 9). At higher dose levels (100 to 400 mA), changes in the coarseness of noise texture were present as demonstrated by a peak shift on NPS but did not result in a visually appreciable “blotchy” appearance. The altered appearance of ASiR™ images has been previously described as “plastic appearing” [19]. Boedeker et al. report that the spatial frequency distribution or appearance of the noise, together with the absolute magnitude of noise, can influence image quality and ultimately object detectability [20]. Our NPS results also raise the concern that ASiR™-associated noise texture changes may potentially affect diagnostic image quality.
To assess further how the observed noise texture changes produced by ASiR™ may affect other image quality parameters we analysed LCD, spatial resolution and uniformity. The greater change in noise texture perceived in images reconstructed with higher % ASiR™ appears to largely account for the observed spatial resolution and LCD losses. Low contrast targets are visible when their size and contrast exceeds the noise fluctuation from the background. LCD improved in 0.625 mm axial images at 120 kVp and 150 mA with increasing ASiR™ up to and including 50%, compared to FBP images. LCD was also improved on 2 mm coronal MPRs, but showed some loss on 5 mm axial MPRs at 50% ASiR™. For images reconstructed with greater than 50% ASiR™, instead of further improvements in LCD, we encountered difficulty in detecting some small low contrast objects due to blurring and coarse noise texture. The implication of a loss in LCD is that low contrast resolution will be reduced for images reconstructed with greater than 50% ASiR™. Furthermore, the low contrast resolution may not be the same at different points in the image as this LCD loss seems to be dependent upon the noise in the acquired projection data; for regions of the image with poorer photon-counting statistics, the ASiR™ algorithm may smooth the image more aggressively than in regions of the image that have inherently less photon noise. The impact of the ASiR™ algorithm in patient images may be more pronounced as the attenuation of the different tissues may produce regions with different noise characteristics, which we are unable to reproduce with a phantom of uniform diameter and similar attenuation throughout most of the phantom.
A small but consistent limiting spatial resolution loss was documented in all images with ASiR™, demonstrated as increased blur on bar pattern and bead high contrast objects. The loss in limiting spatial resolution is small, although does increase with higher % ASiR™, and is most appreciable at very low mA. For images acquired at tube currents of 50 mA and above, limiting spatial resolution was similar or only minimally less than FBP images (Figure 12). However, at low mA (50 mA and lower), the limiting spatial resolution loss was more clearly seen, where blurring introduced difficulties in edge preservation for high contrast objects. At 10 mA, such blurring was pronounced and can be visually appreciated in Figure 13. Increasing % ASiR™ resulted in greater blur of the high contrast bead, as illustrated in Figure 14. MTF analysis confirmed the small loss in limiting spatial resolution resulting in blurring of the bead. Representative images obtained at 80 kVp - 100 mA and at 120 kVp/300 mA are provided in Figure 15. At the lowest kVp/mA setting, 80 kVp - 10 mA, the bead
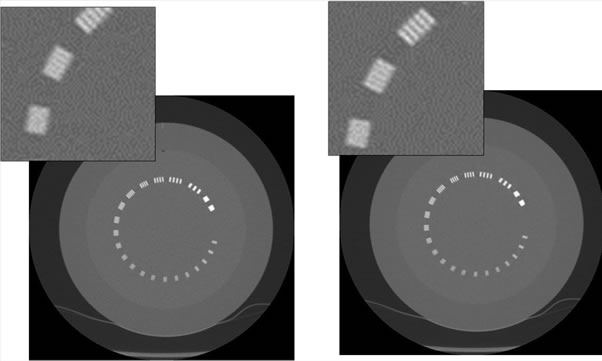
Figure 12. Limiting resolution module scanned at 100 kVp - 50 mA reconstructed with 0% ASiR™ (left) and with 50% ASiR™ (right). Note the minimal blurring impact on the bar pattern on the image reconstructed with 50% ASiR™.
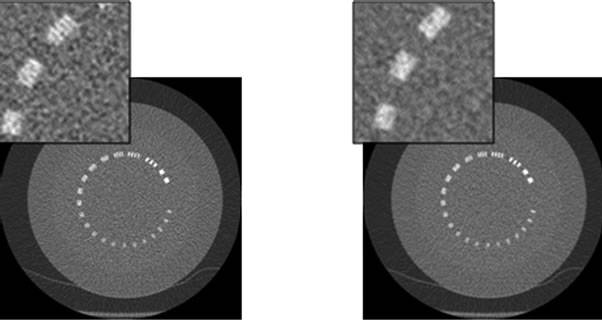
Figure 13. Limiting resolution module scanned at 80 kVp - 10 mA reconstructed with 0% ASiR™ (left) and 50% ASiR™ (right). Note the blurring impact on the bar pattern on the image reconstructed with 50% ASiR™.

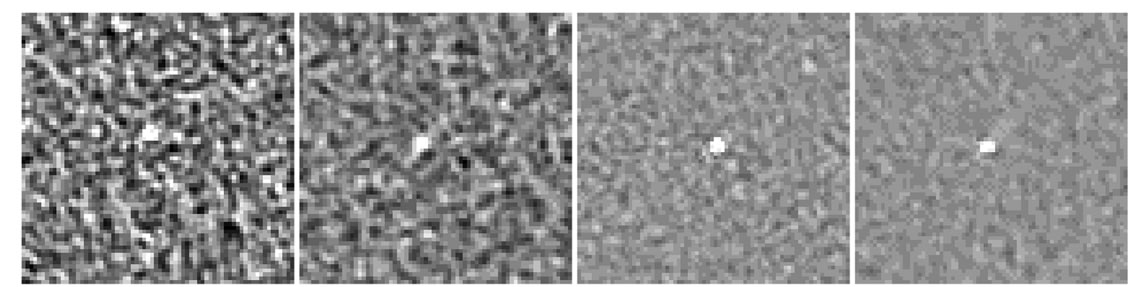
Figure 14. Bead for MTF analysis for axial 0.625 mm slices at 120 kVp - 150 mA and varying % ASiR™. Note the increased blur on the bead and the change in texture of the background noise as % ASiR™ increases.
 (a) (b) (c) (d)
Figure 15. Bead module appearance on 0.625 mm axial slices acquired at (a) 80 kVp - 100 mA - 0% ASiR™, (b) 80 kVp - 100 mA - 50% ASiR™ and (c) 120 kVp - 300 mA - 0% ASiR™; (d) 120 kVp - 300 mA - 50% ASiR™.
could not be detected due to blurring. For the high contrast resolution tests, the use of ASiR™ seems to have fewer detrimental effects than for low contrast objects. It seems that the resolution of the images may be dependent upon the inherent contrast of the object being imaged. To fully assess the image resolution, additional test should be performed with objects covering a range of contrast levels, which is not available in the phantom we used. For assessing iterative reconstruction algorithms, additional image quality metrics may be necessary, including development of standardized phantoms with more appropriate tests objects included.
Additional work to characterize the ASiR™ algorithm and its impact on image quality is needed. In this study, only four incremental % ASiR™ blends were selected for testing, from 30% - 100% ASiR™. From these, 50% appeared to be the optimal level, but in the absence of 40% and 60% data, some uncertainty remains and further work including these levels would be helpful. Further assessment of the impact of ASiR™ at low mA will also be necessary. Our results suggest that detrimental effects on image quality, specifically for spatial resolution and LCD are more prominent below a threshold of approximately 50 mA (25 mAs). More comprehensive study with smaller mA increments will be necessary for further investigation. Finally, the impact of ASiR™ on image resolution has not been fully explored, as the inherent contrast of the object being imaged seems to affect the resolution attained in the image [21]. Resolution assessments over a range of contrast levels should be systematically assessed for different ASiR™ blends.
Our work provides quantitative image quality data that we hope may be used in the formulation and design of ASiR™-enhanced clinical paediatric CT protocols. Optimal paediatric protocol design is complex, involving the need to balance image quality considerations, radiation dose and diagnostic task and considering patient variation in weight from 2 kg neonates to adolescents who may weigh over 100 kg. The reduction in noise and improvement in CNR possible with ASiR™ must be balanced against the changes in noise texture and the LCD and spatial resolution losses which can be observed at high % ASiR™ and at very low mA. On the basis of this work, it is suggested that 70% or greater ASiR™ blending should be avoided, especially for abdominal CT where many solid organ lesions are frequently low contrast. The observed reduction in spatial resolution on images obtained at 50 mA (25 mAs) or less may also caution against the use of ASiR™ in very low dose protocols, which might be used on the smallest paediatric patients.
Our study was limited to the assessment of a single vendor-specific iterative reconstruction algorithm, ASiR™, on a GE 750HD scanner model and is therefore only directly applicable to this single technology. There was no end-user (radiologist) assessment of diagnostic quality for paediatric patient images. The extrapolation of objective image quality parameter analysis to clinical diagnostic quality assessment is not straightforward, and end-user assessment of image quality with ASiR™ will be a necessary complement to this work. Clinical diagnostic quality is determined and influenced by multiple inter-related image quality parameters, of which image noise is one element. This will be a particularly challenging area for collaboration between medical physicists, vendors and radiologists. It is also difficult to directly extrapolate from % reduction in image noise to achievable % dose reduction, although one approach might be through the use of the Noise Index, which is an operatorselected variable indicative of the level of acceptable image noise, and an integral part of the GE Healthcare Automatic Tube Current Modulation system.
5. CONCLUSION
Most of the previously published work done to assess the utility of the ASiR™ algorithm has focused on adult patients. In our study, we tested the ASiR™ algorithm over a wide range of kVp and mA values corresponding to diagnostic parameters used in paediatric body CT. This phantom study investigated the image quality of CT images acquired with ASiR™ over a wide range of kVp and mA combinations, using an experimental design based on current scanning parameters using raw thin slice data and reformatted image display series to reflect clinical practice at a large pediatric teaching hospital. The results confirm that image noise, which is often the diagnostic limitation for low dose FBP images, can be lowered with the ASiR™ technique. Contrast to noise ratio and uniformity were accordingly improved on all ASiR™ images. Low contrast detectability was improved compared to FBP up to a threshold, with some low contrast objects obscured in images reconstructed with 70% and higher ASiR™ blends. The visible noise texture change associated with ASiR™, confirmed by objective noise power spectrum analysis and which may be unwelcome to radiologists, was most appreciable at 70% and 100% ASiR™ blends. A small but consistent limiting spatial resolution loss was observed for high % ASiR™. At very low mA (<50 mA) a small limiting resolution loss was also noticeable. Above 100 mA, limiting spatial resolution in ASiR™ images was comparable to FBP images. Based on these phantom study results, a 50% ASiR™ blend is associated with improvement in uniformity, noise, CNR, and low contrast detectability with comparable spatial resolution to filtered back projection, and is suggested as the optimal blend for use with tube currents greater than 50 mA in paediatric body CT. Further work will be needed to extend this work to clinical practice, including end-user assessment and consideration of diagnostic task and patient size.
6. ACKNOWLEDGEMENTS
The authors acknowledge Nancy Padfield for operating the CT scanner, Chris Gordon for use of the Catphan phantom, and financial support from NSERC.
REFERENCES
- Mettler Jr., F.A., Wiest, P.W., Locken, J.A., et al. (2000) CT scanning: Patterns of use and dose. Journal of Radiological Protection, 20, 353-359. doi:10.1088/0952-4746/20/4/301
- ICRP (2007) Radiological protection in medicine. ICRP Publication, Annual ICRP, 37. http://www.icrp.org/publication.asp?id=ICRP Publication 105
- Kalra, M.K., Maher, M.M., Sahani, D.V., et al. (2003) Low-dose CT of the abdomen: Evaluation of image improvement with use of noise reduction filters pilot study. Radiology, 228, 251-256. doi:10.1148/radiol.2281020693
- Leipsic, J., Nguyen, G., Brown, J., et al. (2010) A prospective evaluation of dose reduction and image quality in chest CT using adaptive statistical iterative reconstruction. American Journal of Roentgenology, 195, 1095-1099. doi:10.2214/AJR.09.4050
- Leipsic, J., Labounty, T.M., Heilbron, B., et al. (2010) Adaptive statistical iterative reconstruction: Assessment of image noise and image quality in coronary CT angiography. American Journal of Roentgenology, 195, 649-654. doi:10.2214/AJR.10.4285
- Marin, D., Nelson, R.C., Schindera, S.T., et al. (2010) Low-tube-voltage, high-tube-current multidetector abdominal CT: Improved image quality and decreased radiation dose with adaptive statistical iterative reconstruction algorithm—Initial clinical experience. Radiology, 254, 145-153. doi:10.1148/radiol.09090094
- Hara, A.K., Paden, R.G., Silva, A.C., et al. (2009) Iterative reconstruction technique for reducing body radiation dose at CT: Feasibility study. American Journal of Roentgenology, 193, 764-771. doi:10.2214/AJR.09.2397
- Silva, A.C., Lawder, H.J., Hara, A., et al. (2010) Innovations in CT dose reduction strategy: Application of the adaptive statistical iterative reconstruction algorithm. American Journal of Roentgenology, 194, 191-199. doi:10.2214/AJR.09.2953
- Mieville, F.A., Gudinchet, F., Rizzo, E., et al. (2011) Paediatric cardiac CT examinations: Impact of the iterative reconstruction method ASIR on image quality—Preliminary findings. Pedatric Radiology, 41, 1154-1164. doi:10.1007/s00247-011-2146-8
- National Research Council (2006) Health risks from exposure to low levels of ionizing radiation: BEIR VII phase 2. The National Academies Press, Washington DC.
- The Phantom Laboratory (2012) Catphan 500 - 600 Manual. The Phantom Laboratory, Salem.
- Boedeker, K.L., Cooper, V.N. and McNitt-Gray, M.F. (2007) Application of the noise power spectrum in modern diagnostic MDCT: Part I. Measurement of noise power spectra and noise equivalent quanta. Physics in Medicine and Biology, 52, 4027-4046. doi:10.1088/0031-9155/52/14/002
- Sande, E.P., Martinsen, A.C., Hole, E.O., et al. (2010) Interphantom and interscanner variations for Hounsfield units—Establishment of reference values for HU in a commercial QA phantom. Physics in Medicine and Biology, 55, 5123-5135. doi:10.1088/0031-9155/55/17/015
- Shikhaliev, P.M. (2010) The upper limits of the SNR in radiography and CT with polyenergetic X-rays. Physics in Medicine and Biology, 55, 5317-5139. doi:10.1088/0031-9155/55/18/005
- Hanson, K.M. (1979) Detectability in computed tomogramphic images. Medical Physics, 6, 441-451. doi:10.1118/1.594534
- Samei, E., Christianson, O., Chen, J., et al. (2012) THE-217BCD-09: Task-based image quality of CT iterative reconstruction across three commercial implementations. Medical Physics, 39, 4016-4016. doi:10.1118/1.4736383
- Solomon, J., Christianson, O. and Samei, E. (2012) THE-217BCD-07: Quantitative comparison of noise texture across ct scanners from different vendors. Medical Physics, 39, 4016-4016. doi:10.1118/1.4736381
- Brady, S. and Kaufman, R. (2011) WE-A-301-01: Characterization of an adaptive statistical iterative reconstruction (ASiRTM) algorithm in CT: A pediatric perspective. Medical Physics, 38, 3795-3796. doi:10.1118/1.3613285
- Singh, S., Kalra, M.K., Hsieh, J., et al. (2010) Abdominal CT: Comparison of adaptive statistical iterative and filtered back projection reconstruction techniques. Radiology, 257, 373-383. doi:10.1148/radiol.10092212
- Boedeker, K.L. and McNitt-Gray, M.F. (2007) Application of the noise power spectrum in modern diagnostic MDCT: Part II. Noise power spectra and signal to noise. Physics in Medicine and Biology, 52, 4047-4061. doi:10.1088/0031-9155/52/14/003
- Richard, S., Husarik, D.B., Yadava, G., et al. (2012) Towards task-based assessment of CT performance: System and object MTF across different reconstruction algorithms. Medical Physics, 39, 4115-4122. doi:10.1118/1.4725171