Journal of Biomedical Science and Engineering
Vol.5 No.2(2012), Article ID:17636,20 pages DOI:10.4236/jbise.2012.52011
Effects of subject’s wakefulness state and health status on approximated entropy during eye opening and closure test of routine EEG examination
![]()
1Graduate School of Science and Engineering, Yamagata University, Yonezawa, Japan
2Psychiatry, Hotokukai Utsunomiya Hospital, Utsunomiya, Japan
Email: maan_alaraj@yahoo.com, fukami@yz.yamagata-u.ac.jp
Received 29 August 2011; revised 24 October 2011; accepted 24 November 2011
Keywords: EEG; Routine Examination; Eyes Opening and Closing Test; Discrete Wavelet; Approximate Entropy
ABSTRACT
This study tested a novel method designed to provide useful information for medical diagnosis and treatment. We measured electroencephalography (EEG) during a test of eye opening and closing, a common test in routine EEG examination. This test is mainly used for measuring the degree of alpha blocking and sensitivity during eyes opening and closing. However, because these factors depend on the subject’s awareness, drowsiness can interfere with accurate diagnosis. We sought to determine the optimal EEG frequency band and optimal brain region for distinguishing healthy individuals from patients suffering from several neurophysiological diseases (including dementia, cerebrovascular disorder, schizophrenia, alcoholism, and epilepsy) while fully awake, and while in an early drowsy state. We tested four groups of subjects (awake healthy subjects, drowsy healthy subjects, awake patients and drowsy patients). The complexity of EEG band frequencies over five lobes in the human brain was analyzed using wavelet-based approximate entropy (ApEn). Two-way analysis of variance tested the effects of the two factors of interest (subjects’ health state, and subjects’ wakefulness state) on five different lobes of the brain during eyes opening and closing. The complexity of the theta and delta bands over frontal and central regions, respectively, was significantly greater in the healthy state during eyes opening. In contrast, patients exhibited increased complexity of gamma band activity over the temporal region only, during eyes-close. The early drowsy state and wakefulness state increased the complexity of theta band activity over the temporal region only during eyes-close and eyes-open states respectively, and this change was significantly greater in control subjects compared with patients. We propose that this method may be useful in routine EEG examination, to aid medical doctors and clinicians in distinguishing healthy individuals from patients, regardless of whether the subject is fully awake or in the early stages of drowsiness.
1. INTRODUCTION
Eyes opening/closing are a commonly applied test in routine EEG examination, which provides valuable information in diagnosis. This test is typically used for determining the degree of alpha blocking and sensitivity by eyes opening and closing. However, these factors are affected by the subject’s wakefulness/drowsiness, which can make diagnosis problematic. Therefore, a system for quantitative evaluation of these states is needed for more precise diagnosis. There has been much recent interest in developing a reliable system for quantitatively distinguishing the early drowsiness and full wakefulness states in a precise manner, which would be useful for a wide range of applications. Such systems can be based on neurophysiological techniques, such as electroencephalography (EEG), which is suitable for capturing the macroscopic spatial temporal dynamics of the electrical activeties of the brain. EEG data are measured with electrodes attached to participants’ scalps, stored on a computer, then analyzed using various signal processing techniques. EEG can contain important information about human physiological health, and the functional state of the brain. As such, EEG is an effective tool for understanding the underlying complex dynamic behaviors of the brain, which evolves over time. Non linear dynamics analysis techniques reflect the complexity of the overall EEG over time, and are superior to traditional linear methods such as Fourier transform, and power spectral analysis [1]. Some studies have used approximate entropy (ApEn) and a range of other non linear parameters, such as correlation dimension, fractal dimension, and largest Lyapunov entropy to estimate non linear properties of EEG signals during sleep stages. One study reported that EEG during sleep stages exhibited less complexity than EEG signals in the awake state, because the cortex becomes less active as the person transitions from one sleep stage to the next, until stage IV [2]. However, rapid eye movement (REM) was associated with a relatively high level of complexity, due to increased activation of the brain during this stage of sleep [2].
Other studies used have discrete wavelet transform (DWT) and ApEn to analyze EEG signals to detect epileptic activity, reporting that epileptic activity was associated with less complexity than healthy brain activity, using a single channel of EEG signals [3,4]. Another study used ApEn as a tool to analyze regularity in EEG signals for Alzheimer’s disease patients, revealing decreased complexity in Alzheimer’s patients, due to neural dysfunction [5,6]. ApEn was also used to test the complexity of EEG signals in schizophrenic subjects, revealing that the EEG signals of patients with schizophrenia contained less complexity compared with those of control subjects [7]. In addition, the complexity of EEG signals in subjects suffering from mania has been tested using ApEn and the Takens estimator [8]. The results indicated that there was no distinct discrimination between manic and healthy subjects based on those non linear measures [8].
In a previous study, a combination of short time Fourier transform (STFT) with relative statistical values (Zvalues) was used to evaluate drowsiness quantitatively in two human populations (healthy subjects and patients suffering from dementia, cerebrovascular disorder, schizophrenia, alcoholism, and epilepsy), during different wakefulness states (fully awake and drowsy) [9]. This analysis was found to successfully distinguish the healthy awake group and the healthy drowsy group from the other groups [9]. Burioka et al. [10] used the signal from a single electrode placed at C3 to compute ApEn for evaluating the awake state and sleep stages during the eyes-closed state only, in eight healthy subjects. These subjects were distinguished by measuring the percentage change in the mean ApEn across six different stages (awake state and sleep stages). Their results revealed that sleep stage I was associated with less complexity than the awake and REM states, but more complexity than sleep stage II, III, and IV.
Fan et al. [11] analyzed the complexity of EEG signals of children in seven states: awake with eyes opened, awake with eyes closed, and during sleep stages (I, II, III, IV and REM). They reported that the global EEG complexity in the awake state with eyes opened was greater than that in the awake with eyes closed condition. In addition, EEG complexity was found to be greater in the wakefulness state than in the sleep state.
The early drowsy state (stage I) typically contains several forms of eyes closing and eyes opening, ranging from complete eyes closing to incomplete closing, as well as eyes opening for different durations (short or long). Such transitions from eyes closing to eyes opening could increase the complexity of the EEG signal and its subbands. Moreover, these transitions during early state of drowsiness or wakefulness are accompanied by particular EEG patterns, which increase the amount of complexity. In addition, a healthy cortex is typically more active than the cortex of neurological patients, due to the higher number of healthy neurons available for processing information. Hence, the complexity of the EEG signal is also increased in healthy subjects. As such, the presence of either early state of drowsiness or wakeful state in normal subjects could be problematic for determining the effects of (early drowsiness/wakefulness) on the complexity of EEG signals during repetitive eyesclose and eyes-open.
In the present study, we examined the influence of two factors: subject’s wakefulness state factor (fully awake/ early stage of drowsiness), as well as subject’s health status factor (normal/patient) on the complexity (irregularity) of EEG frequency bands during an eyes opening and closing test in a routine EEG examination. This task consists of a relatively short period of repetitive opening and closing of the eyes, while EEG signals are recorded from the scalp over five regions of the brain. All of these effects can then be used to distinguish subjects based on their healthy/patient status, and their wakeful/drowsy state. It is particularly important to distinguish participants in the drowsy state because the EEG correlates of transitions to the early drowsy state (stage I) as well as transitions to other stages of sleep states, are currently unclear [12]. Moreover we sought to test the ability of ApEn to detect the early drowsy/wakefulness states in repetitive eyes opening/closing. Validating this method is important, because the complexity of the EEG signal in the early drowsy state (stage I) would be expected to be close to that in the wakefulness state, making the task of distinguishing the wakeful and early drowsiness states more difficult than detecting continuous eye closure, as reported by [2]. In addition, the current study sought to elucidate specific patterns of EEG signals, by revealing the effects of their role in relatively short periods of eyes opening/closing on EEG complexity, in particular regions in the human brain. The results of this study may also provide medical doctors and clinicians with useful information for diagnosis, demonstrating that the early drowsy state can be identified by the increasing complexity of limited EEG bands, particularly the theta band, during eyes closing. In addition, wakefulness state can also be identified by the increasing complexity of theta band, during eyes opening. All of the current experiments were conducted in four groups of subjects: normal awake (NA), normal drowsy (ND), patient awake (PA) and patient drowsy (PD) groups, as shown in Table 1. DWT was used to decompose the EEG band (0 - 60 Hz) related to eyes opening periods and eyes closing periods into the gamma (30 - 60 Hz), beta (13 - 30 Hz), alpha (8 - 13 Hz), theta (4 - 8 Hz) and delta (0 - 4 Hz) EEG subbands. ApEn was then estimated for each band at all electrodes corresponding to each of the frontal (F), central (C), (temporal (T), parietal (P), and occipital (O) regions.
2. METHOD
2.1. EEG Dataset
A Nihon Koden polygraph (EEG-1100) was used to acquire multi-channel EEG signals with a 0.3-second time constant, a cut off frequency of 60 Hz in a low-pass band filter, and a 97.5 nV quantization system. EEG signals were measured from 19 electrodes on the scalp, placed according to the international 10/20 system. We analyzed signals from five lobes (regions): the “Occipital Region (O)” corresponding to O1 and O2, the “Parietal Region (P)” corresponding to P3, Pz, and P4, the “Temporal Region (T)” corresponding to T5 and T6, the “Central Region (C)” corresponding to C3, Cz and C4, and the “Frontal Region (F)” corresponding to F7, F3, Fz, F4, and F8, with monopolar derivation from bilateral reference electrodes, (i.e., an average of A1 and A2 electrodes at the earlobes). We used data from the eyes opening and closing test in a routine EEG examination. Each EEG recording period lasted for 70 seconds, beginning with the eyes closed for 10 seconds followed by a period with eyes open for 10 seconds. This sequence was repeated for 70 seconds, as shown in Figure 2. Thus, each 10- second period contained a section corresponding to either the eyes-closed or eyes-open state. Each section was considered as a block, and each block was described as follows: “CLOSE0”, “OPEN1”, “CLOSE1”, etc., to “CLOSE3”. A computer program was used to detect the execution of eyes opening and closing from the electro-oculogram signal. In addition, visual confirmation of eyes opening and closing was performed by a clinical laboratory technician. If these two checks indicated that eyes opening and closing had not been performed by subjects, the corresponding EEG data were excluded from further analysis. Moreover, body motion, which can cause motion artifacts, was also detected with electromyography, and processed accordingly. The EEG signals were digitized at a sampling frequency of 200 Hz. All data were collected at Utsunomiya hospital after obtaining informed consent. EEG data were recorded from 50

Table 1. Number of subjects and age of subjects.
healthy subjects and 50 patients. People in the patient group suffered from various conditions including dementia, cerebrovascular disorder, schizophrenia, alcoholism, and epilepsy. A full description of the patient information is shown in Table 1. All subjects were classified into awake and drowsy conditions, based on the international classification scheme proposed by [13]. According to this scheme, EEG datasets from drowsy-state subjects were considered as sleep stage I of NREM (non rapid eye movement).
2.2. Discrete Wavelet Transform (DWT)
DWT has recently been applied in wide range of scientific applications, providing a flexible method of timefrequency representation of signals using flexible window sizes. In the current paper, third-order Daubechies (db3) was used to decompose EEG signals into subbands. During DWT, the signal is passed through a halfband digital low-pass filter (LP), and a half-band digital high-pass filter (HP). The outputs of LP and HP represent the lowest half-band and highest half-band, respectively, of the original input signal. The lowest half-band corresponds to all frequencies less than half of the highest frequency in the input signal. These are referred to as “approximate components”, denoted by “A” as described below. The highest half-band corresponds to all frequencies more than half the highest frequency in the input signal, referred to as “details components” and denoted by “D” as described below. According to the Nyquist rule, half of the sampled signals were eliminated from the approximate and details components, because they had half of the highest frequency of the input signal. Because the recorded EEG data were in the range 0 - 60 Hz, the output of the DWT is referred to as “approximation A1” (0 - 30 Hz), and “detail D1” (30 - 60 Hz) are the coefficients of the first level. The same procedure was repeated for three decomposition levels to produce D2, D3, D4 and A4, corresponding to the Gamma band (30 - 60 Hz), Beta band (15 - 30 Hz), Alpha band (8 - 15 Hz), Theta band (4 - 8 Hz), and Delta band (0 - 4 Hz), respectively. Minor differences in the boundaries between the components compared with those between the EEG subbands are of little consequence because of the physiologically approximate nature of the sub-bands [14], as shown in Figure 1.
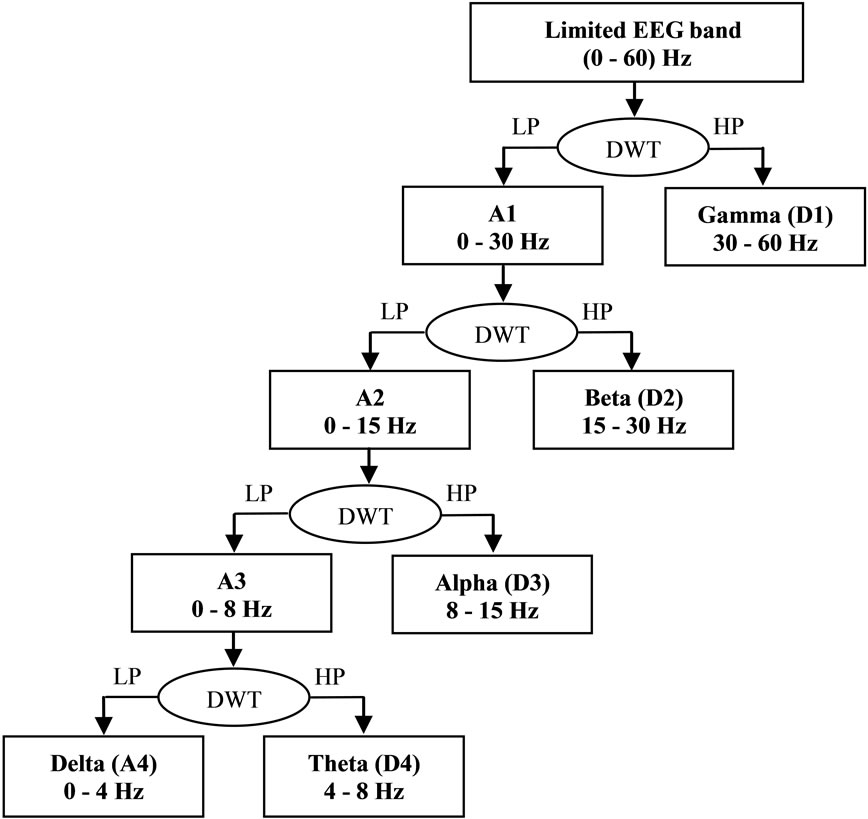
Figure 1. Fourth level wavelet decomposition of EEG signal.
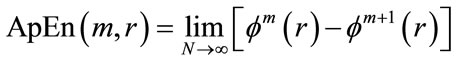
2.3. Approximate Entropy (ApEn)
ApEn is used to estimate the regularity of the time series of short, noisy data sets. Mathematically, this estimation is calculated by measuring the unpredictability of the fluctuation in a time-series related to the signal. ApEn evaluates both dominant and sub-dominant patterns in the data, and discriminates series for which clear feature recognition is difficult. This is applicable to systems with at least 50 data points [15], and less than approximately 1000 data points [16,17]. ApEn assigns a positive number to a time-series, such that large values correspond to more complexity, less predictability, different patterns of fluctuation, and irregularity. ApEn can be computed for this time series by specifying two user-defined parameters m (embedding dimension) and r (tolerance window).
ApEn is estimated using the following algorithm:
1) For a time-series S containing N data points, “complexity” can be measured by ApEn in multiple dimensional space, in which a series of vectors are constructed and expressed as:

In general, the aforementioned vectors could be defined as:
 (1)
(1)
In Eq.1, each one of the vectors is composed of m consecutive and discrete data points of time series S.
2) The distance between two corresponding data points from each vector is then calculated, by denoting the distance between  and
and  by
by , defined as a maximum absolute difference between their respective scalar components, where
 ;
;  , and N is the number of data points contained in time series.
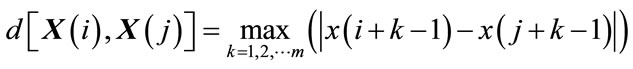 (2)
(2)
3) For each vector , a measure that describes the similarity between the vector
  and all other vectors
 ,
, ;
; ,
,  can be constructed as:
 (3)
(3)
where:
 (4)
(4)
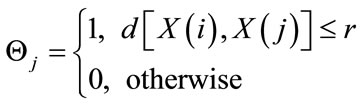
The symbol r in Eq.3, represents a predetermined tolerance value, defined as:
 (5)
(5)
where: a is a constant  and
and  represents the standard deviation of the time series, by defining:
 (6)
(6)
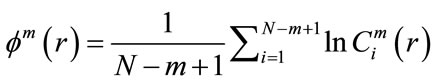
4) The dimension is increased from m to m + 1, Steps 1 - 3 are repeated, and  is computed. The result obtained through the above steps provides an estimate of ApEn, denoted by:
 (7)
(7)
In practice, the number of data points N is finite, and the result obtained through the above steps is only an estimate of ApEn when the data length is N. This is denoted by:
 (8)
(8)
Briefly, ApEn measures the logarithmic likelihood that runs of a pattern that is close (within) for m contiguous observations remain close (within the same tolerance width r) on subsequent incremental comparisons. Usually, comparisons between time series can only be made with the same values of m and r [17]. Although m and r are critical in determining the outcome of ApEn, no reliable method exists for optimizing their values. However, smaller values of r (short tolerance) achieve poor probability estimates, while larger values of r lose too much detailed system information. To avoid a significant effect of noise in an ApEn calculation, a value of r must be chosen that is larger than the values of most of the noise [17]. As defining in Eq.5, the result of r depends on the selection of a value for specific time-series S that contains a fixed number of data points.
Sometimes the exact amount of noise present in a data set cannot be determined in advance. As such, we used the technique suggested by [17]. ApEn was estimated using the widely established parameter values of m = 1 or m = 2, and a values of the r parameter were fixed between 0.1 to 0.25 times the standard deviation (STD) of the original data sequences {S (N)}.
All combinations of m and a were used. A significant effect was obtained using m = 2 and a = 0.15. Here, the significance of an effect was dependent on evidence of the early drowsy state (stage I), which was characterized by a gradual decrease in alpha rhythm during eye closure, and was associated with a decrease of the alpha rhythm to 2 - 7 Hz [12,18]. Thus, we considered it prior knowledge that a significant difference should be found between normal awake subjects (NA), and normal drowsy subjects (ND) in alpha band activity during eye closure.
Thus, in this study, ApEn was computed with the established parameters m = 2 and r = 0.15 STD(S). These parameters have been reported to provide good statistical reproducibility for sequences longer than 50 [17,19]. Calculation of ApEn was performed with software developed using MATLAB. We measured the EEG signal and its sub-bands, extracted from the wavelet decomposition, as inputs for ApEn to measure EEG signal complexity. Before wavelet decomposition was performed for each eyes-open and eyes-closed period, ApEn was calculated for each 1-second period (200 data points) across each 10-second period, as shown in Figure 2, and the calculated values were averaged over the length of each 10- second section corresponding to either the eyes-closed period or the eyes-open period. Although it is not necessary to average ApEn values calculated from each 1-second period, it can be useful to reduce the effects of noise and artifacts on ApEn for each section [3]. This procedure was performed in each section for each electrode signal, per group of subjects. All ApEn values corresponding to eyes-closed periods could be averaged. The same procedure was conducted with the eyes-open periods, for the limited EEG band. Each period of eyes opening and eyes closing was decomposed with DWT into different sub-frequency bands corresponding to the EEG sub-bands. ApEn was estimated for each sub-band belonging to each eyes-opened period and eyes-closed period, respectively. The average ApEn values corresponding to each eyes-closed and each eyes-opened period were calculated, for each electrode. A second average was calculated for the ApEn values for eyes-opened and eyes-closed periods over multiple electrodes that corresponded to each region out of five regions in the brain, as shown in the next section.
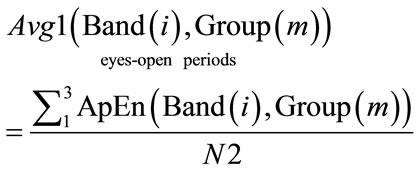
2.4. Calculation of ApEn Averages
The average ApEn values were calculated three times in sequence. The average ApEn value for all EEG band frequencies across eyes-closed periods, as well as across eyes-open periods for each electrode was calculated.
 (9)
(9)
 (10)
(10)
 .
.
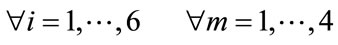
where: N1 = 4, N2 = 3. Bands = [Limited EEG band,
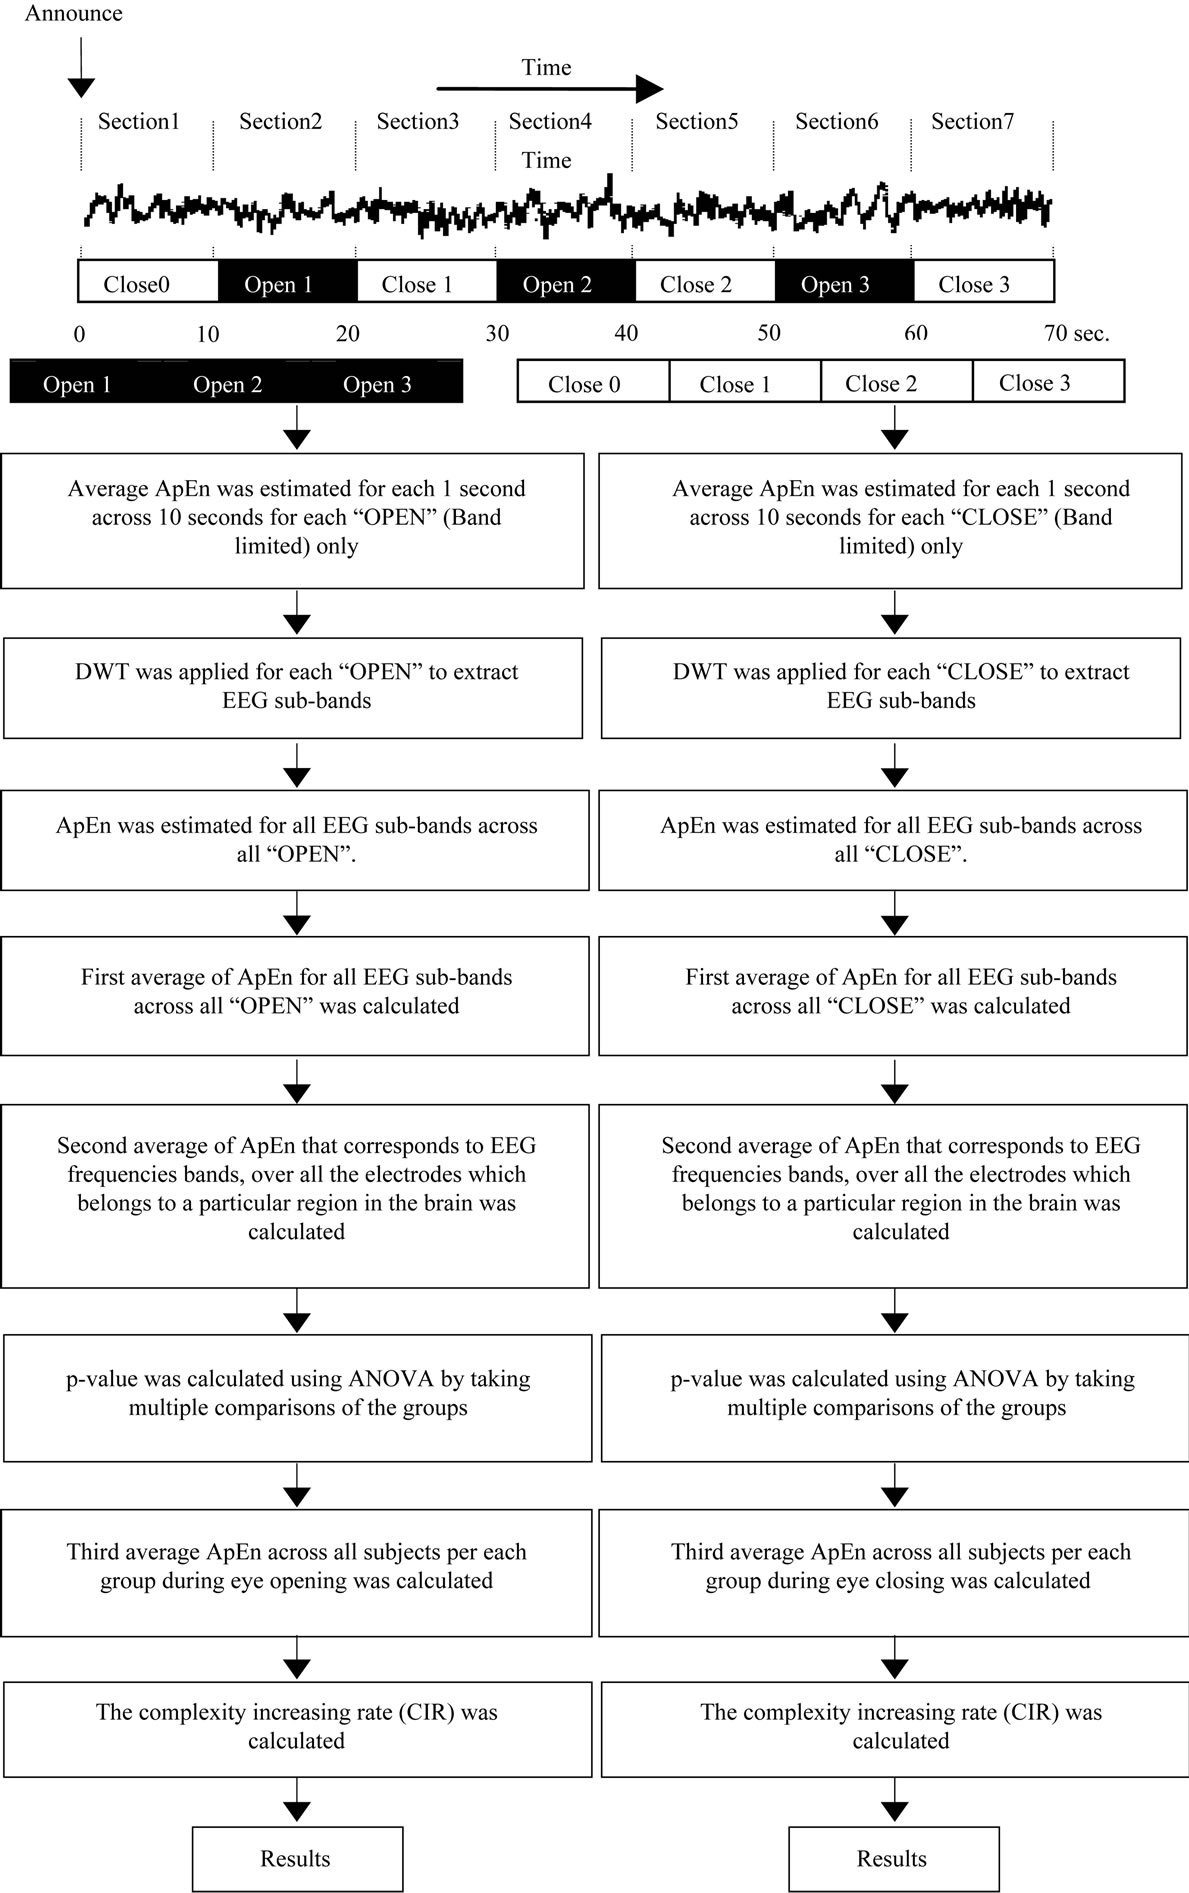
Figure 2. Block diagram of overall method.
Gamma, Beta, Alpha, Theta, Delta]. Group = [Normal Awake, Normal Drowsy, Patient Awake, Patient Drowsy]. The second average was calculated for all Avg1 during eyes-opened and eyes-closed periods across multiple electrodes (Elc.) that corresponded to each one of the five brain regions, for each group.
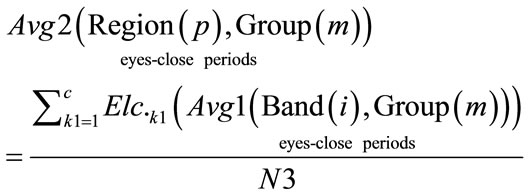 (11)
(11)
 (12)
(12)

where: N3 = c.
c = total number of all the electrodes that correspond for each region over brain. Region = [Frontal, Central, Temporal, Parietal, Occipital]. Group = [Normal Awake, Normal Drowsy, Patient Awake, Patient Drowsy]. The third average was calculated for all Avg2 (Region(p), Group(m)), during eyes-opened and eyes-closed periods across all subjects in each group, using Eq.10.
 (13)
(13)
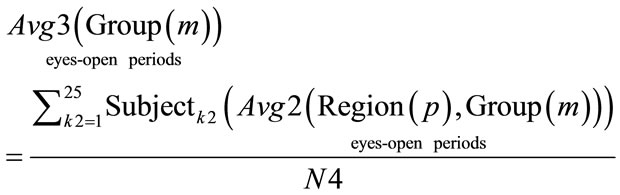 (14)
(14)
where: N4 = 25. Group = [Normal Awake, Normal Drowsy, Patient Awake, Patient Drowsy].
All of the results for Avg3 (Group(m)) during eyesopened and eyes-closed periods for each region were calculated for all EEG band frequencies. These findings are shown in Figures 3 and 4, for the eyes-closed and eyes-opened periods, respectively.
2.5. Analysis of Variance (ANOVA Test)
p-values were calculated using a two-way ANOVA, to determine the effects of factor A, factor B, and the interaction between them (A × B). The design of the twoway ANOVA included the following terms:
• Factor A = the first independent variable. (Subject’s health status; i.e., normal/patient)
• Factor B = the second independent variable. (Subject’s wakefulness state; i.e., fully awake/early stage of drowsiness)
• A × B = the interaction between factor A and factor B.
• Factor A marginal means  = the mean of all the scores in all the cells that have received the
  condition (level) of factor A, disregarding the levels of B.
• Factor B marginal means  = the mean of all the scores in all the cells that received the
  condition (level) of factor B, disregarding the levels of A.
In this paper, we used two levels for each factor; (normal/patient) for factor A, and (early drowsy state/wakefulness) for factor B. 25 ApEn values corresponding to 25 subjects, existed per cell in the design of the two-way ANOVA, as described in Table 2. All of these effects were tested for the second average of ApEn values (dependent variable) per each region. We defined the interaction between any two factors (significant interaction), when , as follows: if a particular combination of factors led to results that were not simply the sum of the main effects of the two factors. If no interacttion is present, main effects are sufficient to describe a data set. However, when an interaction is present, the main effects of the factors can mask underlying patterns in the data. Two-way ANOVA can determine the main effects of the contribution of each independent variable on the dependent variable. Multiple comparisons were then performed using Scheffe’s method, when F tests were significant [20]. A significant result at the 95% probability level was considered. This probability level tells us that our data are sufficient to support a conclusion with 95% confidence. This level of significance is generally accepted in biological research [3].
3. RESULTS
All significant differences referring to the influence of

Table 2. The design of two-way ANOVA, for 25 subjects per cell.
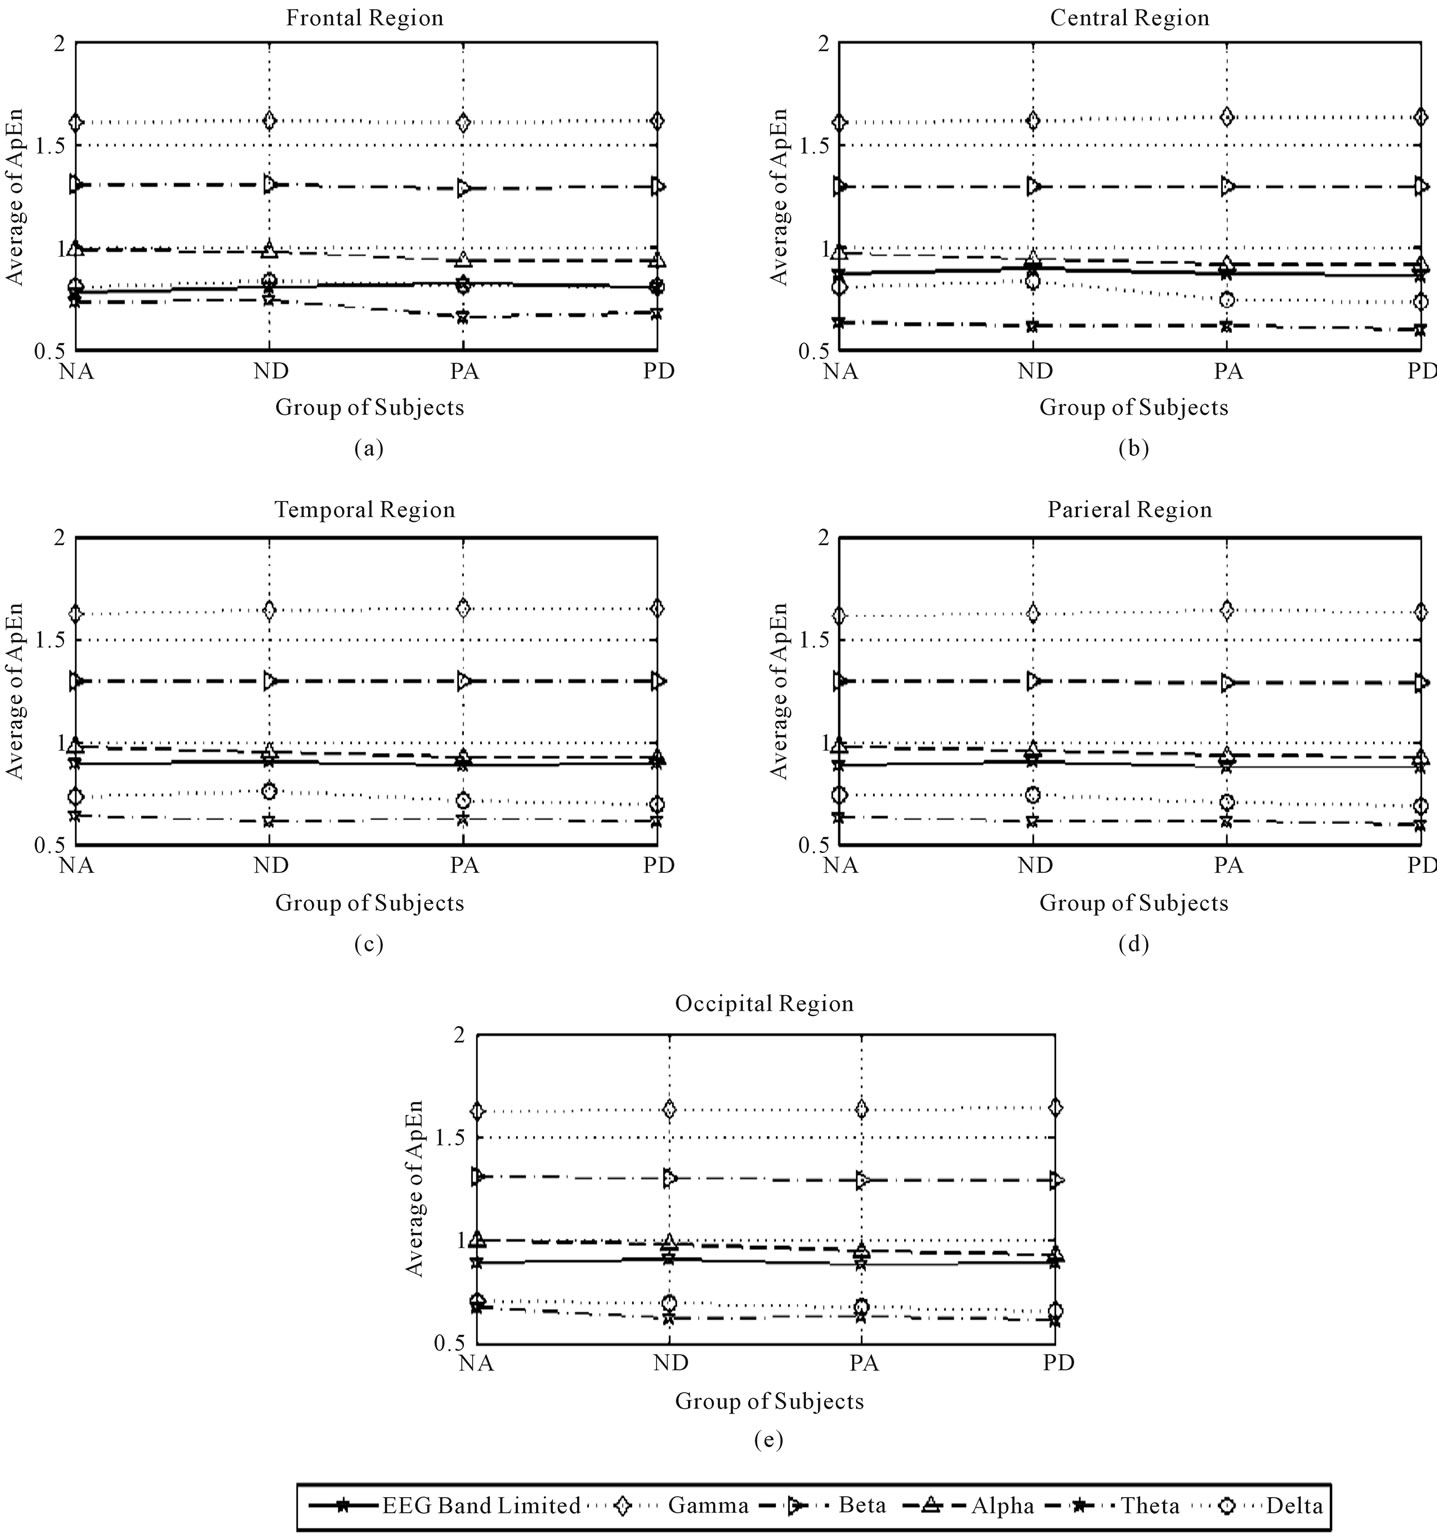
Figure 3. Third average of ApEn in the frontal, central, temporal, parietal, and occipital regions during eyes-closed state.
the subject’s health-status factor  with no significant interactions (associated with
 ), as shown in Table 3) were considered to indicate a significant normal/patient state effect on EEG complexity during repetitive eyes opening/closing as shown in Table 4. In contrast, all significant difference results related to the influence of subject’s wakefulness state factor
  without a significant interaction (associated with
  , as shown in Table 3), were considered to indicate a significant effect of the early drowsy/wakefulness state during repetitive eyes opening/closing, as shown in Table 5. If any significant interaction was present, we were unable to determine the effects of the two examined factors associated with this
 , so these results will not be discussed. All brain regions and EEG frequency bands that could provide valid results for determining the significant influence of health status (factor A) and the significant influence of
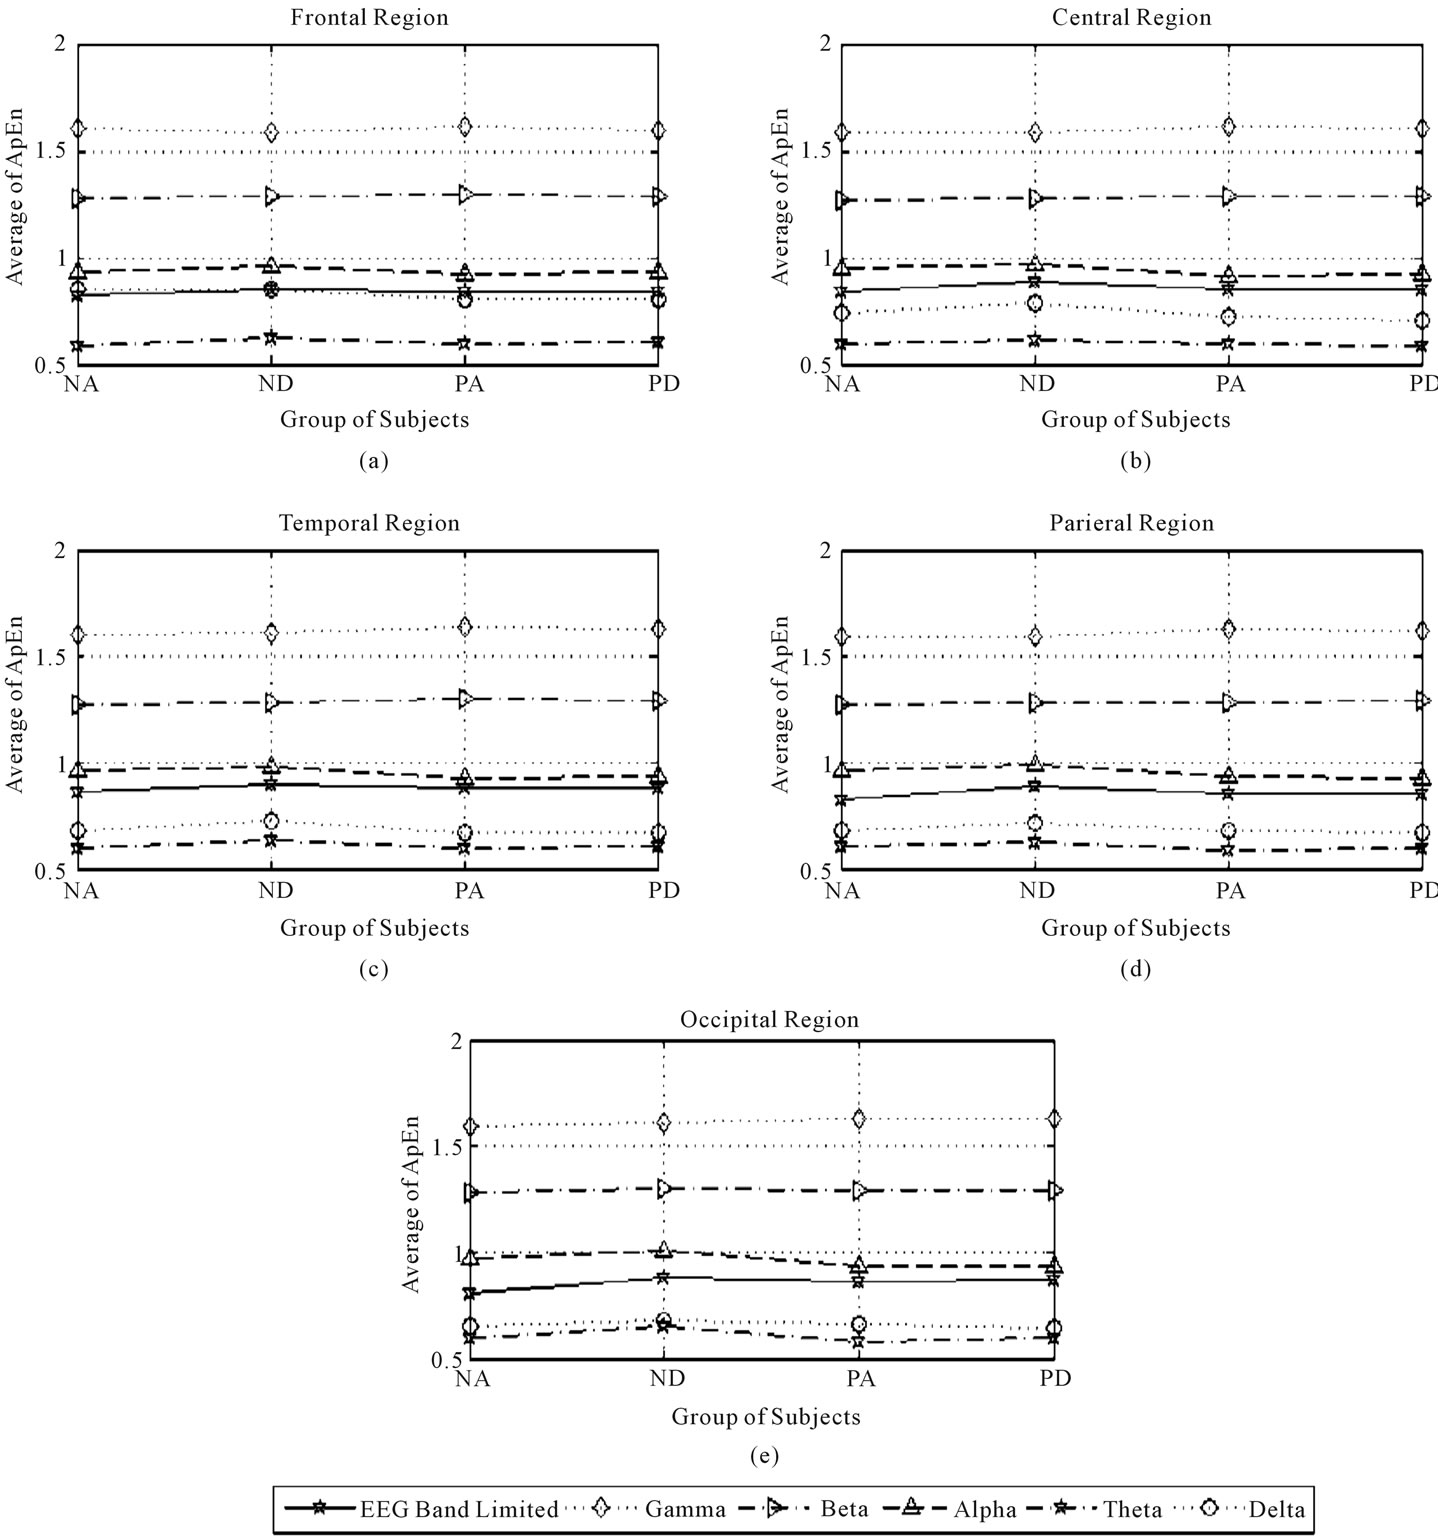
Figure 4. Third average of ApEn in the frontal, central, temporal, parietal, and occipital regions during eyes-opened state.
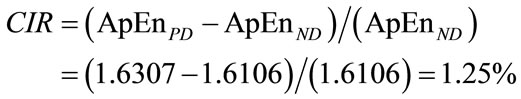
wakefulness (factor B), during repetitive eyes opening/closing are presented in Table 6 and are called primary results. After determining the main source of the complexity in EEG frequency bands by applying twoway ANOVA to the second average of ApEn values for five brain regions using the first average values from multiple electrodes, we calculated the magnitude of complexity increasing rate (CIR) as a measure of each factor’s effect. For example, the obtained results indicate that the complexity of gamma band increased signifycantly when the subject is patient during eyes opening and closing over temporal region. To calculate the magnitude of CIR related to health-status in the gamma band over the temporal region during eyes closure, we used the third average ApEn, as shown in Eqs.13 and 14. Thus, the percentage CIR in gamma band over the temporal region during eyes closure was calculated as follows:

Table 3. p-values of interaction effect PInteraction between the factors of interest (A and B) on ApEn values, for all EEG band frequencies, over five regions in the brain (EEG: Limited EEG band, γ: Gamma band, β: Beta band, α: Alpha band, θ: Theta band, δ: Delta band).

Table 4. p-values of subject’s healthy status (healthy/patient) effect on ApEn values, for all EEG band frequencies, over five regions in the brain (EEG: Limited EEG band, γ: Gamma band, β: Beta band, α: Alpha band, θ: Theta band, δ: Delta band).

Table 5. p-values of subject’s wakefulness state (fully awake/early drowsy) effect on ApEn values, for all EEG band frequencies, over five regions in the brain (EEG: Limited EEG band, γ: Gamma band, β: Beta band, α: Alpha band, θ: Theta band, δ: Delta band).
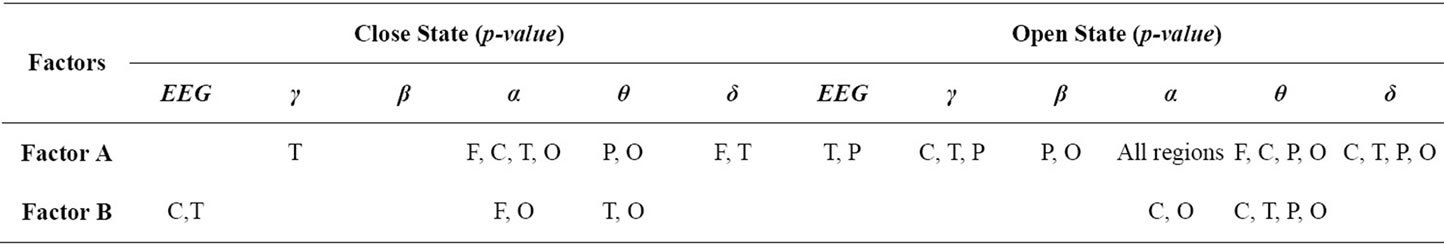
Table 6. Summary of significant p-values (primary results) for the effects of factor A and factor B without interaction during eyes-closed periods and eyes-open periods, over five regions in the brain (F: Frontal, C: Central, T: Temporal, P: Parietal, O: Occipital); (EEG: Limited EEG band, γ: Gamma band, β: Beta band, α: Alpha band, θ: Theta band, δ: Delta band).

Similarly, to calculate the percentage of CIR in early drowsy state:
And so on.
All of the results relating to the percentage of CIR are shown in Tables 7 and 8.
The effects of factor A (subject’s health-status) were calculated as follows: The results revealed that the normal state was associated with significantly greater complexity of several EEG band frequencies (all EEG bands except the gamma band), during eyes closing and opening,
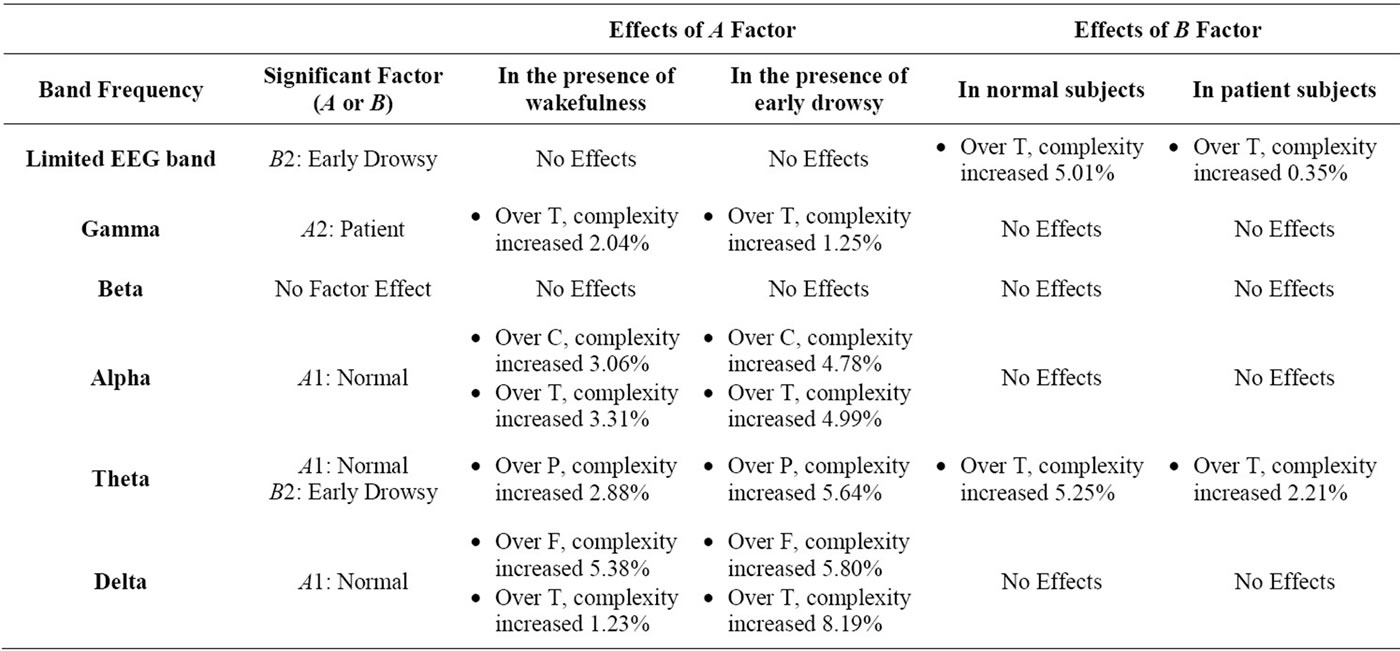
Table 7. The amount of complexity increasing rate (CIR) in all EEG band frequencies, during eye closing (F: Frontal, C: Central, T: Temporal, P: Parietal, O: Occipital).
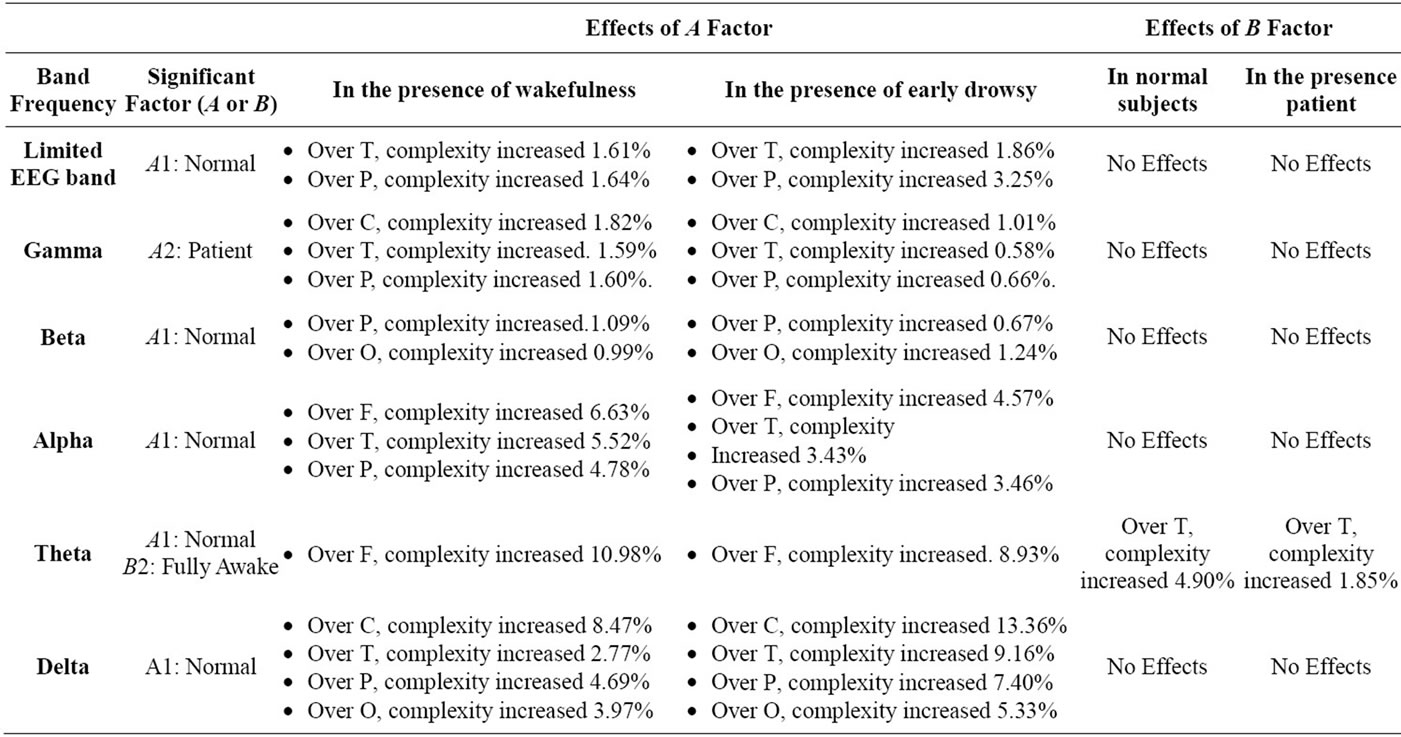
Table 8. The amount of complexity increasing rate (CIR) in all EEG band frequencies, during eye opening (F: Frontal, C: Central, T: Temporal, P: Parietal, O: Occipital).
as shown in Figures 3 and 4, respectively. Thus, to determine the optimal recording region and EEG band frequency for measure effects of interest in the normal state, we chose the condition exhibiting the maximum CIR in the presence of wakefulness state and in the presence of the early drowsy state respectively, as follows:
As shown in Tables 7 and 8, when the effects of the normal state were significant during eyes closing and opening respectively, in the presence of the wakefulness state, the maximum CIR was 10.98% over the frontal region in the theta band during eyes opening.
As shown in Tables 7 and 8, when the effects of the normal state were significant during eyes closing and opening respectively, in the presence of early drowsy state, the maximum CIR was 13.36% over the central region, in the delta band during eyes opening.
The results in the patient group indicated that patient status was significantly associated with a significant increase in the complexity of gamma band activity, during eyes closing and opening, over: temporal and (central, temporal, and parietal) regions, as shown in Figure 3(c) and Figures 4(b)-(d), respectively. To determine the optimal brain region for examining patients, we identified the maximum CIR in the presence of wakefulness state and in presence of early drowsy state respectively, as follows:
As shown in Tables 7 and 8, when the effects of patient-status were significant during eyes closing and opening respectively, in the presence of wakefulness state, the maximum CIR was 2.04% over temporal region during eye closure. As shown in Tables 7 and 8, when the effects of patient-status were significant during eyes closing and opening respectively, in the presence of the early drowsy state, the maximum CIR was 1.25% over the temporal region, during eye closure. The results indicated that patient-status was associated with greater complexity of gamma band activity over temporal region, regardless of the subject’s wakefulness state.
The results indicated that the early drowsy state was associated with greater complexity of activity in the presence of normal state and patient state in the limited EEG band and the theta band in a significant manner during eye closure over the temporal region only, as shown in Figure 3(c). To identify the optimal EEG band frequency for examining the early drowsy state, we determined the maximum CIR in normal subjects and in patients, as follows:
As shown in Table 7, when the effects of early drowsy state were significant, for normal subjects, the maximum CIR was 5.25% in the theta band. Table 7 also shows that, when the effects of the early drowsy state were significant in patients, the maximum CIR was 2.21% in the theta band. The results indicated that the early drowsy state in patient subjects did not increase the complexity of the limited EEG band signal or the theta band as much as in normal subjects over the temporal region during eyes closing. The results indicated that the fully awake state was associated with greater complexity of activity in the presence of normal state and patient state in theta band in a significant manner during eyes opening over the temporal region only, as shown in Figure 4(c). To identify the optimal EEG band frequency for examining the fully awake state, we determined the maximum CIR in normal subjects and in patients, as follows:
As shown in Table 8, when the effects of fully awake state were significant, for normal subjects, the maximum CIR was 4.90% in the theta band.
Table 8 also shows that, when the effects of the fully awake state were significant in patients, the maximum CIR was 1.85% in the theta band.
The results indicated that the fully awake state in patient subjects did not increase the complexity of the theta band as much as in normal subjects over the temporal region during eyes opening.
4. BILOGICAL VALIDATION OF THE RESULTS
4.1. Brain Regions and EEG Band Activities
Each region in human’s brain has particular functions that reflect some of physiological abilities, for example: frontal region is concerned with reasoning, planning, problem solving, as well as short term memory which is used to hold a small amount of information for a short periods of time. Central region is concerned with motor cortex which is used to manage complex movements and coordination. Parietal region is concerned with sensory perception including visual perception. Temporal region is concerned with languages, visual reception, behavior, long term memory which is used to hold information for a long period of time, as well as memory representation [21,22]. Occipital region is concerned with visual processing such as color recognition.
These abilities are not separated from the neural activities of different EEG bands, which reflect the synchronization of neural oscillatory assembles which thought to underlie the formation of cortical object representation [23]. An oscillatory component is defined by the presence of rhythmic activity. In EEG analysis domain, there are two assumptions about the dynamics of EEG signals: First assumption referred that limited EEG band signal represents the dynamics of the entire brain as a unified system and needs to be treated as a whole. Second assumption referred that limited EEG band is a signal that represents the effects of the superimposition of the diverse processes in the brain and hence, more neural details may be revealed when each sub band is analyzed separately. In the current study, both previous assumptions had been taken into consideration and hence, both limited EEG band signals and their sub bands had been analyzed by using ApEn during eyes opening/closing. Eye closure is an ideal environment than eye opening for interpreting any non linear physiological properties in EEG signals to limit the variables that may effect on those properties. So far, the influences of light on the whole dynamics of non linear properties in EEG band limited (when it is treated as a whole system without analyzing any sub bands) still unknown and hence, the interpretation of light effects on EEG band limited (as a whole system) during eyes opening could not be interpreted using complexity term. Hence, the complexity of limited EEG band signals during eyes opening will not be discussed in this study. To facilitate the task of understanding our results, a brief review about EEG sub bands is shown as below:
Gamma band activity is related to a variety of functions such as: memory and consciousness [24]. Moreover, gamma band activity has an important role in complex and large movement during eyes opening and visual interpretation [25,26]. Beta band activity is related to visual perception during a wakefulness state and associates with eyes opening. Alpha band activity associates with early drowsiness [12,27], and it has a regular activity in relaxed fully awake subjects and could be obtained during only continuous eyes closing. The activity of alpha band is greatly attenuated by eyes opening and early state of drowsiness [12,27,28]. In normal subjects, two types of theta activity have been described [29]. First, was referred to drowsiness. Second, was referred to the frontal midline theta and its role in arousal state [18]. Delta band activity in normal subjects is related to deep sleep stages (II, III, and IV), movement, as well as information transmission over frontal region during eyes opening, and it is usually considered abnormal in other circumstances [30, 31]. Usually, during eyes opening, the activity of theta band and delta bands is attenuated gradually by the light flux. Finally, in the current study, all the explanations of limited EEG band signals were related to the whole physiological dynamics of EEG over their location of their occurrence over the brain.
4.2. Biological Justification of the Primary Results
In this paper, we ignored all results that related to significant interactions between the two examined factors of interest (factor A and factor B). All the primary results, as shown in Table 6 were justified biologically during eyes opening/closing, as described below:
The functions of gamma band activity associates with its location over the brain. Our results indicated that the complexity of gamma band activity over temporal region during eyes closing was greater in patients than normal subjects. Whereas, during eyes opening our results indicated that the complexity of gamma band activity over central, temporal and parietal regions were greater in patients than normal subjects. These findings indicated that gamma band over those regions was instable, due to an increase in the unpredicted fluctuation (complexity) in gamma band rhythm, and that there were some effects of healthy status of the subjects on the main functions of gamma band over these regions. These effects were related to the functions of gamma band which were discussed in the previous sub Section 4.1. Posterior beta band activity relates to the function of posterior region of the brain (i.e., occipital and parietal regions). Our results indicated that the complexity of beta band activity over posterior region during eyes opening was greater in normal subjects than patient, as shown in Table 6 and Figures 4(d), (e). This finding indicates that beta band over posterior region was instable. Our result is consistent with result of another study which linked between the stability of beta band activity over this region and some neural disease like epilepsy [12].
Comparing the durations of several temporal patterns referred to as unclear significant patterns to the relative short periods of eyes opening/closing in our EEG data set, revealed that these types of patterns increased the unpredictable fluctuation, decreased the repetitive patterns, and hence increase the ApEn values in the EEG frequency bands associated with an increase with the non linear properties of EEG frequency bands. In general, these patterns are normal findings in normal subjects, they associate with alpha and theta bands and their duration were ranging from several seconds to several minutes depending on type of the pattern. Early drowsiness and fully awake states are often accompanied by such types of patterns.
During eye closure, when the effects of factor A (subject’s health-status) were significant, the complexity of alpha band was increased over all regions of the brain except parietal region. Alpha squeak patterns are considered one type of unclear significant patterns and associate with alpha band. Usually, alpha squeak accelerates the frequency of alpha band [12], and this acceleration leads to an alteration in the frequency which could make an increase in the extent of the unpredicted fluctuations over these regions. Usually, alpha squeak occurs immediately after closing the eyes, when the state of the subject is fully awake [12] as shown in Figures 3(a)-(c), (e). Whereas, during eyes opening alpha band was gradually attenuated by light flux and this situation could make an increase in the values of ApEn due to fluctuation, as shown in Figures 4(a)-(e).
Lambda wave is one of the most famous waves in theta rhythm. Lambda wave is a sharp transient wave occurred over the posterior region of the brain during eyes opening [12]. Usually, in normal subjects, lambda waves and theta waves exist together which could make an increase in irregularity and hence, an increase in the complexity. Lambda wave attenuates during eye closure, and this attenuation could make an increase in the unpredicted fluctuation over posterior region during eyes opening/closing due to its existence with theta band and hence, this fluctuation could make an increase in the complexity (irregularity) of posterior region, as shown in Figures 3 and 4. Moreover, during eyes opening, theta waves over central region are also attenuated gradually due to light effects which could make an increase in the complexity of theta band in normal subjects as shown in Figure 4(b). Correspondingly, the distribution of theta activity over frontal region is characterized by frontal midline theta activity, which associates with focus attention in normal subjects. Frontal midline theta activity is closely associated with normal subjects but it was attenuated gradually due to light flux, as shown in Figure 4(a).
Our results indicated that the complexity of delta band activity over all the regions of the brain except frontal region during eyes opening was greater in normal subjects than patient. These findings indicated that delta band over those regions was instable; due to an increase in the unpredicted fluctuation (complexity) in delta rhythm, and that there were some effects of healthy status of the subjects on the main functions of delta band over these regions. Our result is consistent with the results of another study which observed the role of delta band over frontal region during short term memory load process during eyes opening [33]. Hence, a stable presence of delta band over frontal region is quite important for short term memory process [33].
Another study found that memory load process was limited by eye closure [34], and hence, activity of delta band during eye closure would be limited accordingly [34]. Moreover, if the activity of delta band over frontal region is instable, this will lead to produce abnormal patterns called FIRDA (frontal intermittent rhythmic delta activity) which is considered one of the signs of most neural diseases [12]. Whereas, during eyes closing, the complexity of delta band over frontal and temporal regions was greater in normal subjects than patient. These findings indicated that delta band over those regions was instable. Our result is consistent with the result of another study which could reveal the relationship between stable delta band activity over frontal and temporal regions and some neural diseases like brain disorder (e.g., dementia with Lewy bodies, Alzheimer and epilepsy) [12,35].
On the other hand, when the effects of factor B (subject’s wakefulness state) were significant, several neurophysiological changes appeared and the level of wakefulness tended to fluctuate. Usually, when the early state of drowsiness starts, the cortex over particular regions becomes inactive, and this stage enhances as the person goes through from (sleep stage I) to the next sleep stages. Hence, in early state of drowsiness, all the neural activates which associate with body movement, attention, and languages, will also be inactive [12,18]. Most of the neural structures that thought to be responsible for those abilities are located over central and temporal regions [12,18], and hence, the extent of unpredicted fluctuation (i.e., complexity, or instability) in all the neural bands over those regions will be increased accordingly. These facts are consistent with our results which indicated that the complexity of limited EEG band signals over central and temporal regions were greater during early state of drowsiness than during fully awake state. These findings indicated that limited EEG band signals over those regions were instable and hence, early state of drowsiness could make an increase in the complexity of limited EEG band over those regions.
In normal subjects, early state of the drowsiness can be considered as a transitional state from wakefulness to the fully asleep state. During this transition, the frequency of alpha band typically exhibits a gradual decrease, with activity reducing to 2 - 7 Hz as the person falls into deep sleep. Due to frequency alternations during the early drowsy state in normal subjects, the extent of unpredictable fluctuations of alpha and theta bands over occipital region were instable, and that there were some effects of early state of drowsiness of the subjects on those bands over occipital region during eye closure as shown in Figure 3(e). Moreover, when the effects of early state of drowsiness were significant, one type of unclear significant patterns appeared with alpha band activity, which is called: rhythmic mid-temporal theta burst of drowsiness (RMTD) patterns, which are best seen over temporal region during eye closure [12].
It could be noticed also from Table 6 and Figures 3(a), (e), our results indicated that the complexity of alpha band activity over frontal and occipital regions in normal subjects was greater in early drowsy state than wakefulness state during eye closure. Our results are consistent with results of Cantero et al. [36], who observed a significant decrease in alpha band activity over frontal and occipital region on the moment of drowsiness onset during eyes closing. Cantero et al. [36] suggested that alpha band activity over frontal and occipital regions could be used as an index to detect subject’s wakefulness state. As stated before, due to fully awake state and light flux effects, theta band was attenuated gradually which could make an increase in the complexity of theta band over all regions on the brain except frontal region (for one reason as described below), as shown in Figures 4(b)-(e). Usually, over temporal region, this gradual attenuation of theta activity is accompanied by one type of unclear significant patterns, which is called: sub clinical rhythm electrographic discharge in adults (SREDA), which are best seen during relaxed fully awake state during eyes opening over temporal region [12,37]. Here, it should be noticed two important things: first, the complexity of theta band over temporal region during eyes opening when fully awake state was significant stemmed from two sources which they were: light flux source and SREDA patterns source. This fact is consistent with our results which indicate that the complexity of theta band over temporal region is greater in normal subjects than patients when fully awake state effect was significant. Second, as stated before, in normal subjects, the complexity of theta band over frontal region was associated with frontal midline theta activity. Hence, there was no any significant effect of subject’s wakefulness state on theta activity over frontal region. Moreover, frontal midline theta activity will be further discussed in next sub Section 4.3.
4.3. Biological Validation of the Maximum Complexity Increasing Rate Results
At the intracellular level, gamma oscillations have been shown to occur with depolarization of cells [38-42]. During wakefulness cortical neurons become relatively depolarized and cells show a burst firing pattern with an intraburst frequency of 200 - 400 Hz and a recurrence rate of 30 - 40 Hz [41,42]. Any cognition task associates with an increase of depolarization process in cells, but those tasks are not the only factors are influencing on the state of cell depolarization [43].
However, it can be noticed from all the previous studies that particular association was found between gamma band and depolarization process. On the other hand, other studies have shown that gamma band activity could be modulated by a variety of processes such as arousal, languages, object recognition, and long term memory [24, 26,44,45]. Therefore, gamma band activity is assumed to reflect the most of cognition tasks [46]. Neurons in the brain can be connected to each other either via very strong or rather weak connections. These connections among the neurons constitute the basis of human memory. Usually neural signals among those connections are regularly bidirectional and increases whenever the brain perceives a known object in case when the object recognition task is required. This mechanism leads to an increase in gamma band activity than it is for case of unknown objects for which no such activity or weak activity occurs due to the missing memory representations [47,48]. This match and utilization model (MUM) is mainly based on perceptual forms of memory. MUM offers the advantage to explain many findings of stronger or weaker gamma activity observed in various experimental conditions especially in memory representation [49-51]. Several studies have shown that words induce higher gamma band activity than pseudo words [52], and in identifiable objects more than random dot patterns [53]. Because memory representations exist for words and objects, but not for pseudo words and dot patterns, the former ones lead to more gamma activity than later ones. It was demonstrated that memory and cognitive activity is characteristic for certain pathological conditions such as dementia, epilepsy, Alzheimer, schizophrenia, and other cerebrovascular diseases (e.g., autism, Williams syndromes, migraine, brain stroke, hyperkinetic, and hallucinations) [46]. Moreover, invasive recordings in the temporal lobe of patients have revealed a close association between gamma band over temporal region and memory [54].
Arousal level closely related to gamma band activity, and it reflects a fundamental property of human behavior and, partly, is associated with ability to process the information [12,18,46]. In general, the lowest end of the arousal level is drowsiness state, and the opposite extreme end is fully awake state in normal and patient subjects. Hence, the level of arousal state during early state of drowsiness in patient subjects is less than during fully awake state in patient subjects. This means that gamma band activity during early state of drowsiness is less than during fully awake state in patient subjects and hence, its oscillation within drowsy state will be instable and irregular comparing with fully awake state, which leads to an increase in r parameter of ApEn, because the standard deviation of the signal will increase accordingly (i.e., r = a. STD(S)). As the value of r parameter increases, the variability in the tested activity of EEG sub band decreases continually for the corresponding dimension m [16]. Hence, ApEn values of gamma band over temporal region were decreased in the presence of early state of drowsiness comparing with fully awake state when patient state was significant during eye closure.
On the other hand, in normal subjects, maximum CIR could be obtained also in theta band over temporal region, when early state of drowsiness and fully awake state were significant during eyes-closed and eyes-opened respectively. As stated before, early state of drowsiness is often accompanied by RMTD waves, and their frequencies are ranging from 5 to 7 Hz. RMTD patterns are characterized by their arch shaped and notched waves. These notches may give the waves a somewhat shapely contoured appearance [12]. RMTD patterns in normal subjects are characterized by their gradual onset and attenuation, which increases the complexity. Whereas, in patient subjects, RMTD patterns could not be recognized due to its similarity with the EEG patterns of the patients [55,56]. Hence, RMTD in patient subjects does not increase the unpredictable fluctuation, and hence ApEn values decreases in patient subjects comparing with normal about 3.04% (5.25% – 2.21% = 3.04%). Correspondingly, during eyes opening, theta band activity over temporal region is accompanied by SREDA waves, which their frequencies ranging from 5 to 7 Hz. SREDA patterns are mostly seen during, relax fully awake state and are characterized by their sharply contoured, arch form and are flat topped [57]. SREDA patterns are closely similar to patient patterns and sometimes SREDA leads to misdiagnose [12]. Hence, ApEn values decreases in patient subjects comparing with normal about 3.05% (4.9% – 1.85% = 3.05%). Moreover, during eyes opening, the frequency of theta band was increased, and hence, the extent of unpredictable fluctuations in theta activity was increased accordingly. All of the previous facts could make an increase in CIR of theta band over temporal region during eyes opening/closing regardless to subject’s health status.
Recent studies have implicated the anterior cingulated cortex (ACC) as a potential generator of frontal midline theta activity [58,59]. Other studies reported that either medial prefrontal cortex (PFC) or dorsolateral prefrontal regions (DL-PFC) is the source of frontal midline theta activity [58,60]. ACC activation was often accompanied by any activation process in frontal region particularly in DL-PFC [61,62]. Other studies reported direct and indirect evidence for a tight coupling between neuronal activity and energy metabolism [62,63]. These studies are consistent with another study which observed that neural activity is closely associated with glucose utilization because glucose utilization reflects synaptic (i.e., particularly pre-synaptic) activity [64]. A significant association was observed between theta band activity in ACC, which is located over frontal region and metabolism activity as well as between theta band activity in ACC and DL-PFC [62]. Hence, it could be noticed here, that theta band activity is closely associated with frontal region throughout its connection with ACC and DL-PFC in normal subjects due to metabolism activity.
Another study observed that frontal midline theta activity is closely associated to concentration, arousal and attention during eyes opening, by measuring frontal midline theta activity during playing preferred video games [65]. Whereas, when the same experiment was done to another group of subjects during watching uninterested and boring animations, the extent of frontal midline theta activity was observed to be decreased significantly [65]. It could be noticed here; frontal midline theta activity was attenuated during eyes opening in normal relaxed subjects and closely associated with arousal level (focused attention) of the subjects. It is well known that the level of arousal during drowsiness is less than fully awake state (i.e., the activity of frontal midline theta during drowsiness is less than fully awake state) and hence, frontal midline theta oscillations within drowsy state will be instable and irregular comparing with fully awake state which can make an increase in r parameter and decreased in ApEn values. Moreover, frontal midline theta activity is accompanied by special types of unclear significant patterns which are called: Ciganek patterns, which are best seen during resting wakefulness state over frontal region, their frequencies are ranging from 4 to 7 Hz and they are characterized by their sinusoidal shape [12]. All of the previous factors and facts could make an increase in CIR of theta band over frontal region in presence of fully awake state more than early drowsiness about 2.05%. (10.98% – 8.93% = 2.05%).
All the types of movements are usually controlled by the motor cortex which is located over the central region over the brain [12]. Some studies reported a direct evidence for a tight coupling between delta band activity and movement [66,67]. These studies are consistent with another study which suggested that delta band activity is important for normal functioning of both the brain and peripheral organs [68]. During early state of drowsiness most of peripheral activities tends to be inactive and hence, a reduction in delta band over central region is expected. In addition to that, during eyes opening, delta band activity becomes instable, and this will lead to an increase in the complexity of delta band during early state of drowsiness more than fully awake state. All of the previous circumstances could make an increase in CIR of delta band over central region in presence of early state of drowsiness more than fully awake state about 4.89% (13.36% – 8.47% = 4.89%).
5. DISCUSSION
5.1. Complexity Increasing Rate (CIR)
The percentages of CIR values were calculated for all regions where there were no significant interactions between the factors of interest, and where the effects of the factors of interest were not in the same regions. For example, during eyes closing, factor A (subject’s healthstatus) was found to affect the complexity of alpha band activity. Normal subjects exhibited an increase in the complexity of alpha band activity over all regions except the parietal region, as shown in Figures 3(a)-(c), (e) and Table 6. At the same time, factor B (subject’s wakefulness state) was found to affect the complexity of frontal and occipital regions. The results also indicated that early drowsy state could make an increase in the complexity of alpha band over these two regions.
This finding suggests that the complexity of alpha band activity over frontal and occipital regions was affected by the sum of the effects of both factors A and B, because there was no significant interaction in those two regions, and, at the same time, both factors exhibited significant effects. As such, we were unable to determine how much each factor could increase in the complexity of alpha band to be able to calculate the CIR values.
The dependent variable (ApEn values) was calculated for all EEG band frequencies. These data were decomposed from eyes-closed and eyes-opened periods using DWT.
The average of ApEn that related to all EEG frequency bands for three trials of relative short period of eyes opening/closing over each electrode’s signal per group of subjects was calculated. The second average was calculated from the first average over multiple electrodes that corresponded to a particular region out of five regions in the brain. By taking the averages twice, we were able to eliminate differences that might have existed in the sequence of repetitive eyes opening and closing, and differences that might have existed among the electrodes that corresponded to a particular region. Thus, the effects of the two factors of interest: subject’s health-status and subject’s wakefulness state were tested on the second average of ApEn values using two-way ANOVA, for each region in the brain.
After determining the main effects on the complexity for each EEG band for each region, we calculated the third average of the ApEn values for all the EEG subbands across all subjects per each group. By calculating the third average, we were able to eliminate differences among subjects within each group. This averaging was also performed because we sought to test the magnitude of the significant factor’s effect on the complexity of each particular EEG sub-band in the presence of the second factor (i.e., the non significant factor’s effect) during eyes opening and closing.
This test was performed by calculating the magnitude of the CIR (as a percentage) for all significant effects for each factor without an interaction. Repetitive eyes opening and closing during the early drowsy state in normal subjects is typically similar to the wakefulness state. Moreover, the early drowsy state and fully awake is often accompanied by unclear significant patterns, and hence, unpredictable fluctuations in the EEG frequency bands are also increased.
To reflect such situations, maximum CIR rather than minimum CIR was chosen as a tool for complexity evaluation of the significant factor’s effects in the presence of the second factor (the non significant factor’s effect). It could be noticed from the obtained results in CIR as shown in Tables 7 and 8 that normal state exhibited more CIR in theta band activity and delta band activity during eyes opening over frontal and central regions respectively. Correspondingly, patient state exhibited more CIR in gamma band activity over temporal region during eye closure. Moreover, it could be noticed that fully awake state and early drowsy state exhibited more CIR in theta band activity over temporal region during eyes opening and eyes closing respectively. All of the previous results were related to maximum CIR, as shown in Tables 7 and 8.
5.2. Subject’s Health Status Detection
In the current study, we could use the results of our EEG data set as an index to the subject’s health status, as demonstrated below:
During eyes opening/closing gamma band activity over temporal can be used to detect several pathological conditions (e.g., epilepsy, schizophrenia, dementia, and Alzheimer), regardless of subject’s wakefulness state.
Beta band activities are associated with eyes opening and are common over posterior region of the brain. Other studies have mentioned that large amount of beta band activity over this region would be considered abnormal and leads to several neural diseases like epilepsy [12].
Our results indicated that the complexity of alpha band was increased significantly in normal subjects, on the moment of eyes closing due to alpha squeak which could be used as an index to subject’s health status. Moreover, in patient subjects, the onset of early drowsiness is quite poorly defined comparing with normal subjects.
Lambda waves are best seen over posterior region only during eyes opening in normal subjects together with theta band, and could be considered abnormal in other circumstances. Frontal midline theta activity is closely associated with normal subjects throughout its relationship with metabolism process and arousal level. Hence, frontal midline theta activity could be used as a good indication for the subject’s healthy status regardless of subject’s wakefulness state.
Delta band activity over frontal region during eyes opening only plays an important role in normal subjects by transmitting the information from and to short term memory, and its instability over this region can be considered abnormal sign, and leads to cognition impairment like dementia and Alzheimer. On the other hand, during eye closure, delta band activity over temporal and frontal regions associates with some of neural diseases [12,35]. Moreover, our results could reveal the role of delta band and its association with the peripheral movements in normal subjects from complexity perspective. Hence, delta band over central region during eyes opening could be used as an index to subject’s health status.
On the other hand, when the effects of early state of drowsiness and fully awake state were significant during eyes closing and eyes opening respectively, those states could make an effect on the complexity of theta band in normal subjects more than patients by around 2.4 times (5.25%/2.21% ≈ 2.4), and 2.6 times (4.9%/1.85% ≈ 2.6), during eyes-closed and eyes-opened state respectively, as shown in Tables 7 and 8.
5.3. Limitations of the Study
This study involved two major limitations, which should be addressed in the future research. First, the relationship between the observed effects and the age of the subjects should be investigated, since the average age of the patient group was higher than that of healthy group, as shown in Table 1. Second, for the present method suggested to be applied in diagnosis, a value of parameter r in ApEn estimation should be calculated for all possible values of standard deviation from 0.1 to 0.25, as discussed in sub Section 2.3.
6. CONCLUSIONS
The present results tested the ability of ApEn to detect the early drowsy/fully awake state, and distinguish normal/patient status based on the complexity of EEG band frequencies over five different brain regions, based on three trials of the eyes opening and closing task. This detection was performed by applying ApEn to the limited EEG band and its sub-bands, which were decomposed from EEG using DWT during the repetitive states of eyes opening/closing in each of five regions. Depending on whether the early drowsy state could be characterized by the appearance of the alpha rhythm, and associated with a decrease of its frequency to 2 - 7 Hz, we were able to estimate r by choosing a = 0.15 of the standard deviation of our original data signal, and m = 2 values as an input parameter for ApEn. The average of ApEn was calculated three times: first, across the eyes-closed periods and eyes-opened periods for each electrode; second, for the first average of ApEn values related to multiple electrodes that corresponded to particular region, during eyesclosed and eyes-open periods respectively; third, the average of all ApEn values, for all EEG sub-bands, across all the subjects in each group, was calculated. Two-way ANOVA was applied to the second average of ApEn values to test the effects of the two factors: the subject’s health-status and wakefulness state. After determining the significant factor’s effect on the complexity of EEG band frequencies using two-way ANOVA, we tested the magnitude of this effect under the presence of the second factor using the third average. The maximum CIR was used as an indicator of the optimal conditions for distinguishing normal/patients subjects and the early drowsy/ fully awake state, depending on several facts that indicate normal subjects, early drowsy state and wakefulness in repetitive short period of eyes opening/closing could make an increase in the complexity of EEG band frequencies. Further research is required to improve the detection of early drowsy state/wakefulness as well as distinguishing normal subjects and patients using other non linear techniques as dependent variables. The study of other non linear properties in the brain will help to elucidate other characteristic features of EEG signals.
REFERENCES
- Mayer, G. and Layne, S.P. (1987) Perspectives in biological dynamics and theoretical medicine. New York Academy of Sciences, 54, 62-87.
- Acharya, R., Faust, O., Kannathal, N., Tjileng, C. and Laxminarayan, S. (2005) Non linear analysis of EEG signals at various sleep stages. Computer Methods and Programs in Biomedicine, 80, 37-45. doi:10.1016/j.cmpb.2005.06.011
- Vavadi, H., Ayatollahi, A. and Mirzaei, A. (2010) A wavelet approximate entropy method for epileptic activity detection from EEG and its sub-bands. Journal of Biomedical Science and Engineering, 3, 1182-1189. doi:10.4236/jbise.2010.312154
- Ocak, H. (2009) Automatic detection of epileptic seizures in EEG using discrete wavelet transform and approximate entropy. Elsevier Journal of Expert Systems with Applications, 36, 2027-2036. doi:10.1016/j.eswa.2007.12.065
- Abasolo, D., Hornero, R., Espino and Poza, J. (2005) Analysis of regularity in the EEG background activity of Alzheimer disease patients with approximate entropy. International Federation of Clinical Neurophysiology, 116, 1826-1834. doi:10.1016/j.clinph.2005.04.001
- Hu, Z. and Shi, P. (2006) Regularity and complexity of human dynamics. Proceedings of the Pattern Recognition ICPR, Hong Kong, 20-24 August 2006, 245-248. doi:10.1109/ICPR.2006.990
- Sabeti, M., Katebi, S. and Boostani, R. (2009) Entropy and complexity measures for EEG signal classification of schizophrenia and control participants. Elsevier Journal of Artificial Intelligence in medicine, 47, 263-274.
- Bhattacharya, J. (2000) Complexity analysis of spontaneous EEG. Journal of Neurobiology, 60, 495-501.
- Fukami, T., Shimada, F., Ishikawa, B. and Saito, Y. (2011) Quantitative evaluation of eye opening and closure with time variation in routine EEG examination. International Journal of Innovative Computing, Information and Control, 7, 5529-5540.
- Burioka, N., Miyata, M., Suyama, H., Endo, M., Shimizu, E., Cornélissen, G., Takeshima, T., Nomura, T. and Nakashima, K. (2005) Approximate entropy in the electroencephalogram during wake and sleep. Journal of Clinical EEG Neuroscience, 36, 21-24. doi:10.1097/WNP.0b013e3181eaa9f5
- Fan, W. and Liu, X. (2003) Characteristic of childrens’ EEG complexity at different ages and in different states. Journal of Peking University, 35, 462-465.
- Schomer, D. and Lopes da silva, F. (2011) Niedermeyer’s Electroencephalography: Basic principals, clinical applications, and related fields. 6th Edition, Lippincott Williams and Wilkins, Hagerstown.
- Rechtshaffen, A. and Kales, A. (1968) A manual of standardized terminology techniques and scoring system for sleep stages of human subjects. UCLA Brain Information Service/Brain Research Institute, Los Angeles.
- Adeli, H., Dastidar, S. and Dadmeher, A. (2007) A waveletchaos methodology for analysis of EEGs and EEG sub-bands to detect seizure and epilepsy. IEEE Transactions on Biomedical Engineering, 54, 205-211. doi:10.1109/TBME.2006.886855
- Hornero, R., Abasolo, D., Mc., J. and Goldstein, B. (2005) Interpretation of approximate entropy: Analysis of Intracranial pressure approximate entropy during acute intracranial hypertension. IEEE Transactions on Biomedical Engineering, 52, 1671-1679. doi:10.1109/TBME.2005.855722
- Yan, R. and Gao, R. (2007) Approximate Entropy as a diagnostic tool for machine health monitoring. Elsevier Journal of Mechanical Systems and Signal Processing, 21, 824-839. doi:10.1016/j.ymssp.2006.02.009
- Pincus, S.M. (2001) Assessing serial irregularity and its implications for health. Annals New York Academy of Sciences, 954, 245-267. doi:10.1111/j.1749-6632.2001.tb02755.x
- John, C., Louis, T. and Gary, B. (2007) Hand book of physiology. 3rd Edition, Cambridge University Press, Cambridge.
- Pincus, S. and Keefe, D. (1992) Quantification of hormone pulsatility via an approximate entropy algorithm. American Journal of Physiology, 262, 471-754.
- Tanoue, N., Atsuta, M. and Matsumura, H. (2003) Properties of a new photo-activated composite polymerized with three different laboratory photo-curing units. Journal of Rehabilitation, 30, 832-836. doi:10.1046/j.1365-2842.2003.01142.x
- Mayes, A., Montaldi, D. and Migo, E. (2007) Associative memory and medial temporal lobes. Journal of Trends in Cognitive Science, 11, 126-135. doi:10.1016/j.tics.2006.12.003
- Barense, M., Gaffan, D. and Graham, K. (2007) The human medial temporal lobe processes online representations of complex objects. Journal of Neurophysiologia, 45, 2963-2974
- Engel, A. and Singer, W. (2001) Temporal binding and the neural correlates of sensory. Journal of Trends Cognition Science, 5, 16-25. doi:10.1016/S1364-6613(00)01568-0
- Maria, R., Raham, B., Williams, J. and Kaiser, J. (2011) Human gamma band activity and behavior. International Journal of Psychophysiology, 79, 39-48. doi:10.1016/j.ijpsycho.2010.08.010
- Muthukumaraswamy, S. (2010) Functional properties of human primary motor cortex gamma oscillations. Journal of Neurophysiology, 5, 2873-2885. doi:10.1152/jn.00607.2010
- Dobel, C., Junghöfer, J. and Gruber, T. (2011) The role of gamma band activity in the representation of faces: Reduced activity in the fusiform face area in congenital prosopagnosia. Journal of PloS One, 6, 1-6.
- Cantero, J., Atienza, M., Salas, R. and Gomez, C. (1999) Alpha EEG coherence in different brain states: An electrophysiological index of the arousal level in human subjects. Journal of Neuroscience Letters, 271, 167-170. doi:10.1016/S0304-3940(99)00565-0
- Casioppo, J., Tassinary, L. and Berntoson, G. (2007) Handbook of psychophysiology. 3rd Edition, Cambridge University Press, Cambridge.
- Schacter, L. (1977) EEG theta waves and psychological phenomena: A review and analysis. Journal of Biological Psychology, 5, 47-82. doi:10.1016/0301-0511(77)90028-X
- Hirsch, L. and Brenner, R. (2010) Atlas of EEG in critical care. Wiley Blackwell, Oxford. doi:10.1002/9780470746707
- Adeli, H., Dastider, S. and Dadmehr, N. (2010) Automated EEG-based diagnosis of neurological disorder: Inventing the future of neurology. Taylor and Francis Group, London. doi:10.1201/9781439815328
- Evans, C. (2003) Spontaneous excitation of the visual cortex and association areas-Lambda waves. Journal of Electroencephalography and Clinical Neurophysiology, 5, 69-74. doi:10.1016/0013-4694(53)90054-6
- Zarjam, P., Epps, J. and Chen, F. (2011) Characterizing working memory load using EEG delta activity. Proceedings of the 19th European Signal Processing Conference EUSIPCO 2011, Barcelona, 29 August 2011-2 September 2011, 1554-1558.
- Vredeveldt, A., Hitch, G.. and Baddeley, A. (2011) Eyeclosure helps memory by reducing cognitive load and enhancing visualization. Journal of Memory Cognition, 39, 1253-1263. doi: 10.3758/s13421-011-0098-8
- John, L., Geyer, J. and Carney, P. (2010) Reading EEGs: A practical approach. Lippincott Williams and Wilkins, Philadelphia.
- Cantero, J., Atienza, M., Salas, R. and Gomez, C. (1999) Alpha EEG coherence in different brain states: An electroensephalogical index of the arousal level in human subjects. Elsevier Journal of Neuroscience Letters, 271, 167-170.
- Begum, T., Ikeda, A., Takahashi, J., Tomimoto, H., Shimohama, S., Satow, T., Nagamine, T., Fukuyama, H. and Shibasaki, H. (2006) Clinical outcome of patients with SREDA (Subclinical Rhythmic EEG Discharge of Adults). Journal of Internal Medicine, 45, 141-144. doi:10.2169/internalmedicine.45.1479
- Bragin, A., Jando, G., Nadasdy, Z., Hetke J., Wise, K. and Buzsaki, G. (1995) Gamma (40 - 100 Hz) oscillation in the hippocampus of the behaving rat. Journal of Neuroscience, 15, 47-60.
- Llinas, R., Grace, A. and Yarom, Y. (1991) In vitro neurons in mammalian cortical layer 4 exhibit intrinsic oscillatory activity in the 10- to 50-Hz frequency range. Proceedings of National Academy of Sciences USA, 88, 897- 901. doi:10.1073/pnas.88.3.897
- Penttonen, M., Kamondi, A., Acsady, L. and Buzsaki, G. (1998) Gamma frequency oscillation in the hippocampus of the rat: Intracellular analysis in vivo. European Journal of Neuroscience, 10, 718-728. doi:10.1046/j.1460-9568.1998.00096.x
- Steriade, M. and Amzica, F. (1996) Intra-cortical and corticothalamic coherency of fast spontaneous oscillations. Proceedings of National Academy of Sciences USA, 93, 2533-2538. doi:10.1073/pnas.93.6.2533
- Steriade, M., Amzica, F. and Contreras, D. (1996) Synchronization of fast (30 - 40 Hz) spontaneous cortical rhythms during brain activation. Journal of Neuroscience, 16, 392-417.
- Gross, D. and Gotman, J. (1999) Correlation of high frequency oscillations with sleep wake cycles and cognitive activity in humans. Elsevier Journal of Neuroscience, 94, 1005-1018.
- Yordanova, J., Banaschewski, T., Kolev, V., Woerner, W. and Rothenberger, A. (2001) Abnormal early stages of task stimulus processing in children with attention-deficit hyperactivity disorder-evidence from event-related gamma oscillations. Journal of Clinical Neurophysiology, 108, 1096-1098. doi:10.1016/S1388-2457(01)00524-7
- Tiitinen, H., Sinkkonen, J., Reinikainen, K., Alho, K., Lavikainen, J. and Naatanen, R. (1993) Selective attention enhances the auditory 40 Hz transient response in humans. Journal of Nature, 364, 59-60. doi:10.1038/364059a0
- Herrman, C. and Demiralp, T. (2005) Human EEG gamma oscillations in neuropsychiatric disorders. Elsevier Journal of Clinical Neurophysiology, 116, 2719-2733.
- Herrmann, C., Munk, M. and Engel, A. (2004) Cognitive functions of gamma activity: Memory match and utilization. Journal of Trends Cognition Science, 8, 347-355. doi:10.1016/j.tics.2004.06.006
- Herrmann, C., Lenz, D., Junge, S., Busch, N. and Maess, B. (2004) Memory-matches evoke human gamma responses. Journal of BMC Neuroscience, 5, 1-8. doi:10.1186/1471-2202-5-13
- Tallon, C., Bertrand, O., Peronnet, F. and Pernier, J. (1998) Induced gamma-band activity during the delay of a visual short-term memory task in humans. Journal of Neuroscience, 18, 4244-4254.
- Gruber, T., Muller, M. and Keil, A. (2002) Modulation of induced gamma band responses in a perceptual learning task in the human EEG. Journal of Cognition Neuroscience, 14, 732-744. doi:10.1162/08989290260138636
- Kaiser, J., Ripper, B., Birbaumer, N. and Lutzenberger, W. (2003) Dynamics of gamma band activity in human magneto encephalogram during auditory pattern. Journal of Neuroimage, 20, 816-827. doi:10.1016/S1053-8119(03)00350-1
- Pulvermuller, F., Lutzenberger, W., Preissl, H. and Birbaumer, N. (1995) Spectral responses in the gamma band physiological signs of higher cognition. Journal of Neuroreport, 6, 2059-2064.
- Revonsuo, A., Wilenius, M., Kuusela, J. and Lehto, M. (1997) The neural generation of a unified illusion in human vision. Journal of Neuroreport, 8, 3867-3870. doi:10.1097/00001756-199712220-00006
- Fell, J., Klaver, P., Lehnertz, K., Grunwald, T., Schaller, C., Elger, C. and Fernández, G. (2001) Human memory formation is accompanied by rhinalhippocampal coupling and decoupling. Journal of Nature Neuroscience, 4, 1259- 1264. doi: 10.1038/nn759
- Winesett, S. and Benbadis, S. (2008) Which electroencephalogram patterns are commonly misread as epileptiform? Journal of Neurology, 4, 101-104.
- Lipman, I. and Hughes, J. (1969) Rhythmic midtemporal discharge: An electro-clinical study. Journal of Electroencephalogr Clinical Neurophysiology, 27, 43-47. doi:10.1016/0013-4694(69)90107-2
- Westmoreland, B. and Klass, D. (1981) A distinctive rhythmic EEG discharge of adults. Journal of Electroencephalogy Clinical Neurophysiology, 51, 186-191. doi:10.1016/0013-4694(81)90008-0
- Asada, H., Fukuda, Y., Tsunoda, S., Yamaguchi, M. and Tonoike, M. (1999). Frontal midline theta rhythms reflect alternative activation of prefrontal cortex and anterior cingulate cortex in humans. Journal of Neuroscience Letters, 274, 29-32.
- Luu, P., Tucker, M., Derryberry, D., Reed, M. and Poulsen, C. (2003) Electrophysiological responses to errors and feedback in the process of action regulation. Psychological Science, 14, 47-53. doi:10.1111/1467-9280.01417
- [61] Sasaki, K., Nambu, A., Tsujimoto, T., Matsuzaki, R., Kyuhou, S. and Gemba, H. (1996) Studies on integrative functions of the human frontal association cortex with MEG. Journal of Cognitive Brain Research, 5, 165-174. doi:10.1016/S0926-6410(96)00053-5
- [62] Barbas, H. (1992) Architecture and cortical connections of the prefrontal cortex in the rhesus monkey. Journal of Advances in Neurology, 57, 91-115.
- [63] Pizzagalli, A., Oakes, R. and Davidson, J. (2003) Coupling of theta activity and glucose metabolism in the human rostral anterior cingulated cortex: An EEG/PET study of normal and depressed subjects. Journal of Psychophysiology, 40, 939-949. doi:10.1111/1469-8986.00112
- [64] Phelps, E., Mazziotta, C., Kuhl, E., Nuwer, M., Packwood, J., Metter, J. and Engel, Jr. (1981) Tomographic mapping of human cerebral metabolism visual stimulation and deprivation. Journal of Neurology, 31, 517-529.
- [65] Jueptner, M. and Weiller, C. (1995). Review: Does measurement of regional cerebral blood flow reflect synaptic activity? Implications for PET and fMRI. Journal of NeuroImage, 2, 148-156. doi:10.1006/nimg.1995.1017
- [66] Yamada, F. (1998) Frontal midline theta rhythm and eye blinking activity during a VDT task and video game: Useful tools for psychophysiology in ergonomics. Journal of Ergonomics, 41, 678-688. doi:10.1080/001401398186847
- [67] Vuckovic, A. and Sepulveda, F. (2008) Delta band contribution in cue based single trial classification of real and imaginary wrist movement. Journal of Medical Bio Engineering, 46, 529-539.
- [68] Yu, F., Yan, C., Tao, Z., Yan, P., Shao, T. and Yan, M. (2008) Delta EEG activity in left orbitofrontal cortex in rats related to food reward and craving. Journal of Zoological, 3, 260-264.
- [69] Knyazev, G. (2011) EEG delta oscillations as a correlate of basic homeostatic and motivational processes. Journal of Neuroscience and Bio-Behavioral Reviews, in press. doi:10.1016/j.neubiorev.2011.10.002