Journal of Cancer Therapy
Vol.5 No.1(2014), Article ID:41710,9 pages DOI:10.4236/jct.2014.51006
The Acute Physiological Effects of the Vaso-Active Drug, L-NNA, a Nitric Oxide Synthase Inhibitor, on Renal and Tumour Perfusion in Human Subjects
1Cancer Centre, Mount Vernon Hospital, Northwood, UK; 2Paul Strickland Scanner Centre, Mount Vernon Hospital, Northwood, UK; 3Division of Imaging Sciences and Biomedical Engineering, King’s College London and Department of Radiology, Guy’s and St Thomas’ Hospital, London, UK; 4Department of Pscyhology, University of Hertfordshire, College Lane, Hertfordshire, UK; 5The Royal Brompton & Harefield NHS Foundation Trust, Harefield, UK; 6Cancer Research UK Formulation Unit, Strathclyde Institute of Pharmacy and Biomedical Sciences, University of Strathclyde, Glasgow, UK.
Email: Vicky.goh@kcl.ac.uk
Received October 2nd, 2013; revised November 2nd, 2013; accepted November 10th, 2013
ABSTRACT
Purpose: To assess the baseline variation in global renal and tumour blood flow, blood volume and extraction fraction, and changes in these parameters related to the acute physiological effects of a single dose of a non selective inhibitor of nitric oxide synthase, L-NNA. Materials & Methods: Ethical approval and informed consent were obtained for this Phase I clinical study. Patients with advanced solid tumours refractory to conventional therapy were recruited and given L-NNA intravenously at two different dose levels. Volumetric perfusion CT scans were carried out at 1, 24, 48 & 72 hours post L-NNA. Blood pressures were taken at regular interval for 6 hours after LNNA. Results: L-NNA was well tolerated by the four patients who received it. Blood flow (BF) and blood volume (BV) in both tumour and kidney were reduced post L-NNA administration (renal BF—20%; renal BV— 19.7%; tumour BF—16.9%; tumour BV—18.6%), though the effect was more sustained in tumour vasculature. A negative correlation was found between the change in systemic blood pressure and vascular supply to the tumour within 1 hour following L-NNA (p < 0.0001). Differences in response to L-NNA by separate target lesions in the same patient were observed. Conclusion: The differential effect of L-NNA on tumour and renal blood flow, and the absence of any significant toxicity in this small cohort of patients permit further dose escalation of L-NNA in future early phase trials. The predictive value of blood pressure change in relation to the acute effect of L-NNA on tumour vasculature deserves further evaluation.
Keywords:L-NNA; Cancer; Imaging; Vascular; Perfusion; Nitric Oxide
1. Introduction
Nitric oxide (NO) is involved in the regulation of a wide range of physiological processes such as blood flow, neurotransmission, cell migration and immune responses. It is also implicated in the development and progression of cancer by mediating tumour angiogenesis and metastasis [1,2]. Its synthesis from arginine is catalysed by isoforms of nitric oxide synthase (NOS). Blockade of the NOS pathway has long been identified as a potential pharmacological target in the treatment of cancer, and in preclinical studies, NOS blockade has a differential effect on systemic and tumour perfusion [3].
As nitric oxide plays a role in the maintenance of renal perfusion and blood flow in the systemic vasculatureblockade of the NOS pathway can result in renal toxicities and the development of hypertension [4,5]. Thus, in order to establish the optimal dosage of an anti-NOS treatment in an early phase trial it is necessary to monitor changes in blood pressure and renal blood flow post administration. Whilst blood pressure can be readily measured, assessment of renal perfusion requires a more invasive approach. Using imaging techniques such as dynamic contrast enhanced computed tomography (CT; also known as Perfusion CT) global renal perfusion may be evaluated via kinetic modelling of renal enhancement changes following intravenous administration of CT contrast agent. These techniques may also provide unique information of the differential effect of anti-vascular drugs on the tumour and systemic vasculature.
We report the use of volumetric helical perfusion CT (vPCT) in evaluating the acute physiological effects of a non-selective inhibitor of nitric oxide synthase, NG-Nitro-L-arginine hydrochloride (L-NNA) on renal vascularity, blood pressure, and tumour perfusion in cancer patients participating in a Phase 1 clinical trial. The primary objective of this trial was to evaluate the differential responses between tumour and renal vasculature following L-NNA administration in human subjects. This was achieved by assessing the baseline variation in global renal and tumour blood flow, blood volume and extraction fraction, and changes in these parameters related to the acute physiological effects of a single dose of LNNA.
2. Methods & Materials
2.1. Ethical Approval, Sponsorship & Registration
The conduct of this prospective Phase 1 trial was approved by the national research ethics committee. This trial was undertaken under the sponsorship and management of Cancer Research UK’s Drug Development Office and registered with the European Union Drug Regulating Authorities Clinical Trials of the European Medicines Agency (EudraCT number: 2009-013621-42). Written informed consent was obtained from all patients.
2.2. Patient Eligibility
Inclusion criteria included: age > 18 years; life expectancy of at least 12 weeks; WHO performance status of 0 or 1; disease assessable by vPCT and at least 2 cm measured on the longest axis and adequate haematological, liver and renal function.
Exclusion criteria included: histological diagnosis of squamous cell carcinoma; history of hypertension or current use of anti-hypertensive medication; history of ischemic heart disease, peripheral vascular disease or diabetes; history of thromboembolic or cerebrovascular disease; current use of anti-coagulation, angiotensin converting enzyme inhibitors or nitrate.
From July 2011 to January 2012, a total of 61 patients were considered for the study. Of these 13 gave informed consent and were screened, of which 6 were enrolled and 4 of these patients were administered L-NNA.
2.3. Administration of L-NNA and Blood Pressure Monitoring
L-NNA was administered through a volumetric pump (PLUM A+ infusion system, Hospira, Illinois, USA) through a peripheral intravenous catheter as a 100 ml infusion over 10 minutes. Blood pressure was measured by an automated device (Datascope Passport XG, Phillips, Amsterdam, Netherlands) before the start of treatment and at the following time points following the infusion of L-NNA: 20 minutes, 40 minutes, 60 minutes, 1 hour, 1 hour 45 minutes, 2 hours, 2 hours 30 minutes, 3 hours, 3 hours 30 minutes, 4 hours and 6 hours. The mean arterial blood pressure was calculated as 2/3 diastolic blood pressure + 1/3 systolic blood pressure [6].
2.4. Measurement of Renal and Tumour Vascularity with vPCT
All imaging was performed on a Dual Source CT scanner (Somatom Definition, Siemens Healthcare, Forchheim, Germany). A breath-held, low dose planning acquisition to locate both the tumor and the kidneys was performed initially with the acquisition parameters as shown in Table1 The 4D adaptive spiral acquisitions centred on the kidneys and tumour were planned from this study, and consisted of successive craniocaudal and caudocranial acquisitions, with a variable pitch of 1 at the central point of the table travel and <1 in the accelerating and decelerating portions, which guarantees a full rotation is available for reconstruction. The maximum dose limit permitted by the ethics committee was 25 mSv per vPCT study, and an adaptive acquisition approach was applied to ensure that this was adhered to.
To assess baseline reproducibility, two separate baseline vPCTs were performed within 24 hours of each other, up to one week before L-NNA administration. Following the infusion of L-NNA, vPCTs were carried out with the following scheduled time-points: 1 hour, 24 hours, 48 hours & 72 hours post drug administration.
2.4.1. Renal Acquisition
50 millilitres of iodinated contrast agent (ioversol 350 mg/ml iodine; Optiray, Covidien, Mansfield, MA, USA) was administered intravenously at 5 ml/s using a dual headed pump injector (OptiVantage™ DH, Mallinckrodt, St Louis, Missouri, USA), followed by a 30 millilitres of

Table 1 . Low dose preliminary scans.
saline flush at the same rate. After a delay of 10 s from the start of the injection, the breath-held post contrast dynamic 4D adaptive spiral acquisition centred on both kidneys was obtained. To optimise breath-holding the patient was hyperventilated prior to the dynamic acquisition. The initial breath-hold in expiration was for the first 30 s of the dynamic acquisition, and the second breathhold, for the remainder of the dynamic acquisition. Between each breath-hold there was a short breathing interval consisting of a single breath in and out.
2.4.2. Tumour Acquisition
The tumour acquisition was performed in a similar manner but centred on and encompassing the entire tumour. 50 millilitres of iodinated contrast agent (ioversol 350 mg/ml iodine; Optiray, Covidien, Mansfield, MA, USA) was administered intravenously at 5 ml/s using a dual headed pump (OptiVantage™ DH, Mallinckrodt, St Louis, Missouri, USA), followed by a 30 millilitres of saline flush at the same rate. After a delay of 4 - 10 s from the start of the injection, depending on the anatomical position of the tumour, the post contrast dynamic 4D adaptive spiral acquisition encompassing the entire tumour was obtained. The acquisition parameters are summarised in Table1
2.5. Image Analysis
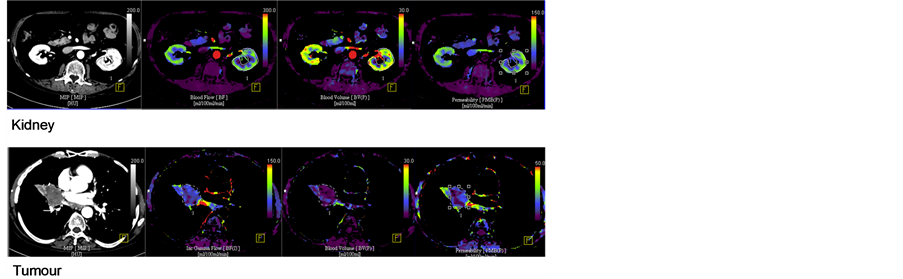
The image analysis was carried out on a commercial workstation (MMWP, Siemens Healthcare, Forchheim, Germany) using validated commercial software (Deconvolution algorithm, vPCT Body Software; Siemens Healthcare, Forchheim, Germany). The initial post-processing steps within the software platform included 1) motion correction and 2) application of the noise reduction filter. Motion correction was based on a non-rigid deformable registration technique [7], previously validated for lung and kidney data [8,9]. The arterial timeattenuation curve was defined by placing a region of interest (ROI) within the artery in the field of view. Parametric maps of regional blood flow (BF; units: mL/min/ 100mL), blood volume (BV; units: mL/100mL), and flow-extraction product (FE; units: mL/min/100mL), were then generated in axial, coronal and sagittal planes (Figure 1).
A volume of interest was delineated around the entire renal cortex visible on the scan or for the entire tumour volume by a single radiologist with over 10 years’ experience of Perfusion CT techniques. The renal cortical margin on axial, sagittal and coronal planes were manually outlined simultaneously thus generating mean global parameter values for the entire volume of interest (Figure 1).
 (a) (b) (c)
Figure 1. Parametric maps of (a) regional blood flow, (b) blood volume, (c) flow extraction product.
2.6. Statistical Analysis
Statistical analysis was carried out using StatsDirect (Cheshire, UK), R version 2.15.2 (R Foundation for Statistical Computing, Vienna, Austria) & Microsoft Excel 2000 (Microsoft, WA). For each patient, the difference between the measurements of a parameter at each reproducibility scan and their mean value, d, was calculated. In order to establish whether the size of d was dependent on the parameter value, Kendall’s tau for correlation of the absolute value of d against the mean parameter value for the two scans was calculated. If this test demonstrated that the error was indeed proportional to the mean, at the 95% confidence interval, then the data were transformed using natural logarithm, and Kendall’s tau test were then repeated.
Reproducibility was assessed by Bland-Altman approach [10]—the mean within-patient difference and its 95% confidence interval (mean difference ± 1.96 × standard deviations of the differences) were determined. We also calculated the 95% confidence interval for spontaneous changes which may occur in a group of patients as outlined by Galbraith [11].
Within and between-patients co-efficients of variation (COV), together with intraclass correlation (ICC) were evaluated.
3. Results
3.1. Patients
Patient characteristics are summarised in Table2 All six patients underwent two baseline pre-treatment vPCT scans to assess reproducibility. Two patients were subsequently withdrawn from the trial before L-NNA could be administered: one patient (Patient 1) developed a symptomatic pericardial effusion, precluding her continuation in the trial, whilst the other patient (Patient 3) was found to have a persistently elevated blood pressure (an exclusion criterion) after trial registration and the initial baseline CTs, precluding trial drug administration. Of the four remaining patients, three received L-NNA at the Phase I study starting dose level of 0.7 mg/kg, and one received L-NNA at the next dose level, 0.9 mg/kg.
3.2. Baseline Vascular Assessment and Reproducibility
The reproducibility values for renal and tumour parameters were assessed and the Bland Altman plots for all renal and tumor blood flow parameters are shown in Figure 2. Mean changes in each of the renal and tumour parameter for the whole cohort of patients were calculated and expressed as a percentage of the mean baseline values. The 95% confidence interval for spontaneous changes in the whole cohort of patients following LNNA administration were determined on the basis of four renal and seven tumour measurements (seven separate target lesions in four patients). For renal blood flow, blood volume & extraction fraction, these values were ±10.79%, ±16.44% & ±11.07% respectively. For tumour blood flow, blood volume & extraction fraction, these values were ±9.99%, −6.52% to 6.98% & −8.29% to 9.03% respectively. Changes beyond these ranges would be regarded as significant at the 5% level [11]. The intraclass correlation coefficients for renal blood flow, blood volume, extraction fraction & tumour blood flow, blood volume and extraction were 0.77, 0.28, 0.78, 0.94, 0.99 & 0.94 respectively.
3.3. Changes in Blood Pressure and Vascularity Post LNNA Administration
L-NNA was well tolerated by all four patients. A rise in the mean arterial blood pressure was observed in three out of the four patients between 1 and 2 hours after the administration of L-NNA (Figure 3). All three patients who experienced a transient rise in blood pressure were in the lower dose cohort (0.7 mg/kg). By 48 hours these had all returned back to baseline except for one patient. The maximal percentage changes in systolic & diastolic
Table 2 . Baseline characteristics of patients.
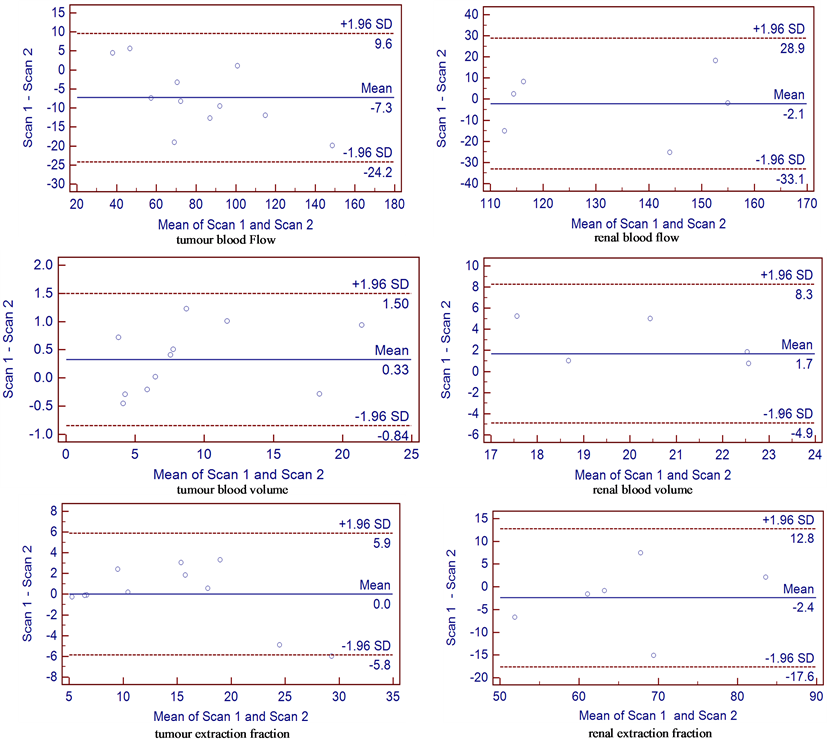
Figure 2. Bland Altman plot of difference between the two studies against the mean for each parameter measured. Mean difference is indicated by the solid line. Two outer dotted lines represent 1.96× standard deviation of the differences on each side of the mean difference, which define the range within which 95% of differences between repeated measurements made on the same subject will lie.
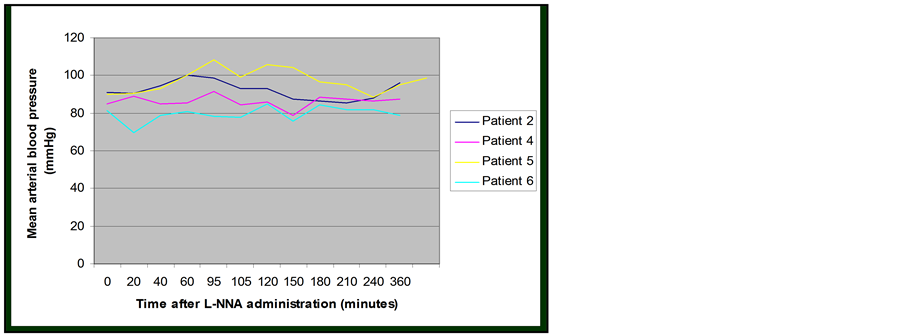
Figure 3. Change in blood pressure following L-NNA administration.
blood pressure were 21% and 24% respectively.
Statistically significant drop in the global renal blood flow (20%), blood volume (19.7%) & extraction fraction (21.6%) were seen one hour after L-NNA infusion but not at subsequent time points. Similarly, statistically significant reduction in the tumour blood flow (16.9%) was also seen one hour after L-NNA infusion but not subsequently. However, tumour blood volume & extraction fraction remained suppressed up to 72 hours after LNNA infusion (Table 3).
For patients 2, 4, and 6 who had two target lesions, changes in the vascular parameters following L-NNA for each lesion were calculated by taking the mean of the absolute changes at different time points and expressed as a percentage compared to the baseline pre-treatment values (Table 4). The magnitude of changes can differ significantly between the two target lesions in the same patient. It is uncertain whether these differences represent genuine differential responses to L-NNA or variations associated with repeated measurements.
The average values for the mean arterial blood pressure taken between one and two hours after the administration of L-NNA for each patient and their percentage change compared to baseline were calculated. Strong negative correlations were found between changes in the blood pressure and tumour blood flow and tumour blood volume evaluated one hour after L-NNA (Table 5). No such correlation was found between the change in blood pressure and renal blood supply.
4. Discussion
In normal vasculature, nitric oxide is released by endothelial cells to promote smooth muscle relaxation in the blood vessels and vasodilatation. Despite the significant structural and physiological differences between normal and tumour vasculature [12], tumour blood flow is also maintained by nitric oxide in a similar manner.
This is achieved directly by nitric oxide activating guanylate cyclase to produce cyclic guanosine monophosphate (cGMP), which in turn triggers cGMP dependent protein kinases to promote myosin phosphorylation. Indirectly, NO also interacts with Vascular Endothelial Growth Factor (VEGF), another important vaso-active signalling agent, inhibition of which has shown activity against a range of tumours [13-17]. Expression of nitric oxide synthase (NOS), which catalyses the conversion of L-arginine into nitric oxide, is up-regulated by VEGF [18,19], whilst VEGF expression is down-regulated by nitric oxide [20]. Blockade of the NOS pathway has been shown to result in hypertension in humans [21] and impact on renal blood flow and its autoregulation in animals [22-26]. Thus it has been suggested that the development of hypertension in patients on long term VEGF inhibitor treatment may in part be secondary to the suppression of nitric oxide production due to VEGF inhibition.
Consistent with published results in animal and clinical studies, we have demonstrated a reduction in renal blood flow, blood volume, and extraction fraction within one hour of L-NNA administration [22-26], and a transient increase in the systemic arterial blood pressure following the blockade of the nitric oxide synthase pathway [21]. Blood pressure began to normalise two hours after L-NNA administration, and renal perfusion returned to baseline by 24 hours post L-NNA. Findings from a previous study that tumour blood volume was reduced following L-NNA administration [27] has also been con
Table 3. change in each parameter compared to their baseline value at different time points after the administration of L-NNA.
Table 4. Variability in vascular parameters between different target lesions in the same patient pre and post LNNA treatment.
Table 5. Spearman rank correlation coefficient: −1.0 for BP & tumour BF (p < 0.0001) & −0.8 (−0.996 to 0.697) for BP and tumour BV (p = 0.2).
firmed. Improvements in CT technology which have translated into higher temporal resolution in our study have enabled us also to assess regional blood flow, and to demonstrate a corresponding decrease in blood flow in our study. Additionally, we have shown that this reduction can persist up to 72 hours after L-NNA. The prolonged effect of L-NNA on tumour vasculature, compared to the renal vasculature, is consistent with observations in an animal study [3]. This differential effect of NOS blockade may be related to the increased expression of inducible NOS in tumours [28-30]. Variability in the expression by tumour perivascular cells of soluble guanylate cyclase and phosphodiesterase, which produces and degrades cGMP respectively, has been proposed as another potential mechanism to account for this differential response [1]. The level of guanylate cyclase expression has recently been reported to be reduced in glioma tissues [31].
The development of hypertension may be predictive of tumour response to anti-angiogenesis treatment [32-35]. The negative correlation observed in this small cohort of patients between the degree of vaso-constriction in the tumour blood supply, as reflected by a reduction in the tumour blood flow and volume, and the transient increase in blood pressure, warrants further investigations. Applying DCE-CT to evaluate changes in the tumour and systemic blood flow simultaneously and correlating them with the change in blood pressure may help to determine the utility of blood pressure change as a surrogate marker of the acute physiological effect of anti-angiogenic treatment on tumour vasculature.
Our baseline vPCT reproducibility (within subject COV of 7.6% to 12.6% for the renal vasculature and 6.4 to 10.3% for the tumour vasculature) and intraclass correlation coefficient values of greater than 0.9 for tumour vascular parameters indicate that vPCT assessment of regional blood flow, blood volume and extraction factor can be used to monitor therapeutic changes. The reproducibility for tumour is comparable to that obtained previously for patients with non small cell lung cancer [36] using a similar technique. Nevertheless, an important consideration in the Phase I setting is that baseline reproducibility should be assessed for each individual patient, particularly where anticipated changes in vascular parameters caused by the vaso-active agent under investigation are small. Furthermore, consideration should also be given to the possibility of differential responses by different target lesions in the same patient, and the use of vPCT may be advantangeous in that vascular changes in multiple target lesions can be evaluated at the same time to provide a more global assessment of the efficacy of the agent than by evaluating changes in single index lesions.
Whilst our findings suggest that the systemic effects of a single dose of a NOS inhibitor are transient, and that there is a differential effect on the systemic and tumour vasculature up to 72 hours post treatment, there are limitations to this study. Our study population was highly selected and very small given the stringent exclusion criteria: 55 patients were excluded at screening but necessitated by the trial end point. Only 6 patients were recruited and 4 patients treated due to premature closure of the trial by the study sponsor for strategic reasons. They were also highly heterogeneous in terms of their primary cancer.
5. Conclusion
In summary, preliminary data in a small study population who received a one-off L-NNA treatment indicated that the blockade of the NOS pathway can lead to a transient increase in blood pressure and reduction in blood flow to the kidneys, and a more sustained decrease in tumour blood flow, volume & permeability. DCE-CT provides a robust imaging method to evaluate changes in renal and tumour blood flow following the administration of a vaso-active drug. Change in blood pressure may be a useful surrogate marker for the acute response to anti-angiogenic treatment.
REFERENCES
- D. Fukumura, S. Kashiwagi and R. K. Jain, “The Role of Nitric Oxide in Tumour Progression,” Nature Reviews Cancer, Vol. 6, No. 7, 2006, pp. 521-534. http://dx.doi.org/10.1038/nrc1910
- J. Muntane and M. D. la Mata, “Nitric Oxide and Cancer,” World Journal of Hepatology, Vol. 2, No. 9, 2010, pp. 337-344. http://dx.doi.org/10.4254/wjh.v2.i9.337
- G. M. Tozer, V. E. Prise and K. M. Bell, “The Influence of Nitric Oxide on Tumour Vascular Tone,” Acta Oncologica, Vol. 34, No. 3, 1995, pp. 373-377. http://dx.doi.org/10.3109/02841869509093992
- S. Klahr, “The Role of Nitric Oxide in Hypertension and Renal Disease Progression,” Nephrology Dialysis Transplantation, Vol. 16, Suppl. 1, 2001, pp. 60-62. http://dx.doi.org/10.1093/ndt/16.suppl_1.60
- J. M. Valdivielso and R. C. Blantz, “Acute Renal Failure: Is Nitric Oxide the Bad Guy?” Antioxidants & Redox Signaling, Vol. 4, No. 6, 2002, pp. 925-934. http://dx.doi.org/10.1089/152308602762197461
- R. E. Klabunde, “Cardiovascular Physiology Concepts,” 2nd Edition, Lippincott Williams & Wilkins/Wolters Kluwer, Philadelphia, 2012, 243 p.
- K. A. Saddi, C. Chefd’hotel and F. Cheriet, “Large Deformation Registration of Contrast-Enhanced Images with Volume-Preserving Constraint,” In: J. P. W. Pluim and J. M. Reinhardt, Eds., Medical Imaging 2007: Image Processing, 2007. http://dx.doi.org/10.1117/12.709515
- R. Goetti, et al., “Quantitative Computed Tomography Liver Perfusion Imaging Using Dynamic Spiral Scanning with Variable Pitch: Feasibility and Initial Results in Patients with Cancer Metastases,” Investigative Radiology, Vol. 45, No. 7, 2010, pp. 419-426.
- C. S. Reiner, et al., “CT Perfusion of Renal Cell Carcinoma: Impact of Volume Coverage on Quantitative Analysis,” Investigative Radiology, Vol. 47, No. 1, 2012, pp. 33-40. http://dx.doi.org/10.1097/RLI.0b013e31822598c3
- J. M. Bland and D. G. Altman, “Statistical Methods for Assessing Agreement between Two Methods of Clinical Measurement,” Lancet, Vol. 1, No. 8476, 1986, pp. 307- 310. http://dx.doi.org/10.1016/S0140-6736(86)90837-8
- S. M. Galbraith, et al., “Reproducibility of Dynamic Contrast-Enhanced MRI in Human Muscle and Tumours: Comparison of Quantitative and Semi-Quantitative Analysis,” NMR in Biomedicine, Vol. 15, No. 2, 2002, pp. 132-142. http://dx.doi.org/10.1002/nbm.731
- S. Goel, et al., “Normalization of the Vasculature for Treatment of Cancer and Other Diseases,” Physiological Reviews, Vol. 91, No. 3, 2011, pp. 1071-1121. http://dx.doi.org/10.1152/physrev.00038.2010
- A. Sandler, et al., “Paclitaxel-Carboplatin Alone or with Bevacizumab for Non-Small-Cell Lung Cancer,” New England Journal of Medicine, Vol. 355, No. 24, 2006, pp. 2542-2550. http://dx.doi.org/10.1056/NEJMoa061884
- L. B. Saltz, et al., “Bevacizumab in Combination with Oxaliplatin-Based Chemotherapy as First-Line Therapy in Metastatic Colorectal Cancer: A Randomized Phase III Study,” Journal of Clinical Oncology, Vol. 26, No. 12, 2008, pp. 2013-2019. http://dx.doi.org/10.1200/JCO.2007.14.9930
- B. Escudier, et al., “Bevacizumab plus Interferon Alfa-2a for Treatment of Metastatic Renal Cell Carcinoma: A Randomised, Double-Blind Phase III Trial,” Lancet, Vol. 370, No. 9605, 2007, pp. 2103-2111. http://dx.doi.org/10.1016/S0140-6736(07)61904-7
- T. J. Perren, et al., “A Phase 3 Trial of Bevacizumab in Ovarian Cancer,” New England Journal of Medicine, Vol. 365, No. 26, 2011, pp. 2484-2496. http://dx.doi.org/10.1056/NEJMoa1103799
- M. C. Chamberlain, “Bevacizumab for the Treatment of Recurrent Glioblastoma,” Clinical Medicine Insights: Oncology, Vol. 5, 2011, pp. 117-129. http://dx.doi.org/10.4137/CMO.S7232
- J. D. Hood, et al., “VEGF Upregulates ecNOS Message, Protein, and NO Production in Human Endothelial Cells,” American Journal of Physiology, Vol. 274, No. 3, 1998, pp. H1054-H1058.
- A. Bouloumie, V. B. Schini-Kerth and R. Busse, “Vascular Endothelial Growth Factor Up-Regulates Nitric Oxide Synthase Expression in Endothelial Cells,” Cardiovascular Research, Vol. 41, No. 3, 1999, pp. 773-780. http://dx.doi.org/10.1016/S0008-6363(98)00228-4
- Y. Tsurumi, et al., “Reciprocal Relation between VEGF and NO in the Regulation of Endothelial Integrity,” Nature Medicine, Vol. 3, No. 8, 1997, pp. 879-886. http://dx.doi.org/10.1038/nm0897-879
- A. Lopez, et al., “Multiple-Center, Randomized, PlaceboControlled, Double-Blind Study of the Nitric Oxide Synthase Inhibitor 546C88: Effect on Survival in Patients with Septic Shock,” Critical Care Medicine, Vol. 32, No. 1, 2004, pp. 21-30. http://dx.doi.org/10.1097/01.CCM.0000105581.01815.C6
- R. Kramp, P. Fourmanoir and N. Caron, “Endothelin Resets Renal Blood Flow Autoregulatory Efficiency during Acute Blockade of NO in the Rat,” American Journal of Physiology. Renal Physiology, Vol. 281, No. 6, 2001, pp. F1132-F1140.
- N. W. Rajapakse, J. J. Oliver and R. G. Evans, “Nitric Oxide in Responses of Regional Kidney Blood Flow to Vasoactive Agents in Anesthetized Rabbits,” Journal of Cardiovascular Pharmacology, Vol. 40, No. 2, 2002, pp. 210-219. http://dx.doi.org/10.1097/00005344-200208000-00006
- E. Turkstra, B. Braam and H. A. Koomans, “Impaired Renal Blood Flow Autoregulation in Two-Kidney, One-Clip Hypertensive Rats Is Caused by Enhanced Activity of Nitric Oxide,” Journal of the American Society of Nephrology, Vol. 11, No. 5, 2000, pp. 847-855.
- H. Kiyomoto, et al., “Effect of L-NG-Nitro-Arginine, Inhibitor of Nitric Oxide Synthesis, on Autoregulation of Renal Blood Flow in Dogs,” Japanese Journal of Pharmacology, Vol. 58, No. 2, 1992, pp. 147-155. http://dx.doi.org/10.1254/jjp.58.147
- S. Racasan, et al., “NO Dependency of RBF and Autoregulation in the Spontaneously Hypertensive Rat,” American Journal of Physiology. Renal Physiology, Vol. 285, No. 1, 2003, pp. F105-F112.
- Q. S. Ng, et al., “Effect of Nitric-Oxide Synthesis on Tumour Blood Volume and Vascular Activity: A Phase I Study,” Lancet Oncology, Vol. 8, No. 2, 2007, pp. 111- 118. http://dx.doi.org/10.1016/S1470-2045(07)70001-3
- O. Gallo, et al., “Role of Nitric Oxide in Angiogenesis and Tumor Progression in Head and Neck Cancer,” Journal of the National Cancer Institute, Vol. 90, No. 8, 1998, pp. 587-596. http://dx.doi.org/10.1093/jnci/90.8.587
- L. L. Thomsen, et al., “Nitric Oxide Synthase Activity in Human Breast Cancer,” British Journal of Cancer, Vol. 72, No. 1, 1995, pp. 41-44. http://dx.doi.org/10.1038/bjc.1995.274
- S. Ambs, et al., “Frequent Nitric Oxide Synthase-2 Expression in Human Colon Adenomas: Implication for Tumor Angiogenesis and Colon Cancer Progression,” Cancer Research, Vol. 58, No. 2, 1998, pp. 334-341.
- H. Zhu, et al., “Restoring Soluble Guanylyl Cyclase Expression and Function Blocks the Aggressive Course of Glioma,” Molecular Pharmacology, Vol. 80, No. 6, 2011, pp. 1076-1084. http://dx.doi.org/10.1124/mol.111.073585
- O. Rixe, B. Billemont and H. Izzedine, “Hypertension as a Predictive Factor of Sunitinib Activity,” Annals of Oncology, Vol. 18, No. 6, 2007, p. 1117. http://dx.doi.org/10.1093/annonc/mdm184
- P. Bono, et al., “Hypertension and Clinical Benefit of Bevacizumab in the Treatment of Advanced Renal Cell Carcinoma,” Annals of Oncology, Vol. 20, No. 2, 2009, pp. 393-394. http://dx.doi.org/10.1093/annonc/mdn729
- A. Ravaud and M. Sire, “Arterial Hypertension and Clinical Benefit of Sunitinib, Sorafenib and Bevacizumab in First and Second-Line Treatment of Metastatic Renal Cell Cancer,” Annals of Oncology, Vol. 20, No. 5, 2009, pp. 966-967. http://dx.doi.org/10.1093/annonc/mdp201
- M. Scartozzi, et al., “Arterial Hypertension Correlates with Clinical Outcome in Colorectal Cancer Patients Treated with First-Line Bevacizumab,” Annals of Oncology, Vol. 20, No. 2, 2009, pp. 227-230. http://dx.doi.org/10.1093/annonc/mdn637
- Q. S. Ng, et al., “Acute Tumor Vascular Effects Following Fractionated Radiotherapy in Human Lung Cancer: In Vivo Whole Tumor Assessment Using Volumetric Perfusion Computed Tomography,” International Journal of Radiation Oncology, Biology, Physics, Vol. 67, No. 2, 2007, pp. 417-424. http://dx.doi.org/10.1016/j.ijrobp.2006.10.005