Journal of Cancer Therapy
Vol. 4 No. 3 (2013) , Article ID: 31607 , 8 pages DOI:10.4236/jct.2013.43089
Correlation of Urinary Engrailed-2 Levels to Tumour Volume and Pathological Stage in Men Undergoing Radical Prostatectomy*
Hardev Pandha1#†, Saqib Javed2#, Prasanna Sooriakumaran3, Simon Bott4, Bruce Montgomery4, Anthony Hutton2, Christopher Eden2, Stephen E. Langley2, Richard Morgan1
![]()
1Oncology, Faculty of Health and Medical Sciences, University of Surrey, Guildford, UK;
2Royal Surrey County Hospital, Guildford, UK;
3St. Georges Hospital, London, UK;
4Frimley Park Hospital NHS Foundation Trust, Portsmouth Road, Frimley, UK.
Email: †h.pandha@surrey.ac.uk
Copyright © 2013 Hardev Pandha et al. This is an open access article distributed under the Creative Commons Attribution License, which permits unrestricted use, distribution, and reproduction in any medium, provided the original work is properly cited.
Received February 19th, 2013; revised March 20th, 2013; accepted March 27th, 2013
Keywords: Biomarker; Prostate Cancer; Urine
ABSTRACT
The aim of this study was to assess the relationship between pre-prostatectomy urinary Engrailed-2 (EN2), a transcription factor secreted by prostate cancer cells, with tumour volume and pathological characteristics in resected prostate specimens. First pass urine samples (10 ml) without prior prostatic massage were collected and stored at –80˚C. EN2 levels were measured using an enzyme-linked immunoabsorbent assay. Tumour volume in the prostatectomy specimens was determined histologically. 57 men undergoing RP in one urological cancer network were evaluated. EN2 was detected in 85% of RP patients. EN2 correlated with tumour volume (but not total prostatic volume) in a linear regression analysis, with increasing pathological T stage and margin positivity. Using three “cutoff levels” of tumour volume (0.5 ml, 1.3 ml and 2.5 ml) to define “significant disease”, men with “significant disease” had markedly higher levels of urinary EN2 (p < 0.001 for each cut off level). Levels of urinary EN2 may be useful in predicting tumour volume in men with prostate cancer by potentially identifying men with small volume “insignificant” disease. This study justifies a larger multicentre evaluation of urinary EN2 levels as a biomarker of PC significance using cancer volume, pathological and PSA criteria.
1. Introduction
For over 20 years, prostate specific antigen (PSA) testing has provided the opportunity for the detection of prostate cancer (PC) at an earlier and, therefore, more likely curative stage of the disease. Although PSA has been (and remains) a valuable cancer biomarker, the limited sensitivity and specificity of PSA for cancer at the age-specific cut-offs [1,2] and its elevation in benign prostate disorders continues to limit its utility. In addition, there is no consistent correlation between PSA and the grade, stage or volume of disease [3]. Attempts to increase the predictive value of PSA using PSA density and velocity, the ratio of free to total PSA and different PSA isoforms have made little impact clinically [4]. There is an urgent need for novel biomarkers which aid clinical decision making with respect to biopsy and primary therapy [5].
We reported the potential diagnostic utility of Engrailed-2 (EN2), a transcription factor involved in embryonic brain development that is re-expressed in PC [6]. The presence of EN2 in urine was predictive of PC, with a sensitivity of 66% and a specificity of 88.2% (AUC of 0.81). We further demonstrated a strong positive correlation between pre-surgical levels of urinary EN2 and tumour volume in RP specimens in a retrospective series, as well as a correlation between EN2 levels and tumour stage (T2 vs. T3) [7].
The objective of the current study was to prospectively examine the relationship of pre-surgical urinary EN2 levels with tumour stage and tumour volume in RP specimens and thereby to provide an indication whether EN2 could potentially be used, in conjunction with other criteria, to designate patients as suitable for immediate active treatment versus active surveillance.
2. Materials and Methods
2.1. Patients
The patients were recruited to the study between December 2010 and February 2012. Patients were identified in multidisciplinary uro-oncology clinics from the Surrey, West Sussex and Hampshire Cancer Network, UK. All patients gave written informed consent and the study received approval by the local ethics committee (REF: 09/H1109/98). Patients were recruited prospectively and consecutively and not selected in any way apart form the following criteria. The main criterion for inclusion was planned RP (laparoscopic or robotic) for clinically localised PC. The diagnosis of PC was established based on 8 - 12 core (transrectal sextant and/or template biopsies). Patients with a urinary tract infection, on any therapy for PC or on finasteride, with non-organ confined disease and any histologically confirmed second malignancies were excluded.
Serum PSA was measured 1 - 2 weeks prior to urine procurement. First pass urine samples (10 ml), without prostatic massage, were collected a minimum of 4 weeks after any biopsy procedure (sextant or template) and, in general, were between 1 day and 2 weeks before RP. We previously reported that EN2 protein is stable in urine at room temperature for at least 4 days [6], and all urine samples were received for processing within 30 hours post donation. Upon receipt in the laboratory, samples were divided into 1.5ml aliquots, centrifuged 10,000 g for 5 minutes and the supernatant removed and stored at –80˚C.
All RP specimens and biopsies were evaluated by a specialist uro-pathologist. Tissue samples were fixed in 10% formalin, paraffin embedded, and sectioned at 5- mm intervals before mounting of whole sections on slides. In conducting a complete sampling procedure, the apical portion, the base, and the neck of the prostate were separated and sampled using a cone technique. The Gleason grading system (International Society of Urological Pathology revised version) was applied and the TNM classification for staging was used. Each focus of PC was outlined on the histology sections and tumour volume calculated by multiplying the area by the section thickness. The individual volumes of mutifocal tumours were calculated and combined as the total tumour volume.
2.2. Enzyme-Linked Immunosorbent Assay
A modified version of the previously published ELISA method [6] was used for this study. EN2 was bound directly to the surface of a plastic assay plate (Nunc Maxisorb) by incubating urine in each well for 2 hours. The wells were subsequently washed with PBS with 0.1% Tween 20, and the EN2 protein bound to the plastic surface was detected using a mouse anit-EN2 monoclonal antibody linked to alkaline phosphatase. Samples were tested anonymously to eliminate patient identification. 100 µl of the urine supernatant samples or a dilution of the EN2 fragment in buffer was tested in duplicate. A standard curve was generated from dilution series to allow the concentration of EN2 in each sample to be measured.
2.3. Statistical Analysis
The GraphPad Prism (GraphPad Software Inc, USA) package was used in statistical calculations. To test the significance of differences between mean EN2 concentrations in different patient groups (defined by T-stage or Gleason grade) an unpaired t-test with Welch’s correction was used as the EN2 values were not normally distributed. Correlations between PSA and tumour volume/ prostate volume, and EN2 and tumour volume/prostate volume were calculated by linear regression. Receiver operator characteristics (ROC) curves were generated for the EN2 and PSA values. The area under the curve was tested for significance using an unpaired t-test against the hypothesis that the real area under the curve was 0.5 (i.e. no diagnostic value). The threshold value for significance of EN2 level in urine was set at 42.5 ng/ml based on the original study [6].
3. Results
3.1. Patient Characteristics
The patient characteristics of the 57 men in the study are shown in Table 1. Clinical stages T1c, T2a, T2b and T3a were reported in 36, 8, 8, 4 and 1 man, respectively. The mean number of positive cores was five (median 5, interquartile range (IQR) 3-7). The median combined Gleason score in biopsies and RP specimens was 7, IQR 6-7). Seventeen patients had their Gleason score upgraded after RP; two patients were downgraded. The RP Gleason scores were as follows: 3 + 3 (n = 15); 3 + 4 (n = 33); 4 + 3 (n = 5); 4 + 4 (n = 0); 3 + 5 (n = 3); and 4 + 5 (n = 1). The pathological grades in the RP specimens were: Gleason 6 (26.3%); 7 (66.6%), 8 (5.2%) and 9 (1.7%).
The mean tumour volume in the RP specimen was 4.92 ml (median 4.35 ml, IQR 1.81-6.7ml). EN2 levels across the cohort were not normally distributed. Of the total of 57 patients in the cohort, 85% were positive for EN2 in their urine having levels above 42.5 ng/ml described previously) [6]. In these men, the mean EN2 level in urine was 347.73 ng/ml (median 265, IQR 184-524). The demographic and pathological features of patients who were positive or negative for EN2 secretion are shown in Table 2. The groups differed only on the basis of tumour volume, where EN2 secretion was associated with larger tumour volume at prostatectomy. The difference between the mean EN2 levels between the two groups was statistically significant (p ≤ 0.0001). The difference between the mean tumour volume between the two groups was also statistically significant (p ≤ 0.0001).
In eight of the nine men who were not secreting EN2, one or more of their original diagnostic prostatic biopsies were positive for EN2 staining (data not shown).
3.2. Correlation between Serum PSA, Urinary EN2 and Pathological Findings
No correlation was found between serum PSA level and levels of urinary EN2 in pre-RP samples (p = 0.075; Figure 1). Higher levels of EN2 were detected in more advanced clinical T stage but this did not reach significance (p = 0.1936). However, digital rectal examination prediction is notoriously variable between individuals and is of limited value in staging. Regarding pathological stage, significant differences were noted in the median levels of EN2 in pT2 (n = 39) and pT3a (n = 19), which were 210 ng/ml (IQR 52 ng/ml - 347 ng/ml) and 420 ng/ml (IQR 282 ng/ml - 662 ng/ml) respectively (p = 0.0063) (Figure 2). Men with positive margin(s) had significantly higher median levels of EN2 in margin positive patients (n = 14) of 554.5 ng/ml (IQR 354.2 ng/ml - 733.7 ng/ml) versus 227 ng/ml (IQR 90.25 ng/ml - 375 ng/ml) in margin negative patients (n = 43) (p = 0.0078) (Figure 3). Although men with perineural invasion showed the same trend, this did not achieve statistical significance (data not shown).
The relationship between urinary EN2 and serum PSA and Gleason grading of biopsies and RP specimens was examined. In the biopsies, higher levels of EN2 were associated with Gleason 7 disease compared with Gleason 8, although there were far fewer cases of Gleason 8. In the RP specimens, there were equally high levels in Gleason 6 and 7 and again lower levels in Gleason 8.
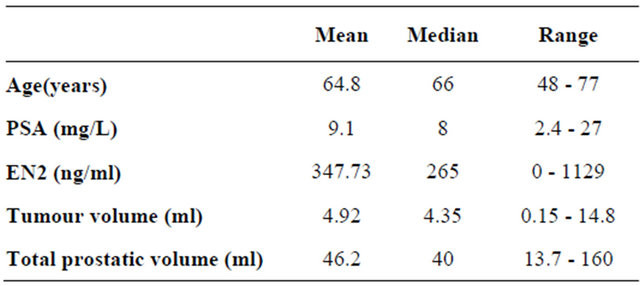
Table 1. Patient characteristics of 57 men included in Radical Prostatectomy group.
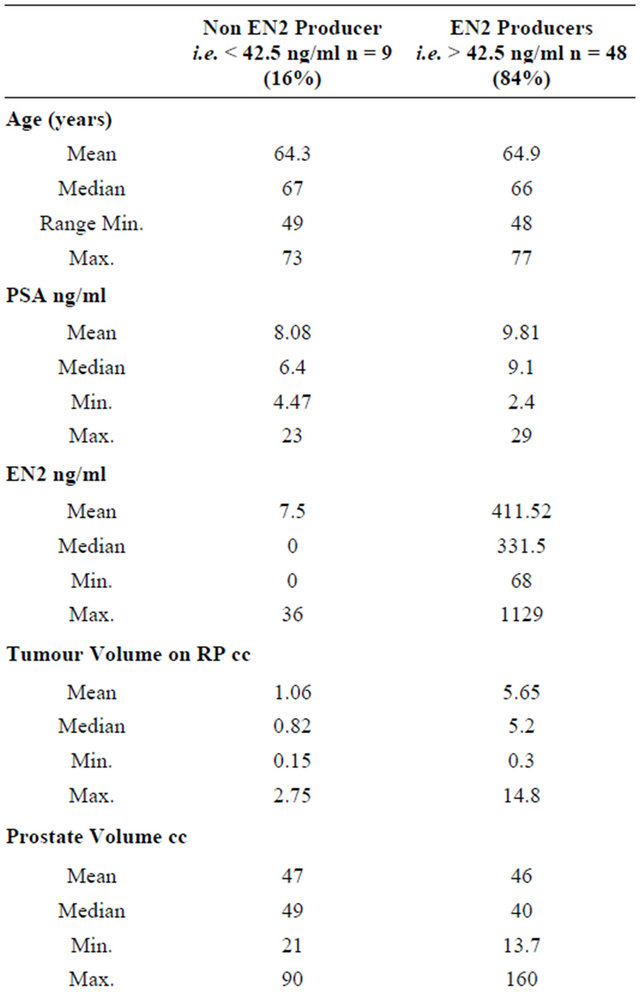
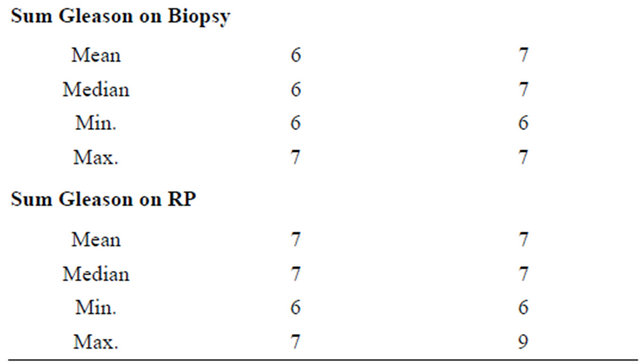
Table 2. Demographic and pathological features of patients who were positive or negative for EN2 secretion. The difference between the mean EN2 levels between the two groups was statistically significant (p ≤ 0.0001). The difference between the mean tumour volume between the two groups was also statistically significant (p ≤ 0.0001).
Differences did not reach statistical significance in either the biopsy or RP sampling group. PSA levels varied to a lesser extent than EN2 levels in relation to Gleason lesser extent than EN2 levels in relation to Gleason grading in biopsy and RP specimens; in both cases this did not reach statistical significance.
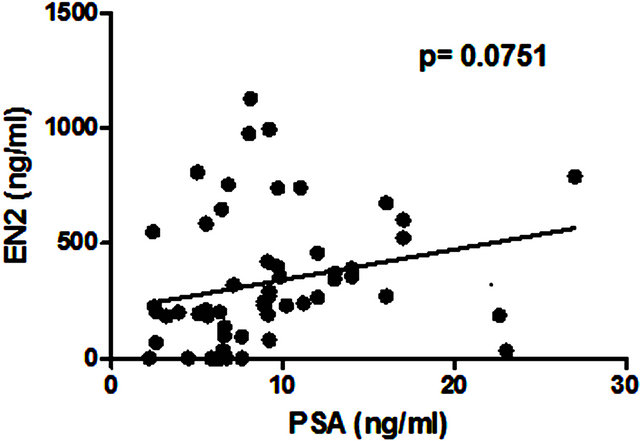
Figure 1. Correlation between levels of serum prostatespecific antigen (PSA) and pre-prostatectomy urinary Engrailed-2 (EN2) levels.
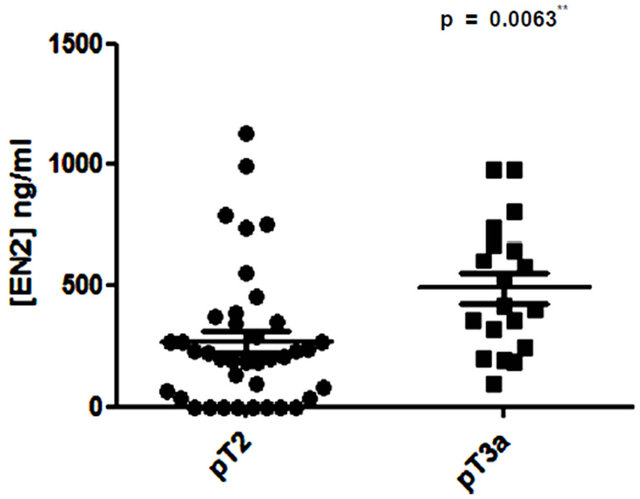
Figure 2. Comparison of pre-prostatectomy urinary Engrailed-2 (EN2) levels in PT2 versus pT3 prostate cancers.
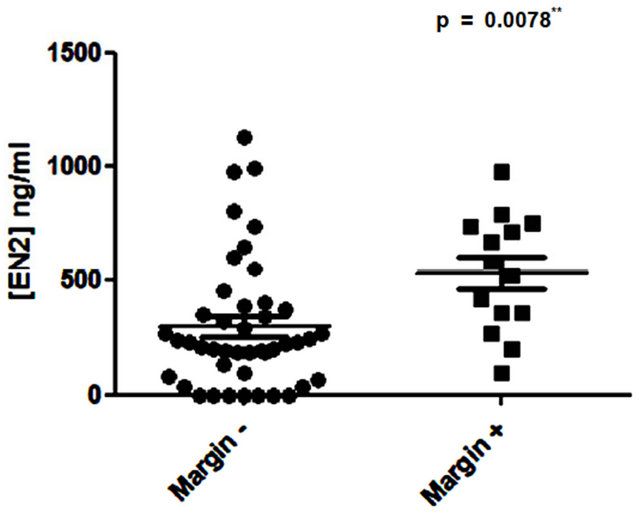
Figure 3. Comparison of pre-prostatectomy urinary Engrailed-2 (EN2) levels in patients with positive and negative resection margins in the RP specimen.
3.3. Correlation of Pre-Prostatectomy Urinary EN2 Levels and Serum PSA with Total Prostate and PC Volume
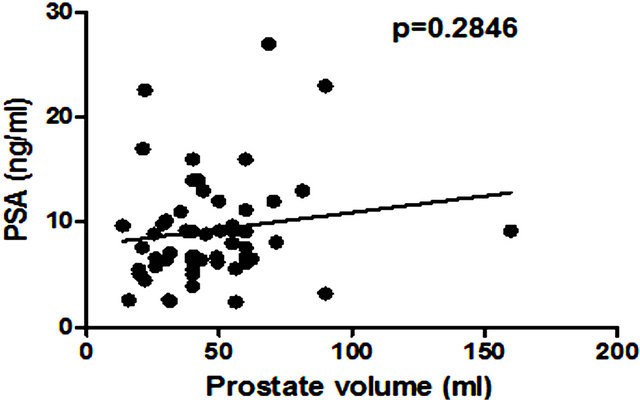
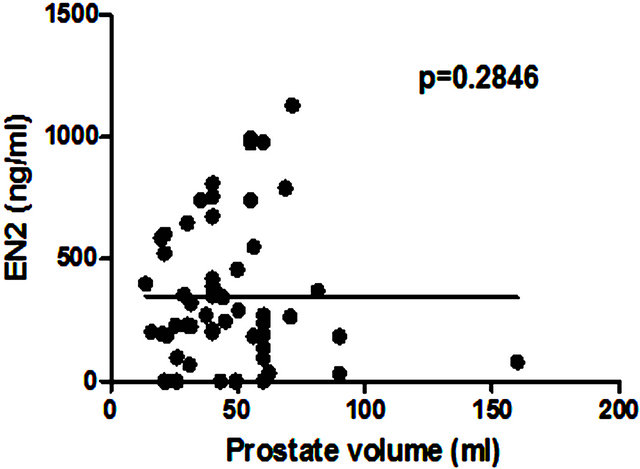
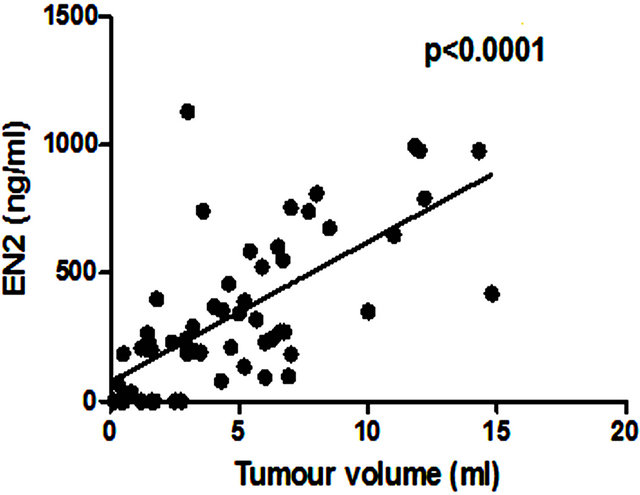
There was no significant correlation between PSA level and total prostate gland volume (p = 0.2846; Figure 4(a)) or PC volume (p = 0.0909; Figure 4(b)). Similarly no correlation was found between EN2 levels and prostate gland volume (p = 0.2846; Figure 5(a)). In contrast, a very strong correlation was identified between tumour volume and EN2 levels (p = 0.0001; Figure 5(b)).
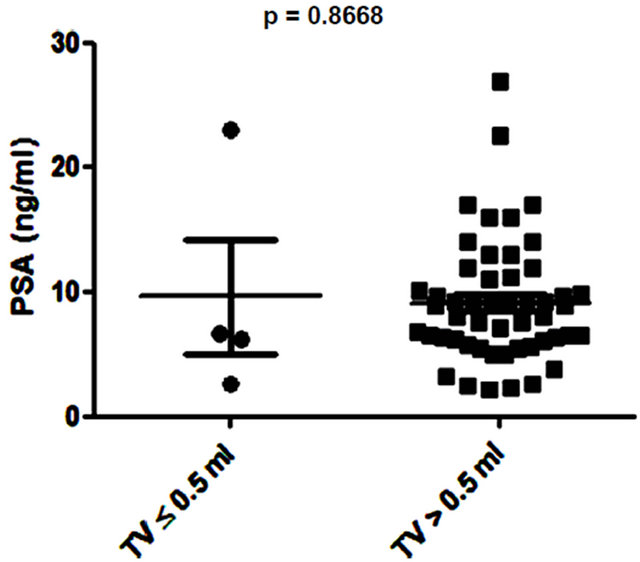
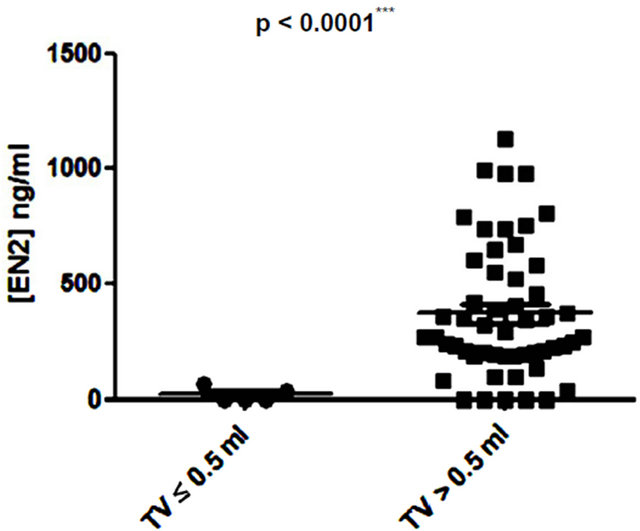
Several studies have shown small prostate cancers are unlikely to progress locally and and/or metastasise, and therefore may represent “insignificant” disease not requiring immediate treatment [8,9]. Based on these previous studies, 3 volume cut offs of 0.5 ml, 1.3 ml and 2.5 ml were selected and the potential of PSA and EN2 levels to indicate significant disease was tested. PSA was unable to distinguish between significant and insignificant disease using cut offs of 0.5 ml and 1.3 ml (Figures 6 (a) and (b)). In contrast, a highly significant difference between cancers using all three cutoff levels was observed with EN2 (p < 0.0001 at all cutoffs; Figure 7).
 (a)
(a)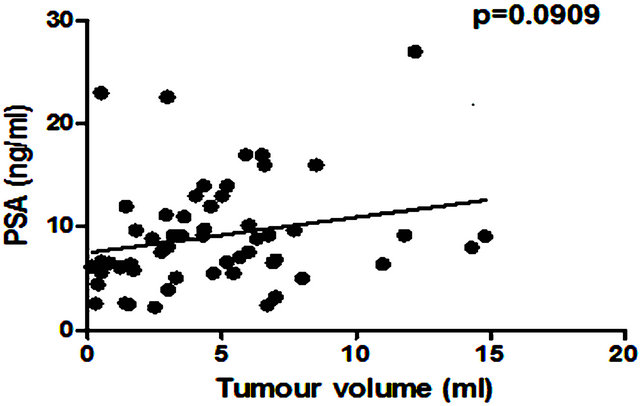 (b)
(b)
Figure 4. Relationship between pre-prostatectomy prostatespecific antigen (PSA) levels and (a) prostate volume and (b) total tumour volume.
 (a)
(a)
 (b)
(b) Figure 5. Relationship between pre-prostatectomy urinary Engrailed-2 (EN2) levels and (a) prostate volume and (b) tumour volume.
 (a)
(a)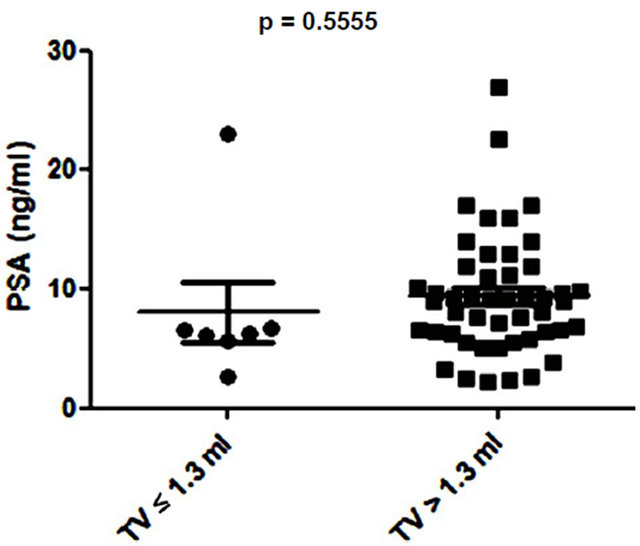 (b)
(b)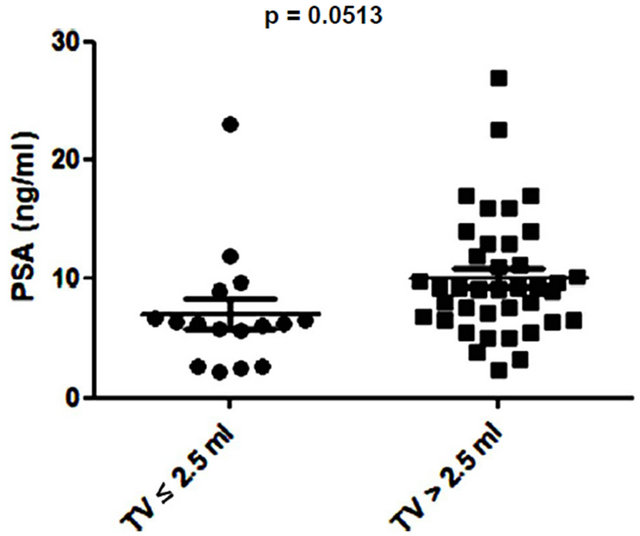 (c)
(c)
Figure 6. Relationship between prostate-specific antigen (PSA) level and prostate tumour volume (TV) using cutoff points of (a) ≤ 0.5 ml and > 0.5 ml; (b) ≤ 1.3 ml and > 1.3 ml; and (c) ≤ 2.5 ml and > 2.5 ml.
4. Discussion
The unmet need for biomarkers for prostate cancer now includes not only improved diagnostic sensitivity and specificity, but also whether any tumour detected requires immediate treatment or can be safely monitored. Small prostate cancers have a low propensity to progress locally and metastasize [10,11]. Non-invasive methods of reliably identifying these small cancers would have high clinical utility. Our retrospective study showed a significant correlation between pre-surgical urinary EN2 and tumour volume, but included what would currently be regarded as a high-risk population and evaluated samples from a biobank collected during non-contemporary clinical
 (a)
(a)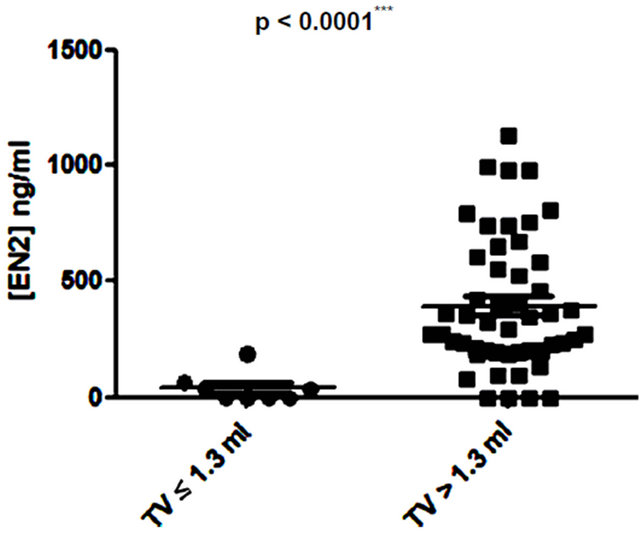 (b)
(b)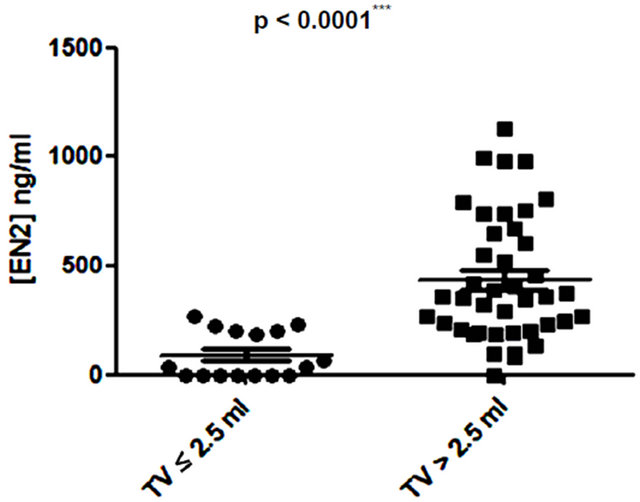 (c)
(c)
Figure 7. Relationship between pre-prostatectomy urinary Engrailed-2 (EN2) levels and prostate tumour volume (TV) using cutoff points of (a) ≤ 0.5 ml and > 0.5 ml; (b) ≤ 1.3 ml and > 1.3 ml; and (c) ≤ 2.5 ml and > 2.5 ml.
practice in terms of patient imaging, biopsy techniques and surgical prostatectomy techniques [7]. It was thus felt important to evaluate EN2 in a prospective study reflecting current practice, diagnostic and surgical techniques. Compared to the previous retrospective study, we evaluated the relationship between pre-surgical levels of EN2 in urine and pathological features in a lower risk RP group.
The relationship between PSA and tumour volume has been extensively investigated as both PSA and tumour volume are independent predictors of outcome [12]. In this study, the RP population was representative of contemporary practice with 63% of men presenting with T1c disease. Most men (85%) in this study had significant levels of EN2 in their urine. There was a strong correlation between EN2 and tumour volume (p < 0.001) and pathological T stage (pT2 versus pT3a p < 0.0063). There was no correlation between PSA levels with either tumour volume or total prostatic volume. There was also a significant correlation with margin positivity. No statistical differences in EN2 and PSA levels and Gleason grade were evident: this is understandable in terms of patient selection for RP in this study, and will be evaluated again in an ongoing prospective study involving a number of PC diagnostic biomarkers in addition to EN2.
Low volume PC (< 0.5ml) is considered to have a low potential to metastasize and this cutoff has been used to designate cancers as being insignificant [9]. A recent analysis of prostatectomy patients within the ESPRC (The European Randomized study of Screening for Prostate Cancer) study proposed that the threshold volume for significance may be higher: 1.3 ml and 2.5 ml for index lesion and total volume respectively [9]. There may be considerable clinical value in a pre-treatment tumour marker that provides an accurate assessment of cancer volume in terms of assessing PC progression risk i.e. to identify patients suitable for active surveillance (AS). We found that when using any of the three tumour volumes cited above, there was a highly significant difference in EN2 levels above and below these cut offs.
Patients on AS, by definition, should have small volume and low risk disease. One of the key objectives of the AS concept is that after identifying suitable patients there is continual evaluation during follow up to see if they should remain in AS or be treated. There are currently no good markers of progression in these patients, including PSA, necessitating repeated biopsy. There are indications that Gleason 7 disease may be significant whereas Gleason 6 may not. In our study we did not detect a difference in EN2 levels between Gleason 6 and 7 patients, although such a correlation may be better explored with a larger cohort. Our results to date and the simplicity and low cost of EN2 testing justifies a prospective study of 6 monthly urinary EN2 testing in conjunction with other AS criteria, and this study is currently being designed.
There are currently large numbers of potential PC biomarkers in blood, urine and tissue under evaluation (reviewed in [13]). A significant association between low PCA3 scores and low tumour stage and grade has been reported [14,15]. In contrast, other studies have identified a correlation between high PCA3 scores and extra capsular extension [16], or have indicated no correlation with tumour volume or tumour grade [17,18]. Low levels of PCA3 were shown to correlate with low volume prostate cancer but not with higher volume and stage disease in the largest prospective study to date [19]. A logical future study would be to evaluate potential synergy of EN2 (predicting cancer volume) and PCA3 (predicting extracapsular extension) biomarkers in predicting significant disease. Furthermore, the potential utility of EN2 to aid in the active surveillance versus immediate treatment decision process may also be realised through its inclusion in continuous multivariable prediction models, such as nomograms [20]. There are a number of limitations with our study in terms of the cohort size and single network. However, confirmatory studies are currently ongoing in centers in Europe and the USA and EN2 will be evaluated concurrently with other urine and serum biomarkers concurrently with MRI imaging in the PROMIS study in the United Kingdom (http://www.controlled-trials.com/ISRCTN16082556).
This study confirms a strong correlation between urinary EN2 levels and both tumour volume and tumour stage in a prospective cohort as determined at RP. EN2 levels were significantly higher in men with disease volumes previously used to delineate significant versus non-significant disease. This study justifies a larger multicenter evaluation of urinary EN2 levels as a biomarker of PC significance using cancer volume, pathological and PSA criteria.
5. Acknowledgements
We would like to thank Sarah Stone our sample co-ordinator, Angie Boxall for assistance with the EN2 assay and Dr Ben Haagsma for reviewing all histology. This work was funded by the University of Surrey and the Prostate Project Charity, United Kingdom. We would like to thank the following for assistance with sample procurement and review of data: Agnieszka Michael, Richard Hindley, Philip Dundee, and Francesca Launchbury.
REFERENCES
- R. W. Veltri, M. C. Miller, G. J. O’dowd and A. W. Partin, “Impact of Age on Total and Complexed ProstateSpecific Antigen Cut offs in a Contemporary Referral Series of Men with Prostate Cancer,” Urology, Vol. 60, No. 4, 2002, pp. 47-52. doi:10.1016/S0090-4295(02)01695-3
- H. Lilja, D. Ulmert and A. J. Vickers, “Prostate-Specific Antigen and Prostate Cancer: Prediction, Detection and Monitoring,” Nature Reviews: Cancer, Vol. 8, No. 4, 2008, pp. 268-278. doi:10.1038/nrc2351
- S. M. Falzarano and C. Magi-Galluzzi, “Prostate Cancer Staging and Grading at Radical Prostatectomy over Time,” Advances in Anatomic Pathology, Vol. 18, No. 2, 2011, pp. 159-164. doi:10.1097/PAP.0b013e31820cb506
- J. E. Oesterling, S. J. Jacobsen, G. G. Klee, et al., “Free, Complexed and Total Serum Prostate Specific Antigen: The Establishment of Appropriate Reference Ranges for Their Concentrations and Ratios,” The Journal of Urology, Vol. 154, No. 3, 1995, pp. 1090-1095. doi:10.1016/S0022-5347(01)66984-2
- S. F. Shariat, A. Semjonow, H. Lilja, et al., “Tumour Markers in Prostate Cancer I: Blood-Based Markers,” Acta Oncologica, Vol. 50, No. S1, 2011, pp. 61-75. doi:10.3109/0284186X.2010.542174
- R. Morgan, A. Boxall, A. Bhatt, et al., “Engrailed-2 (EN2): A Tumor Specific Urinary Biomarker for the Early Diagnosis of Prostate Cancer,” Clinical Cancer Research, Vol. 17, No. 5, 2011, pp. 1090-1098. doi:10.1158/1078-0432.CCR-10-2410
- H. Pandha, K. D. Sorensen, T. F. Orntoft, et al., “Urinary Engrailed-2 (EN2) Levels Predict Tumour Volume in Men Undergoing Radical Prostatectomy for Prostate Cancer,” BJU International, Vol. 110, No. 6, 2012, pp. E287- E292. doi:10.1111/j.1464-410X.2012.11208.x
- J. I. Epstein, P. C. Walsh and H. B. Carter, “Dedifferentiation of Prostate Cancer Grade with Time in Men Followed Expectantly for Stage T1c Disease,” The Journal of Urology, Vol. 166, No. 5, 2011, pp. 1688-1691.
- T. Wolters, M. J. Roobol, P. J. van Leeuwen, et al., “A Critical Analysis of the Tumour Volume Threshold for Clinically Insignificant Prostate Cancer Using a Data Set of a Randomized Screening Trial,” The Journal of Urology, Vol. 185, No. 1, 2011, pp. 121-125. doi:10.1016/j.juro.2010.08.082
- H. U. Ahmed, M. Arya, A. Freeman, et al., “Do LowGrade and Low-Volume Prostate Cancers Bear the Hallmarks of Malignancy?” The Lancet Oncology, Vol. 13, No. 11, 2012, pp. e509-e517.
- L. Klotz, “Active Surveillance for Prostate Cancer: A Review,” Current Urology Reports, Vol. 11, No. 3, 2010, pp. 165-171. doi:10.1007/s11934-010-0110-z
- L. Salomon, O. Levrel, A. G. Anastasiadis, et al., “Prognostic Significance of Tumour Volume after Radical Prostatectomy: A Multivariate Analysis of Pathological Prognostic Factors,” European Urology, Vol. 43, No. 1, 2003, pp. 39-44. doi:10.1016/S0302-2838(02)00493-1
- J. R. Prensner, M. A. Rubin, J. T. Wei, et al., “Beyond PSA: The Next Generation of Prostate Cancer Biomarkers,” Science Translational Medicine, Vol. 4, No. 127, 2012, Article ID: 127rv3.
- G. Ploussard, X. Durand, E. Xylinas, et al., “Prostate Cancer Antigen 3 Score Accurately Predicts Tumour Volume and Might Help in Selecting Prostate Cancer Patients for Active Surveillance,” European Urology, Vol. 59, No. 3, 2011, pp. 422-429. doi:10.1016/j.eururo.2010.11.044
- H. Nakanishi, J. Groskopf, H. A. Fritsche, et al., “PCA3 Molecular Urine Assay Correlates with Prostate Cancer Tumor Volume: Implication in Selecting Candidates for Active Surveillance,” The Journal of Urology, Vol. 179 No. 5, 2008, pp. 1804-1809. doi:10.1016/j.juro.2008.01.013
- E. J. Whitman, J. Groskopf, A. Ali, et al., “PCA3 Score before Radical Prostatectomy Predicts Extracapsular Extension and Tumor Volume,” The Journal of Urology, Vol. 180, No. 5, 2008, pp. 1975-1979. doi:10.1016/j.juro.2008.07.060
- M. P. van Gils, D. Hessels, C. A. Hulsbergen-van de Kaa, et al., “Detailed Analysis of Histopathological Parameters in Radical Prostatectomy Specimens and PCA3 Urine Test Results,” The Prostate, Vol. 68, No. 11, 2008, pp. 1215-1222. doi:10.1002/pros.20781
- D. Hessels, M. P. van Gils, O. van Hooij, et al., “Predictive Value of PCA3 in Urinary Sediments in Determining Clinico-Pathological Characteristics of Prostate Cancer,” The Prostate, Vol. 70, No. 1, 2010, pp. 10-16. doi:10.1002/pros.21032
- M. Auprich, F. K. Chun, J. F. Ward, et al., “Critical Assessment of Preoperative Urinary Prostate Cancer Antigen 3 on the Accuracy of Prostate Cancer Staging,” European Urology, Vol. 59, No. 1, 2011, pp. 96-105. doi:10.1016/j.eururo.2010.10.024
- M. W. Kattan, “Do We Need More Nomograms for Predicting Outcomes in Patients with Prostate Cancer?” Nature Reviews Urology, Vol. 5, No. 7, 2008, pp. 366-367. doi:10.1038/ncpuro1128
NOTES
*The authors declare no conflict of interest.
#Equal contribution.
†Corresponding author.