Journal of Geographic Information System
Vol.08 No.03(2016), Article ID:67460,18 pages
10.4236/jgis.2016.83032
Investigating the Use of a Modified NSGA-II Solution for Land-Use Planning in Mediterranean Islands
Miltiades Lazoglou1*, Polychronis Kolokoussis2, Efi Dimopoulou2
1Department of Civil Engineering, Aristotle University of Thessaloniki, Thessaloniki, Greece
2School of Rural and Surveying Engineering, National Technical University of Athens, Athens, Greece

Copyright © 2016 by authors and Scientific Research Publishing Inc.
This work is licensed under the Creative Commons Attribution International License (CC BY).
http://creativecommons.org/licenses/by/4.0/


Received 13 May 2016; accepted 14 June 2016; published 17 June 2016
ABSTRACT
This paper explores the potential application of a modified version of the Non-dominated Sorting Genetic Algorithm (NSGA)-II for land-use planning in Mediterranean islands that constitute a geographical entity with similar characteristics. Study area is the island of Naxos, which is a typical Mediterranean island. In order to monitor the land-use changes of the island for the period 1987-2010, object-based classification of three Landsat images has been carried out. The 1987 land-use classification defined the initial population for the Genetic Algorithm (GA) and the aim was to provide the optimal development scenario for Naxos island taking into consideration legislation, geological characteristics and environmental parameters. The GA was used in order to introduce land use changes while maximizing transformation suitability, compactness, economic return, and minimizing soil erosion. The output of the GA was compared to the actual development of the island. The outcomes confirmed the proposed algorithm’s convergence process, while the GA solutions eventually formed a Pareto Front and performed adequately across all objectives. The GA algorithm has proposed reduction of Irrigated farming land by 16%, increase of Dry farming land by 131%, and the maximum allowed by the defined constraints increase of Urban land (100%), mostly on the eastern and central part of Naxos. These changes significantly differ from the actual development of the island. Economic return after optimization increased by 18%, while soil erosion decreased from 1948 t/y to 1843 t/y.
Keywords:
Land-Use Planning, Multiobjective Optimization, Genetic Algorithm, NSGA-II, Landsat, OBIA

1. Introduction
Resources have a prominent role in forming and implementing policies related to sustainable development [1] . However, investigating the optimal way that resources should be allocated to achieve certain objectives is a challenging venture. These problems are named Resource Allocation Problems (RAPs) [2] . Land is one of the most valuable resources, thus many RAPs are related to land-use allocation [1] , a term used to describe “the process of allocating different activities or uses to particular units of an area within a region” [3] . Such problems are multiobjective and present substantial computational complexity because: 1) multiple, sometimes even conflicting-parameters should be analyzed; 2) a plethora of possible solution-combinations should be assessed; 3) complex interactions amongst the allocated land parcels should be investigated and 4) they are linked to many fields [3] [4] . Hardly ever a unique solution optimizes these complex non-linear multiobjective problems sufficiently; thus these problems are characterized as non-deterministic polynomial problems and “require heuristic methods for executing optimization processes” [1] .
Mediterranean islands are distinct spatial units which share similar climatic, geological and hydrological characteristics as well as landscape and biodiversity and economic activities. Appropriate tools are required to facilitate resource allocation in Mediterranean islands, an issue of critical importance since insularity significantly influences the available resources and consequently all related policies.
This paper explores the potential application of a revised version of the Non-dominated Sorting Genetic Algorithm (NSGA)-II for land-use planning in the Mediterranean islands. Taking into consideration legislation, geological characteristics and environmental parameters, the NSGA-II was used to provide the optimal development scenario for a Mediterranean island. For this scope the Genetic Algorithm (GA) was programmed to introduce land use changes, while maximizing transformation suitability, compactness, economic return, and minimizing soil erosion. NSGA-II is a widely used algorithm and a comparison standard thus the authors consider using this algorithm as a starting point for their research on land-use allocation in islands, while more comparative studies are to be developed. According to literature [5] , NSGA-II GA has already been successfully used in order to solve land-use allocation problems which have four objectives, as it performs sufficiently in comparison to other heuristic algorithms. Naxos island as study area is a mid-sized Mediterranean island with typical Mediterranean landscape, mid-sized urban settlements, biodiversity and climatic characteristics, with its economic activities evenly distributed amongst all sectors and uncountable cultural wealth.
Besides the NSGA-II modification, this research work also addresses the adaption of the NSGA-II to Mediterranean islands for land-use optimization, which requires further restrictions to be introduced such as legislative constraints, land-use/land-cover patterns, erosion parameters etc. It is expected that the outcomes of this research could provide a tool for supporting land-use planning in Mediterranean islands, based on a modified version of the NSGA-II or another relevant algorithm. Such a tool could contribute in improving the economic and environmental effectiveness of the proposed development priorities. Furthermore, the social structure of the specific islands will be reinforced as allocating land-uses in an optimal pattern in distinct spatial units, which present entirely different characteristics to the mainland, reassuring the “long-term balance between economic development, environmental protection, efficient resource use, and social equity” [1] .
Section 2 presents a literature review of the main methodologies, used to manage multiobjective problems, along with the characteristics of the Pareto front methodology [6] . The primary attributes and operators of the NSGA-II are described in Section 3, whereas Section 4 exhibits the materials and methods used. Section 5 summarizes the results produced. Finally, the emerging issues for future research as well as conclusions of this paper are summarized in Section 6.
2. Multi-Objective Optimization and Pareto Front
In order to solve land-use allocation problems two types of methodologies can be applied. The first type is the weighted sum methodologies, which turn “the multiobjective optimization problem (MOP) into a single-objec- tive optimization problem (SOP) by taking the linear weighted sum of the multiple objectives” [3] . These methodologies can “shape of the Pareto front by iteratively adjusting the associated weights of different objectives and repeatedly applying the single-objective optimization techniques” [3] . These methodologies are straightforward and present better efficiency and effectiveness when used to deal with fully structured problems for which a limited number of possible solution-combinations, a small number of allocable land units as well as a low number of repeats would be sufficient to optimize all their objectives [3] . However, they require prior knowledge of the problem under assessment and generate unevenly distributed solutions ignoring Pareto front [3] [7] . The second type of land-use allocation methodologies concerns the heuristic methodologies [8] . These methodologies facilitate delineating the relations developed among the objectives of the problem under investigation [3] . Many heuristic computation methods aiming to solve resource allocation problems are reported and the most prominent amongst them [1] are: the simulated annealing (SA) algorithms, the ants algorithms, and the genetic algorithms (GA), which have a prominent role in this process [9] [10] . These heuristic techniques “although cannot guarantee the optimal land-use combination, are able to generate a near-optimal one within a reasonable time” [3] by “simulating physical phenomena, biological processes or swarm behavior” [3] . During the last decades many research efforts aiming to apply evolutionary computation methods to solve RAPs are reported in literature [11] - [17] .
GAs have a prominent role in this process because they can improve the performance of spatial algorithms used to achieve land-use allocation [18] , while they also enable the analysis of various factors (e.g. large solution space, problems characterized by uncertainties). Applying these algorithms in land-use planning problems has flourished over the past two decades. A MultiObjective Genetic Algorithm was successfully used by Matthews [19] to handle a land-use allocation problem. In order to minimize soil erosion and maximize benefits in Brimvand watershed in Iran a multiobjective linear algorithm was introduced by Niaraki and Kim [20] . Huang et al. [3] used the Artificial Immune System for MultiObjective Land-use Allocation (AIS-MOLA) GA in order to find the optimal allocation pattern in large-scale allocation problems. Eldrandaly [21] introduced an online Geographic Information System (GIS) platform combined with Gene Expression Programming (GEP) to distribute three experimental land-use types. Hajehforooshnia et al. [22] allocated the zones of a wildlife sanctuary using the MultiObjective Land Allocation (MOLA) GA. Cao et al. [23] solved land-use allocation problems by embedding parallel computing techniques and the NSGA-II. Porta et al. [24] created a hybrid system that combined genetic algorithms and Java to create land-use scenarios. Shaygan et al. [5] proved that NSGA-II performs successfully in comparison to Goal Attainment-MultiObjective Land Allocation (GoA-MOLA). Researchers [25] presented a revised version of NSGA-II, named NSGA-III, to deal with issues, which include four or even more objectives while another version, named Reference point-based NSGA-II facilitates the specification of reference points by the users to “guide the search in the objective space and the diversity of the focused Pareto-set can be controlled” [26] .
Real world problems relate to many and complex objectives. Therefore, it is imperative to investigate whether there are more than one allocation patterns that produce near optimum results. This process is named multiobjective allocation and aims to “reveal the possible solutions with relative efficiency in all objectives selected” [3] . The term optimality is used in multiobjective problems to describe the process of “making the best possible compromise between objectives” [27] .
The most prominent method to reveal the shape of a collection of solutions is acknowledged as Pareto optimal alternatives [6] , while its “image in objective space is called the Pareto front” [11] , which shows the “solutions whose performance on one objective cannot be improved without sacrificing performance on at least one other” [11] . This has been identified as Pareto optimality [6] . A crucial meaning in forming a Pareto front is the concept of Pareto dominance meaning that “one alternative dominates another in case it is superior in pairwise comparison for at least one objective and has at least equal performance on the rest objectives” [27] . A Pareto optimal solution is formed when the domination process is finished thus “a non-dominated set is usually used as an approximation of the true Pareto front” [11] . Mathematically in such a problem with k objectives, “a solution  dominates another
  if” [11] :
 (1)
(1)
where: fi(x) is the objective function value of objective i for a solution x;
XA is a solution;
XB is a solution;
k are the objectives pursued.
3. The NSGA-II Model
In NSGA-II in order to “sort the population at different fronts the non-dominated ranking method” is used [28] [29] . The goals of NSGA-II according to Shaygan et al. [5] are to: 1) build a population of individuals; 2) use the non-domination level to rank and sort each individual; 3) create new sets of offspring; 4) combine parents and offspring before proposing new allocation patterns; 5) design a Pareto front by estimating a crowding distance among each individual.
The crowding distance is a crucial parameter for the NSGA-II [13] [30] . This term is used to describe a procedure that “estimates the density of solutions surrounding a particular solution” [31] by assessing “the average distance between two points on either side of this point along the objective axes” [30] . In most allocation problems, a loop is generated to estimate “all crowding distances for each solution activated” [3] .
A chromosome is designed in NSGA-II to outline a solution to a problem, while the genes of the chromosome are parameters of the problem [2] . A set of chromosomes is formed by using the initialization, crossover and the mutation operators of the NSGA-II [1] [2] .
3.1. The Initialization Operator
The selection of the initial population acquires a vital importance for the NSGA-II [1] [3] . Proper chromosome initialization makes an allocation process less expensive, faster and more efficient, particularly in large and complex problems [2] [30] . Thus, guidance in generating satisfactory initial solutions may be implemented to achieve optimal results.
3.2. The Crossover Operator
This operator designs suitable cell patterns by performing an active evolutionary process [2] . A crossover operator “exchanges randomly genes between two chromosomes, allowing them in this way to find beneficial parts of a certain area” [3] [31] . Many researchers working on land-use allocation problems have proposed the use of two-dimensional crossover operators, which are more appropriate when working with spatial data [2] [3] [5] [29] . However, in this work the standard two point binary crossover [32] has been used as it will be explained later on.
3.3. The Mutation Operator
NSGA-II uses a mutation operator to generate offspring or to improve the offspring created by the crossover operator. It “randomly picks a unit and changes its land-use to find a better pattern of allocation according to the parameters implemented” [31] . Some researchers have also proposed special mutation operators for land-use allocation problems [2] , but in this work a general mutation operator has been used, which interchanges the values of two randomly chosen genes.
4. Materials and Methods
In this section, the main characteristics of the study area, data processing, and model formulation are described.
4.1. Study Area
Naxos (Figure 1) is the largest island of the Greek Cyclades islands (429 sq). It is located in the center of the Aegean Sea (latitude 37˚6'20"N and longitude 25˚22'35"E) and belongs to the South Aegean Region. Zeus (1004 m) and Fanari (908 m) are the highest mountains of Naxos island, thus, its terrain is characterized mountainous. The geological background of Naxos island consists of schists, gneisses, and marbles in alternating layers with granodiorite and granitoid.
4.2. Data
GIS and remotely sensed data were used in this study. The GIS data used were GIS layers related to rivers, lakes, streams, roads, Natural 2000 preservation sites, wildlife sanctuaries, small island wetlands, available by the Greek Government’s National Spatial Data Infrastructure [33] . The preliminary foreshore of Naxos island, where certain legislation restrictions apply, was provided by the National Cadastre and Mapping Agency of Greece.
For the longitude monitoring of the study area three Landsat TM images for the years 1987, 2001 and 2010 were used. These images have been classified using Object-Based Image Analysis (OBIA) software and in particular eCognition Developer version 8.7. The Landsat TM images were inserted into the same project, and

 (a) Landsat TM image of Naxos. Color composite 321(RGB) (b) 1987 classification
 (c) 2001 classification (d) 2010 classification
Figure 1. Landsat TM image of Naxos and classification results for 1987, 2001 and 2010.
three segmentation levels have been created, one for every Landsat TM image. The multiresolution segmentation [34] parameters were: scale = 3, shape = 0.3 and compactness = 0.5 taking into consideration all but the thermal bands of the three images, to produce the same segments in all images. Training and test areas have been selected on screen by photo interpretation supported by ground truth and ancillary data and two masks have been created, one for training and one for testing. Training and test areas were selected in places where no land-use changes have taken place during the twenty three years period under examination, common in all images. Seven classes have been used for classification, namely: Irrigated farming land, Dry farming land, Grasslands, Forests, Urban land, Water, and Other. The Water areas were classified using a fuzzy membership function rule based on NDWI [35] (NDWI > 0, fuzzy space: −0.02 to 0.02). Standard Nearest Neighbor rules have been used for the rest land-use classes. A fuzzy membership function rule has also been added to the Urban land-use category, not permitting a segment to be classified as Urban land in an older image if Urban land did not exist in the newer images. The overall accuracy of the three classifications was 82%, 81% and 84% for 1987, 2001 and 2010 respectively. The relevant Kappa coefficients of agreement [36] were 0.79, 0.78 and 0.81. Figure 1 presents Naxos island, as along with the land-use maps compiled, while Table 1 shows the diachronic changes of land-uses in the study area, according to the statistics of these maps.
The comparison between 1987 and 2001 classification (Table 1) reveals that during these years there was 6% increase in Irrigated farming land and 17% increase in Dry farming land, whereas the highest increase rate (60%) concerned Urban land. Furthermore, the comparison of 1987 classification with the classification of 2010 shows that the Dry farming land increased by 53%, the Irrigated farming land areas increased by 37%, while the Urban land increased by 112%.
4.3. Model Formulation and Algorithm Realization
The model was designed and built in Ansi C based on the programs provided by Deb et al. [37] in their website [38] . The original programs have been modified in order to work with classification images of remotely sensed data as well as other raster GIS layers.
The basic concept for the model formulation was that a set of land-use parcels can be considered as a chromosome. Following this concept, each land-use parcel is considered as a gene as described in Section 3. In our case, a set of land-use parcels of n rows (n = 160) and m columns (m = 122) with a spatial resolution of 216 m represents the study area of Naxos island. Thus, if all land-use parcels are taken into consideration, a chromosome with 122 × 160 = 19,520 genes would be created and each gene, coded as a binary variable, would have as many bits as the considered classes as below [5] :
 (2)
(2)
where: Land is the chromosome;
lui,j are the land-use parcels.
Each spatial unit (pixel) of the land-use map is considered as a binary variable lui,j and each land-use class is assumed to be a decision variable, lu [5] :
 (3)
(3)
where: 1 = Irrigated farming land
2 = Dry farming land
3 = Grasslands
4 = Forests
5 = Urban
6 = Water
7 = Other
Herein, it has to be pointed out that in this work the chromosome has been designed to be a single and not two-dimensional chromosome. But it has to be added that apart from the land uses, which are coded as genes of

Table 1. Diachronic land-use changes in the study area in hectares.
the chromosome, the spatial position for each land-use parcel (pixel) is also stored. In this way, the NSGA-II is applied using single-dimensional chromosomes and is simpler and faster, while the objective functions and the restrictions are applied in two dimensions. Due to this chromosome design, no two-dimensional crossover operator could be applied and therefore the two point binary crossover operator [32] has been employed.
During the realization of the algorithm, some basic optimizations and feature additions took place. Aiming to increase the speed of the multiobjective optimization algorithm execution and reduce the population size, not all pixels of the classification are read into the population. The user may exclude the classes which have to remain unchanged (i.e. Water; Forests etc.). Only the remaining classes are considered to account in the population. In addition, an option is given to the user, to lock some classes in order that although these classes can be created by the genetic algorithm, their current patches should remain unchanged (i.e. existing urban land). Since the initialization of the algorithm is important for the algorithm to converge fast, the initial population is not random. Instead, the current land use/cover status (from a raster land use map or a classification image) defines the initial population. Another feature that has been added to the original programs is the ability to read a number of other raster GIS layers, that can be utilized: a) for the realization of the objective functions (i.e. slope map, geology map, etc.); b) for the application of constraints (i.e. preservation sites); and c) as masks for certain areas that should remain unchanged and thus are also excluded from the population.
In Naxos island, the main idea was to begin with the land-use status of the island in 1987, calculate an optimal development scenario using the modified NSGA-II, and compare it with the actual development of the island, as it has been assessed by the 2001 and 2010 classifications. Therefore, the genes of the initial population were not random but were rather read directly from the 1987 classification image. The land-use classes Water and Forests were excluded from the population, since these classes should remain unchanged. Additionally, a small island at the southeast of Naxos (Iraklia) has been masked out. With these exclusions the initial population was reduced by 70%, from 19,520 to 6032 genes. The Urban land category was locked, in order that the optimization algorithm could create Urban land but already existing Urban land should not be transformed to any other land use.. Moreover, a number of raster GIS layers have been used for the objective functions and the constraints. These layers are presented later on at the relevant sections describing the objective function and constraint definitions.
As far as it concerns the algorithm runtime parameters, the population size is directly read from the classification image, after taking into consideration the excluded classes and/or masks, and its maximum size depends on the computer’s physical memory, as using swap memory would vastly increase the algorithm execution time. The crossover and mutation probability rates are defined by the user, although the optimum mutation probability rate equals 1/(total number of bits). The algorithm iterations as well as number of generations are provided by the user. The realization of the algorithm was performed on a Core Duo E8400 Processor @ 3.0 GHz with 8.0 GB RAM and linux operating system. A population of 6032 genes (binary variables) with 5 bits each (5 active classification classes) was almost the maximum population that could be used with 8.0 GB of RAM. The optimum mutation probability rate for this population was 3.3 × 10⁻⁵, and a crossover probability rate of 0.7 was used.
4.4. Objective Functions and Constraints
The problem described in this study is formed using four objective functions that aim to maximize economic return, transformation suitability, land-use patch compactness, and to minimize soil erosion. The algorithm has been formulated in a way that attempts to minimize all the given objective functions, and therefore if a function should be maximized (i.e. economic return objective) then the negative of the function value is used.
4.4.1. Economic Return Objective
Different land-use patterns yield different economic benefit. Therefore, it is crucial to allocate land-uses in a way to maximize economic benefit without deteriorating the priorities of sustainable development. The maximum economic economic return (Z1) per year, was calculated using Formula (4). According to up to date market values and empirical evidence for Greek islands, Urban land should be rated twelve times the value of Grasslands, six times the value of Dry farming land and three times the value of Irrigated farming land.
 (4)
(4)
where: Z1 represents the economic return objective;
eclu,i is the economic return from land-use lu applied in unit i;
lu is each land-use class;
LU is the total number of land-use classes;
P stands for the total population of the units.
4.4.2 Compactness Objective
Compactness includes two separate concepts that are continuity and compatibility. “Contiguity requires all cells of the same land-use to be connected while compatibility arranges cells to clusters” [1] . From the above analysis, it can be concluded that compatibility includes contiguity. In this study, the term compactness is used to describe these relations. Compactness increases accessibility, promotes social equity, decreases energy consumption [1] and contributes to the efficient utilization of resources [39] . In urban planning, compactness is combined with high density, and mixed land-uses. Sustainability priorities link compactness to social equity and justice [40] . These are important objectives in land-use allocation problems, but difficult tasks to solve. The compatibility values among land-uses (Table 2) were calculated after analyzing literature review [1] and empirical evidence.
The following Formula (5) has been used to calculate the compactness objective (Z2) [5] :
 (5)
(5)
where: Z2 represents the compactness objective;
Comcc' is the compatibility between class c and class c' (Table 2);
Conc shows the number of cells in the neighborhood of cell (i,j) in the same class;
d is the search distance from the central cell.
In the developed modified NSGA-II model the distance d can be selected by the user for contiguity and compatibility independently. In the final run of the developed model d has been defined as 1, leading the algorithm to work in a 3 × 3 window size. This is the best choice for the compatibility objective since it will examine truly neighboring land-use classes. A value of d = 1 worked fine for contiguity as well, while other choices like d = 2 or d = 3 led to worse results for this case study.
4.4.3. Transformation Suitability Objective
This objective function optimizes the land-use change from the current status of each parcel to a new land-use [41] . In our case study, since the land parcels belonging to the “Οther” land-use class are wasteland and therefore cannot be used for agriculture, using this objective these land parcels were favored to be transformed to Urban land. Moreover, exchange of farming type was allowed, while Grasslands were allowed to be transformed to all other categories apart from “Οther”. The following table presents the from-to transformation suitability values used for this objective (Table 3).
The following formula has been used for this objective:
 (6)
(6)
where: Z3 represents the transformation suitability objective;
Suitcc' is the transformation suitability factor for transforming land-use c to c';
P is the total population of the land parcels under consideration.
Table 2. Land-use compatibility values.
Table 3. Transformation values.
4.4.4. Soil erosion Objective
Soil erosion is a factor that has a serious impact on agricultural productivity since it critically affects land quality [42] . In order to calculate erosion the Revised Universal Soil Loss Equation (RUSLE) [31] [43] was used [5] :
 (7)
(7)
where: Ri is the rainfall erosivity factor for unit i;
Ki is the soil erodibility factor for unit i;
LSi is the slope length and steepness factor for unit i;
Ci is the cover and management factor for unit i;
Pi is the support practice factor for unit i.
The following formula has been used to calculate the erosion (Z4), in tons per year [5] :
 (8)
(8)
where: Z4 represents the soil erosion objective;
erlu,i is the erosion of land-use (lu) on a unit i (ton/ha*y);
P is the total population of the land parcels under consideration.
In a small island, the rain pattern and intensity can be considered as uniform and since no data were available for the area the rainfall factor R has been considered constant. No soil maps were available for the island and, therefore, a geology map has been used in order to estimate K. An experienced researcher-geologist, who has repeatedly worked on this particular island, taking into consideration certain classes of the geological map, and considering the soil existing above, has proposed 5 classes for K factor as displayed in Table 4.
Thus, a raster GIS layer for K factor has been created and entered as input to the algorithm (Figure 2).
The LS factor has been created with SAGA GIS using a method proposed by Moore et al. [44] and was used as another raster GIS layer into the algorithm.
Cultivation terraces, is one of the oldest means to reduce soil loss [45] . This cultivation practice is extremely popular in islands due to their efficacy to stop or reduce soil loss. Taking this into consideration, C and P factors have been defined according to relevant literature [46] [47] (Table 5).
4.4.6. Constraints
In order to obtain a balanced land use allocation pattern, six hard constraints were introduced to the algorithm:
・ The first three constraints were related to allowable slopes. The maximum acceptable slopes for Dry farming land, Irrigated farming land, and Urban land were 15%, 8%, and 25% respectively [5] . For this constraint to be realized, a slope map has been created as raster GIS layer which was used as input to the algorithm (Figure 3). This constraint can be defined with Formula (9):
 (9)
(9)
where: Slopei is the slope of land-use parcel I;
 is the maximum allowable slope for land-use.
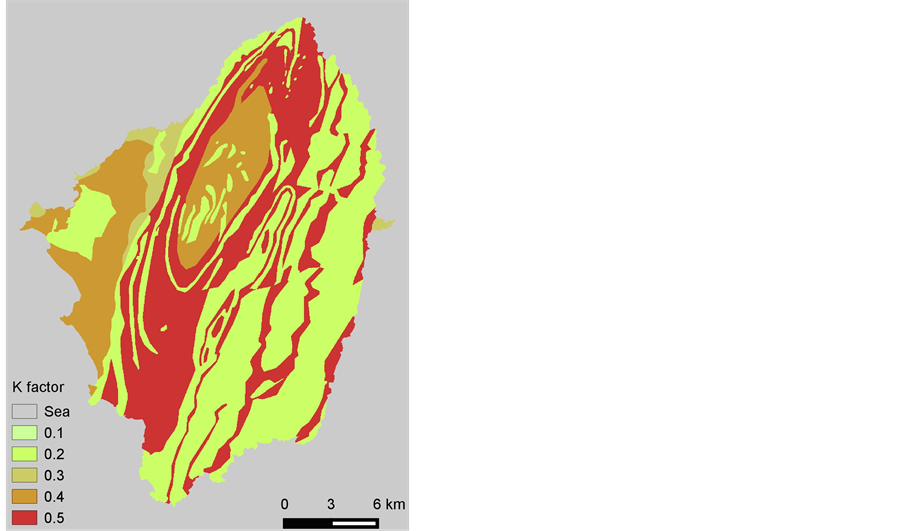
Figure 2. The K factor raster GIS layer.
Table 4. Estimation of soil erodibility factor (K) based on geological map classes.
Table 5. The C and P factor values which have been used.
・ A fourth constraint regarding the maximum land that can be transformed into Urban land was implemented. Since the model was applied to a Greek island, the relative results of the Greek Censuses held in the last 40 years were considered. Based on these data an upper limit of 100% increase was set for the Urban land parcels.
 (10)
(10)
where: Urbi shows the number of land-use parcels which are transformed to urban;
Urbinit is the initial urban land-use parcels;
q is the desired percent for maximum urban increase;
P stands for the total population of the units.

Figure 3. Slope map of Naxos island.
As the model developed concerns a Greek island, the relevant provisions of the Greek legislation were also considered. Urban land was not allowed to be allocated to wildlife sanctuaries, small island wetlands, and Natural 2000 network areas. Furthermore, certain constraints related to Urban land were introduced as shown in Table 6. All these partial constraints have been combined as the fifth constraint by creating a mask GIS raster layer that defined areas where Urban land class category should not be introduced (Figure 4) because of institutional provisions.
The following Formula (11) applies the urban restriction constraint:
 (11)
(11)
where: Urban_maski is the urban restriction mask value for land-use parcel i. In restricted areas Uran_mask equals 0.
・ Finally, a sixth constraint has been applied for the “Other” category, not allowing this category to be generated in areas where it did not already exist. For this constraint to be realized, the Landsat TM classification of 1987 has also been used as GIS raster layer reference and used in the problem definition of the algorithm. The following Formula (12) defines this restriction:
 (12)
(12)
where: lui is the class assigned to land-use unit I;
Classi is the class value of the reference raster;
K is an auxiliary variable which should be greater or equal to 0.
5. Results and Discussion
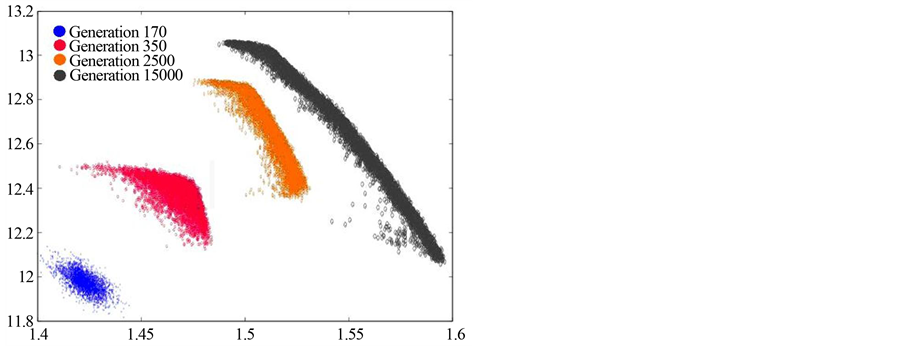
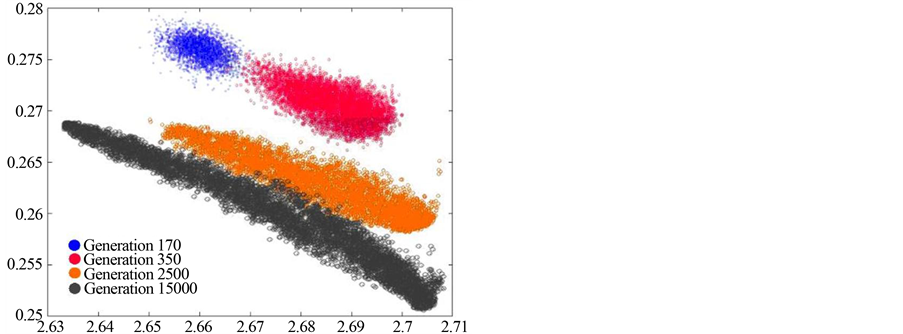
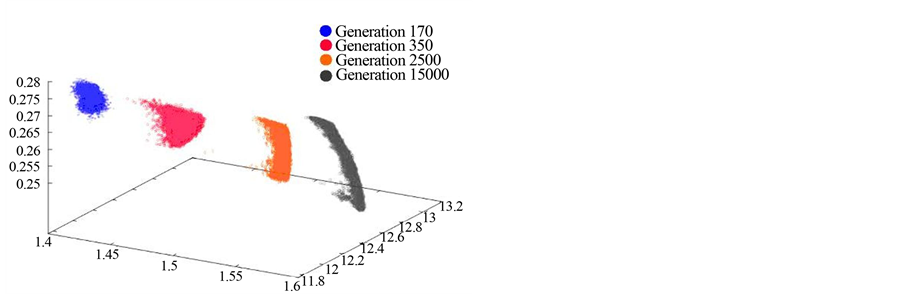
The proposed NSGA-II algorithm was set to run for 15,000 generations in order to handle the described objectives, variables, and constraints. The first feasible solution has been achieved in generation 166 and Figure 5 presents four graphs which show the progress of this iteration process for certain combinations of objective functions. In these graphs blue points represent the 170th generation solutions, cerise points represent the 350th generation solutions, orange points represent the 2500th generation solutions, and grey points represent the final solutions belonging to the last generation of the algorithm. The graphs in Figure 5 reveal that better solutions are progressively achieved with respect to the objectives while the scatter of the solutions among the objectives constantly becomes narrower and ultimately forms a Pareto Front. This stepwise graph clearly demonstrates the
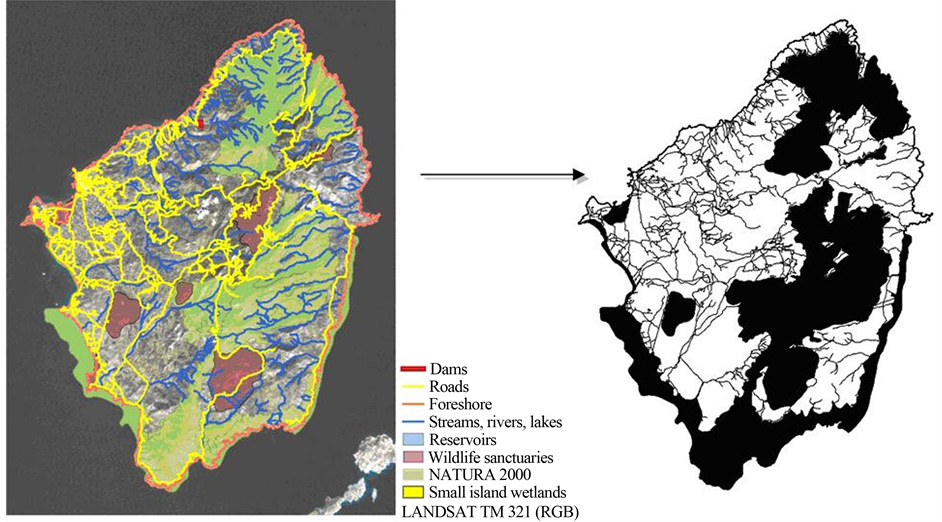
Figure 4. Urban restriction mask.
 (a) (b)
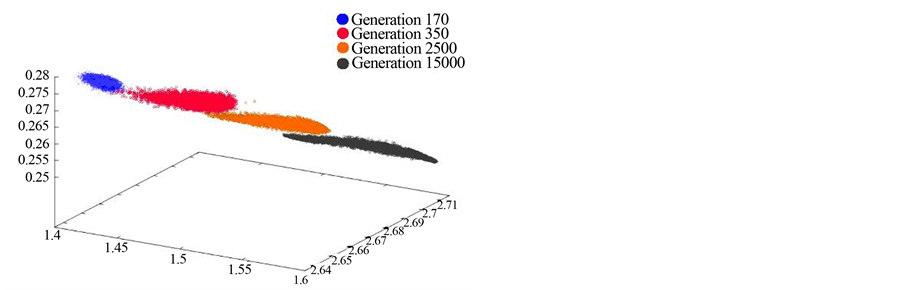
 (c) (d)
Figure 5. NSGA-II algorithm convergence process.
Table 6. Institutional constraints related to urban land.
converging process of the proposed algorithm.
The examination of the objectives in two (Figure 5(a), Figure 5(b)) or three (Figure 5(c), Figure 5(d)) dimensions reveals that the algorithm performs sufficiently across all objectives. This trend is also demonstrated in Figure 6 that relates the per pixel average value of the objective functions to the generations created. Since, the problem has been formulated in such way that all objective functions are being minimized the average value of global solutions should decrease as the generation number increases. It can be noticed that a vast decrease has been achieved by the 4000th generation, and the algorithm could have been terminated in generation 5000 providing good solutions. Nevertheless, somewhat better solutions seem to have been achieved around the 10,000th generation while no further improvement was achieved after that point.
A large number of solutions (1279 solutions) lie on the Pareto front and “can be used to derive a suitable solution when considered against the qualitative requirements of different users” [29] . Different scenarios can be drawn as to which solution would be best for a specific area and whether the user should prefer an equally weighted solution or a solution that would favor certain objective function extremes. The “equal weight preferred solution possibly has the most balanced land use distribution” [29] and is the one that we have selected as the best solution in this study.
Table 7 summarizes land-use changes between the initial classification (1987) and the NSGA-II best solution. The modified NSGA-II model proposed to reduce the Irrigated farming land by 16.2% (552 ha decrease) mainly by transforming it into Dry farming land, and to increase Dry farming land by 131.5% (2003 ha increase). The reduction of the irrigated farming land seems to be caused by the slope constraints and the soil erosion objective. With this change, the multiobjective optimization algorithm managed to decrease the soil erosion from 1948 t/y to 1843 t/y. Besides the slope and erosion factors, since water reserves in Cyclades islands are rather low, the reduction of the irrigated farming land could be useful although it would decrease economic return. An impressive increase is proposed by the algorithm regarding Dry farming, and this is mainly caused by the economic return objective. The NSGA-II model also proposed the maximum allowed by the constraints increase for Urban land (100%) mostly on the eastern and central part of the island. Theoretically, the more urban areas are built, the higher economic return is achieved, taking into account an upper limit, above which degradation of the environment will occur. Within this framework, as mentioned in the constraints section, Urban land increase constraint was set to 100%, close to reality (Table 1). It has to be noted that executing the algorithm with different parameters (i.e. 5000 generations) or different number of locked categories (i.e. Urban land, Irrigated farming land and Dry farming land) the proposed new Urban land was more or less located in the same areas. Economic return after optimization increased by 18%.
Concerning agricultural land, the NSGA-II algorithm, given the defined objectives and constraints, proposed (Figure 7) that some parts of Naxos island used for Dry farming in the central part of the island in the classification of 1987 should be turned into Grassland, due to incompatible slopes. According to the NSGA-II best solution the Dry farming practices should be allocated mainly to the central and western part of the island because of its geomorphology.
Moreover, according to the NSGA-II best solution, many land parcels used for Irrigated farming land in the eastern part of Naxos island should be turned into Dry farming land because of the sharp slopes of the area. Farmers though, prefer irrigated farming which is more profitable, despite water deficiency, higher soil erosion and incompatible slopes.
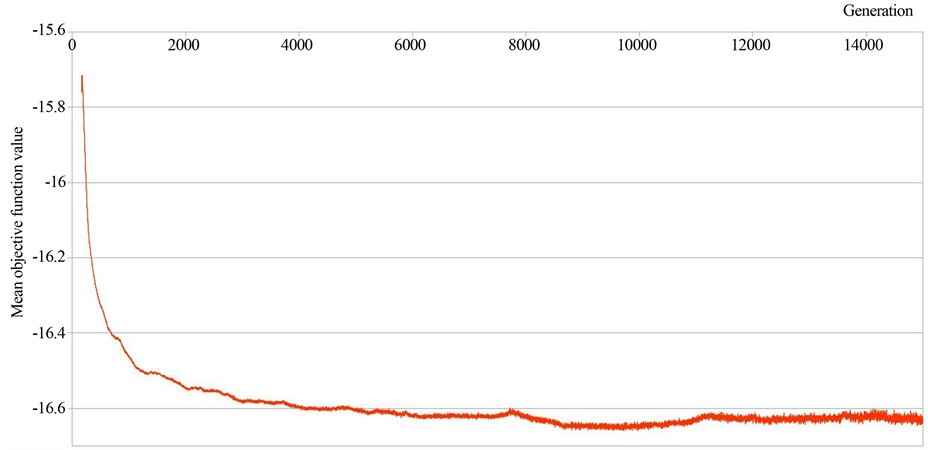
Figure 6. The average per pixel objective function value of each generation.
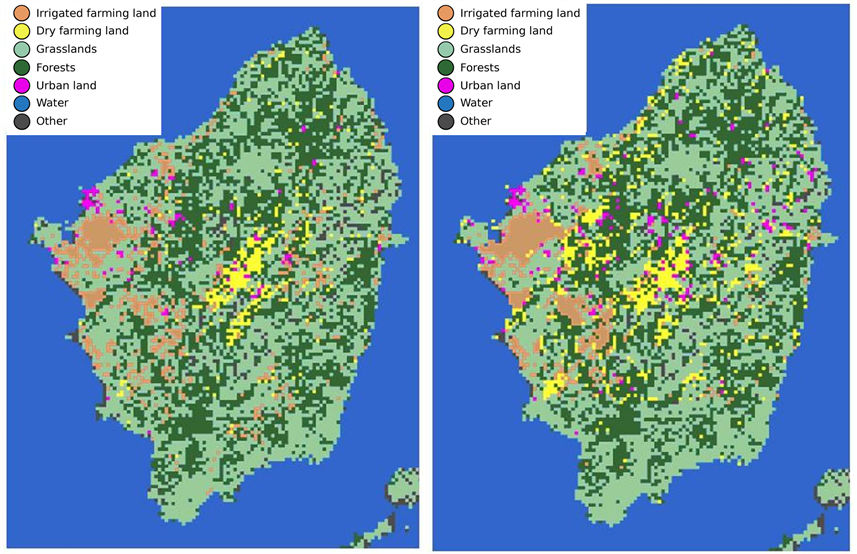
Figure 7. The initial classification (1987) and the optimum result of the NSGA-II algorithm (after 15,000 generations).
Cyclades islands are touristic, and high pressure for Urban land increase occurs, which was not seriously considered during the NSGA-II model definition. This can be clearly seen in the 2010 classification, as the Urban land has increased by 112%, in comparison to the 1987 classification, and most of it have been constructed at the southwest part close to popular beaches of Naxos island. Thus, in order for the multiobjective optimization algorithm to provide more realistic results, the need for touristic development, which constitutes the main income of Naxos population, should also have been formulated as another objective function.
This analysis reveals that the optimal development of Naxos island should be based on agriculture, especially dry farming, together with balanced and not unilateral urban/touristic development, uniformly over the island
Table 7. Land use/cover changes between the initial classification (1987) and the best NSGA-II result generated within 15,000 generations.
and not just located around the coastline. Focusing on the word “balanced”, different scenarios and weights for every objective function should be evaluated during the best solution selection, while in this paper all objectives were equally weighted. In a later stage, weights could also be imposed to the current objectives in order to improve the proposed model and produce more realistic results.
6. Conclusions
Resource allocation problems necessitate addressing various and usually conflicting objectives. Multi-objective heuristic Pareto-front-based methodologies provide the mechanism to resolve this challenge. In land-use allocation, these methodologies aim to allocate certain land-uses to each land unit.
A heuristic algorithm which aims to support land-use allocation problems on Mediterranean islands has been presented in this paper. The proposed algorithm is a modified version of the NSGA-II, adjusted to allocate land-uses in Mediterranean islands taking into consideration legislation, geological characteristics, economic and environmental parameters.
The effectiveness of the modified NSGA-II algorithm was validated in a land-use allocation problem, which included four objectives, namely economic return growth, transformation suitability, maximum compactness, and least possible soil erosion, as well as six constraints, concerning geomorphology, legislation and urban development limitations. The results showed that the algorithm performed sufficiently, and could be possibly used to address even more objectives and constraints.
Comparing the development proposed by the GA with the actual development of the island, it should be noted that, in order to get more realistic results for land use planning in Mediterranean islands, the multi-objective optimization algorithm should also involve the interaction of touristic development, existing infrastructure, land ownership and environmental resources. Moreover, aiming at a more balanced development, different scenarios and weights for every objective function should be evaluated during the best solution selection, while in this paper all objectives were equally weighted.
NSGA-II is a widely used algorithm and a comparison standard, thus the authors use this algorithm as a starting point for their research on land-use allocation in Mediterranean islands. This research will be extended to other relevant multi-objective optimization algorithms for land-use planning, some of which can better handle larger number of objectives. Weights, interdependencies and uncertainties could also be imposed to the objective functions and constraints in order to improve the multi-objective optimization model and produce more balanced results.
Acknowledgements
This research was generously supported by ΙΚΥ Fellowships of Excellence for Postgraduate Studies in Greece-Siemens Program. The authors would like to acknowledge gratefully Dr Irene Galanos for her support on geological issues, and the National Cadastre and Mapping Agency of Greece for providing the preliminary borderline of the coastline of Naxos island.
Cite this paper
Miltiades Lazoglou,Polychronis Kolokoussis,Efi Dimopoulou, (2016) Investigating the Use of a Modified NSGA-II Solution for Land-Use Planning in Mediterranean Islands. Journal of Geographic Information System,08,369-386. doi: 10.4236/jgis.2016.83032
References
- 1. Cao, K., Huang, B., Wang, S. and Lin, H. (2012) Sustainable Land Use Optimization Using Boundary-Based Fast Genetic Algorithm. Computers, Environment and Urban Systems, 36, 257-269.
http://dx.doi.org/10.1016/j.compenvurbsys.2011.08.001 - 2. Datta, D., Fonseca, C.M. and Deb, K. (2008) A Multi-Objective Evolutionary Algorithm to Exploit the Similarities of Resource Allocation Problems. Journal of Scheduling, 11, 405-419.
http://dx.doi.org/10.1007/s10951-008-0073-9 - 3. Huang, K., Liu, X., Li, X. and Liang, J. (2012) An Improved Artificial Immune System for Seeking the Pareto Front of Land-Use Allocation Problem in Large Areas. International Journal of Geographical Information Science, 27, 922-946.
http://dx.doi.org/10.1080/13658816.2012.730147 - 4. Malczewski, J. (1999) GIS and Multicriteria Decision Analysis. John Wiley & Sons Ltd., Sussex.
- 5. Shayga Dn, M., Alimohammadi, A., Mansourian, A., Govara, Z.S. and Kalami, S.M. (2013) Spatial Multi-Objective Optimization Approach for Land Use Allocation Using NSGA-II. IEEE Journal of Selected Topics in Applied Earth Observations and Remote Sensing, 7, 906-916.
http://dx.doi.org/10.1109/JSTARS.2013.2280697 - 6. Pareto, V. (1971) Manual of Political Economy. Macmillan Publishers, New York.
- 7. Aerts, J.C., Eisinger, E., Heuvelink, G. and Stewart, T.J. (2003) Using Linear Integer Programming for Multi-Site Land-Use Allocation. Geographical Analysis, 35, 148-169.
http://dx.doi.org/10.1111/j.1538-4632.2003.tb01106.x - 8. Balling, R.J., Taber, J.T., Brown, M.R. and Day, K. (1999) Multiobjective Urban Planning Using Genetic Algorithm. Journal of Urban Planning and Development, 125, 86-99.
http://dx.doi.org/10.1061/(ASCE)0733-9488(1999)125:2(86) - 9. Goldberg, D.E. (1989) Genetic Algorithms in Search Optimization and Machine Learning. Addison-Wesley, Reading.
- 10. Holland, J.H. (1975) Adaptation in Natural and Artificial Systems: An Introductory Analysis with Applications to Biology, Control, and Artificial Intelligence. University of Michigan Press, Michigan.
- 11. Duh, J.D. and Brown, D.G. (2007) Knowledge-Informed Pareto Simulated Annealing for Multi-Objective Spatial Allocation. Computers, Environment and Urban Systems, 31, 253-281.
http://dx.doi.org/10.1016/j.compenvurbsys.2006.08.002 - 12. Eastman, J.R., Jiang, H. and Toledano, J. (1998) Multi-Criteria and Multi-Objective Decision Making for Land Allocation Using GIS. In: Beinat, E. and Nijkamp, P., Eds., Multicriteria Analysis for Land-Use Management, Springer, Dordrecht, 227-251.
http://dx.doi.org/10.1007/978-94-015-9058-7_13 - 13. Srinivas, N. and Deb, K. (1994) Multiobjective Optimization Using Nondominated Sorting in Genetic Algorithms. Evolutionary Computation, 2, 221-248.
http://dx.doi.org/10.1162/evco.1994.2.3.221 - 14. Deb, K., Agrawal, S., Pratap, A. and Meyarivan, T. (2000) A Fast Elitist Non-Dominated Sorting Genetic Algorithm for Multi-Objective Optimization: NSGA-II. In: Schoenauer, M., et al., Eds., Parallel Problem Solving from Nature VI, Springer, Berlin, 849-858.
http://dx.doi.org/10.1007/3-540-45356-3_83 - 15. Knowles, J.D. and Corne, D.W. (2000) Approximating the Non-Dominated Front Using the Pareto Archived Evolution Strategy. Evolutionary Computation, 8, 149-172.
http://dx.doi.org/10.1162/106365600568167 - 16. Coello, C.A.C., Pulido, G.T. and Lechuga, M.S. (2004) Handling Multiple Objectives with Particle Swarm Optimization. IEEE Transactions on Evolutionary Computation, 8, 256-279.
http://dx.doi.org/10.1109/TEVC.2004.826067 - 17. Coello, C.A.C. and Cortés, N.C. (2005) Solving Multiobjective Optimization Problems Using an Artificial Immune System. Genetic Programming and Evolvable Machines, 6, 163-190.
http://dx.doi.org/10.1007/s10710-005-6164-x - 18. Jones, D.F., Mirrazavi, S.K. and Tamiz, M. (2002) Multi-Objective Meta-Heuristics: An Overview of the Current State-of-the-Art. European Journal of Operational Research, 137, 1-9.
http://dx.doi.org/10.1016/S0377-2217(01)00123-0 - 19. Matthews, K.B. (2001) Applying Genetic Algorithms to Multi-Objective Land-Use Planning. Doctoral Dissertation, the Robert Gordon University, Aberdeen.
- 20. Niaraki, A.S. and Kim, K. (2009) Ontology Based Personalized Route Planning System Using a Multi-Criteria Decision Making Approach. Expert Systems with Applications, 36, 2250-2259.
http://dx.doi.org/10.1016/j.eswa.2007.12.053 - 21. Eldrandaly, K. (2010) A GEP-Based Spatial Decision Support System for Multisite Land Use Allocation. Applied Soft Computing, 10, 694-702.
http://dx.doi.org/10.1016/j.asoc.2009.07.014 - 22. Hajehforooshnia, S., Soffianian, A., Mahiny, A.S. and Fakheran, S. (2011) Multi Objective Land Allocation (MOLA) for Zoning Ghamishloo Wildlife Sanctuary in Iran. Journal for Nature Conservation, 19, 254-262.
http://dx.doi.org/10.1016/j.jnc.2011.03.001 - 23. Cao, K. and Ye, X. (2013) Coarse-Grained Parallel Genetic Algorithm Applied to a Vector Based Land Use Allocation Optimization Problem: The Case Study of Tongzhou Newtown, Beijing, China. Stochastic Environmental Research and Risk Assessment, 27, 1133-1142.
http://dx.doi.org/10.1007/s00477-012-0649-y - 24. Porta, J., Parapar, J., Doallo, R., Rivera, F.F., Santé, I. and Crecente, R. (2013) High Performance Genetic Algorithm for Land Use Planning. Computers, Environment and Urban Systems, 37, 45-58.
http://dx.doi.org/10.1016/j.compenvurbsys.2012.05.003 - 25. Siegmund, F., Bernedixen, J., Pehrsson, L., Amos, H.C.N. and Deb, K. (2012) Reference Point-Based Evolutionary Multi-Objective Optimization for Industrial Systems Simulation. Proceedings of the 2012 Winter Simulation Conference, Berlin, 9-12 December 2012, 1-11.
http://dx.doi.org/10.1109/wsc.2012.6465130 - 26. Yuan, Y., Xu, H. and Wang, B. (2014) An Improved NSGA-III Procedure for Evolutionary Many-Objective Optimization. Proceedings of the 2014 Conference on Genetic and Evolutionary Computation, Vancouver, 12-16 July 2014, 661-668.
- 27. Matthews, K.B., Buchan, K., Sibbald, A.R. and Craw, S. (2006) Combining Deliberative and Computer-Based Methods for Multi-Objective Land-Use Planning. Agricultural Systems, 87, 18-37.
http://dx.doi.org/10.1016/j.agsy.2004.11.002 - 28. Deb, K. (2001) Multi-Objective Optimization Using Evolutionary Algorithms. John Wiley & Sons Ltd., New York.
- 29. Cao, K., Batty, M., Huang, B., Liu, Y., Yu, L. and Chen, J. (2011) Spatial Multi-Objective Land Use Optimization: Extensions to the Non-Dominated Sorting Genetic Algorithm-II. International Journal of Geographical Information Science, 25, 1949-1969.
http://dx.doi.org/10.1080/13658816.2011.570269 - 30. Liu, Y., Liu, D., Liu, Y., He, J., Jiao, L., Chen, Y. and Hong, X. (2012) Rural Land Use Spatial Allocation in the Semiarid Loess Hilly Area in China: Using a Particle Swarm Optimization Model Equipped with Multi-Objective Optimization Techniques. Science China Earth Sciences, 55, 1166-1177.
http://dx.doi.org/10.1007/s11430-011-4347-2 - 31. Tapia, M.G.C. and Coello, C.A.C. (2007) Applications of Multi-Objective Evolutionary Algorithms in Economics and Finance: A Survey. Proceedings of the IEEE Congress on Evolutionary Computation, Singapore, 25-28 September 2007, 532-539.
- 32. Deb, K. and Agrawal, R.B. (1994) Simulated Binary Crossover for Continuous Search Space. Complex Systems, 9, 115-148.
- 33. Institute for the Management of Information Systems of the “Athena” Research and Innovation Center in Information (2016).
http://geodata.gov.gr/geodata/ - 34. Baatz, M. and Schape, A. (2000) Multiresolution Segmentation—An Optimization Approach for High Quality Multi-Scale Image Segmentation. Proceedings of the Angewandte Geographische Informations Verarbeitung XII, Karlsruhe, 12-23.
- 35. McFeeters, S.K. (1996) The Use of the Normalized Difference Water Index (NDWI) in the Delineation of Open Water Features. International Journal of Remote Sensing, 17, 1425-1432.
http://dx.doi.org/10.1080/01431169608948714 - 36. Hudson, W.D. and Ramm, C.W. (1987) Correct Formulation of the Kappa Coefficient of Agreement, Photogrammetric Engineering and Remote Sensing, 53, 421-422.
- 37. Deb, K., Pratap, A., Agarwal, S. and Meyarivan, T.A.M.T. (2002) A Fast and Elitist Multiobjective Genetic Algorithm: NSGA-II. IEEE Transactions on Evolutionary Computation, 6, 182-197.
http://dx.doi.org/10.1109/4235.996017 - 38. Kanpur Genetic Algorithms Laboratory (2016).
http://www.iitk.ac.in/kangal/index.shtml/ - 39. Williams, K. (1999) Urban Intensification Policies in England: Problems and Contradictions. Land Use Policy, 16, 167-178.
http://dx.doi.org/10.1016/S0264-8377(99)00010-1 - 40. Bramley, G. and Power, S. (2009) Urban Form and Social Sustainability: The Role of Density and Housing Type. Environment and Planning B: Planning and Design, 36, 30-48.
http://dx.doi.org/10.1068/b33129 - 41. Yuan, M., Liu, Y., He, J. and Liu, D. (2014) Regional Land-Use Allocation Using a Coupled MAS and GA Model: From Local Simulation to Global Optimization, a Case Study in Caidian District, Wuhan, China. Cartography and Geographic Information Science, 41, 363-378.
http://dx.doi.org/10.1080/15230406.2014.931251 - 42. Verones, F., Huijbregts, M.A., Chaudhary, A., De Baan, L., Koellner, T. and Hellweg, S. (2015) Harmonizing the Assessment of Biodiversity Effects from Land and Water Use within LCA. Environmental Science & Technology, 49, 3584-3592.
http://dx.doi.org/10.1021/es504995r - 43. Yang, Q., Zhao, Z., Chow, T.L., Rees, H.W., Bourque, C.P.A. and Meng, F.R. (2009) Using GIS and a Digital Elevation Model to Assess the Effectiveness of Variable Grade Flow Diversion Terraces in Reducing Soil Erosion in Northwestern New Brunswick, Canada. Hydrological Processes, 23, 3271-3280.
http://dx.doi.org/10.1002/hyp.7436 - 44. Moore, I.D., Grayson, R.B. and Ladson, A.R. (1991) Digital Terrain Modeling: A Review of Hydrological, Geomorphological, and Biological Applications. Hydrological Processes, 5, 3-30.
http://dx.doi.org/10.1002/hyp.3360050103 - 45. Dorren, L. and Rey, F.A. (2016) A Review of the Effect of Terracing on Erosion.
http://www.ecorisq.org/docs/Dorren_Rey.pdf/ - 46. Vahaviolos, T. (2014) Estimation of Soil Erosion, Sediment Discharge and Deposition in Reservoir Using Empirical Methods with Emphasis to the Influence of Rainfall, MSc Thesis, National Technical University of Athens, Athens.
- 47. Famellos, S. (2016)
http://www.lifesos.eu/index.php/en/progress/ - 48. Greek Presidential Decree 236 (1984) About the Erection of Fences in Areas within a Zone of 500 m from the Shore or Bank of Public Lakes in Accordance with Article 23 Paragraph 1 of the Law 1337 (1983) Official Government Gazette 95/A’/22-6-84.
- 49. Ministerial Decision 3046/304 (1989) Building Structure Code. Official Government Gazette 59/D’/3-2-89.
- 50. Law 2971 (2001) Sea Shore Legislation and Other Regulations. Official Government Gazette, 285/Α’/19.12.2001.
- 51. Greek Presidential Decree 209 (1998) Measures about the Safety of Long-Distanced Transport. Official Government Gazette 169/Α’/15-7-98.
NOTES

*Corresponding author.