Journal of Geographic Information System
Vol.08 No.05(2016), Article ID:71678,15 pages
10.4236/jgis.2016.85051
Using Geospatial Information Component to Monitor the Watersheds along the Densu Basin in Ghana
Clement Nyamekye 1, Faruk Kwansah Nyame2, Samuel Anim Ofosu1
1Department of Civil Engineering, Koforidua Polytechnic, Koforidua, Ghana
2COCOBOD, Cartography and Survey Division, Accra, Ghana

Copyright © 2016 by authors and Scientific Research Publishing Inc.
This work is licensed under the Creative Commons Attribution International License (CC BY 4.0).
http://creativecommons.org/licenses/by/4.0/


Received: May 3, 2016; Accepted: October 28, 2016; Published: October 31, 2016
ABSTRACT
The Densu basin is a coastal river catchment in southern Ghana and a typical rural community like all other rural settlements in Ghana. It is the only basin amongst 43 other basins of the country that supplies water to two regional capitals of Ghana, namely, the capital city of Ghana, Accra and Eastern regional capital, Koforidua. The qualities of these water resources vary naturally and widely depending on climate, season, and the geology of the bedrock, as well as anthropogenic activities. The primary aim of this research is to determine data requirements for efficient and cost- effective development of a Geographic Information System (GIS) to map and detect the extent of the sources of the watersheds and how to protect the environment for continuous supply of water. Among the Nine catchment areas, only one catchment WSA_05 (Koforidua Township) was determined to have a very high risk of being vulnerable and therefore required urgency to protect environment for continuous supply of water. Four catchment areas WSA_02 (Weija Dam), WSA_03 (Apedwa-Asafo), WSA_06 (Suhum) and WSA_09 (New Tafo) were determined to have a high risk of being affected and therefore there was the need to protect the environment for continuous supply of water. Ghana as a country will have to take a responsible step in protecting its water body and its environment to enable continuous and sustainable supply of water to its citizens. This study therefore reveals the state of the water users and how urgent it environment needs to be protected.
Keywords:
Watershed, Geographical Information System (GIS), Densu Basin, Water Service Areas (WSA), Land Use Land Cover (LULC)

1. Introduction
The watersheds for Densu River for some time now are experiencing cases of drought due to climatic variability and a number of factors such as poverty. This comes at the period when the need for consistent geospatial assessment of environmental impacts of severe climatic conditions of the river along with other problems has been dominated by food security. The environmental challenges in the new millennium are more intense than before, and this is by virtue of the fact that the existing problem is now changing from local to regional and even to global. The activities carried out by humans are expanding day by day which is causing major effects on almost all the Earth’s systems [1] . The watershed which is an integrating point serves as the suitable spatial arrangement and functional piece for supervising difficult problems [1] .
In view of the difficult nature of natural and human systems, the use of geographic information to understand and predict the future conditions of watershed has been on the increase. In recent years, Geographic Information System (GIS) has been applied in management of watershed, including assessing the conditions of watershed by using models to determine the impacts of activities on the quality of water and also analyze the impacts of other management options. It has become very necessary to develop efficient flood risk management models as a result of abnormal weather conditions and global warming occurring in recent years. A substantial change has been seen from structural defense against flood to a more robust approach which includes the adaptation of right land use, agricultural and forest practices [2] - [6] . GIS and remote sensing provides an excellent source of data, which can be used to update and analyze changes that occur geospatially in a more resourceful manner [7] . Remote sensing technique can be used to track watershed attributes and land use with little limitations [8] . The act of combining data management in GIS and the analysis of its watershed are being used by environmental modelers for some time now. This capability can never be ignored in the design of data infrastructure which is core in analysis of watershed [9] , and the conservation of natural resources to sustain development [10] . Research in the area of watershed is very difficult to undertake in poor communities because it is mostly affected by inadequate data infrastructure. This condition results in the widening of the geo-spatial gaps as well as hindering the monitoring of watersheds [11] . However, various studies have been conducted in the application of geospatial information system in watershed management. Prakash [12] identifies the capability of using GIS in management of a basin and also ensuring the decrease in the destruction of future resources by adopting appropriate conservation measures. This paper presents the need for using Geographical Information System to detect the extent of the sources of the watersheds and how to protect the environment for continuous supply of water to the user.
2. Study Area
The Densu River passes through some densely populated towns in Ghana. The quality of land and water of the basin is being destroyed by unlawful practices carried out in areas where the basin traverses. The Densu basin lies between latitude 5˚30'N - 6˚20'N and longitude 0˚10'W - 0˚35'W at the southern part of Ghana (Figure 1) [13] . It is bounded to the north by Volta basin and the east by the Odaw basin. It is also bounded to the northwest and the west by with the Birim basin and the Ayensu and Okrudu basins respectively. The topography of the basin is such that, it has steeply dissected landscapes with hilly and rolling land to the north. The southern part is characterized by flat coastal plains with slopes and erosion surfaces that vary from 30% in the upper sections to less than 2% at the coast. The area of the basin is about 2600 km2 and it takes its source from the Atewa range [14] . It flows from the upstream sections in an easterly direction towards the Akwadum-Koforidua area and it gradually changes its course and flows in the southerly direction into the Weija reservoir in Accra, which is the main source of water supply for the Accra suburbs. The Densu basin has a total length of about 120 km and has five tributaries which include Pompon, Kuia, Adaiso, Dobro and Nsaki rivers. About 72% of the northern part of the basin falls within the Eastern Region, with 23% falling within the Greater Accra Region and the remaining 5% falling within the Central Region. The people in the rural areas practice agriculture as their main source of employment [14] .
The ecology of the Densu basin which used to be moist semi-deciduous forest with lots of rich flora and fauna has been changed to forest ecology at an increasing rate by virtue of human activities. The degradation of the forest has intensified with also an increase in shift of the land use which is caused by “urbanization” in the eastern corridor of the basin starting from the Weija area through Nsawam to Koforidua. The Densu basin has three types of vegetation zones, and the north-eastern section is the forest land which is de-vegetated by agricultural activities. The second zone is made up of scattered trees developing into areas of shrub and grassland. The third vegetation zone is the coastal savannah zone which is at the extreme southern section of the basin [14] . Also this basin falls under two distinct climate zones. The first zone is the dry equatorial climate of the south-eastern coastal plains and the second zone is the wet semi- equatorial climate which is at the extreme north of the basin. The two climatic zones are characterized by a bi-modal rainfall regime with different intensities. The main rainy season extends from April to July with the peak in June. The second which is the less intense rainy season occurs between September and November [14] .
3. Methodology
Datasets from River basins of Ghana (layer), Data on water users, River bodies (layer), The settlement (layer), NDVI 1982, 1992 and 2002 information from maps produced [15] was used to confirm the existence of water bodies and Land use Land cover maps (Hard copy map). Each of the intake points of the water users for the various sites was compiled for each of the watershed in a vector-based GIS. A vector model was chosen for data development and analysis because it provides an excellent platform for development and mapping of points (e.g. water users site) and lines (watershed) data as well as for spatial data analysis. A thin layer was created out of the contour layer in Arcscen. The layers were displayed to enable digitization of watershed for all the water users in

Figure 1. The Densu basin and some sampling communities [14] .
the Densu Basin. The hard copy map of the project area was scanned and digitized. Georeferencing was done using the topographical data on roads, towns and localities. The attributes covering the digitization was populated. A geo-database was then created after which a GIS map was produced (Figure 2).
4. Results and Analysis
A composite GIS map of the Densu Water Service Area (WSA) is produced. The map consists of nine catchment areas spreading from the Eastern region to the Greater Accra region with their water user information. Three major water user types is used in all the nine communities (which include town pipe, urban system and Irrigation). Urban system is predominantly available in most of the catchment areas along the Densu Basin WSA (Figure 3).
An application interface was created for easy use for policy makers, Managers of water users, who need to be abreast themselves with information on the Densu River Basin. On the Interface is a slider which helps in making queries on the rankings on the vulnerability of the various service areas. The red square point on the maps (Figures 4-8) indicates the ranking of the water services area when the slider attains a particular rank value of the R_Total (sum of all relative rankings). When the slider is pushed from

Figure 2. Flow chart of methodology.

Figure 3. Image showing the map of Densu Water Service Area and its Water User.

Figure 4. Showing the very high rank WSA (ranking value of 3).
the left to the right, it will display the most vulnerable (very high) water service areas to the less vulnerable (very low) water service area. After determining the vulnerability of each water service area is indicated by a rectangular box indicator, information about them can be ascertained by right clicking on the box. The information is shown on a bar at the lower end of the interface. The information shown entails the major water user and the population of the area.
The Nine catchment of WSA in the Densu Basin were classified into six major LULC types as shown in Table 1 and Table 2. Each of the LULC type was assigned a value
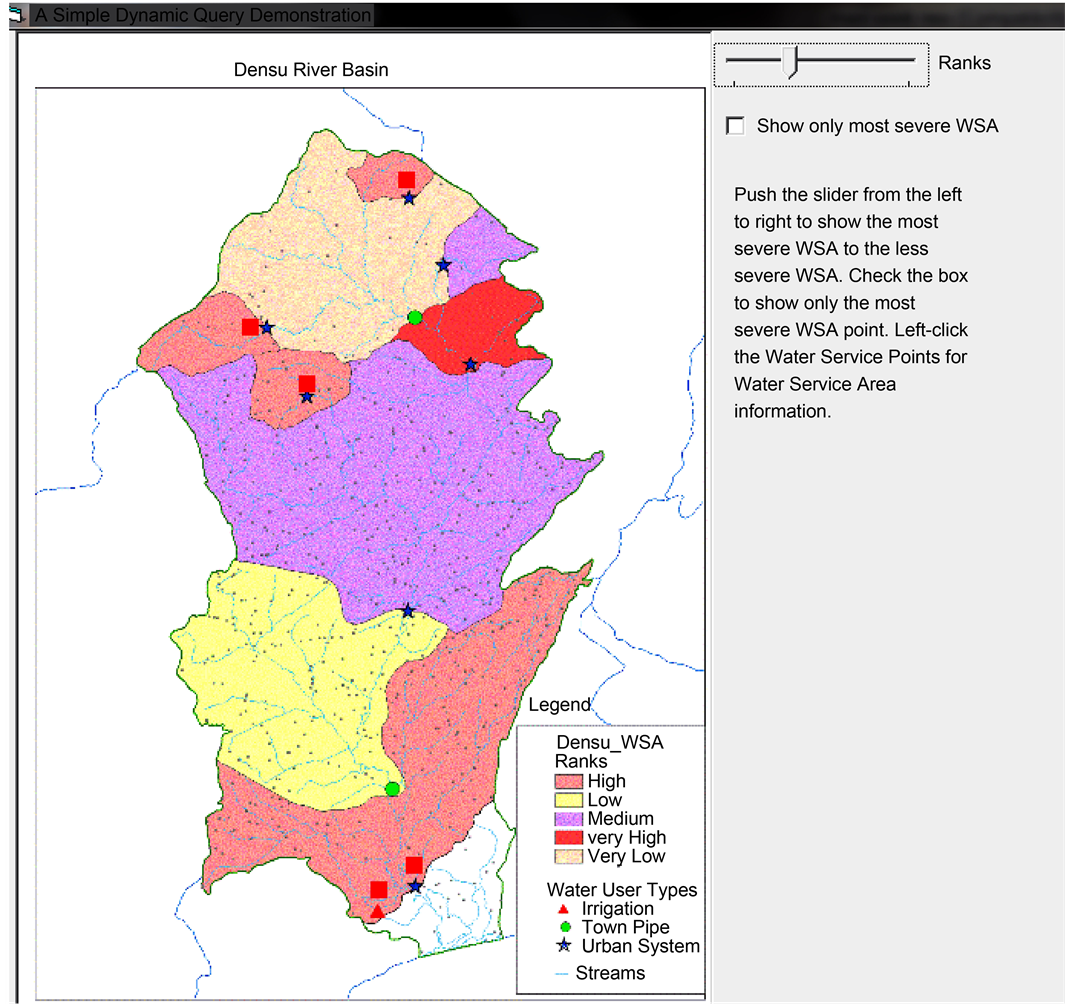
Figure 5. Showing high ranked WSA (ranking values of 6, 7 and 8).
based on its vegetation intensity (how green the vegetation). The values chosen for the intensity was ranked between 1 and 6. The value 1 represents LULC with less intensity of vegetation cover and the value 6 represents LULC with highest vegetation cover. i.e. the smaller the degree of intensity of vegetation cover, the smaller the value assigned to the class. The higher the intensity of vegetation cover the higher the value assigned to the class.
Analysis is done in order to evaluate the Water Service Areas. The evaluation of the WSA has been ranked in terms of the urgency to protect its environment (vulnerability).
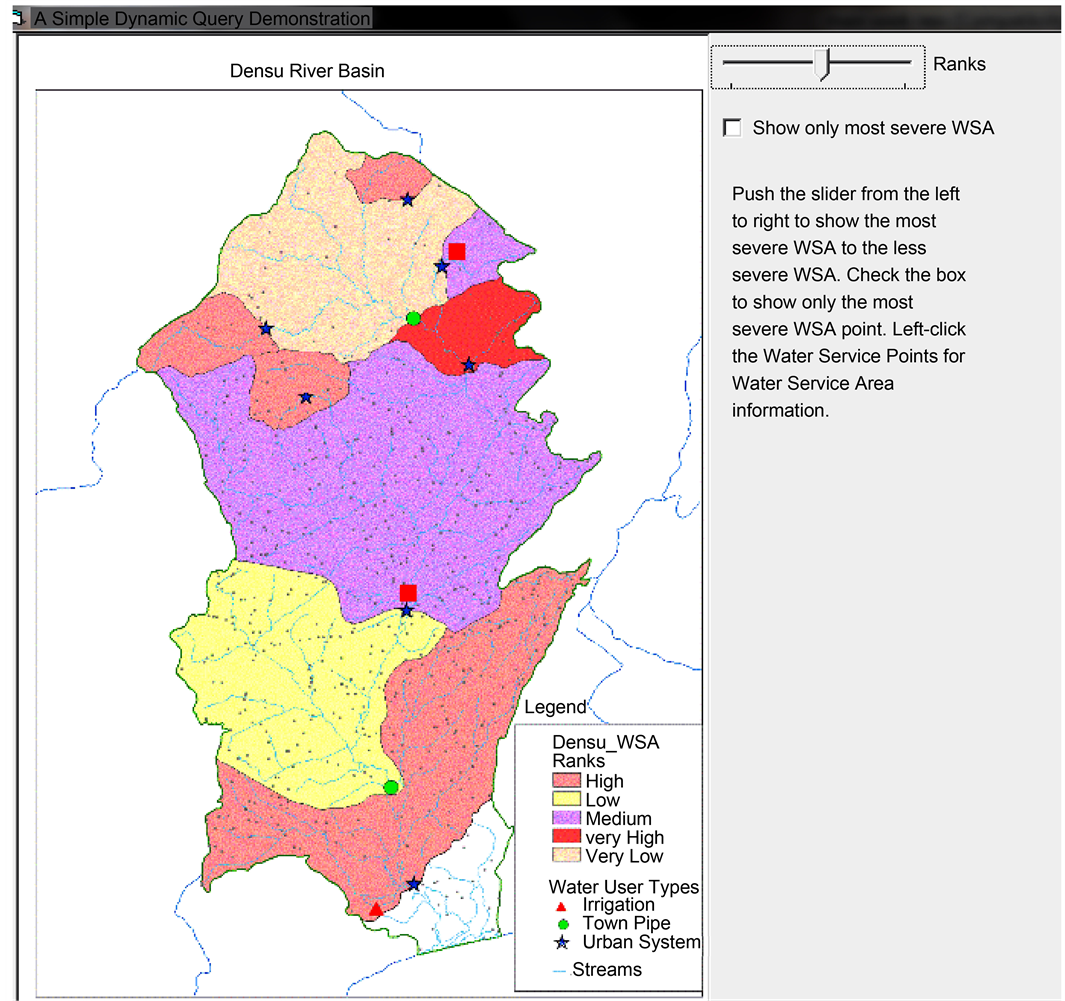
Figure 6. Showing medium ranked WSA (ranking values of 11 and 13).
The WSA area which is most vulnerable is ranked Very High; the next vulnerable WSA is ranked High, followed by Medium which is the next vulnerable catchment area after High. After the ranking of the Medium the next vulnerable ones are assigned Low and Very low respectively in order of vulnerability.
The evaluation of the WSA was performed based on three major variables:
1) Relative population density (R_PD which was determined from the population and the Size of the WSA);
2) Relative stream density (R_SD) which was determined from the Number of
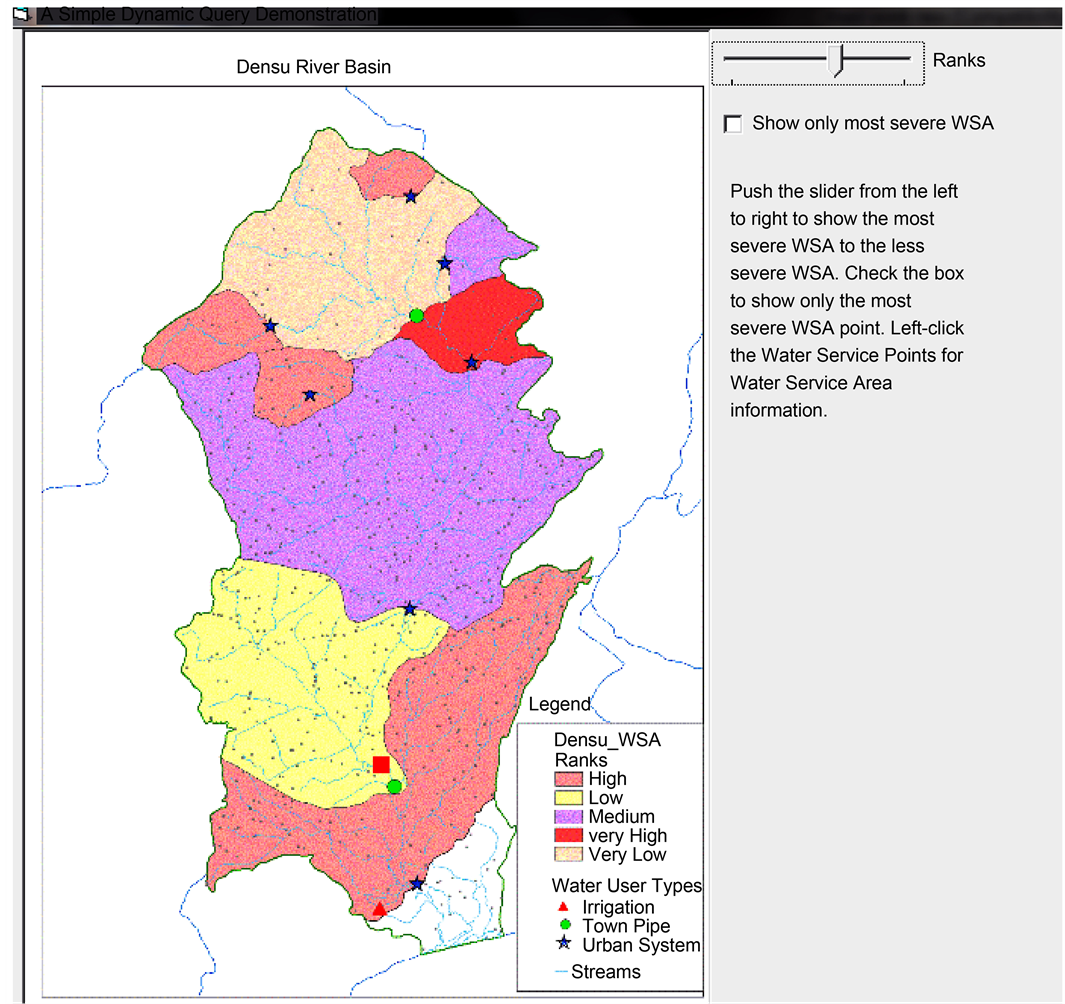
Figure 7. Showing low ranked WSA (ranking value of 16).
streams and the size of the WSA);
3) Relative LULC (R_LULC which was determined from the LULC activities going in the WSA).
The values of these three variables R_PD, R_SD, R_LULC are summed together to get the R_Total which is used to rank the vulnerability of the WSA.
Table 3 displays how the ranking of the WSA was done. The R_Total was categorized into five ranges of values; the range of values for the R_Total was at regular intervals for all the five ranges. Values between (0 - 5) are rated Very High, (6 - 10) are rated
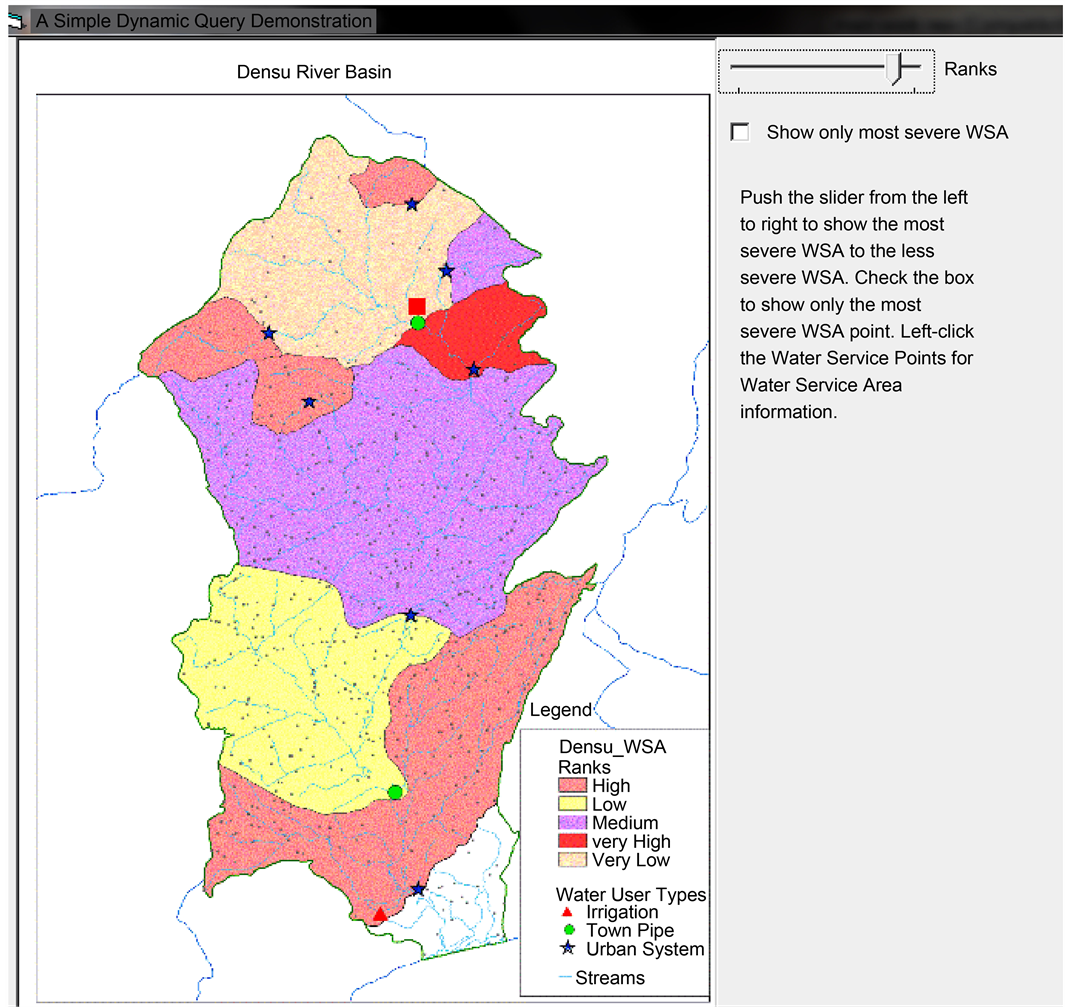
Figure 8. Showing a very low ranked WSA (ranking value of 22).
High, (11 - 15) are rated Medium, (16 - 20) are rated Low and (21 - 25) are rated Very low. These are the criteria which were used to rank the urgency of protecting the WSA. When a WSA is ranked Very high, it means that a Catchment area is most vulnerable and that much attention must be paid in protecting the environment pertaining that particular WSA. In Table 3, the range of values for the various Water Services Areas is used in ranking the vulnerability of individual WSA. The R_Total which is the addition of all relative rankings is shown in Table 4(b). Thus the value for each of the three variables for each WSA was added together. This was done by using the formula

Table 1. Table of Water Services Area (WSA) and their water use (WU) Type.
Table 2. Table showing how names of LULC are assigned with numbers in the database.
Table 3. Table showing how R_Total are Ranked.
 [1]
[1]
where: R_PD is the relative population density;
R_SD is the relative stream density;
R_LULC is the relative Land use Land cover change.
WSA with R_Total between 0 and 5 is ranked Very high, this means that the catchment is highly vulnerable, so that particular WSA must be given a priority attention.
For example in Table 4, taking WSA_01, the R_LULC has a value of 4, the R_PD has a value of 9.173 and R_SD has a value of 2.138. Therefore the R_Total for WSA_01 is determined by summing (4 + 9.373 + 2.138 = 15.512 ~ 16), the 16 falls between the
(a) (b)
Table 4. (a) Table of water service information. (b) Table indicating the statistics that evaluated the Water Service Areas into Ranks in the database.
range (16 - 20) which is assigned low in its ranking. This means WSA_01 has a low risk of being affected by these environmental variables. The same procedure is used to determine the ranking values of the remaining catchment areas which are shown in Table 4. From the results, it was established that only one WSA was ranked very high risk prone area which is Koforidua Community. Three WSA were ranked high risk prone areas which include the Weija town community, Apedwa-Tafo community, Suhum Community and New Tafo Community. Two WSA was ranked medium prone areas which are Nsawan and Suhyen Communities. Madina and Akwadum/Nankes were ranked low and very low prone areas respectively.
5. Conclusion
This research has presented the application of Geospatial Information component in the analysis of local management of watershed in Ghana with a focus on the assessment of local management of watersheds of the Densu River basin. It can be concluded that Geospatial Information component application points to a mix of gains and failures in environmental features. Though there was sizeable number of water bodies, the emergency of stress indicators of LULC and population poses a growing threat to the availability of water and conservation efforts in the Densu River basin. With Geospatial Information component in the forefront of new technological advances, the management of watersheds such as the Densu River watershed will continue to be strong. The Geospatial Information component used in this research provides a decision support system for managers in the assessment of environmental hazards related to local watershed management. Ghana as a country will have to take a responsible step in protecting its water body and its environment to enable continuous and sustainable supply of water to its citizens. This project therefore reveals the state of the water users and how urgent its environment needs to be protected.
Cite this paper
Nyamekye, C., Nyame, F.K. and Ofosu, S.A. (2016) Using Geospatial Information Component to Mo- nitor the Watersheds along the Densu Basin in Ghana. Journal of Geographic Information System, 8, 618-632. http://dx.doi.org/10.4236/jgis.2016.85051
References
- 1. Tim, U.S. and Mallavaram, S. (2003) Application of GIS Technology in Watershed-Based Management and Decision Making. AWRA Hydrology & Watershed Management Technical Committee, 1, 1-6.
- 2. Alexakis, D.D., Hadjimitsis, D.G. and Agapiou, A. (2013) Estimating Flash Flood Discharge in a Catchment Area with the Use of Hydraulic Model and Terrestrial Laser Scanner. In: Helmis, C.G. and Nastos, P.T., Eds., Advances in Meteorology, Climatology and Atmospheric Physics, Springer Atmospheric Sciences, 9-15.
- 3. Alexakis, D.D., Hadjimitsis, D.G., Michaelides, S., Tsanis, I., Retails, A., Demetriou, A., Agapiou, A., Themistocleous, K., Pashiardis, S., Aristeidou, K. and Tymvios, F. (2013) Application of GIS and Remote Sensing Techniques for Flood Risk Assessment in Cyprus. In: Helmis, C.G. and Nastos, P.T., Eds., Advances in Meteorology, Climatology and Atmospheric Physics, Springer Atmospheric Sciences, Springer, Berlin, Heidelberg, 9-14.
http://dx.doi.org/10.1007/978-3-642-29172-2_1 - 4. Barredo, J. and Engelen, G. (2010) Land Use Scenario Modeling for Flood Risk Mitigation. Sustainability, 2, 1327-1344.
- 5. Lilesand, T.M. and Keifer, R.W. (2000) Remote Sensing and Image Interpretation. 4th Edition, John Wiley & Sons, Inc., Toronto.
- 6. Michaelides, S., Tymvios, F. and Michaelidou, T. (2009) Spatial and Temporal Characteristics of the Annual Rainfall Frequency Distribution in Cyprus. Atmospheric Research, 94, 606-615.
http://dx.doi.org/10.1016/j.atmosres.2009.04.008 - 7. Merem, E.C., Yerramilli, S., Twumasi, Y.A., Wesley, J.M., Robinson, B. and Richardson, C. (2011) The Application of GIS in the Analysis of the Impacts of Human Activities on South Texas Watersheds. International Journal of Research and Public Health, 8, 2418-2446.
http://dx.doi.org/10.3390/ijerph8062418 - 8. Khawlie, M. (2005) Watershed Characteristics, Land Use and Fabric: The Application of Remote Sensing and Geographical Information Systems on Lakes and Reservoirs. Research and Management, 10, 85-90.
http://dx.doi.org/10.1111/j.1440-1770.2005.00264.x - 9. Usery, E. (2004) Geospatial Data Resampling and Resolution Effects on Watershed Modeling: A Case Study Using the Agricultural Non-Point Source Pollution Model. Journal of Geographical Systems, 6, 289-306.
http://dx.doi.org/10.1007/s10109-004-0138-z - 10. Biswas, S. (2002) Remote Sensing and Geographic Information System Based Approach for Watershed Conservation. Journal of Surveying Engineering, 128, 108-117.
http://dx.doi.org/10.1061/(ASCE)0733-9453(2002)128:3(108) - 11. United Nations Development Program (UNDP) (1999) Human Development Report. UNDP, New York.
- 12. Prakash, A. (2007) Deciding Alternative Land Use Options in a Watershed Using GIS. Journal of Irrigation and Drainage Engineering, 133, 162-174.
http://dx.doi.org/10.1061/(ASCE)0733-9437(2007)133:2(162) - 13. Tay, C. and Kortatsi, B. (2008) Groundwater Quality Studies: A Case Study of the Densu Basin, Ghana. West African Journal of Applied Ecology, 12, 81-99.
- 14. Water Resource Commission Ghana (2007) Densu River Basin-Integrated Water Resource Management Plan.
- 15. Nyamekye, C., Osei Jnr, E.M. and Oseitutu, A. (2014) Classification of Time Series NDVI for the Assessment of Land Cover Change in Ghana Using NOAA/AVHRR Data. Journal of Geomatics, 8, 34-39.