Journal of Geographic Information System
Vol.5 No.6(2013), Article ID:41237,17 pages DOI:10.4236/jgis.2013.56054
A Multidisciplinary Approach to Mapping Potential Urban Development Zones in Sinai Peninsula, Egypt Using Remote Sensing and GIS
1Environmental Studies and Land Use Department, National Authority for Remote Sensing and Space Sciences, NARSS, Cairo, Egypt
2Division of Geological Applications and Mineral Resources, National Authority for Remote Sensing and Space Sciences, NARSS, Cairo, Egypt
Email: haeffat@yahoo.com
Copyright © 2013 Hala A. Effat, Mohamed N. Hegazy. This is an open access article distributed under the Creative Commons Attribution License, which permits unrestricted use, distribution, and reproduction in any medium, provided the original work is properly cited.
Received November 1, 2013; revised December 1, 2013; accepted December 8, 2013
Keywords: Urban Development; Remote Sensing; GIS; Site Selection; Themes; Analytical Hierarchy Process; Sinai; Egypt
ABSTRACT
One of the main concerns of physical planning is the proper designation of suitable sites for feasible and sustainable land use. A main importance of such issue is that it withdraws attention to the necessity of adopting a multidisciplinary approach to the zoning and site selection problem. Egypt has a top priority objective to develop Sinai Peninsula and to create new sustainable and attracting communities that should ensure a stable, economic and sustainable environment in vast desert zones. Due to the difficulty in solving a zoning problem in a desert, the use of remote sensing and Geographic Information System (GIS) was to explore the desert potentials in the region. Five sub-models were created for five themes using Spatial Multicriteria Analysis (SMCA) and used as inputs to the final suitability model. These themes are: land resources, land stability, accessibility, cost of construction and land protection. A GIS-based model was designed following a sustainable development approach. Economic, social and environmental factors were introduced in the model to identify and map land suitable zones for urban development using Analytical Hierarchy Process (AHP). The suitability index map for urban development was produced by weighted overlay of the five sub-models themes. The most suitable zones for urban development in Sinai Peninsula amounted to 5327 square kilometers representing 17% of total area, whereas high suitable zones reached 40% indicating a high suitability of Sinai Peninsula lands for residing new urban communities.
1. Introduction
Sustainable development is becoming a popular concept among planners and researchers because it guides resource use in a way that aims to meet the needs of today’s populations without compromising the ability for future populations to meet their needs [1]. Using the principle of sustainable development, the environmental, social and economic impacts can be managed to maximize positive impacts while minimizing negative effects. Urban planners use Geographic Information Systems (GIS) in sustainable development research and decisionmaking [2].
Land use suitability assessment is an important fundamental work in land use planning. The use of remote sensing and GIS technology in land suitability evaluation is a new technology and a new method in urban-rural planning. Such techniques provide a quantitative analysis. The rapid development of remote sensing technology and gradually maturing of GIS technology applications provides the foundation for urban-rural planning from the qualitative analysis to quantitative analysis. The core technology of the urban-rural planning is land use suitability with comprehensive evaluation [3]. Spatial analysis combined with multi-criteria evaluation methods was proven to be useful for both facing the main issues relating to land consumption and minimizing environmental impacts of spatial planning [4]. One of the most useful applications of GIS for planning and management is the landuse suitability mapping and analysis [5-8]. Broadly defined, land-use suitability analysis aims at identifying the most appropriate spatial pattern for future land uses according to specify requirements, preferences, or predictors of some activity [6,8]. The GIS-based land-use suitability analysis has been applied in a wide variety of situations including ecological approaches for defining land suitability/habitat for animal and plant species [9, 10], geological favorability [11], suitability of land for agricultural activities [12,13], landscape evaluation and planning [14], environmental impact assessment [15] selecting the best site for the public and private sector facilities [16,17], and regional planning [18].
In the present study, remote sensing and GIS techniques have been applied to explore the potentials of Sinai Peninsula, Egypt for urban development. The main objective of this work is to identify and delineate the optimum locations for developing new urban communities in such vast desert area. To achieve this objective, several factors influencing the suitability of the land for the required development are investigated, and the main five effective factors include: accessibility, land stability, natural resources, costs of construction, and protection of natural protectorates and archaeological sites. For each of these themes, a special sub-model was prepared based on analysis and interpretation of high resolution satellite images. Then, all of the sub-models were integrated, as layers, in a GIS environment, in order to create an overall model to depict the most suitable zones for urban development in Sinai Peninsula.
2. Description of the Study Area
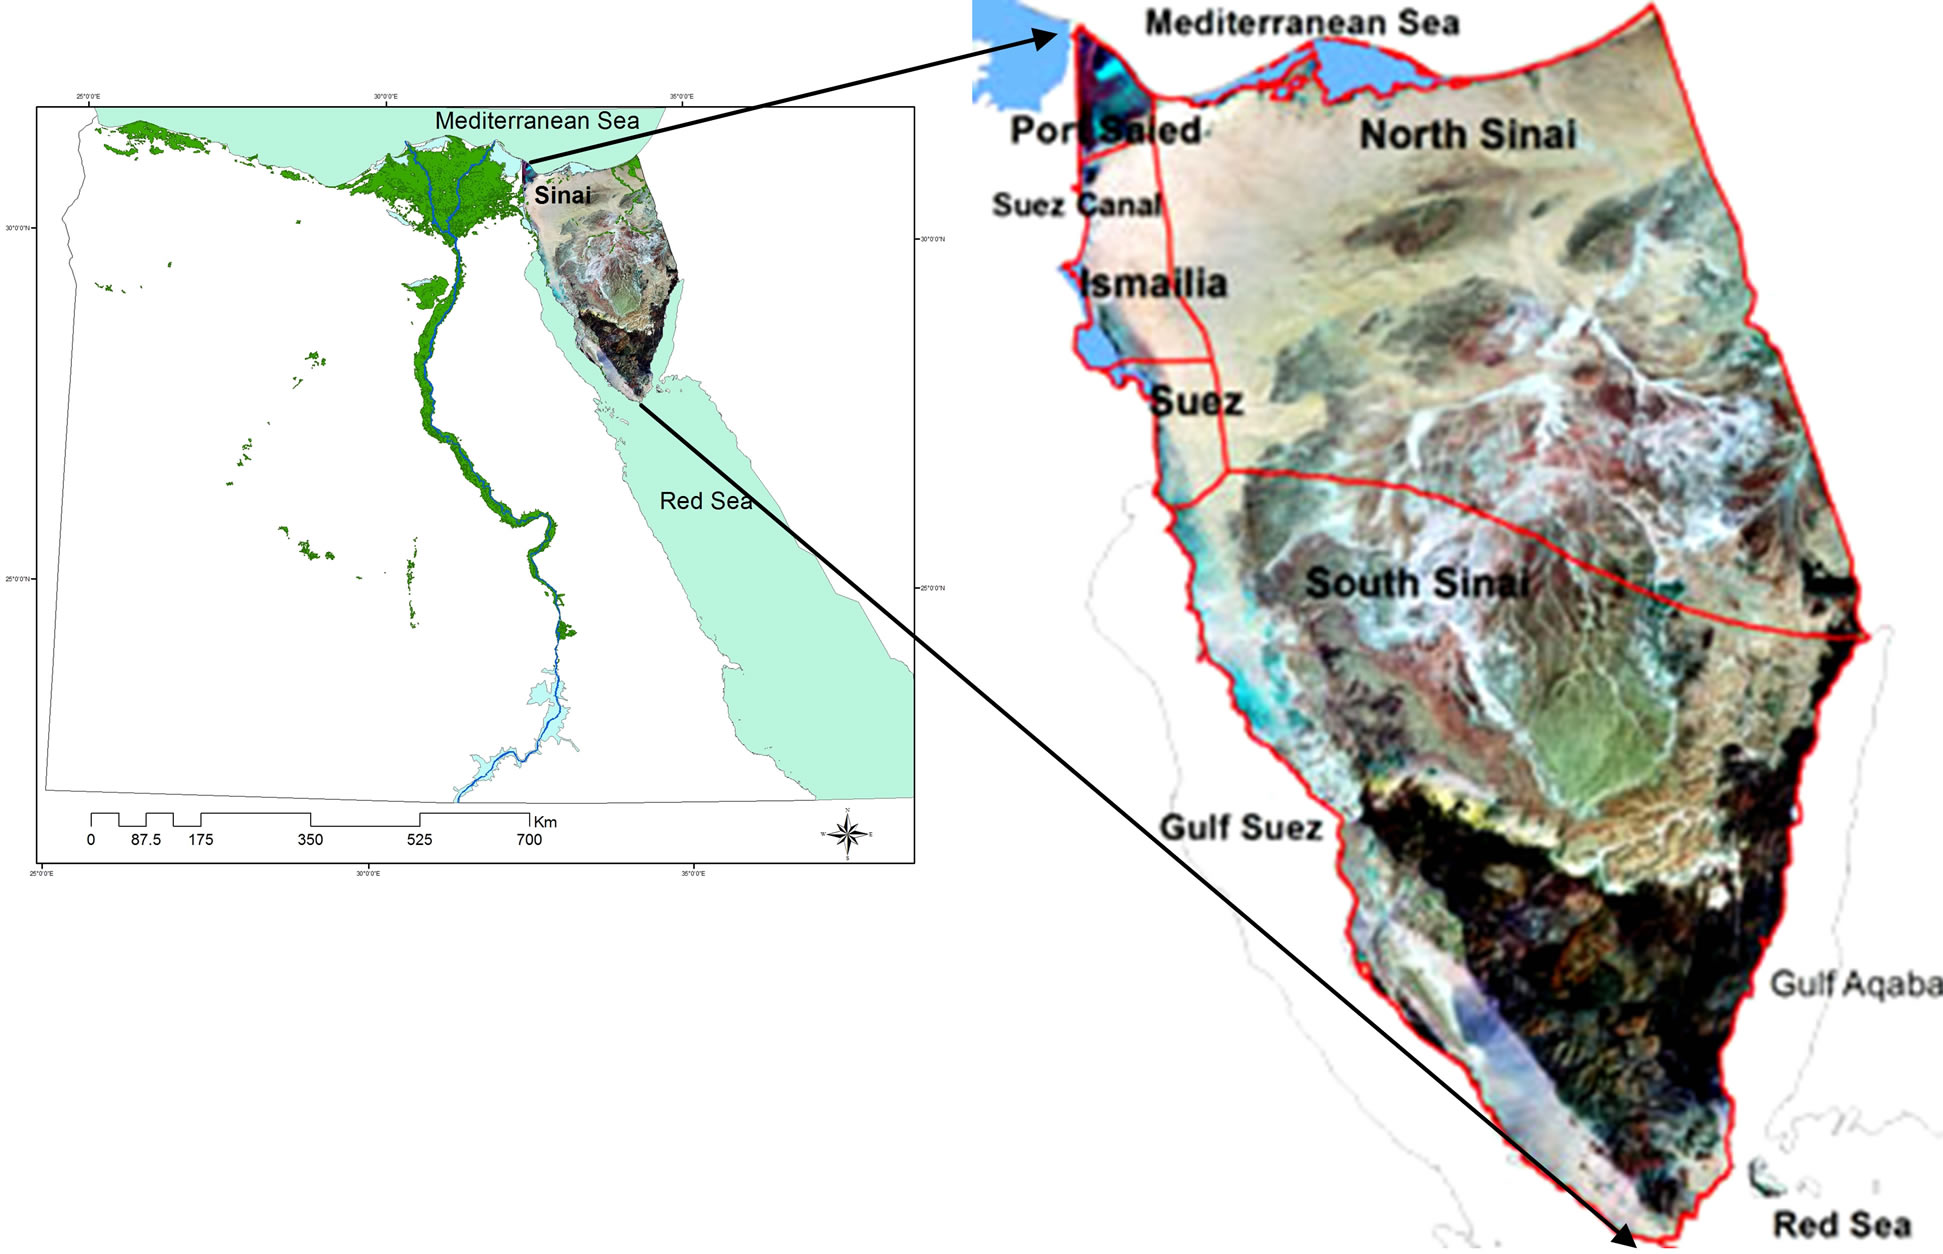
Sinai is a triangular peninsula covering an area of 61,000 sq km in the northeastern Egypt and joining the great continental land masses of Africa and Asia within the geographic location falling between latitudes 27˚43' and 31˚19' North and longitude 32˚19' and 34˚54' East The Peninsula is situated between the Gulf of Aqaba and Gulf of Suez, and is bounded from north by the Mediterranean Sea. (Figure 1(a)). It comprises two administrative governorates, North Sinai covering an area of about 27,564.0 square kilometers and South Sinai covering an area of about 31,272.0 square kilometers. North and South Sinai Governorates population reach 395,271 and 159,029 respectively as of 2012 estimates [19] (Central Agency for Public Mobilization and Statistics). The Peninsula also covers portions of three governorates; namely Port Saied, Ismailya and Suez Governorates (Figure 1(b)). The physical geography includes desert plains, sand dunes and sea coasts, plateaus and mountainous zones. The Mediterranean Sea borders the Peninsula from the north with a shoreline reaching 205 km. The region is rich in mines, where kaolin, manganese, zircon, coal and feldspar exist. Quarrying activities such as gypsum, glass sand, marble, granite, dolomite and limestone are being extracted [20] (Center of Housing and Building Researches, 2007). The Peninsula is popular for its unique protectorates and historical and religious sites such as St. Catherine Monastery and Mount Moses. Despite its rich resources, the peninsula is among the least governorates in population density in Egypt. The Egyptian Government has put Sinai’s development plan in its top priorities in the previous years.
3. Materials
3.1. Remotely Sensed Data
Remote sensing is an important data acquisition means, it plays a vital role in land use suitability assessment. In the present study, land use, cultivated land, urban distribution, water bodies, ecological elements are all obtained from the analysis and interpretation from satellite images including:
1) Landsat ETM satellite images, acquired in 2013, for regional investigation of the whole Sinai Peninsula.
2) SPOT4 satellite images acquired in 2011, for more de tailed analysis of some particular areas.
3) Shuttle Radar Topography Mission (SRTM) [21] data for extraction of Digital Elevation Model (DEM), slope, aspect and stream network.
The data were digitally processed in ESRI Spatial Analyst.
3.2. Maps
Various thematic maps covering Sinai Peninsula at different scales have been collected from the specialized agencies. They include the following:
1) Topographic maps at scale 1:500,000 published by the Egyptian Military Survey Department, 1995 [22].
2) Geologic maps scale 1:500,000 obtained from the Egyptian general Petroleum Corporation, 1987 [23].
3) The protected areas map was obtained from the Egyptian Environmental Affairs Agency, [24].
4) The Hydro-geologic map, scale 1:200,000 was obtained from the Research Institute for Groundwater (RIGW) [25].
5) The mineral resources map was obtained from the Center of Housing and Building Researches, 2007 [20].
All maps were obtained in hard copies, scanned, rectified, digitized in ESRI ArcGIS10 and saved as feature classes in a geographic database for further analysis.
4. Methodology
The selection of suitable sites for specific land uses must be based upon a set of local criteria to ensure that the maximum benefit and least cost for a selected site/zone
 (a) (b)
Figure 1. (a) Location of Sinai Peninsula; (b) Administrative divisions of Sinai Peninsula.
are attained. The following general overlay analysis steps were followed based on ESRI Spatial Analyst, [26]:
1) Define the problem.
2) Break the problem into sub-models.
3) Determine significant layers.
4) Transform the data within a layer into a common scale (normalize).
5) Weight the input layers.
6) Combine the layers.
7) Analyze.
A conceptual diagram of the applied analysis is shown in Figure 2.
4.1. Define the Problem
In this step, the overall objective was identified. All aspects of the remaining steps of the overlay modeling process must contribute to this overall objective. Ensuring geological safety, resources, least costs, accessibility and protection of natural and archeological assets are the objectives of this study.
4.2. Break the Problem into Sub-Models
Most overlay problems are complex, and it is recommended to break them down into sub-models for clarity, to organize thoughts, and to more effectively solve the overlay problem. For this study, several factors that contribute to the suitability of the lands for accommodating new urban communities were identified. Such factors were then grouped into five main sets or rather themes. For each of the five themes a Multicriteria Evaluation sub-model was created These themes are: 1) accessibility, 2) natural resources, 3) land stability and 4) construction costs and 5) natural and cultural values protection.
4.3. Determine Significant Layers and Defining the Related Themes
The significant attributes were defined and the related layers were created in this step. Factors used to model the urban development site suitability model; include social, economic and environmental themes, in addition to a land safety theme and a natural and cultural values protection theme. For each of such themes an independent sub-model was created. The attributes and layers that affect each sub-model was identified. Each factor describes a component of the phenomena a sub-model is defining. Such factor contributes to the goals of the submodel, and each sub-model contributes to the overall goal of the overlay model. (ESRI spatial analyst) [27]. The themes used to create the sub-models are described in the following section:
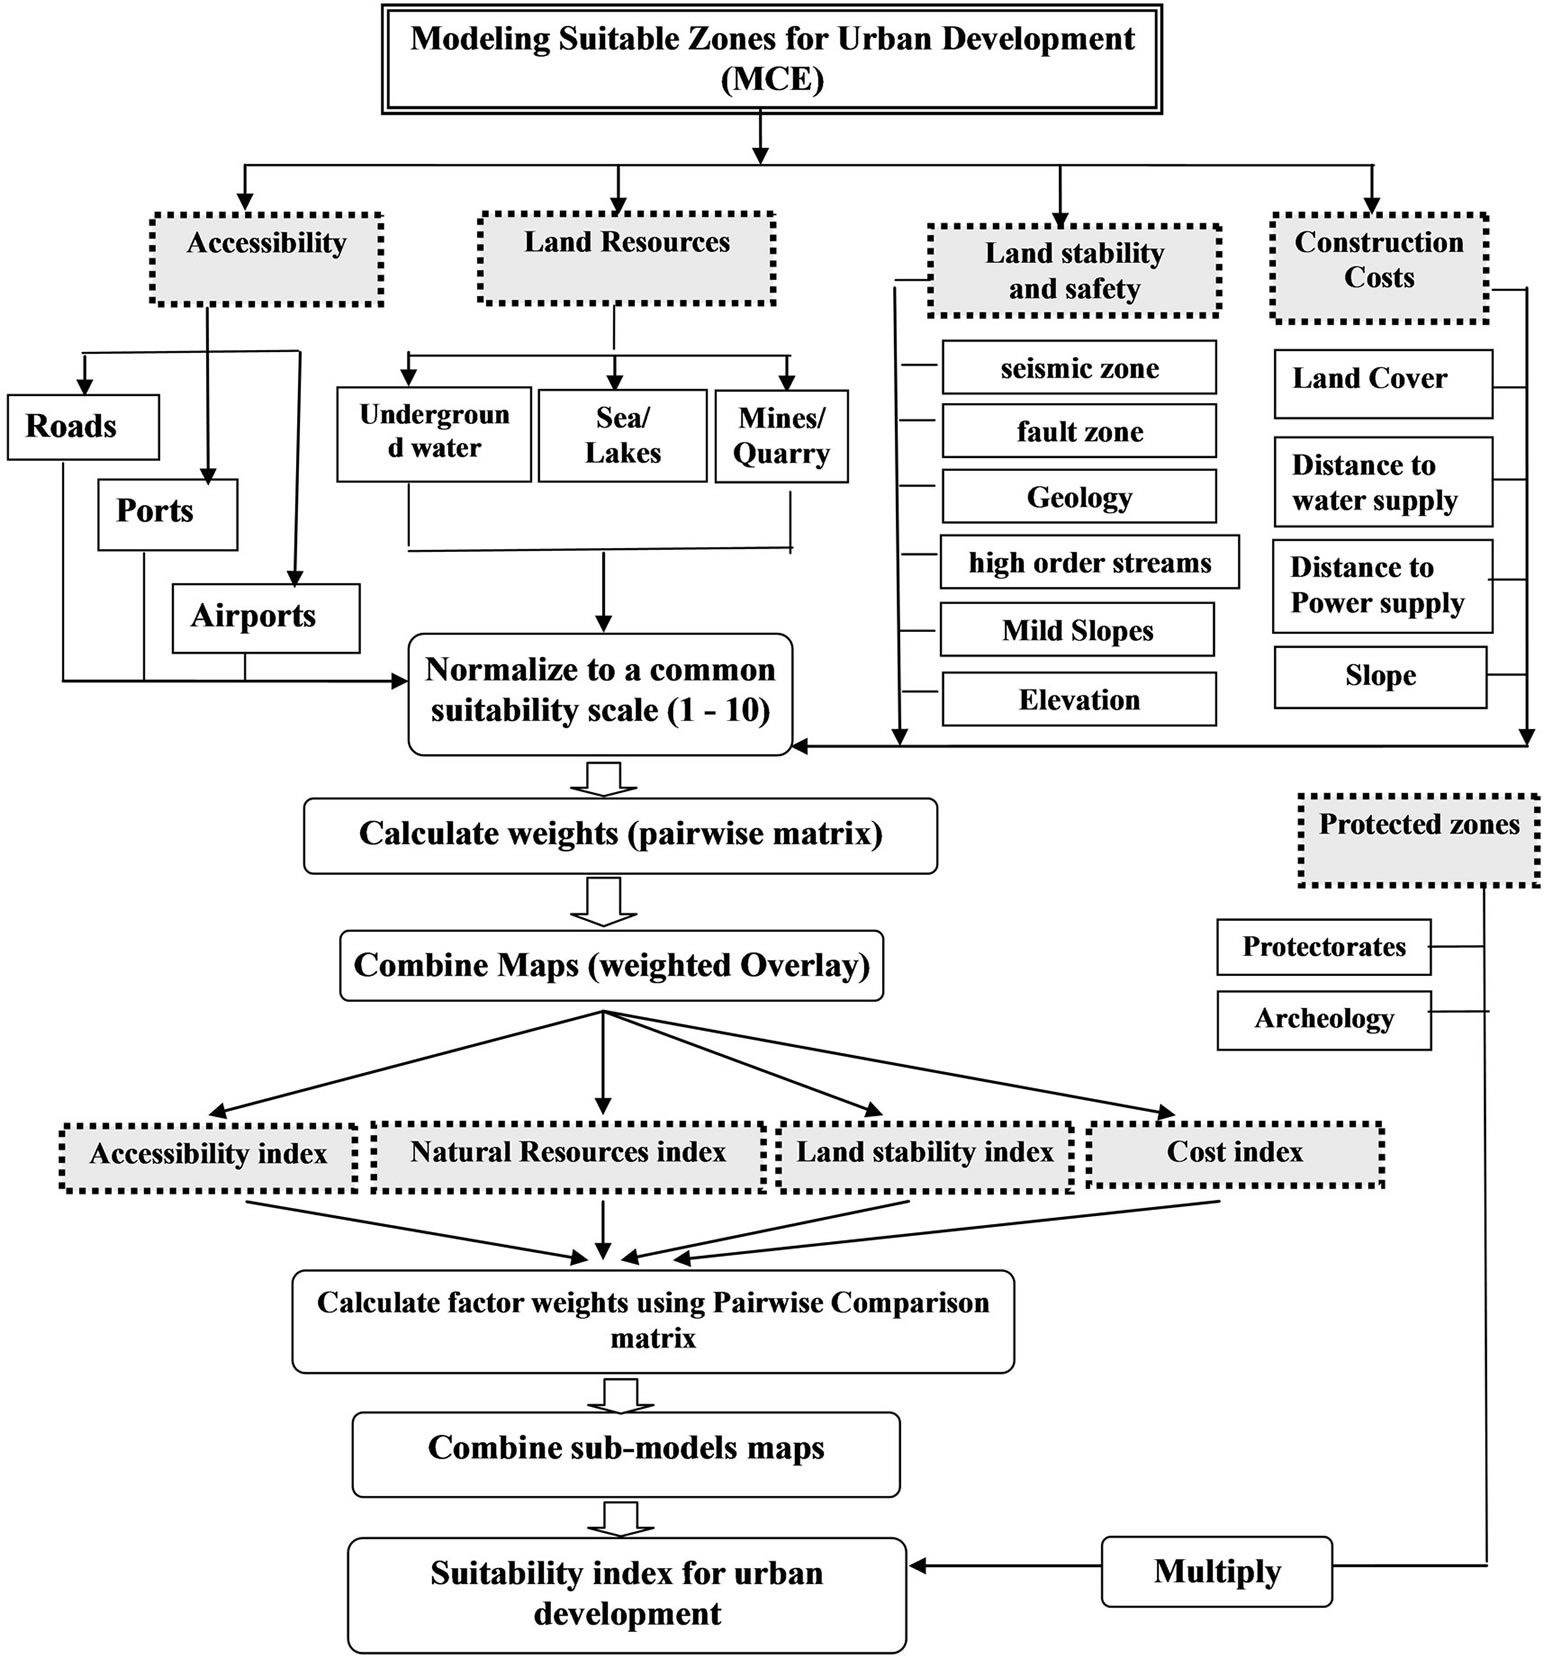
Figure 2. A conceptual model for the applied methodology.
4.3.1. Natural Resources Theme
Potential land resources are the backbone for job creation and therefore it should take first priority and consideration in development of new urban zones. Factor maps used for modeling the land resources (Table 1) theme include the following: groundwater, sea/lakes and mineral resources.
1) Ground Water Groundwater is one of the most important natural resources for the development in such areas of severe aridity as North Sinai. There are two main types of groundwater; the Quaternary aquifer in wadi alluvium and coastal sand dunes, and the deep fracture zone aquifers in Lower Cretaceous sandstone formations Hydro-geologic units were digitized from the available hydro-geologic map (Institute for groundwater, 1999) [24].
2) Sea/Lakes Sea water can be desalinated and provide the water needs of urban communities in Sinai Peninsula. Lake Bardawil provides an aqua culture resource and fisheries for the natives. Proximity of a site from a shoreline is considering a benefit factor. Shorelines were digitized from the Landsat ETM image acquired in 2013.
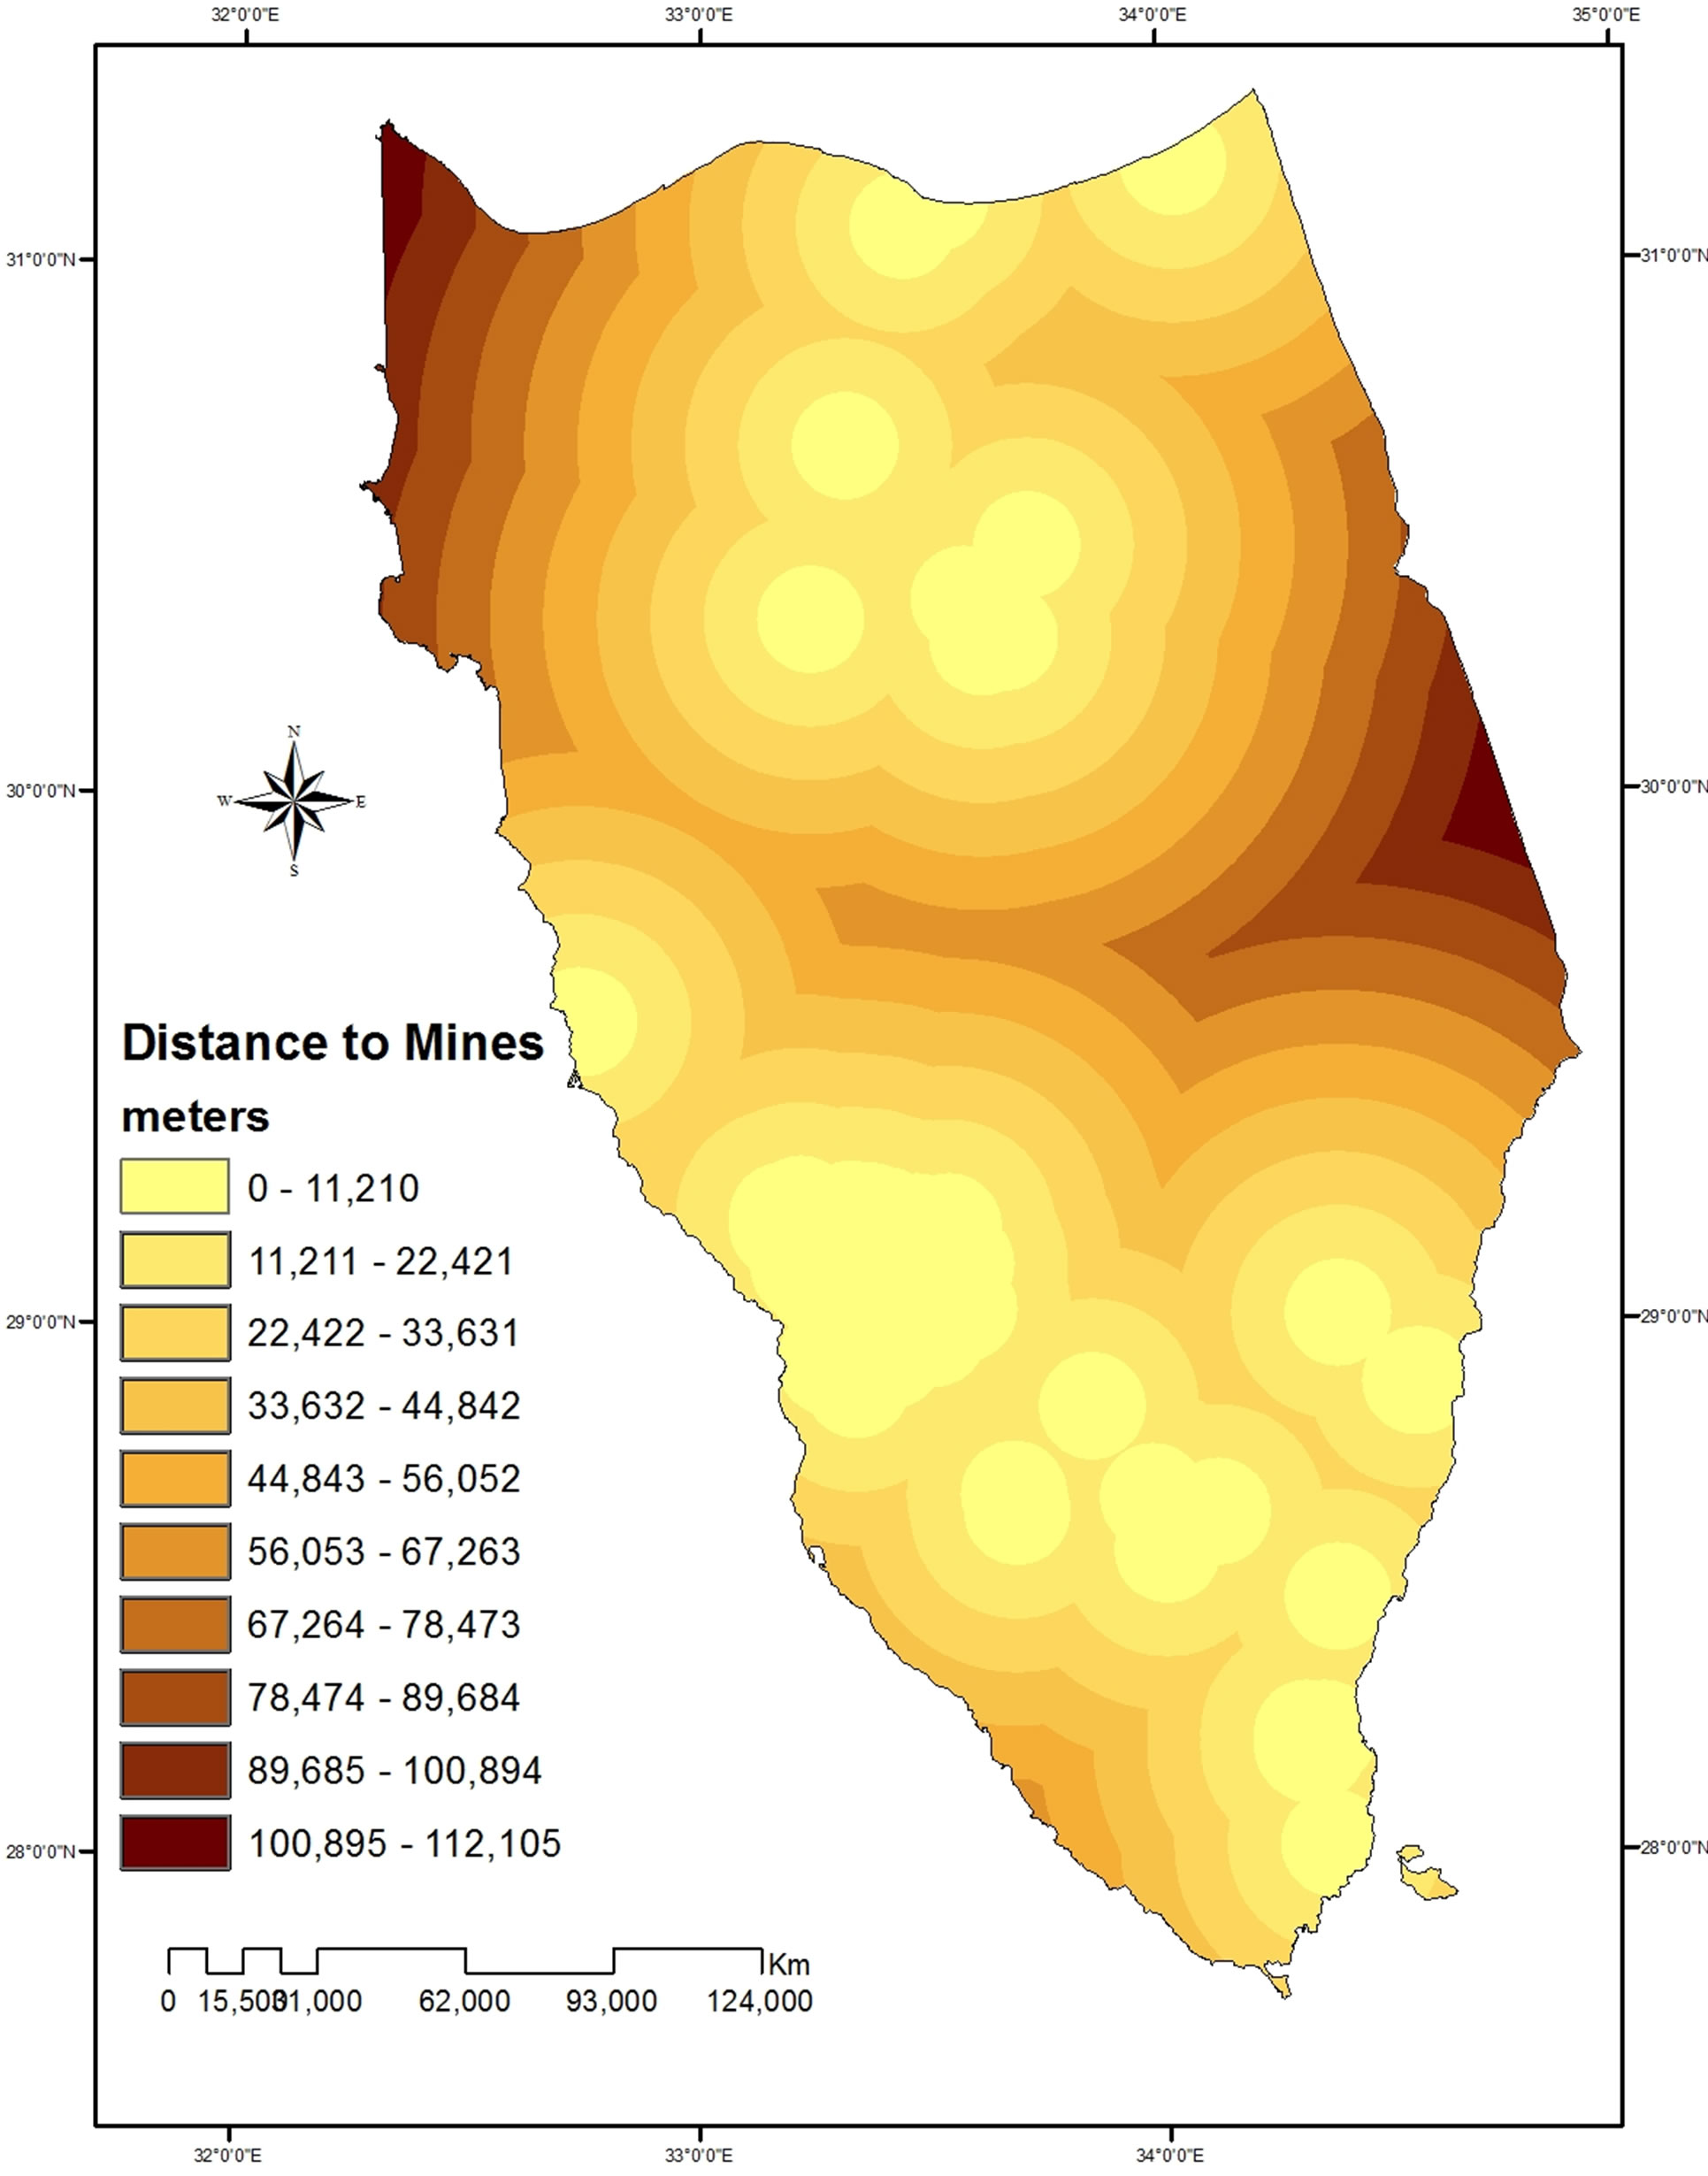
3) Mineral Resources The availability of mines and quarries is an essential factor for industrial activities. Sinai encounters several occurrences of various types of mineral resources including: coal, black sands, glass sand, kaolin, as well as building and construction raw materials such as marl, dolomite, sand, gravel and marble and granite. Large
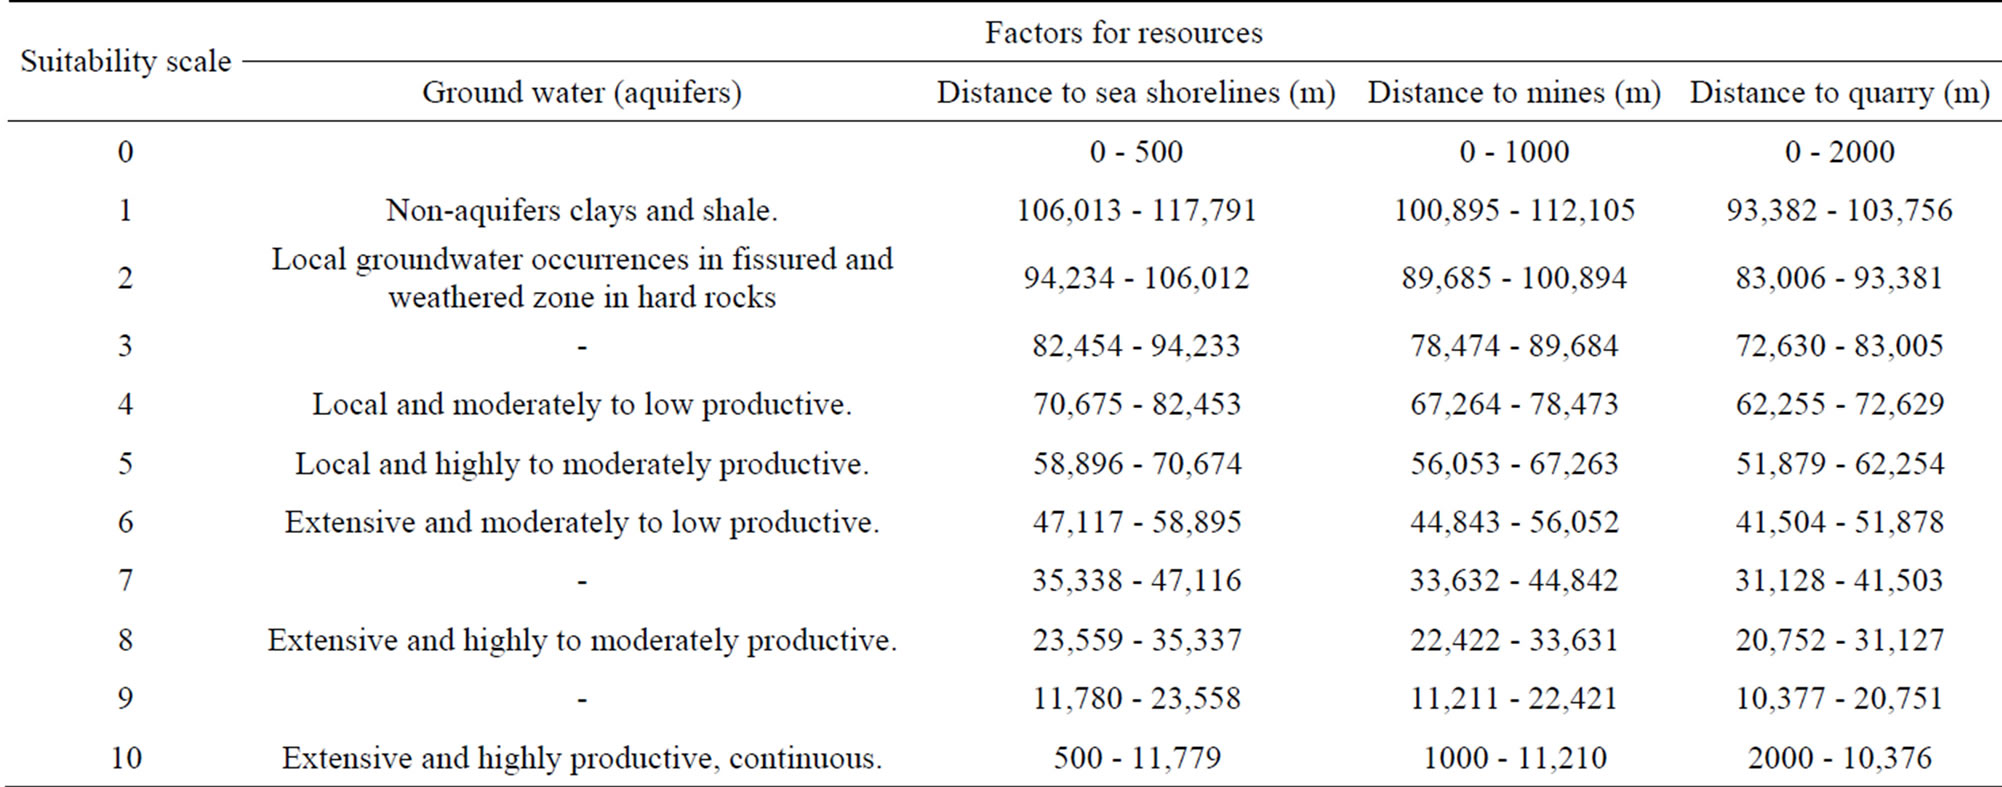
Table 1. Standardization of suitability factors: natural resources.
amount of raw materials for cement industry (limestone, shale and gypsum) are also available. Mineral resources map was obtained as a shape file from the Center of Housing and Building Researches, 2007 [25].
4.3.2. Land Stability Theme
Land stability sub-model aims at avoiding the land collapse vulnerable lands. Avoiding such vulnerable zones is crucial in selecting lands that would be developed as urban residential and new communities. For this purpose, a vulnerability map for land collapse hazards in Sinai was created. Such map identifies the highly vulnerable lands that should be avoided from the selection for new urban settlement. To produce the land stability map, the inverse of such map was used.
Land stability index map = 1/land vulnerability index map The vulnerability index map was modeled using the following factors:
1) Elevation Higher elevation zones are more vulnerable to land collapse due to the force of gravity. Thus the highest elevation sites are least suitable.
2) Slope Lands having steeper slope angles are more vulnerable to land collapse. Slope greater than 25 degree has been classified as unsuitable.
3) Lithology Different rock types have different response to land collapse. The lithology was reclassified according to the suitability scale 4) Seismic Intensity Zones Zones prone to high magnitude seismic activity are more vulnerable to land collapse.
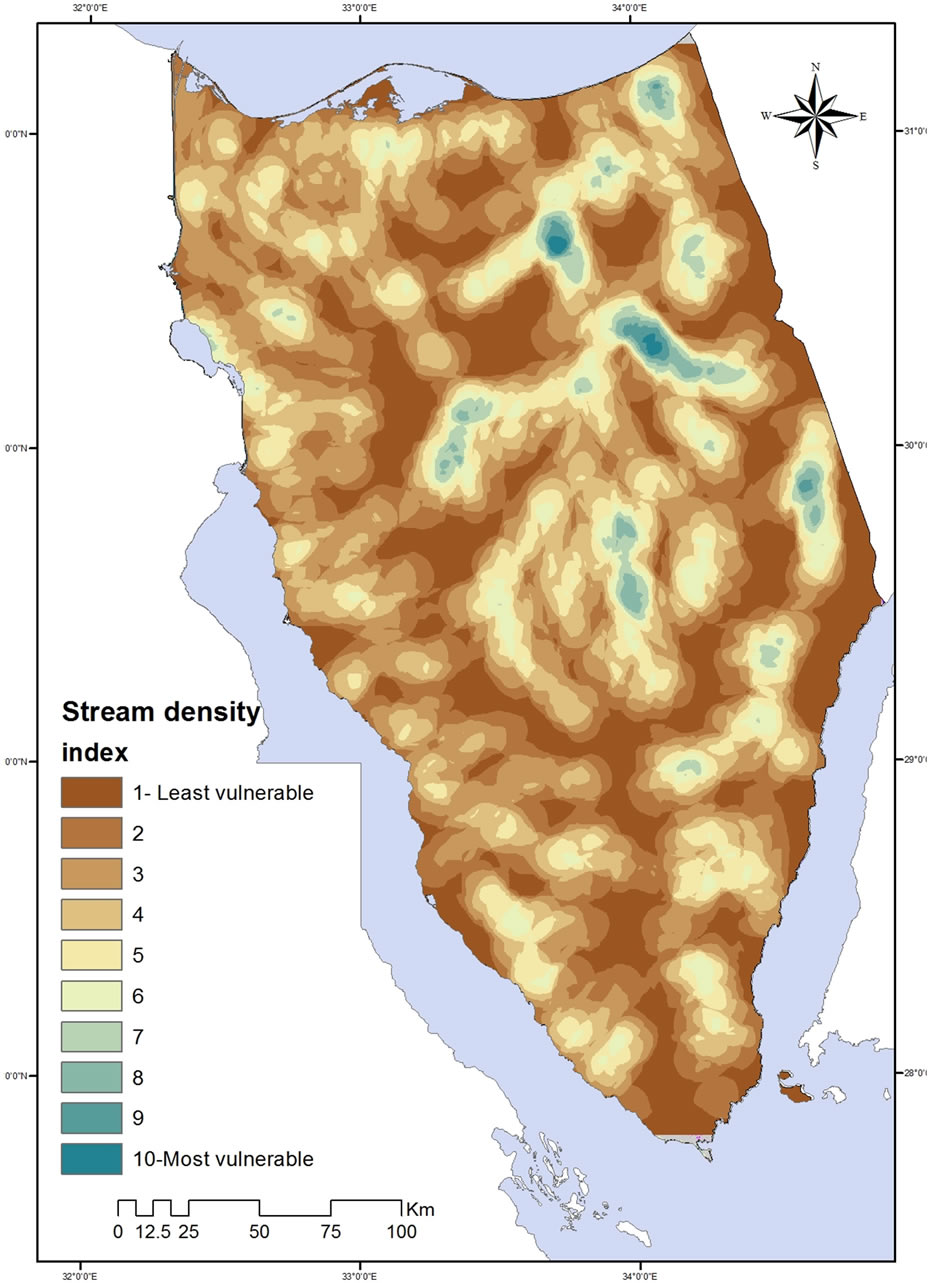
5) Stream Density The higher the stream density, the more vulnerable to land collapse.
6) Active Faults Zones Zones with active faults are more vulnerable to land collapse.
7) Faults Density Zones with high density of faults are vulnerable.
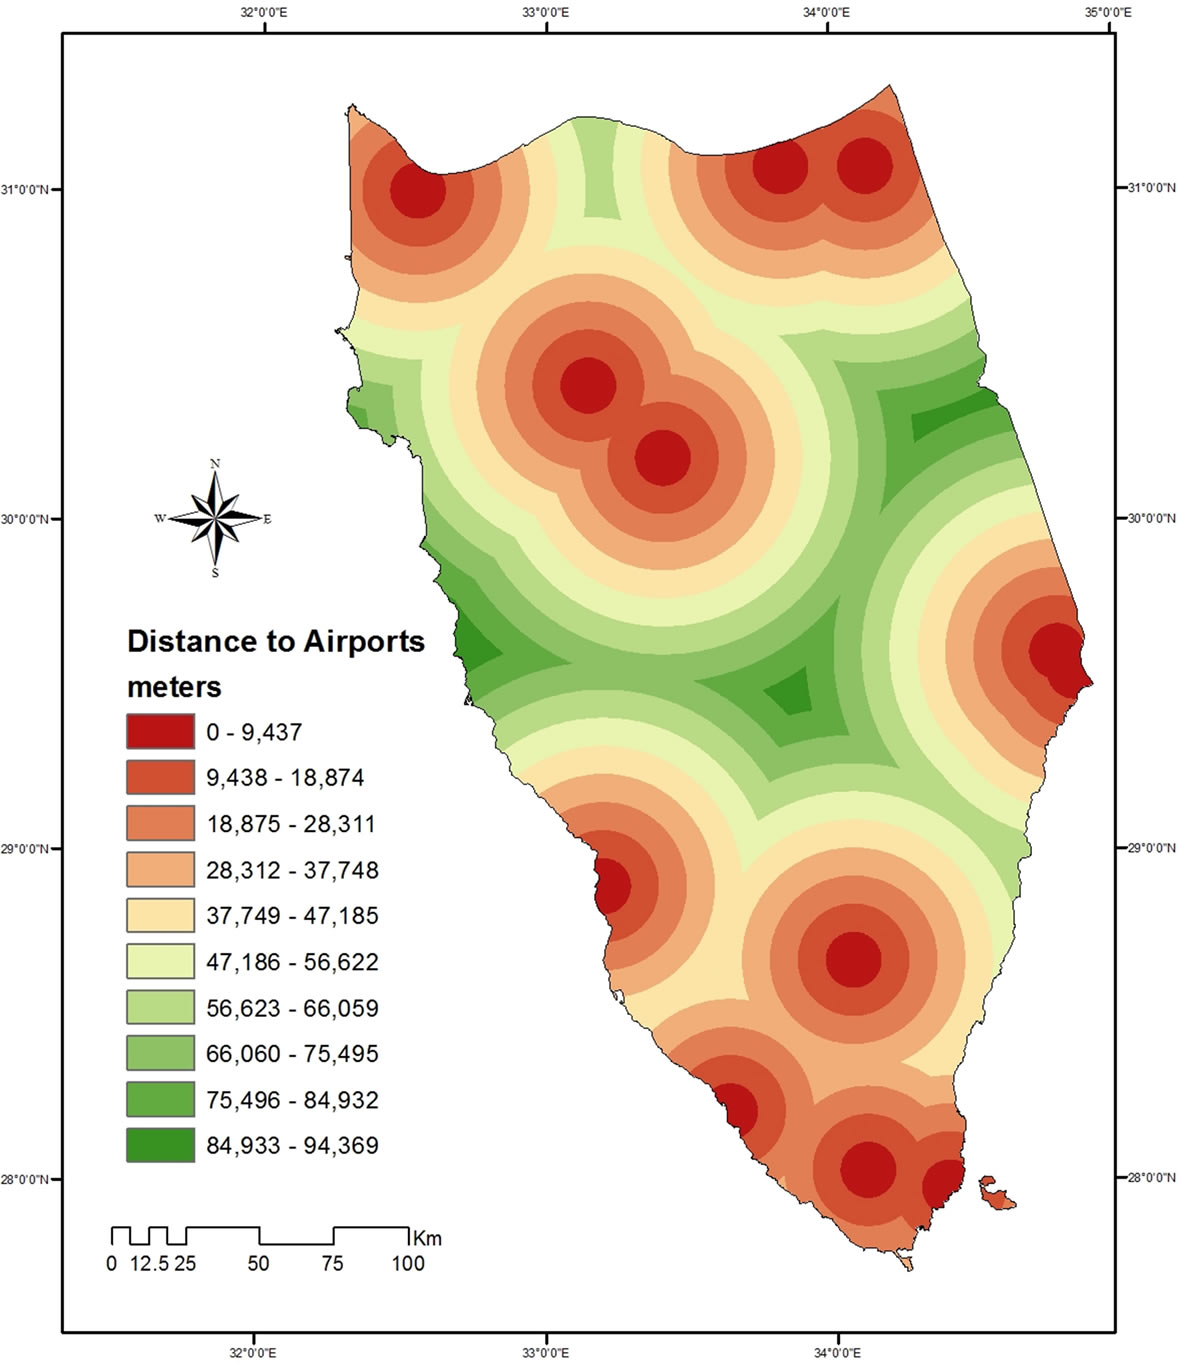
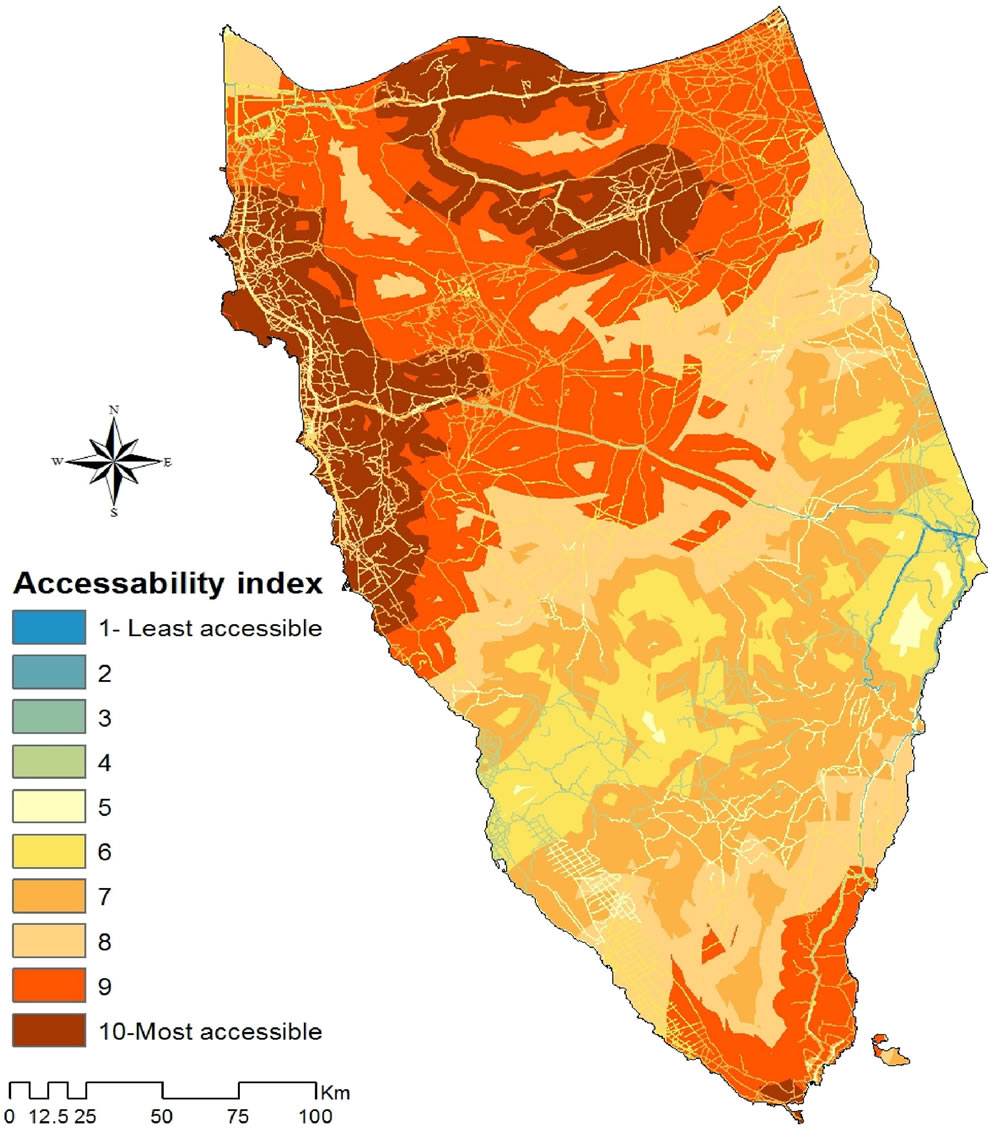
4.3.3. Accessibility Theme
Accessibility is a main factor that defines the decisions of people; accessibility to a site can be a main factor for polarization for a new location. Factors used to model the accessibility theme are defined as follows:
1) Roads Roads are the main arteries for a development site. They provide accessibility and link remote areas, constituting the main arteries for residential needs. Main corridors, paved roads and desert tracks were considered. All roads were digitized from the topographic map, updated from SPOT-4 images and a road distance map was created.
2) Ports The proximity to existing ports is an important factor for exchanging goods and providing jobs. A distance function was used to create a distance to ports map.
3) Airports Airports are crucial in serving a site providing accessibility and linking its remote areas. The airports sites were digitized from the topographic map and a distance map was created.
4.3.4. Costs of Construction Theme
The cost of construction is a main economic factor for decision making in site selection. Factors used to model the cost of construction theme are defined as follows:
1) Land Cover/Land Use Land cover-land use is the main basis for urban planning; the distribution of various land-use types gives considerable constraints to urban planning. For example natural protectorates, cultivated lands, urban areas are not liable to change. The land cover layer was derived by supervised classification of SPOT4 images. Six classes were identified namely: sabkha and wetlands, water bodies, cultivated land, natural vegetation, desert, urban and roads.
2) Water Supply Provision of a water resource is a main factor for developing an area. Underground water and sea water (for desalinization) were considered a possible water resource. Proximity from sea shore and underground water layers were produced using the distance module.
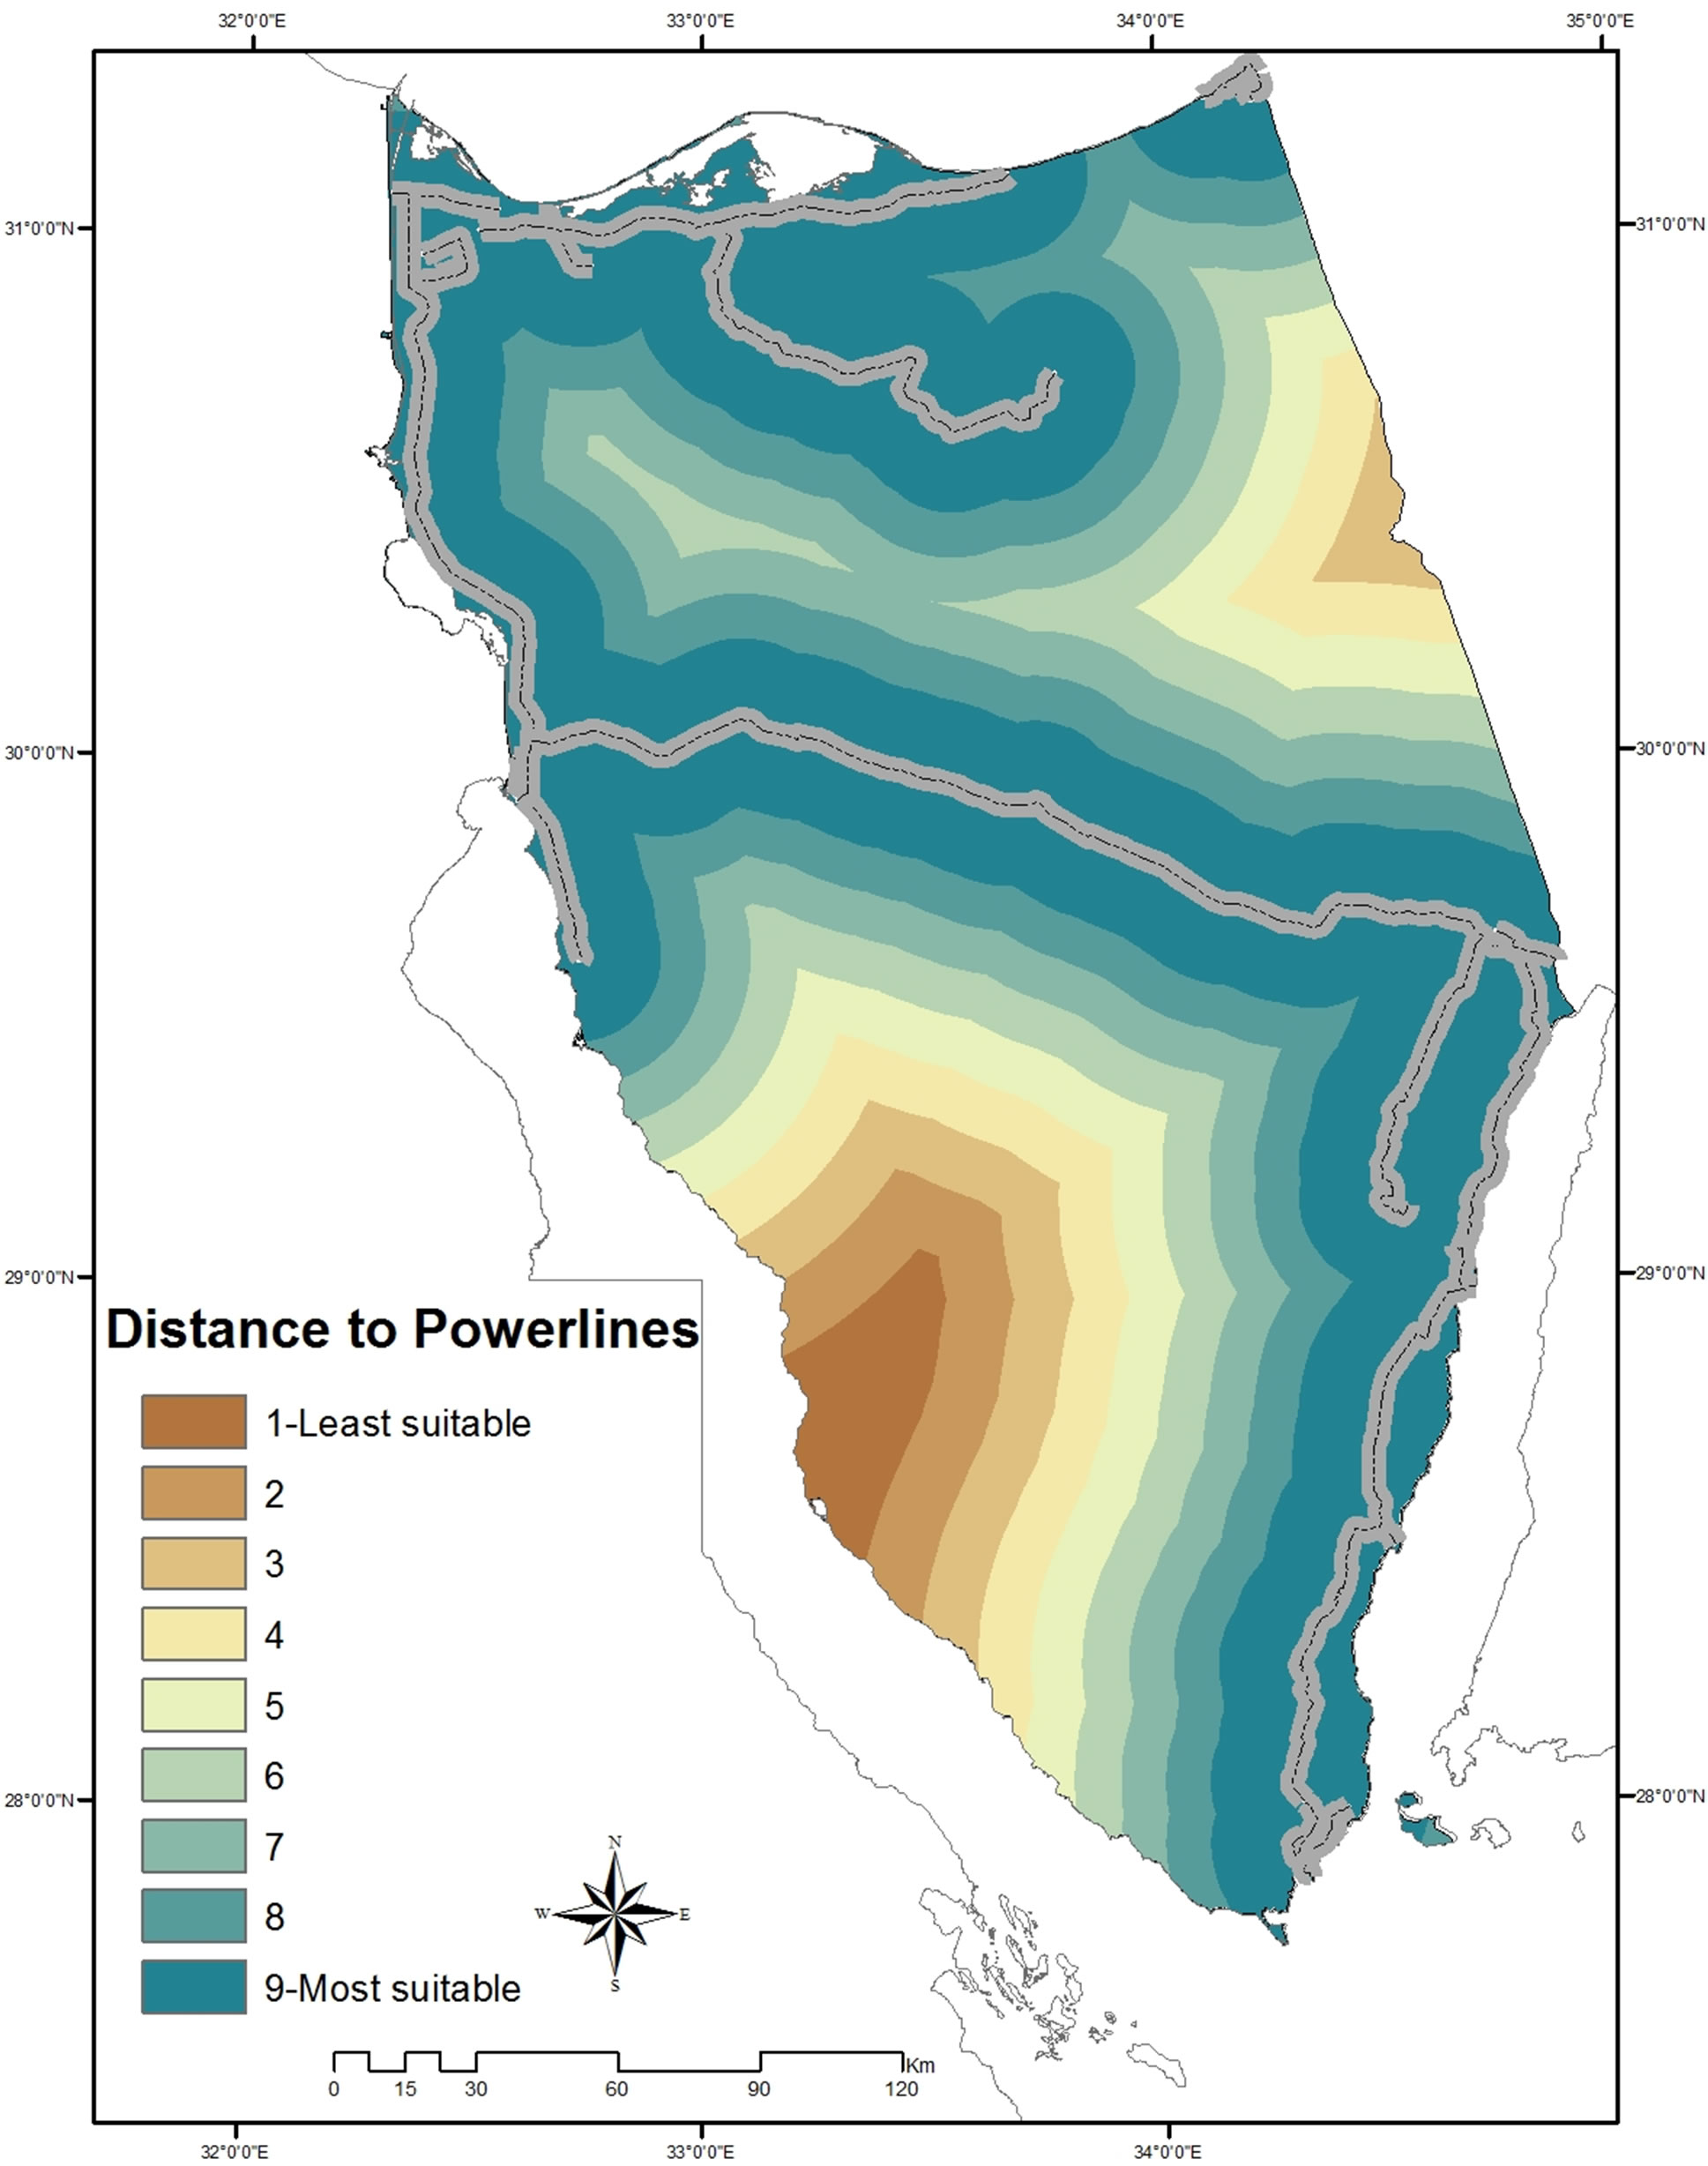
3) Power Supply The proximity of the site to a power supply facility such as high electric lines or power stations is an economic factor. The high electric lines and power stations were mapped from the topographic map.
4) Slope The slope was delineated using SRTM digital elevation model (DEM) in ESRI ArcGIS 9.2 spatial analyst.
4.3.5. Land Protection Theme
The investigated is unique in ecological and archaeological values. The protectorates and the archeological sites should be protected from any changes in land use. The protected zones were obtained from the Egyptian Environmental Affairs Agency, EEAA, 2007 [24]. The archaeology sites were obtained from the Egyptian General Organization for Physical Planning, GOPP, 2007 [27]. A binary function was used to classify the lands giving a zero value for the national protectorates and 500 meters buffer zone around the archaeological sites was given a zero value and masked out.
4.4. Transformation of Criteria Attributes to a Common Scale (Normalization)
Criteria attributes have different measuring scales. In order to perform analysis, a standardization has to be performed through transformation of attributes into a common suitability. For each factor, the attributes were rated in reference to a common scale. Thus for each submodel, the criteria attributes were transformed from the original values to a common suitability scale ranging from 1 - 10. The higher value being more favorable. A value of zero was given to unsuitable pixels (Tables 1-6).
4.5. Combining the Theme Factors (Layers)
Equal weights were used for the factors within a theme. The theme maps were created by combining such factors using the following equation:
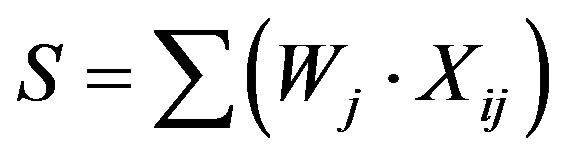 (1) [29]
where: S = composite suitability score, Wj = weights assigned to each factor j, Xij = attribute score i of factor j.
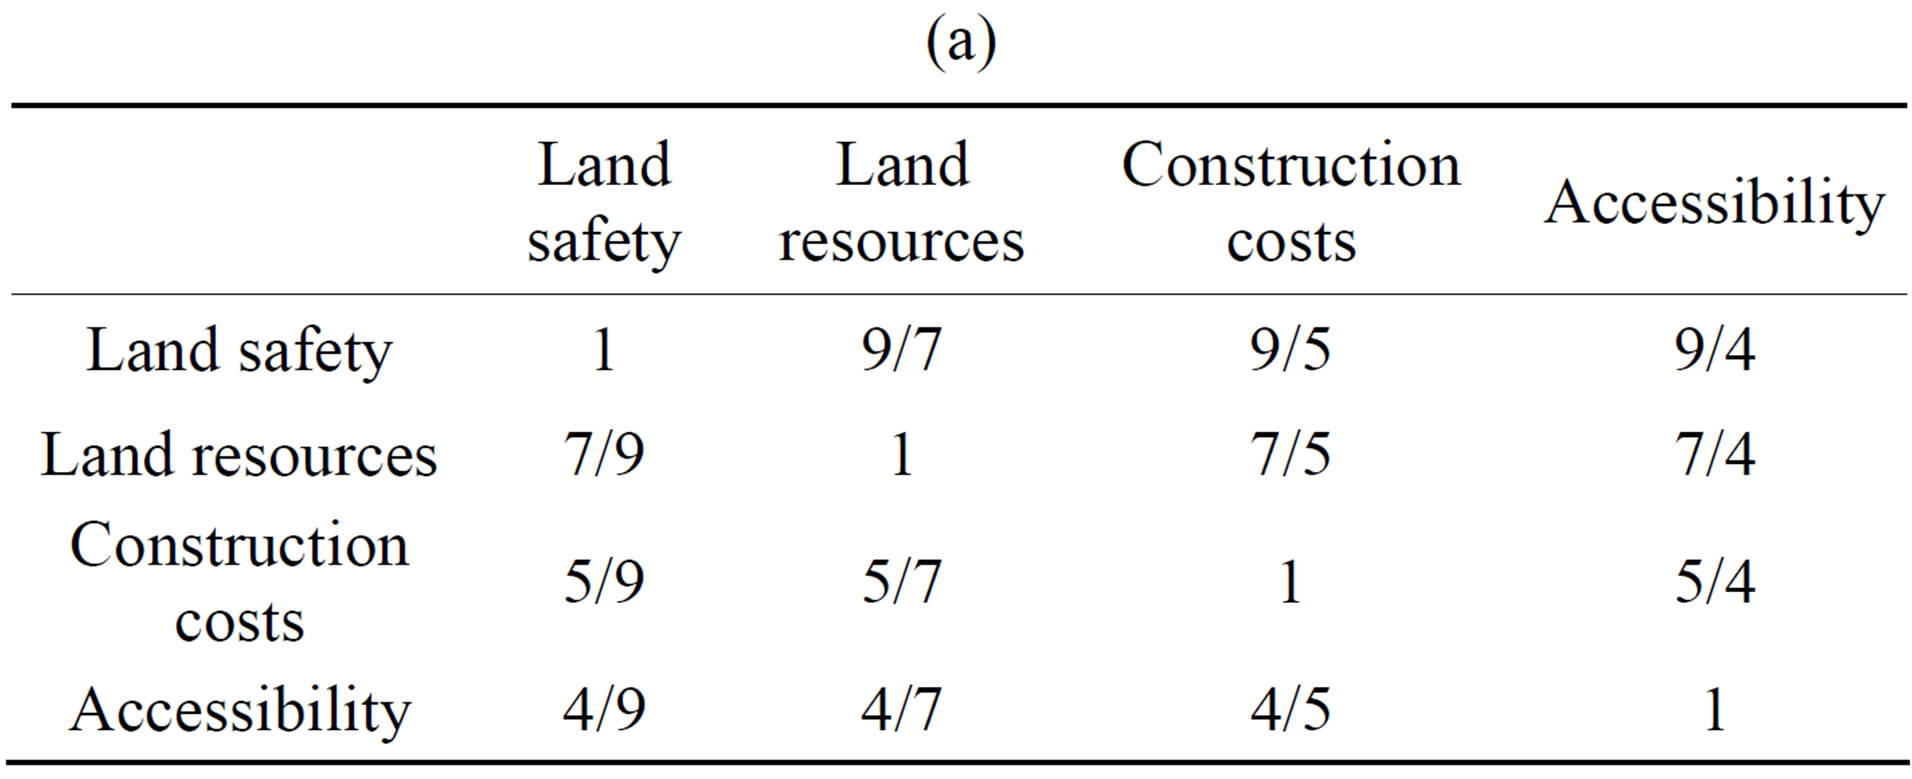
4.6. Calculation of the Theme Weights
Certain factors may be more important to the overall goal than others. If this is the case, the factors can be weighted based on their relative importance. Analytical Hierarchy Process [30] was used to assign weights to each criterion, factor, and thus determine their relative importance in the final decision adopted within the model. The method is based on pair-wise comparison within a reciprocal matrix, in which the number of rows and columns is defined by the number of criteria. Accordingly, it is necessary to establish a comparison matrix between pairs of criteria, contrasting the importance of each pair with all the others. Subsequently, a priority vector is computed to establish weights (Wj). These weights are a quantitative measure of the consistency of the value judgments between pairs of factors [31]. Satty’s scale of measurement is used as follows:
S = {1/9, 1/8, 1/7, 1/6, 1/5, 1/4, 1/3, 1/ 2, 1, 2, 3, 4, 5, 6, 7, 8, 9}.
A pairwise comparison matrix was designed. The comparison ratings are provided on a nine-point continuous scale, which was proposed by (Eastman, 1995) [29]. The comparisons ratings and factors were discussed with experts and a pairwise comparison matrix was constructed based on (Table 3). If we call that weight aij, and use that scale of comparison and if the relative weighting is a23 = 3/1, then the relative importance of attribute 3 with regard to 2 is its reciprocal a32 = 1/3. This process generated an auxiliary matrix in which the value in each cell is the result of the division of each value judgment (aij) by the sum of the corresponding column. Finally, the average of the normalized values of rows was obtained, which corresponds to the priority vector (Wj). This was normalized by dividing each vector value by n (the number of vectors), thus obtaining the normalized overall priority vector, representing all factor weights (Wj).
1) Determination of the weighted sum vector by multiplying matrix of comparisons on the right by the vector of priorities to get a new column vector. Then divide first component of new column vector by the first component of priorities vector, the second component of new column vector by the second component of priorities vector, and so on. Finally, sum these values over the rows.
2) Determination of consistency vector by dividing the weighted sum vector by the criterion weights. Once the consistency vector is calculated it is required to compute values for two more terms, lambda (λ) and the consistency index (CI). The value for lambda is simply the average value of the consistency vector.
The calculation of CI is based on the observation that λ is always greater than or equal to the number of criteria under consideration (n) for positive, reciprocal matrices and λ = n, if the pairwise comparison matrix is consistent matrix. Accordingly, λ-n can be considered as a measure of the degree of inconsistency. This measure can be normalized as follows:
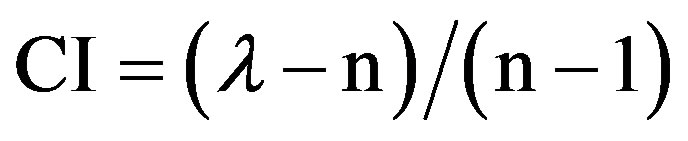 (2)
(2)
The term CI, referred to as consistency index, provides a measure of departure from consistency. To determine the goodness of CI. The Analytical Hierarchy Process (AHP) compares it by Random Index (RI), and the result is what we call CR, which can be defined as:
 (3)
(3)
Random Index (RI) is the CI of a randomly generated pairwise comparison matrix of order 1 to 10 obtained by approximating random indices using a sample size of 500 [31], Table 3 shows the value of RI sorted by the order of matrix.
4.7. Combining the Four Themes
In overlay analysis, it is desirable to establish the relationship of all the input factors together in order to identify the desirable locations that meet the goals of the model. If a weighted summation is used, the higher the value on the resulting output raster, the more desirable the location will be. A weighted overlay was used to combine the criteria maps and to produce the final suitability index for suitable urban zones.
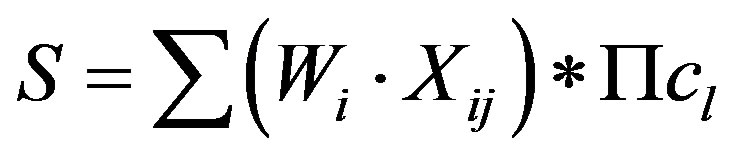 (4) [28,29]
where: S = composite suitability score, Wj = weights assigned to each factor j, Xij = attribute score i for factor j,
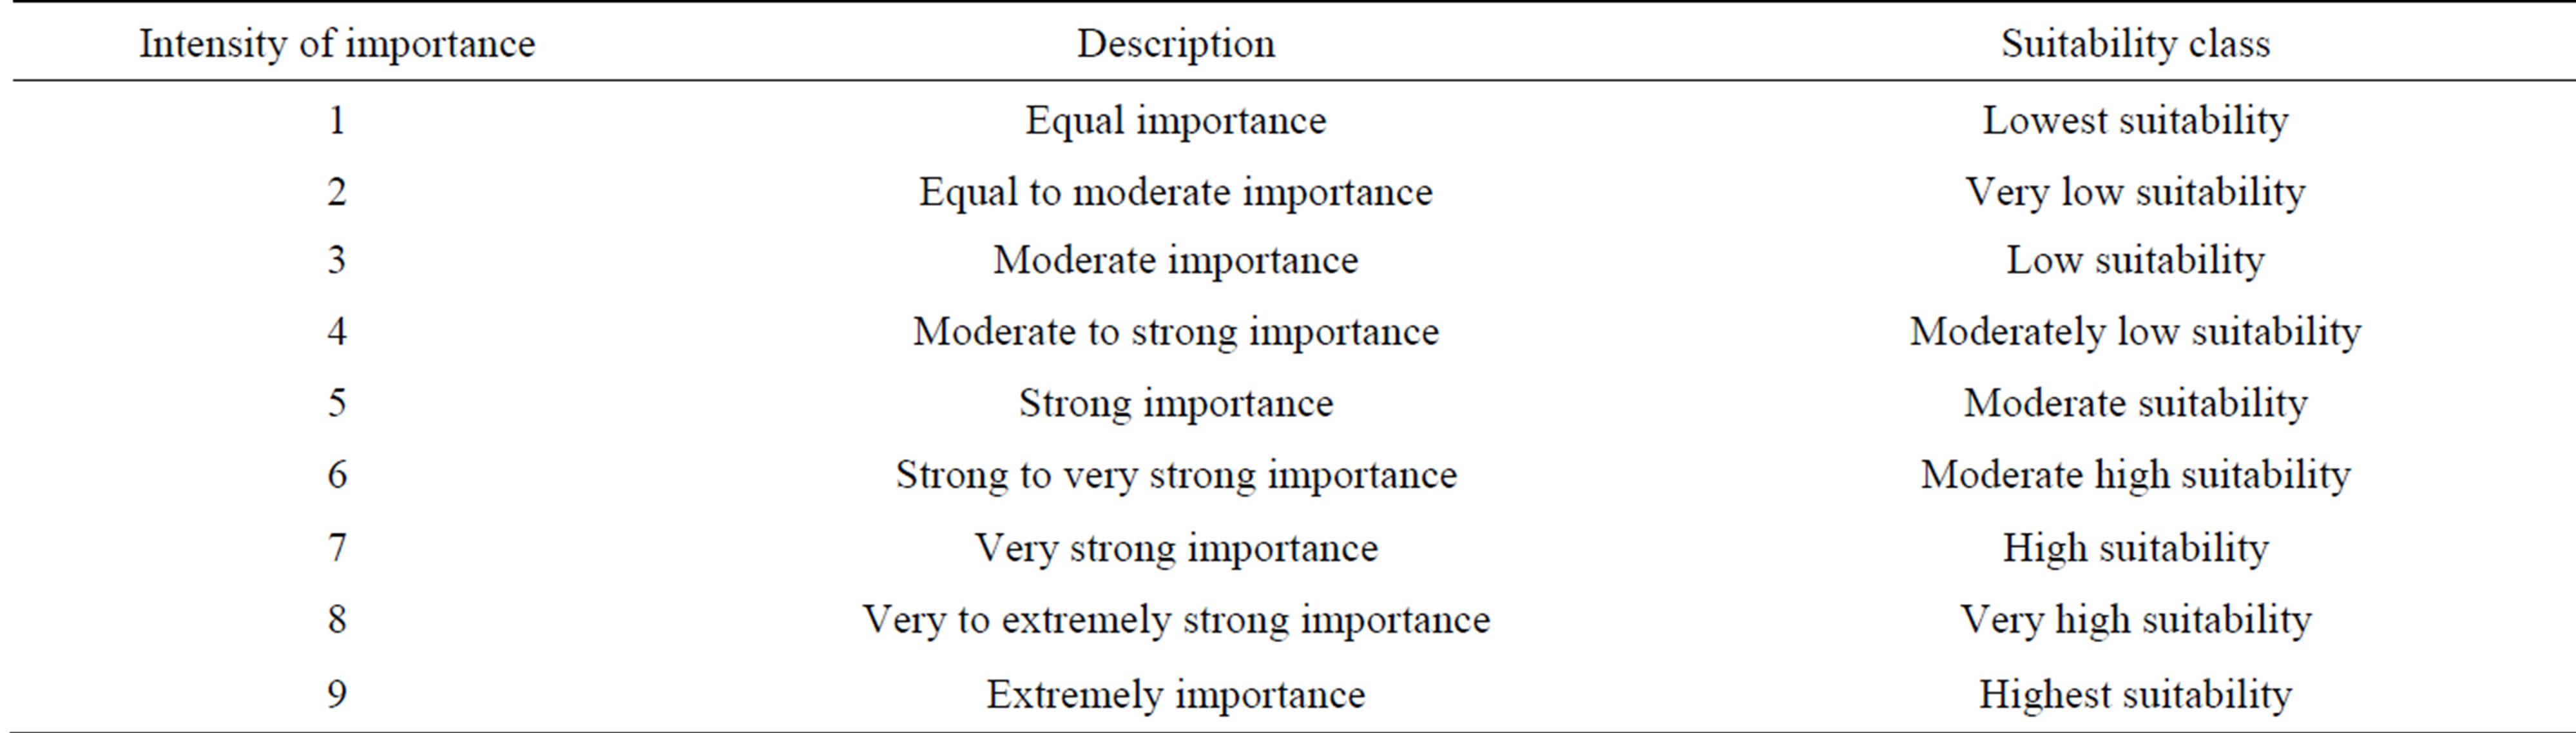
Table 2. Saaty’s nine-point weighting scale [31].

Table 3. Random index (RI) (Saaty, 1980) [32].
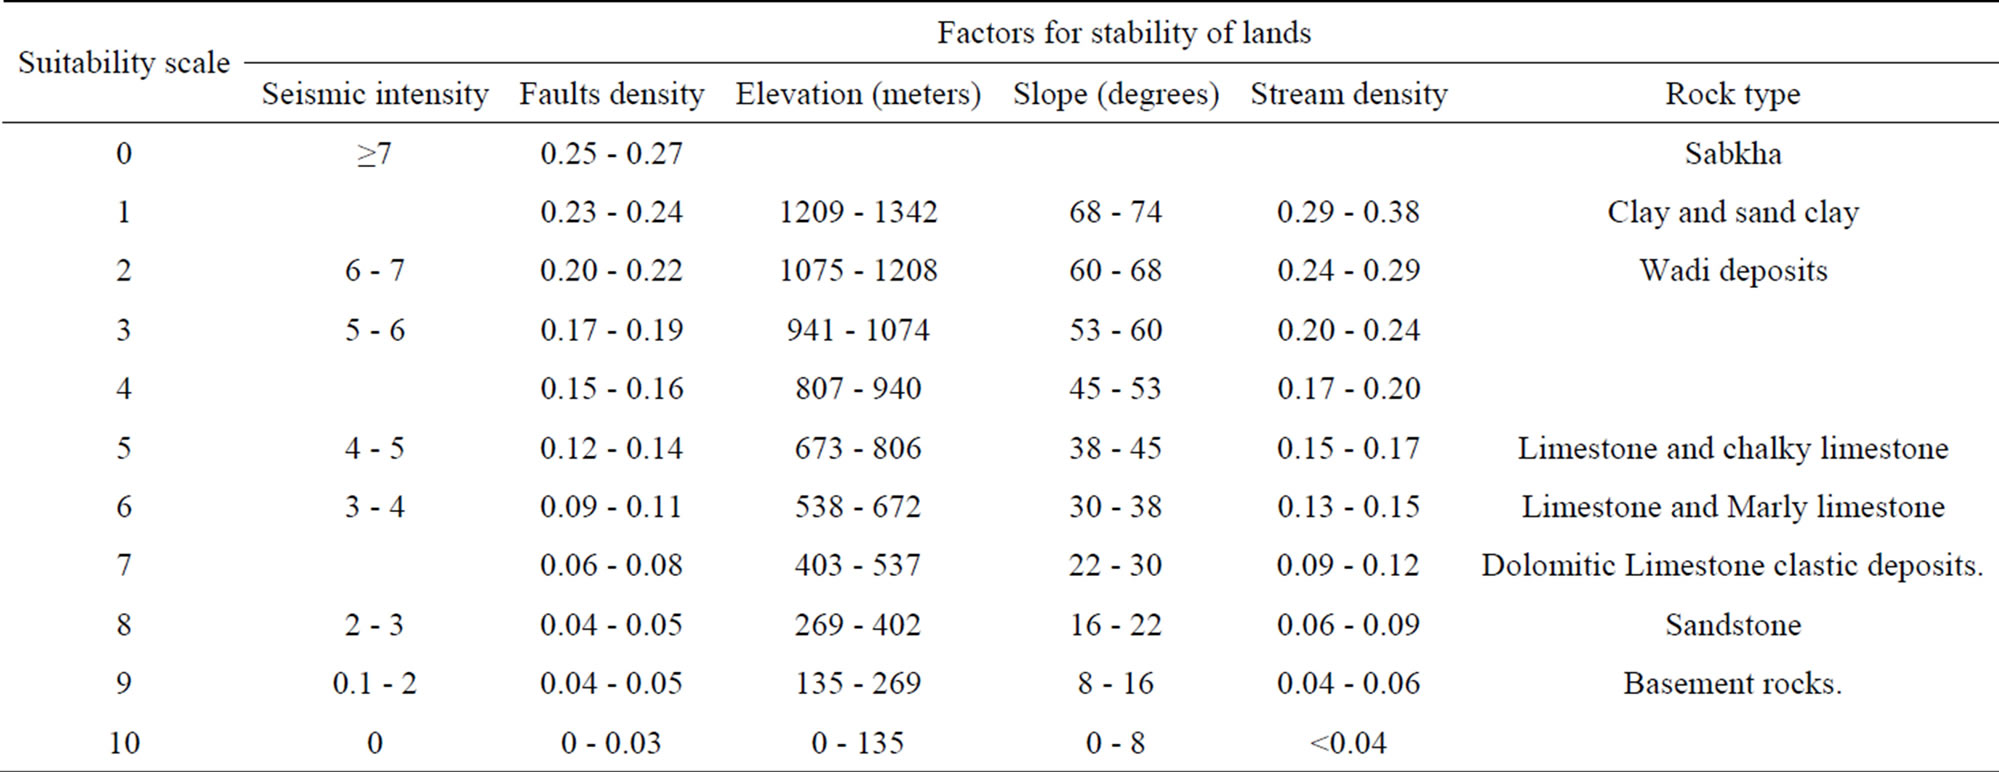
Table 4. Standardization of the suitability factors; land stability.
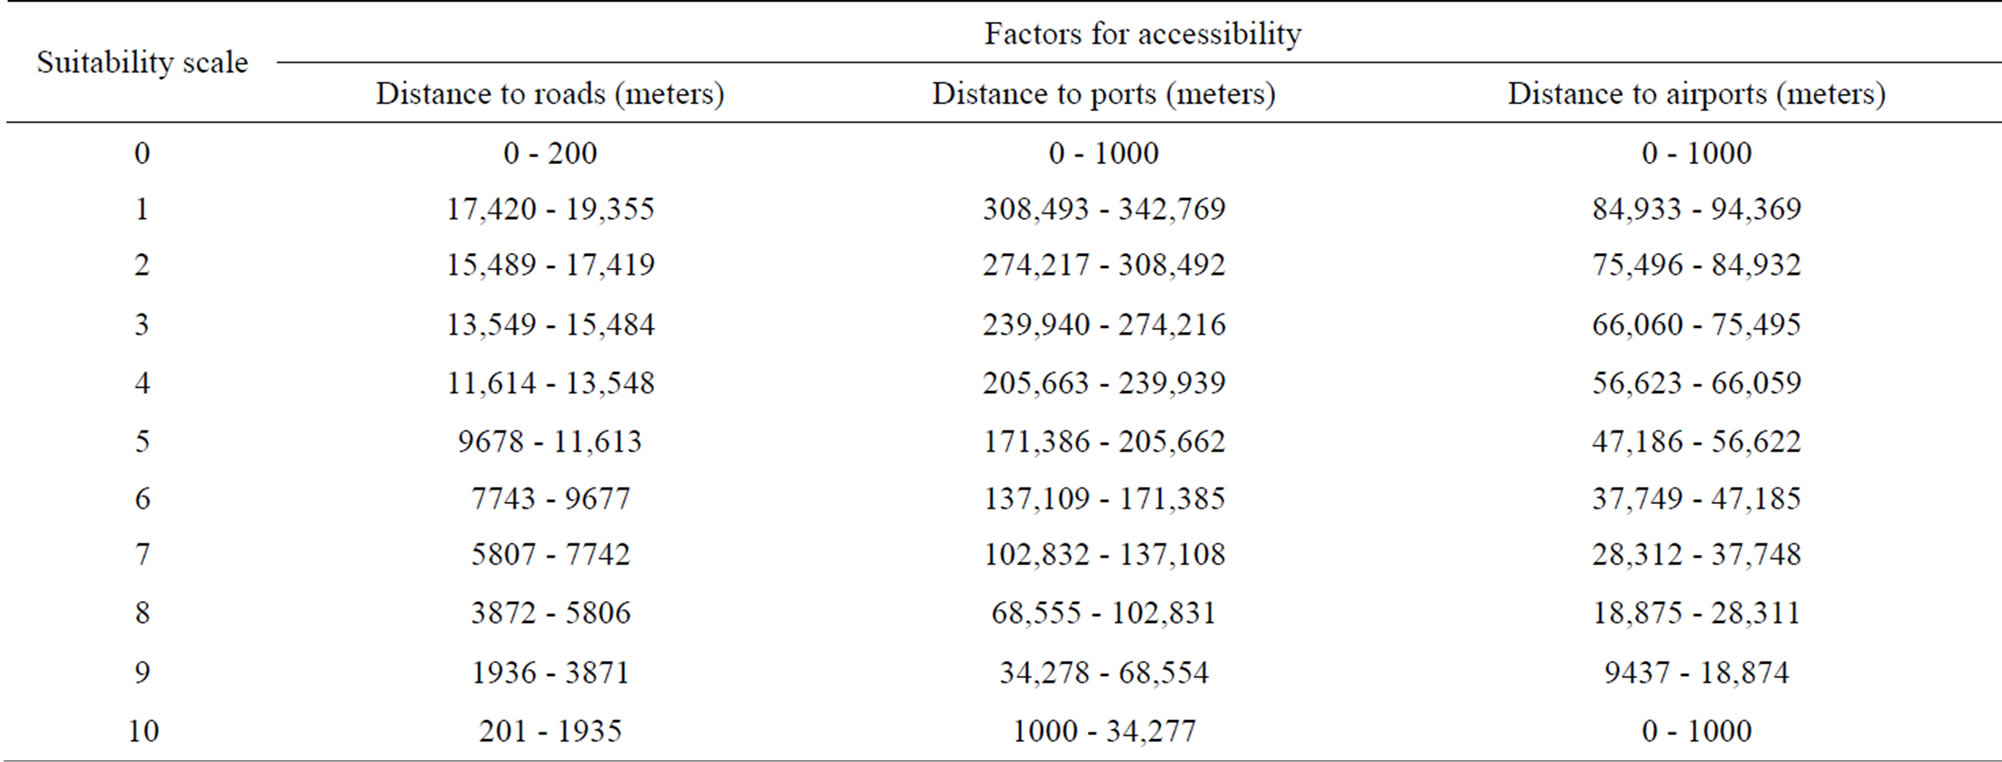
Table 5. Standardization of the suitability factors: accessibility.
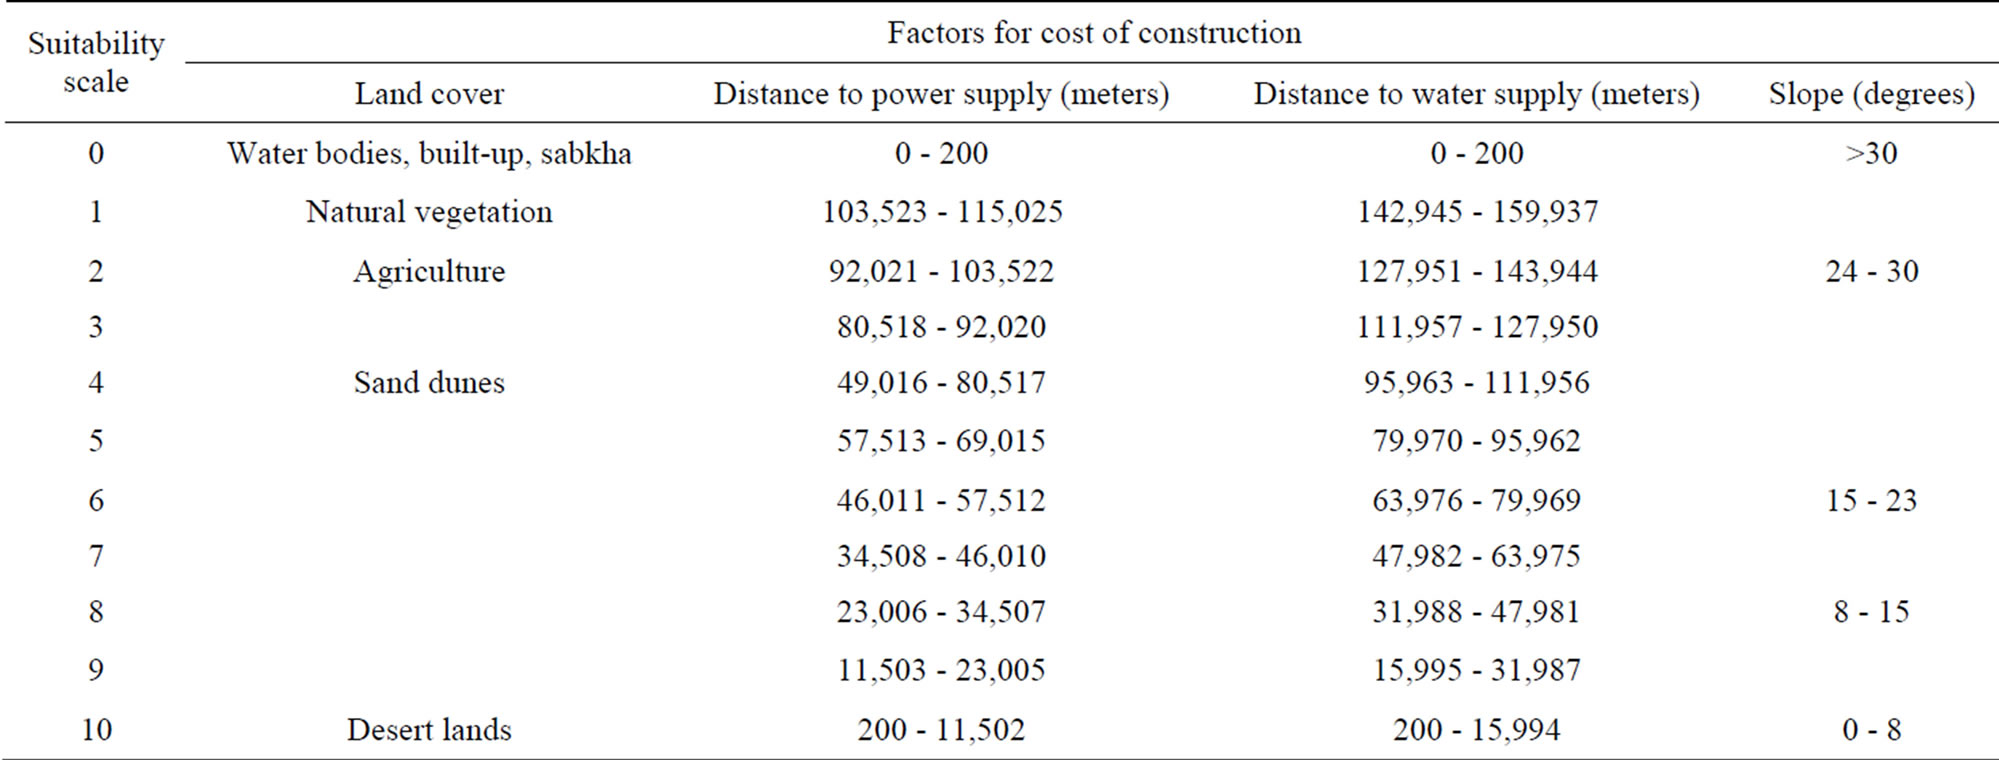
Table 6. Standardization of the suitability factors: cost of construction.
Πcl is the constraint binary map description of symbols.
5. Results and Discussion
In this section, the resultant factors maps that were created using ESRI Spatial Analyst various functions are presented. Factors constituting each theme are grouped together for each of the five criteria themes as follows:
5.1. Factor Maps and Standardization Tables
Factor maps for Themes are depicted in the following figures; land resources (Figure 3), land stability (Figure 4), accessibility (Figure 5) and construction costs (Figure 6) Such maps are the preliminary results which were further processed to produce the sub-models themes index maps:
Figure 3 shows the factors of the land resources theme and the spatial distribution of potential land resources in the North, middle and southern zones. Figure 4 shows the spatial distribution of geologic stable and less stable lands. Figure 5 shows the factors of the accessibility theme and spatial distribution of most and least accessible zones based on the road networks. Factors for the least cost theme are shown in Figure 6. Standardization of the criteria maps are also presented in Tables 1, 4 and 5.
5.2. Deriving the Factor Weights
Tables 7(a)-(c) depict the Analytical Hierarchy Process AHP used to calculate the factor weights. Table 7(d) depicts the calculation of the consistency ratio (CR).
5.3. Deriving the Sub-Models for Each Theme
The four sub-models themes (Figures 7(a)-(d)) were derived by running Multlicriteria evaluation model Equation (1) using equal factor weights. Land Protection theme binary sub-model is shown in Figure 8.
The model produced a suitability index map for poten-
 (a)
(a)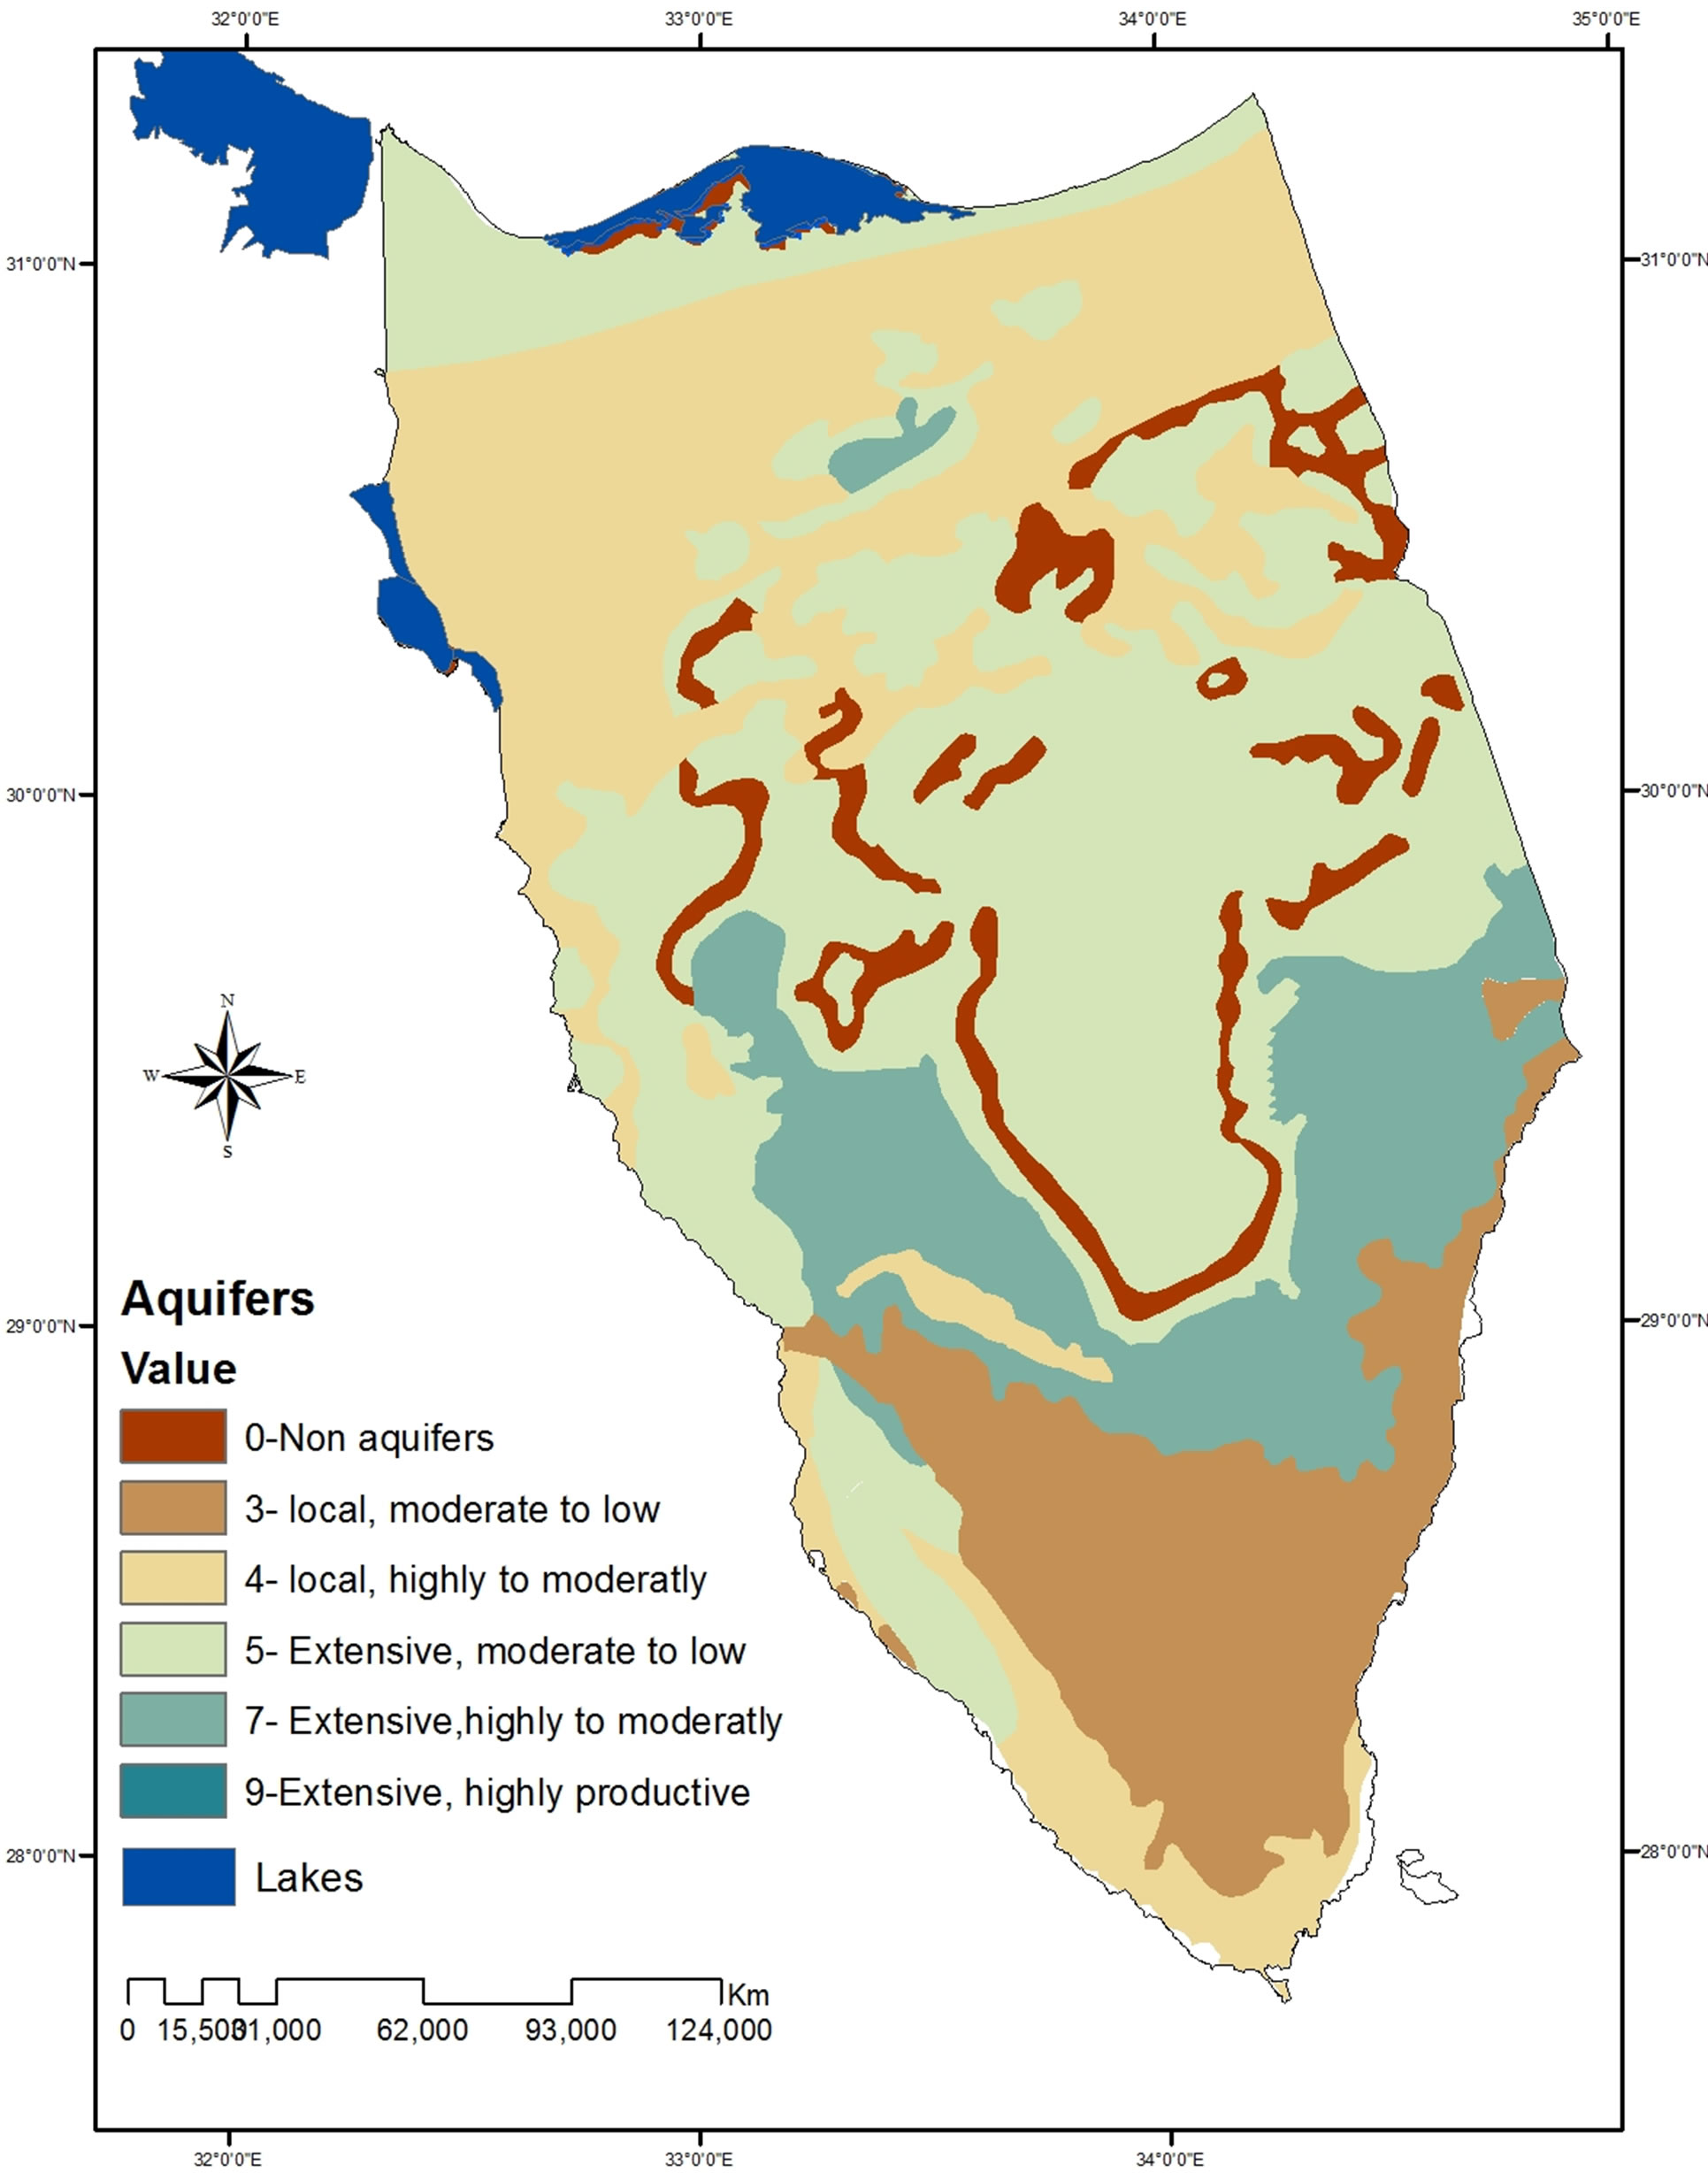 (b)
(b)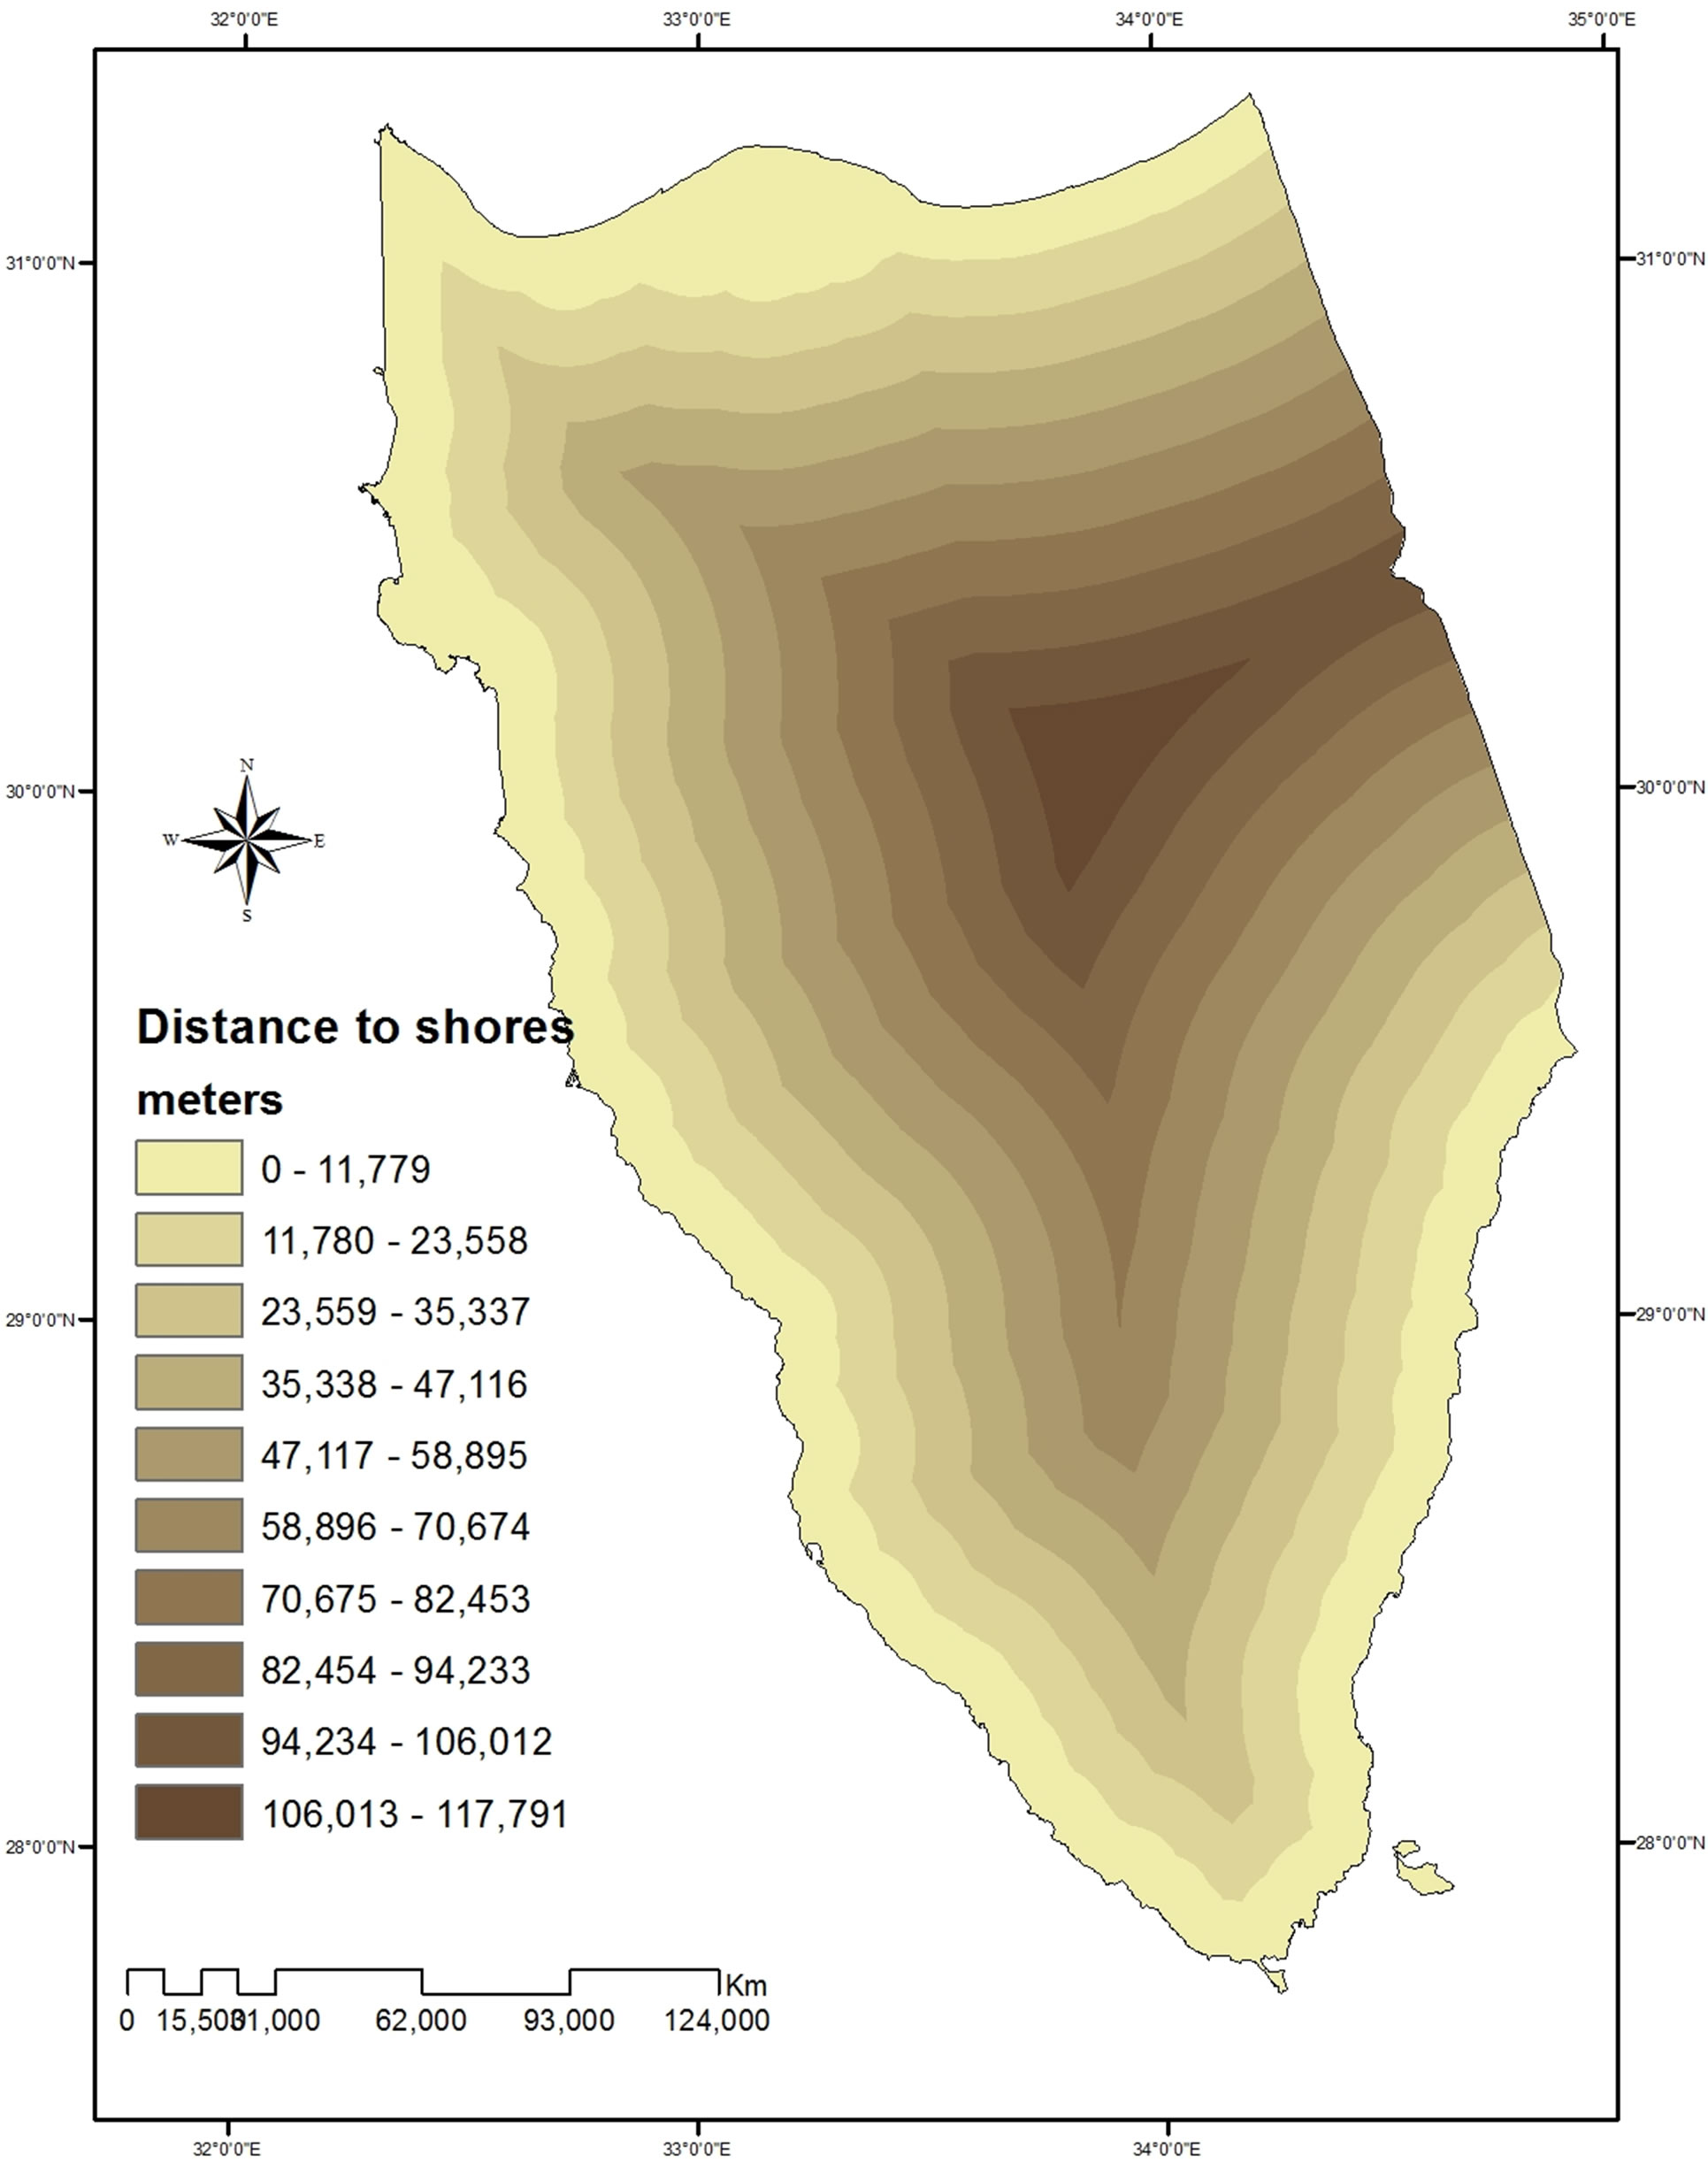 (c)
(c)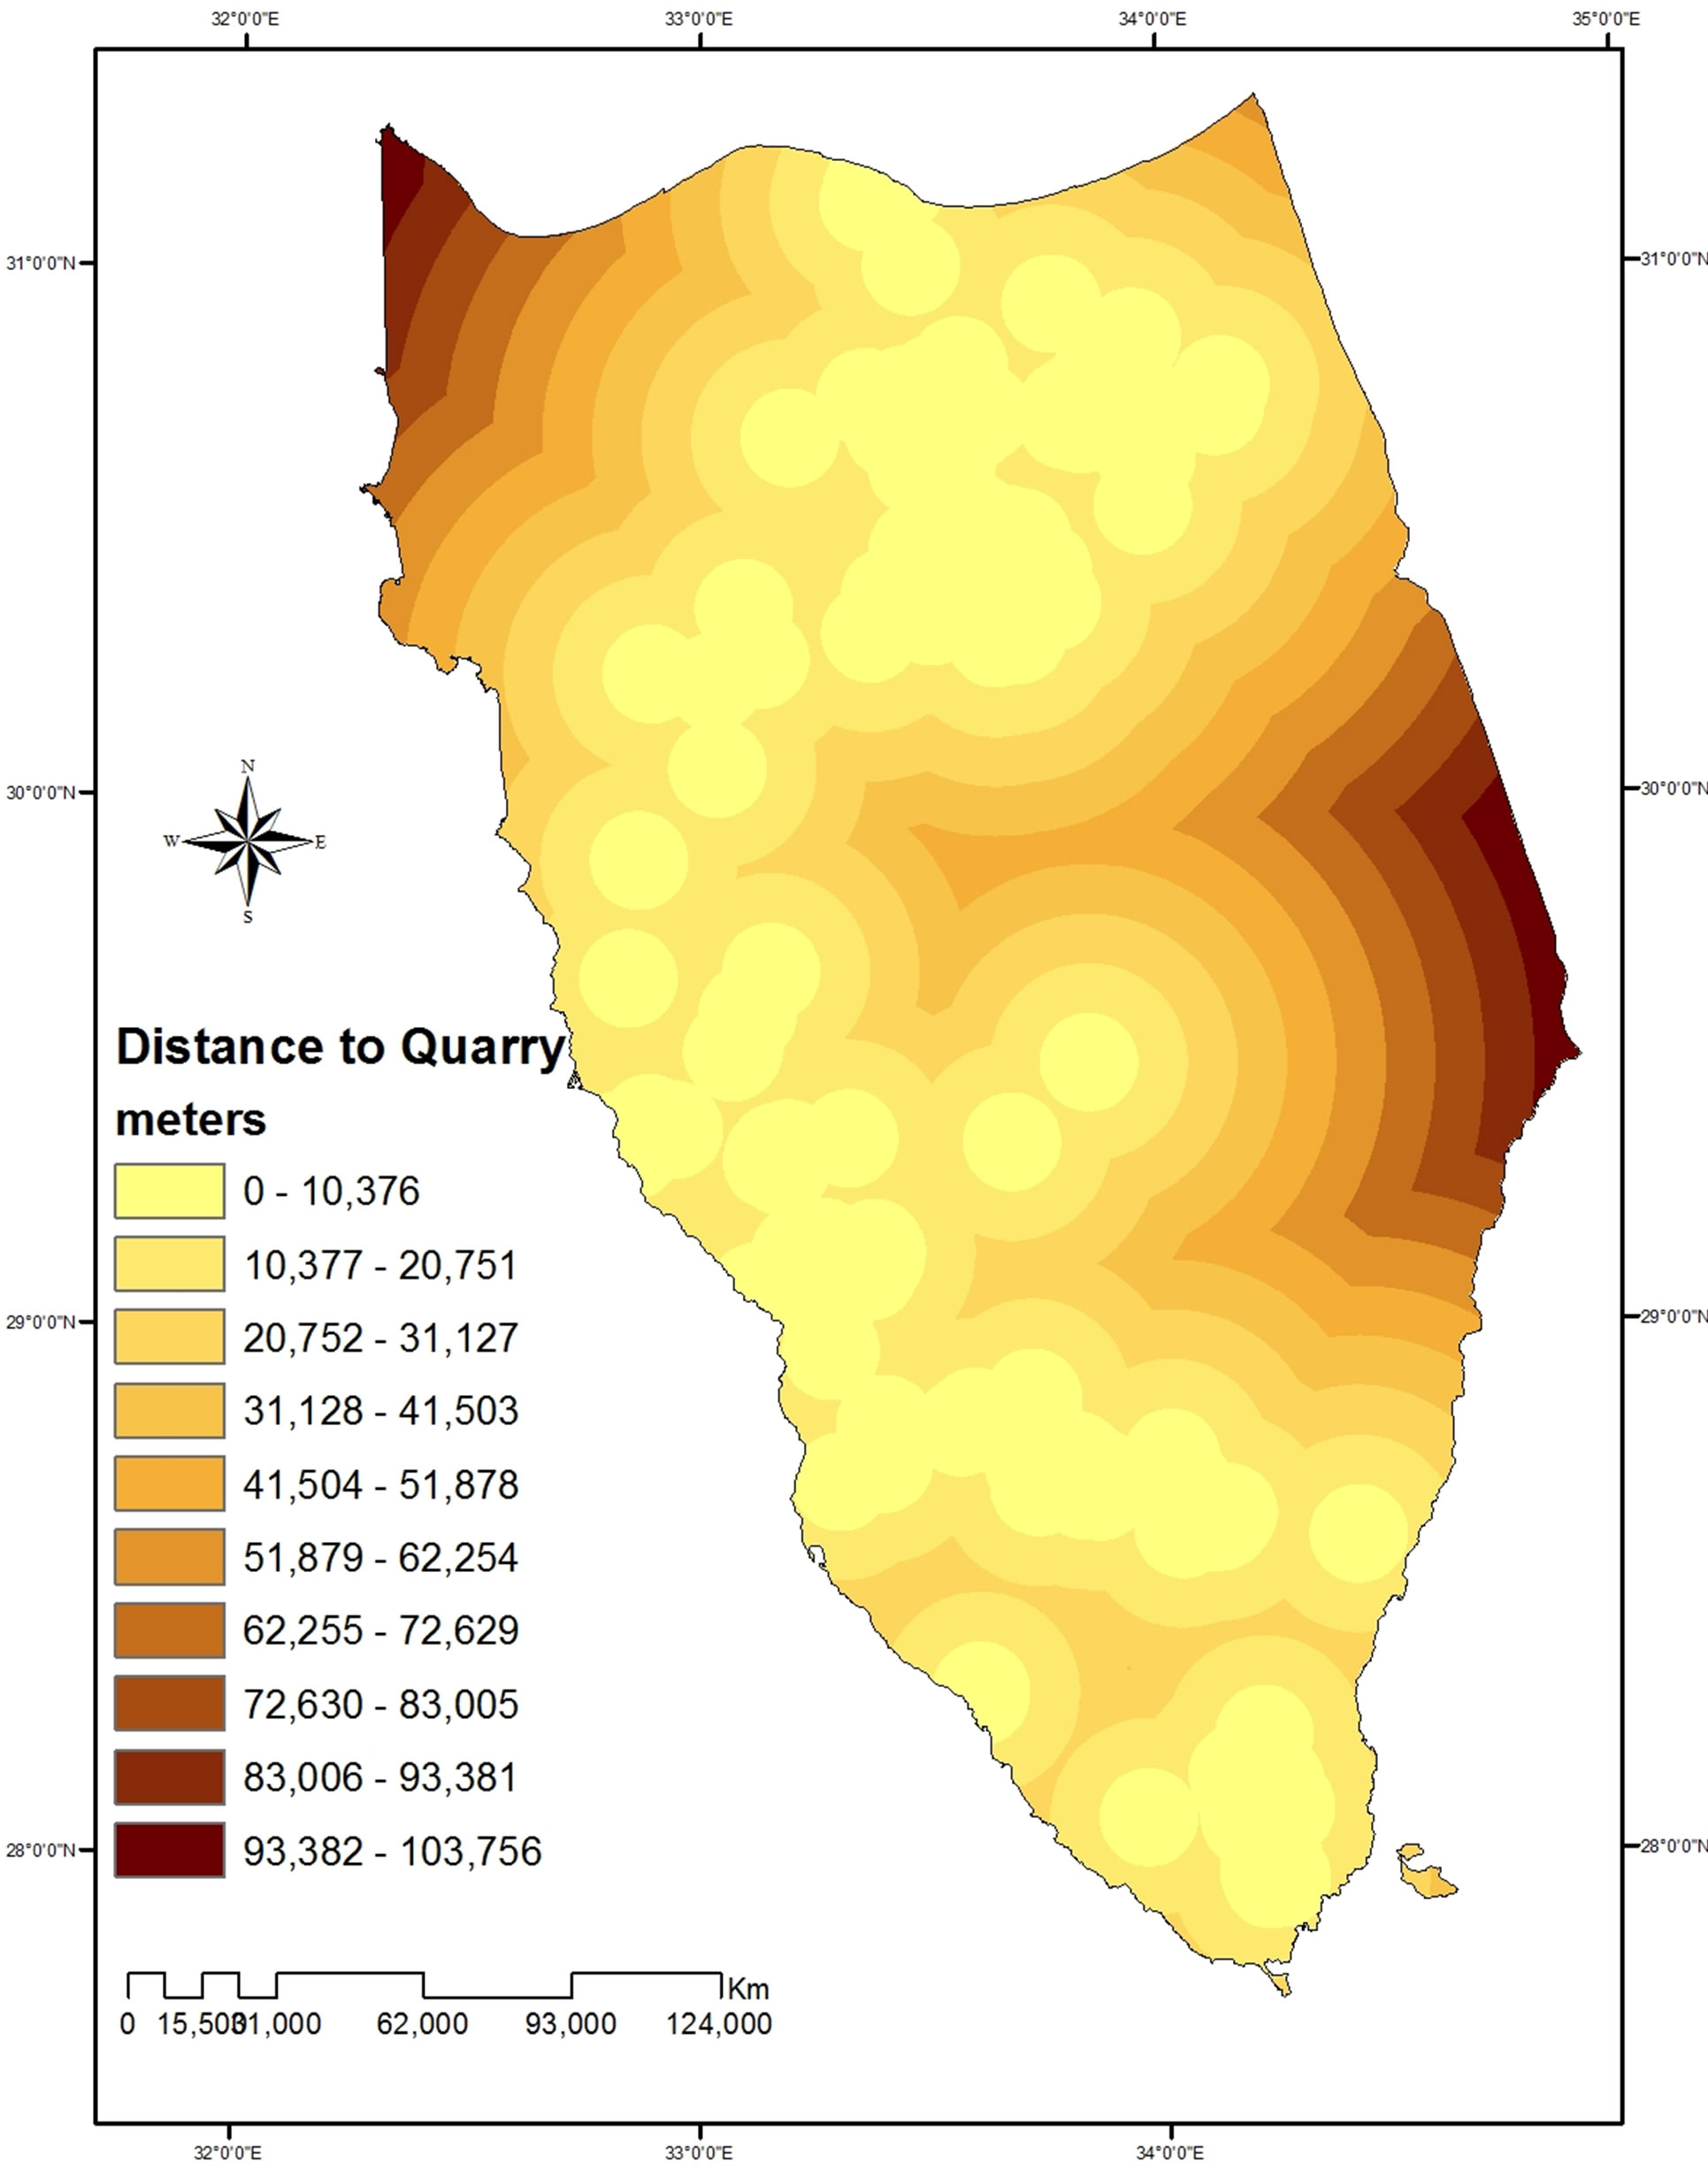 (d)
(d)
Figure 3. Factors maps of land resources: (a) Aquifers; (b) Distance to mining sites; (c) Distance to quarry sites; (d) Distance to shorelines.
 (a)
(a)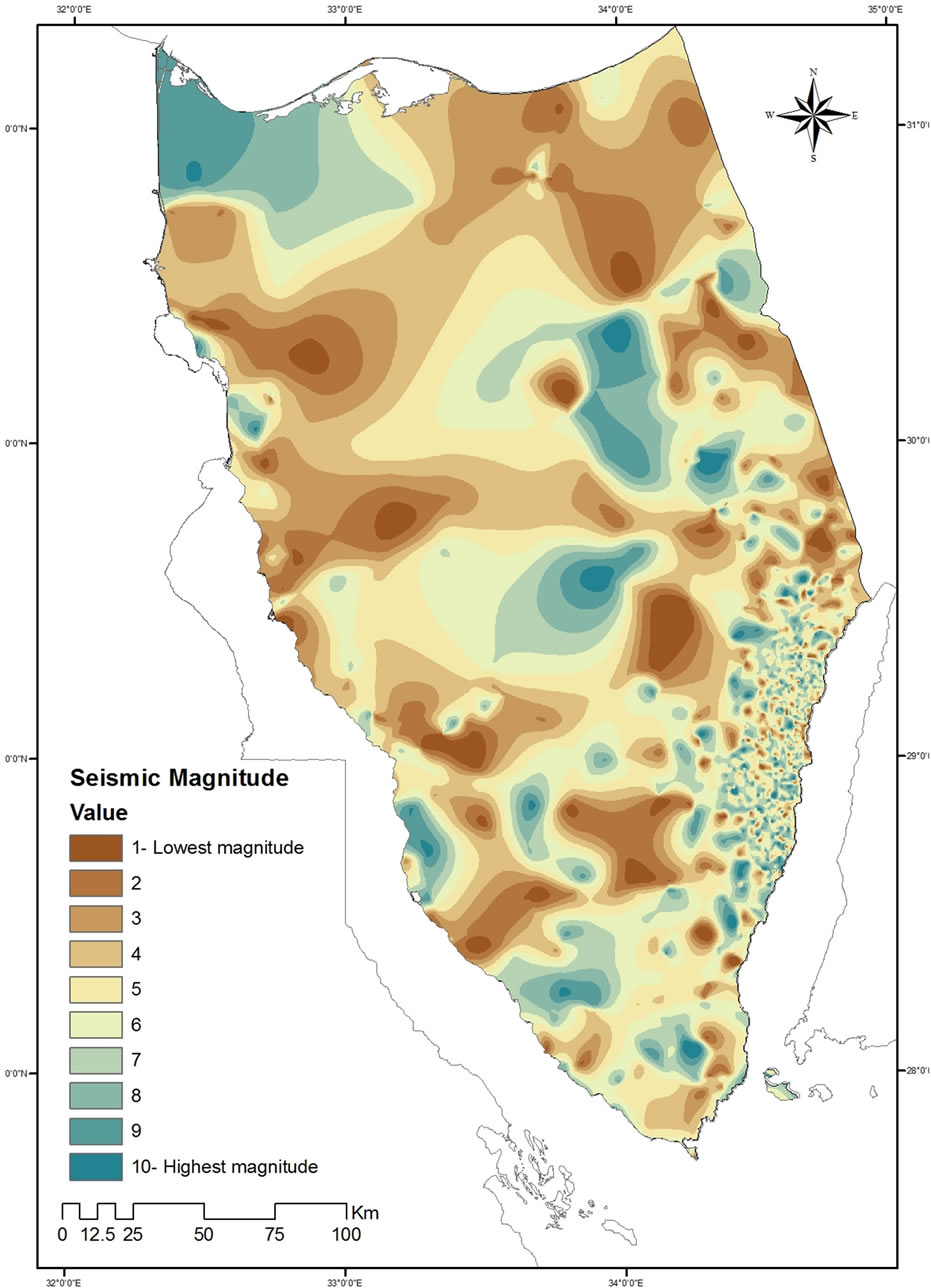 (b)
(b)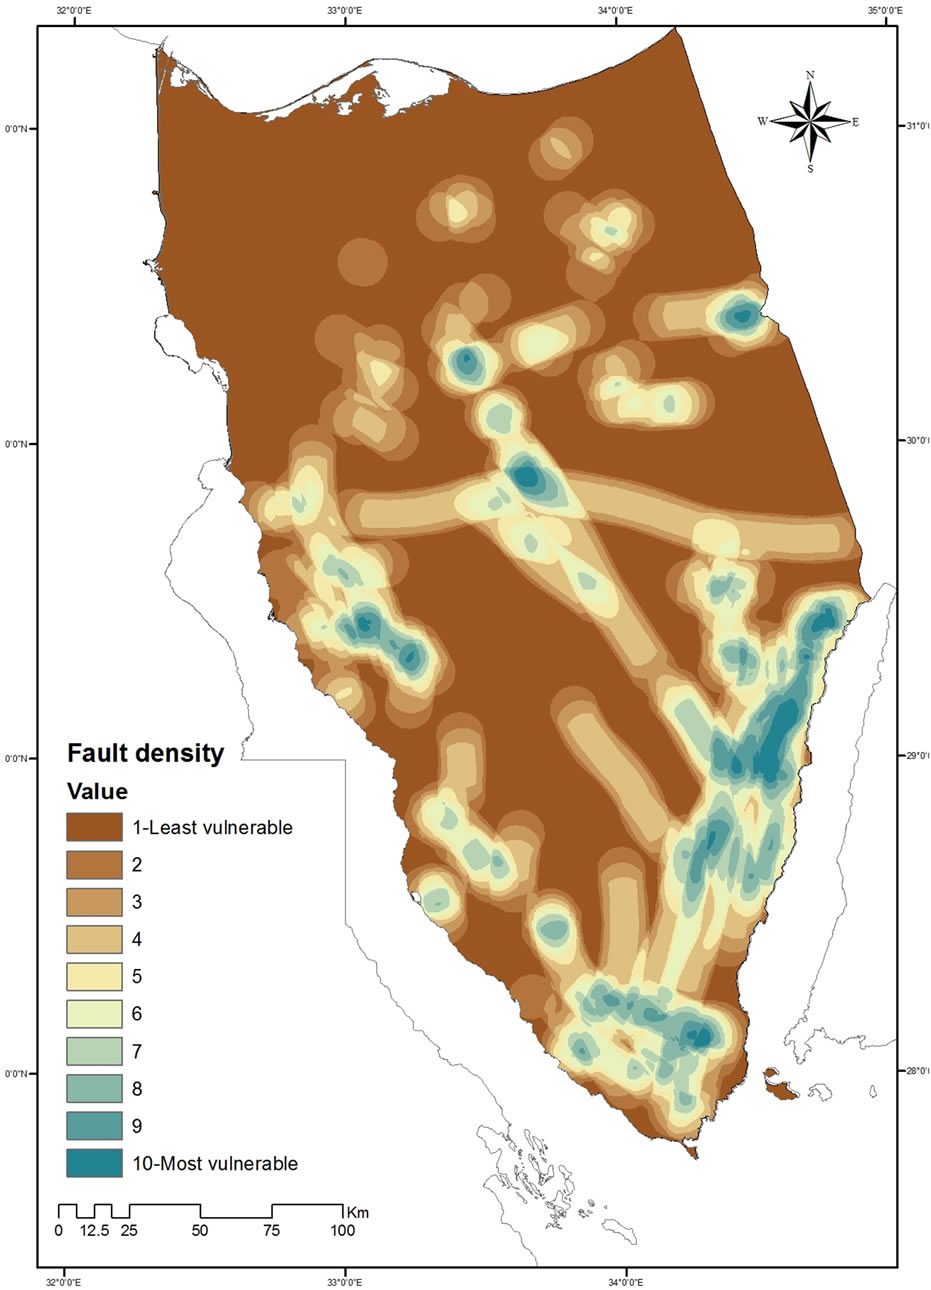 (c)
(c)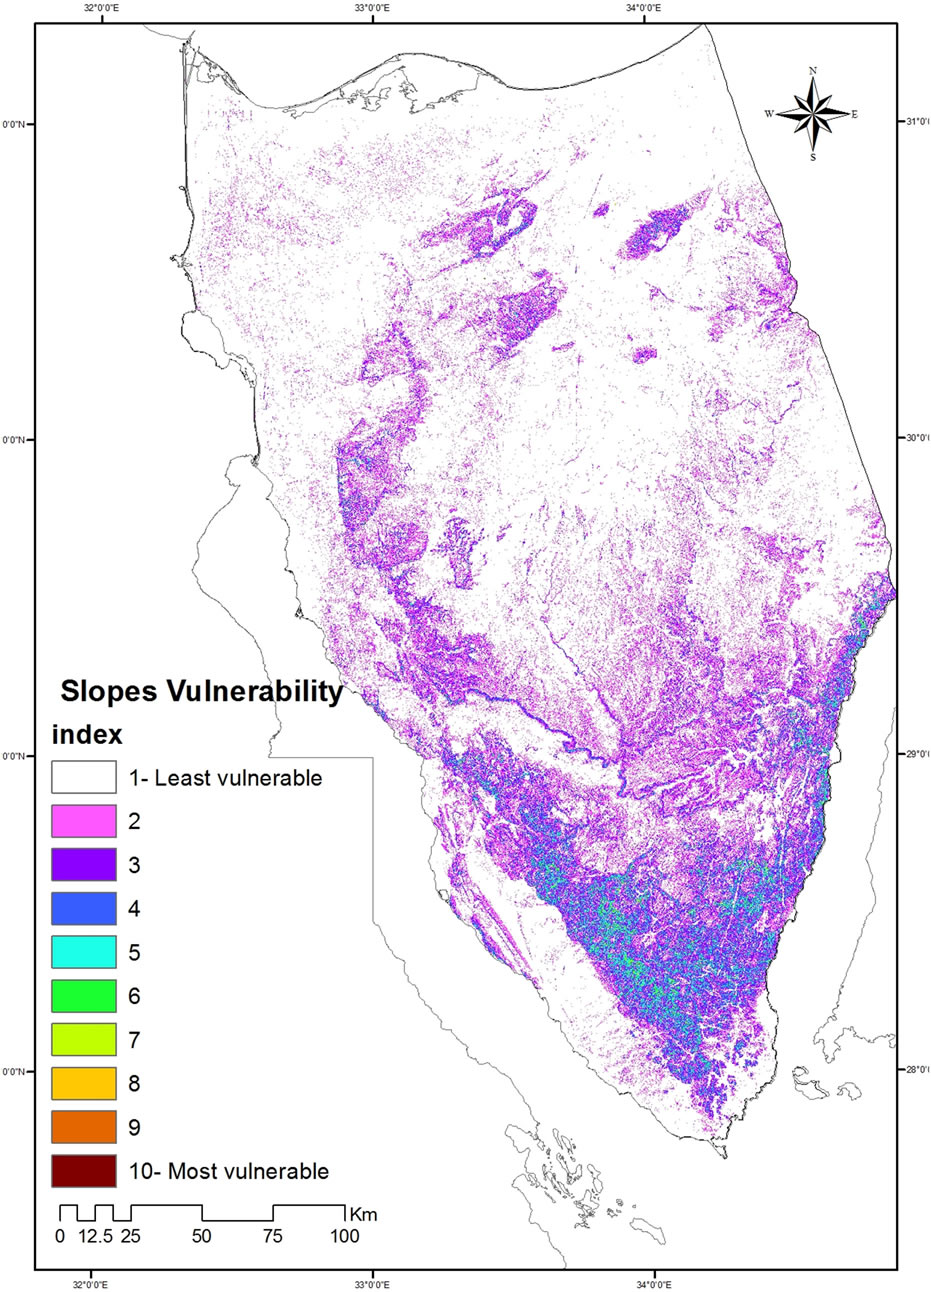 (d)
(d)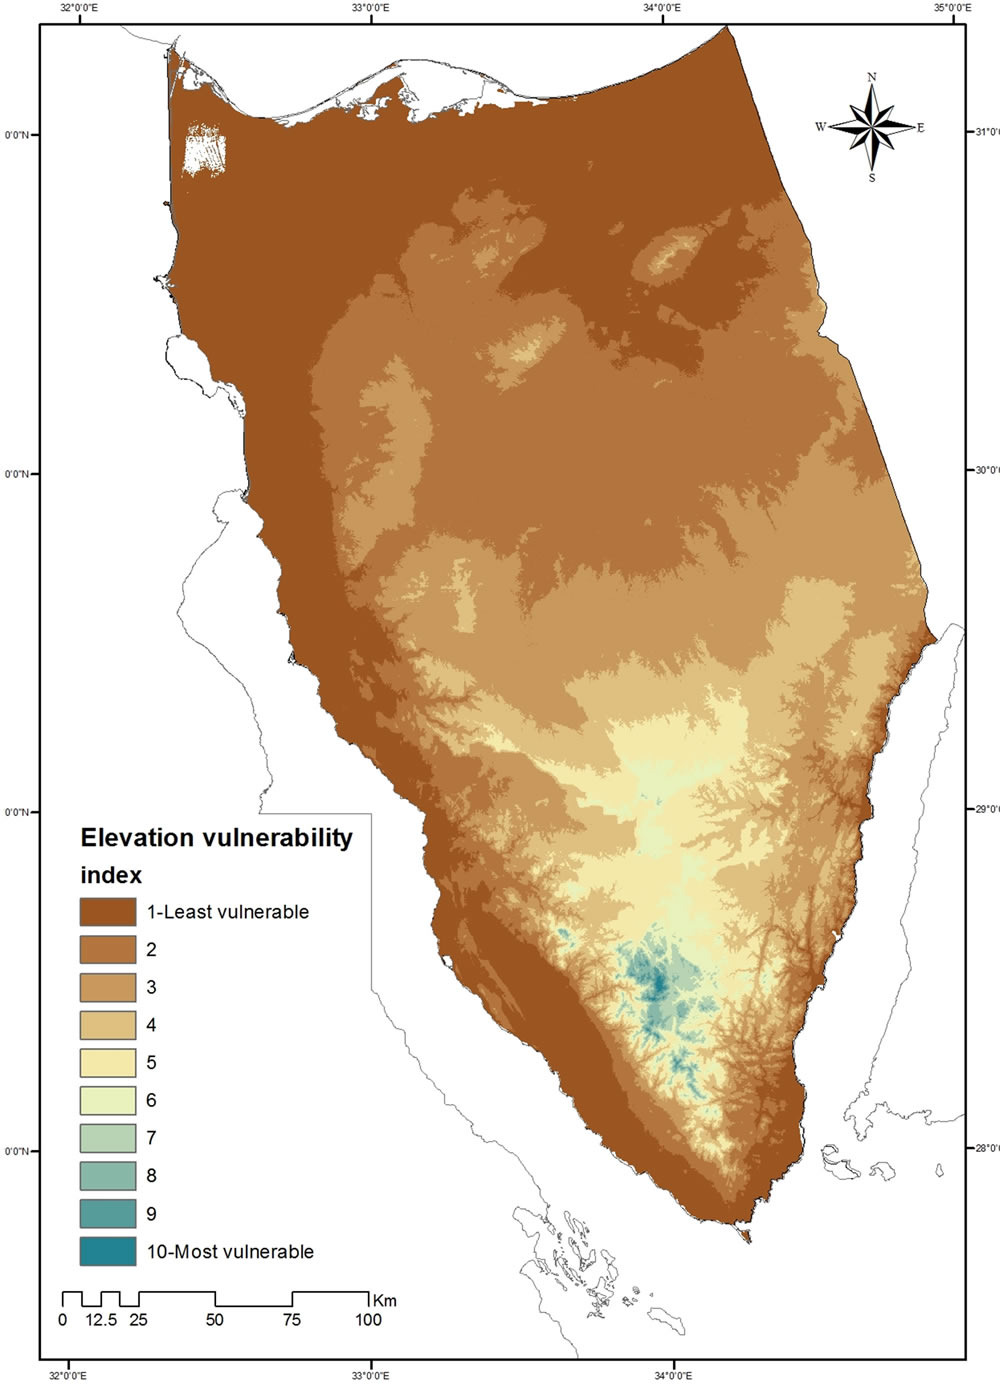 (e)
(e)
Figure 4. Standardized factors maps for land stability theme: (a) Seismic magnitudes zones; (b) Stream density; (c) Slope; (d) Fault density; (e) Elevation zones.
tial urban development lands in Sinai Peninsula. The model output explains that most of the lands in Sinai Peninsula is suitable for new urban communities (Table 8). Zones with highest suitability values (with grid value 10) amounted to 5326 square kilometers equivalent to 8.9% of the total study area Figure 9. These zones were selected as the most suitable sites. They are the most suitable zones for urban development fulfilling the suitability criteria used in the five themes. The spatial distribution shows potential zones distributed in North Sinai, middle zones and South Sinai. Such zones are high in accessibility, with safe geology and have potential land resources and low cost of construction within the studied criteria. Such zones avoid the protected zones of natural and cultural values. The most suitable zones for urban development are distributed among the administrative divisions of the Peninsula. They are described as follows:
In North Sinai Governorate, the most suitable zones amounted to 2081 square kilometers. In South Sinai Governorate, the most suitable zones amounted to 3015 square kilometers. In the portion of land falling in the Suez Governorate, most suitable zones amounted to 163 square kilometers In portion of lands falling in Ismailia Governorate, the most suitable zones amounted to 66 sq. km. For the portion of lands falling in Port Saied Governorate the most suitable sites amounted to 1.0 square kilometers.
6. Conclusion
Spatial multicriteria decision model was used in this study to identify the most suitable sites for urban development in Sinai Peninsula. The model integrates various remote sensing data and geographic information layers in a multidisciplinary approach. Applying such a method, it was possible to create a step by step zoning map for potential urban development sites, which was the main objective of this research paper. The other objective is that some spatial factors were studied. The method is well established and provides a comprehensible and logic procedure. If this technique is adopted by governments, it should involve the participation of several stakeholders, decision makers, scientists and public participation in the land planning process. Such public participation should aim at establishing and maintaining a high degree of
 (a)
(a) (b)
(b)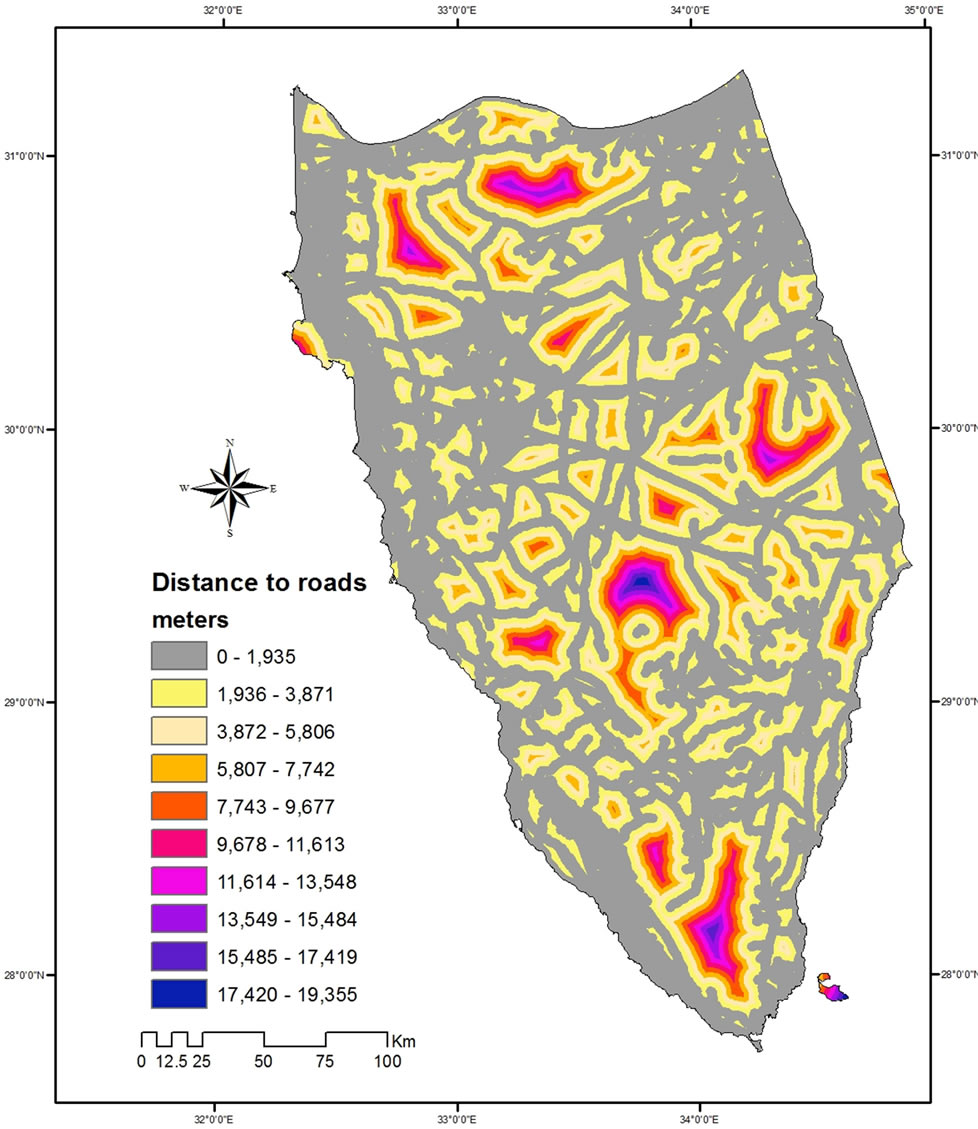 (c)
(c)
Figure 5. Factors for accessibility theme: (a) Distance to airports; (b) Distance to roads; (c) Distance to ports.
 (a)
(a)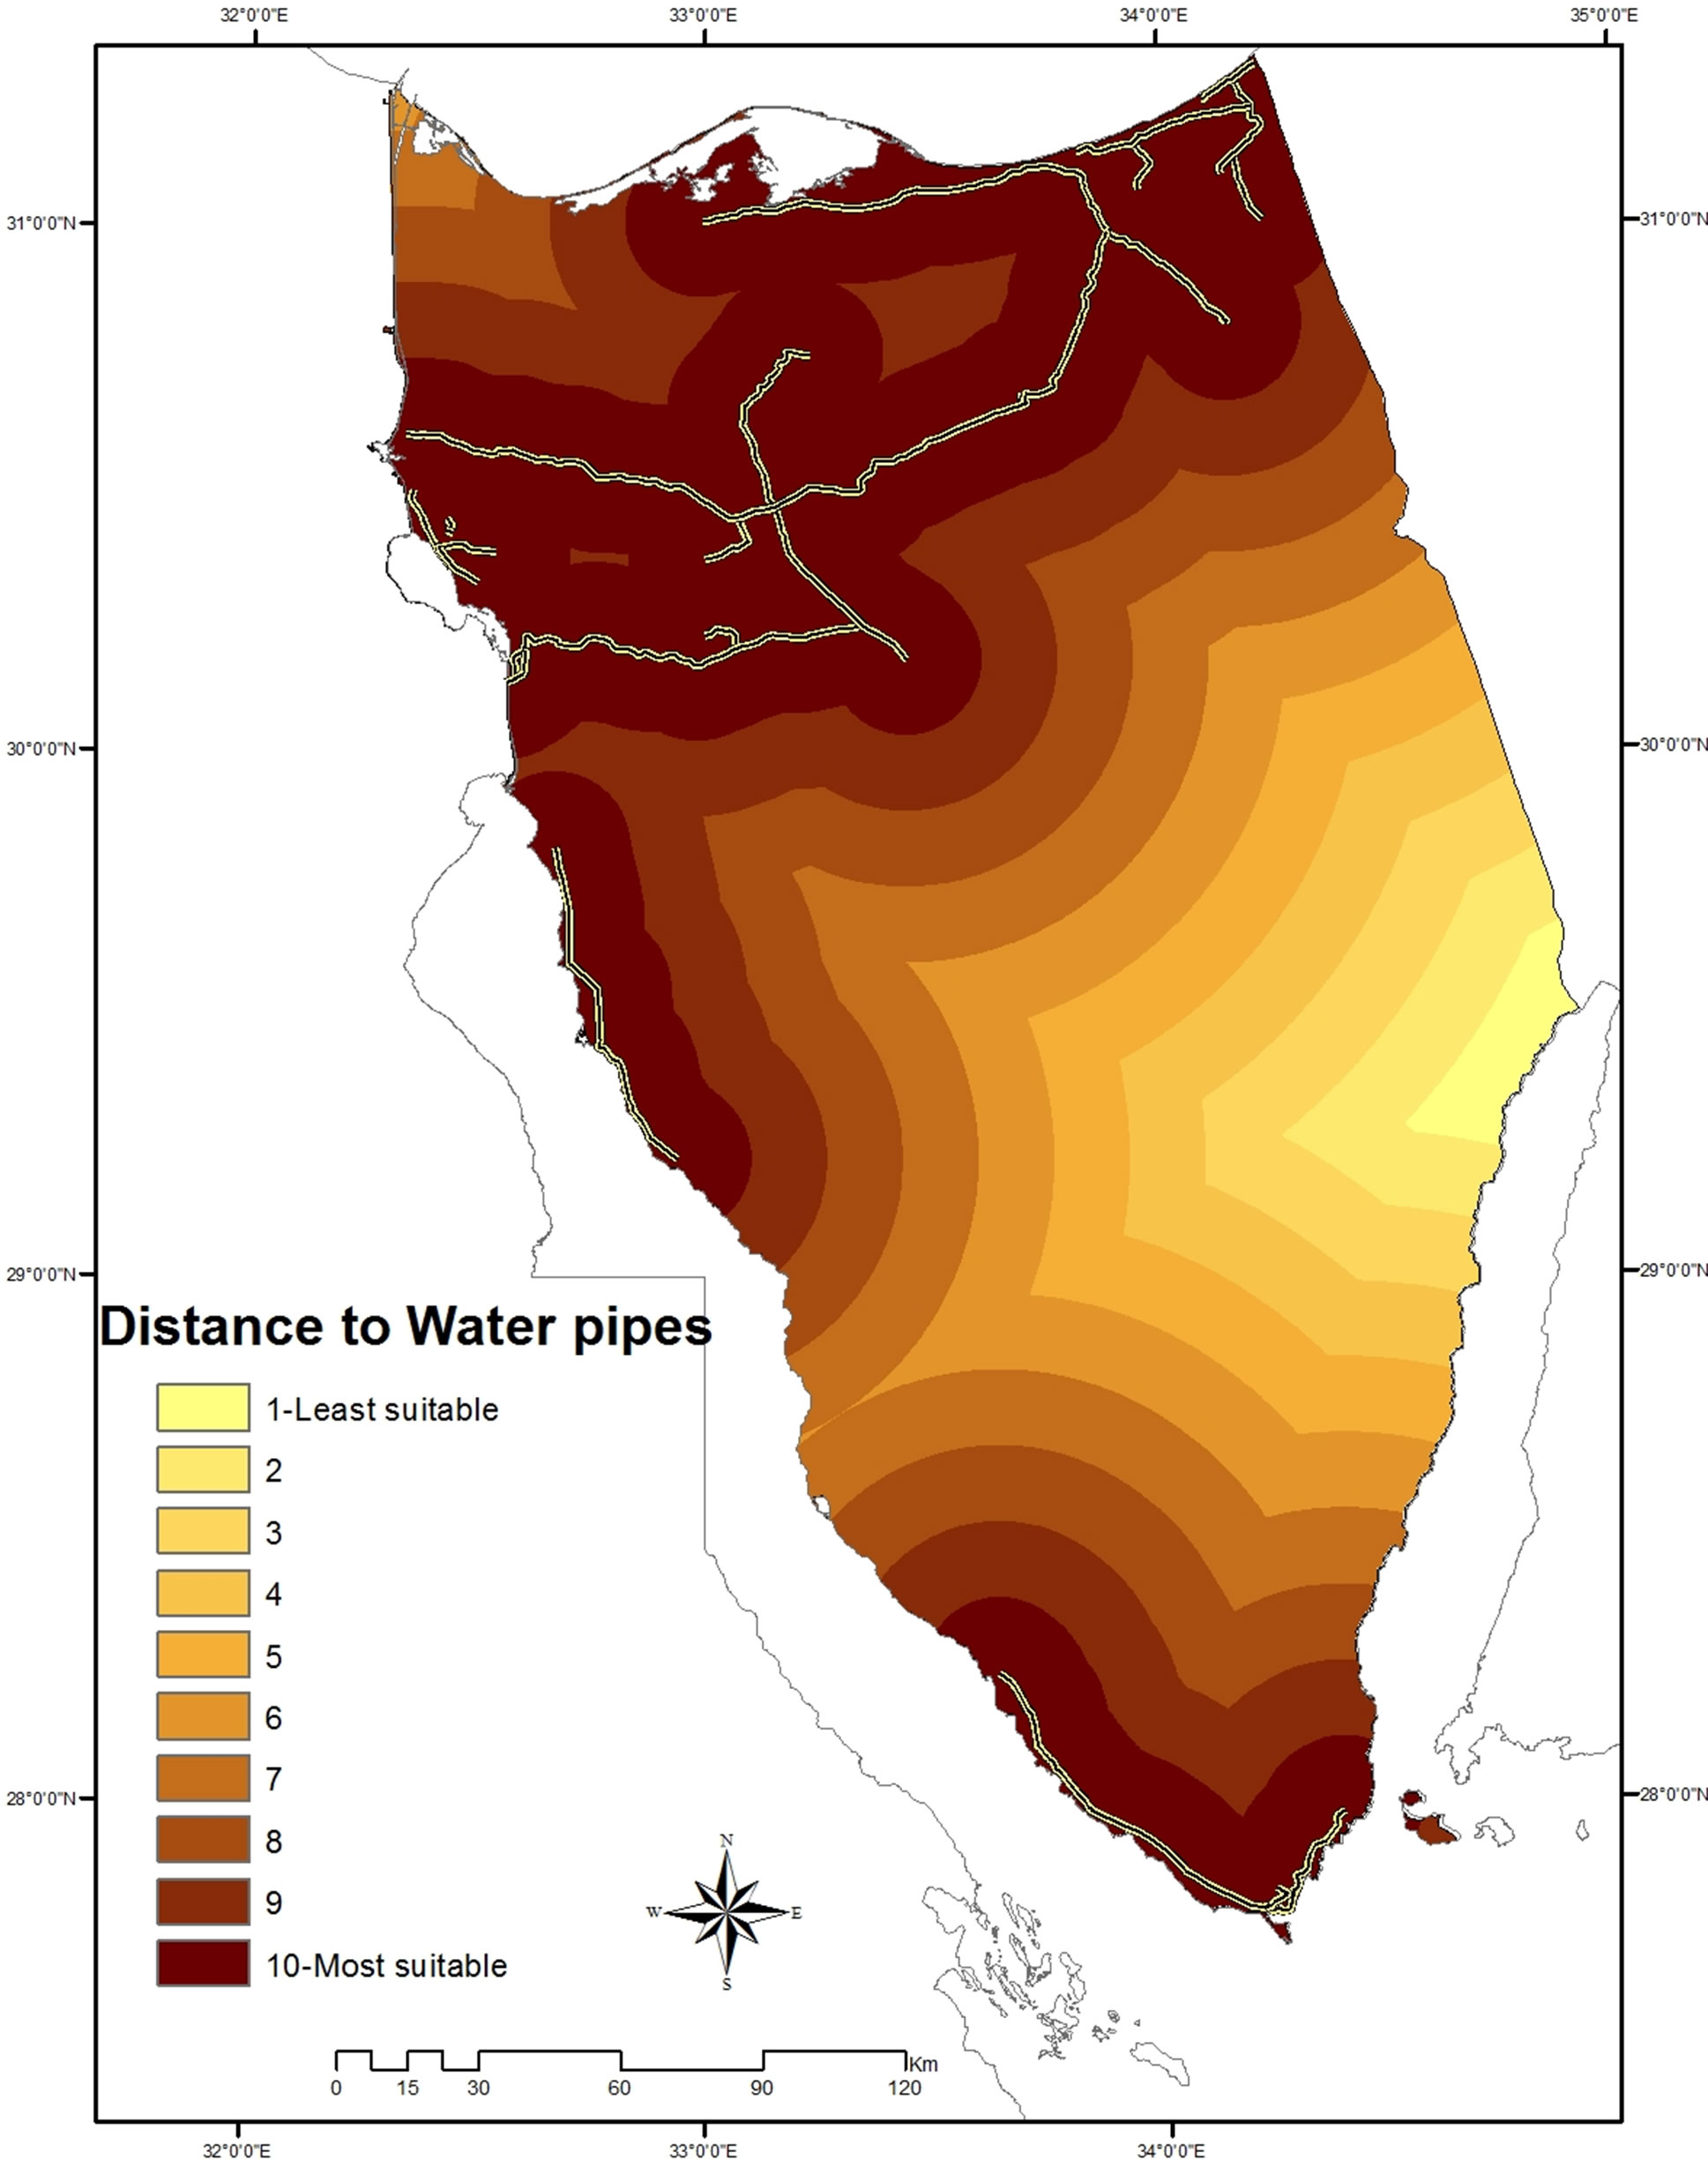 (b)
(b)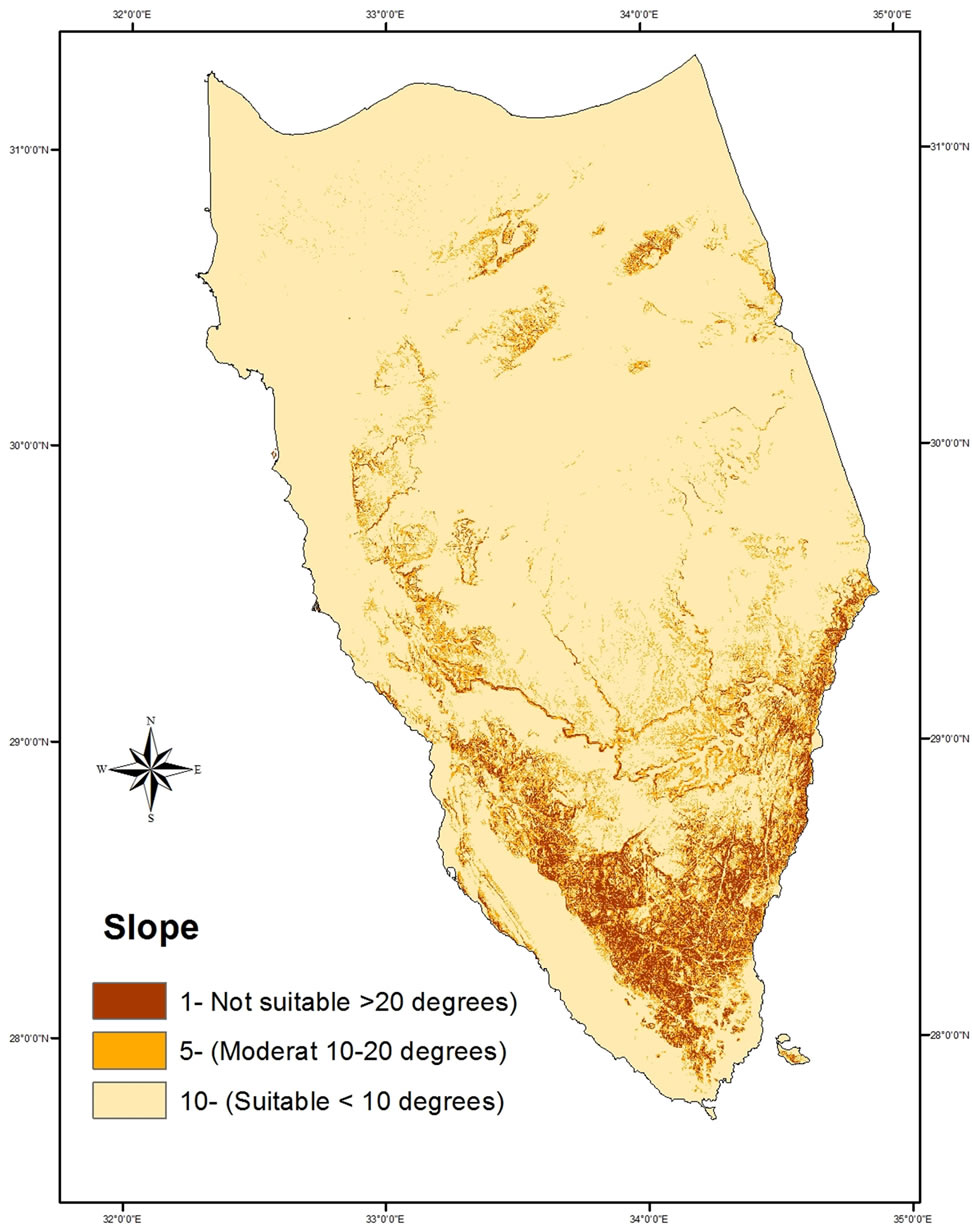 (c)
(c)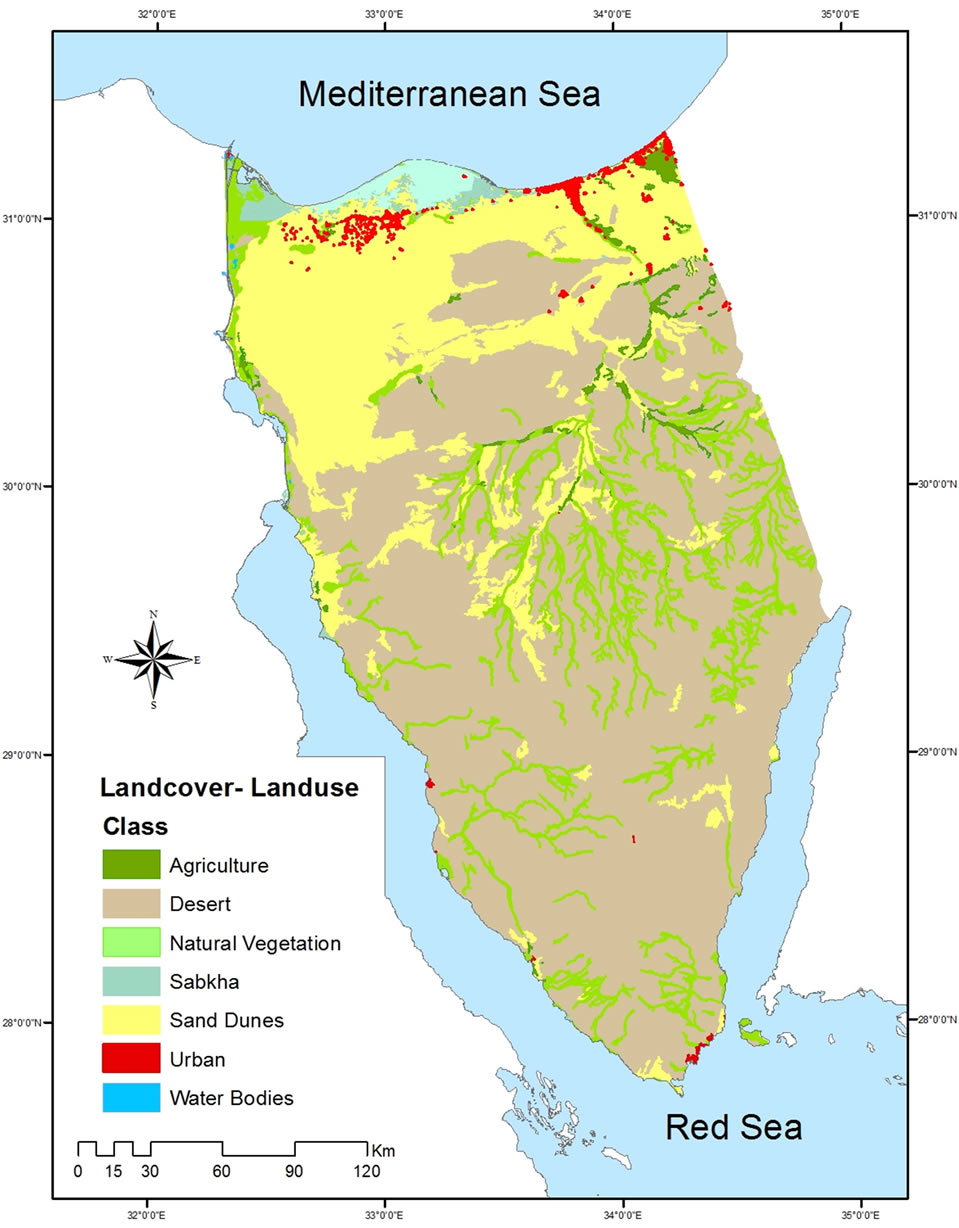 (d)
(d)
Figure 6. Factors maps for construction costs theme: (a) Distance to water pipes; (b) Distance to power lines; (c) Landcover classes; (d) Slopes.
 (a)
(a)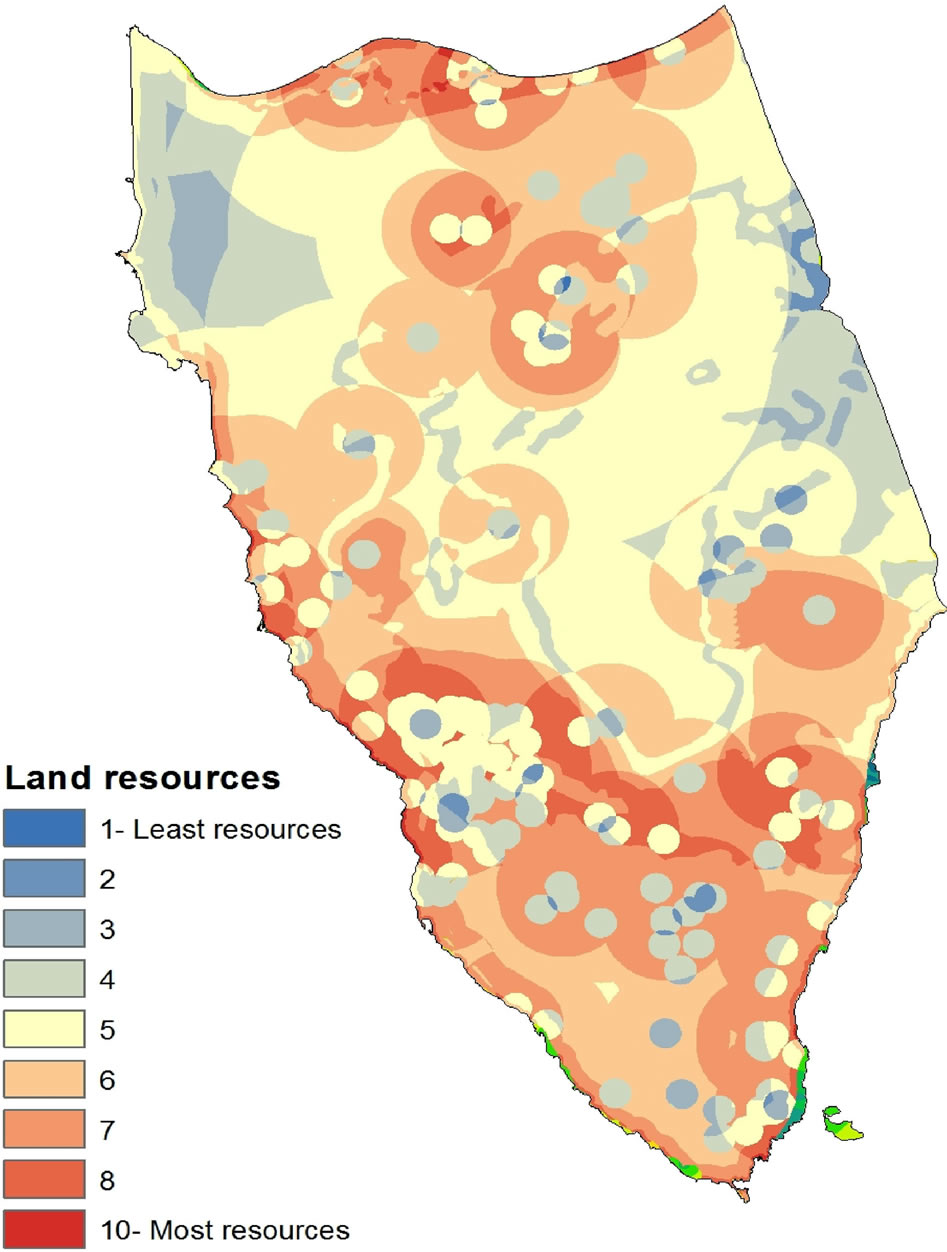 (b)
(b)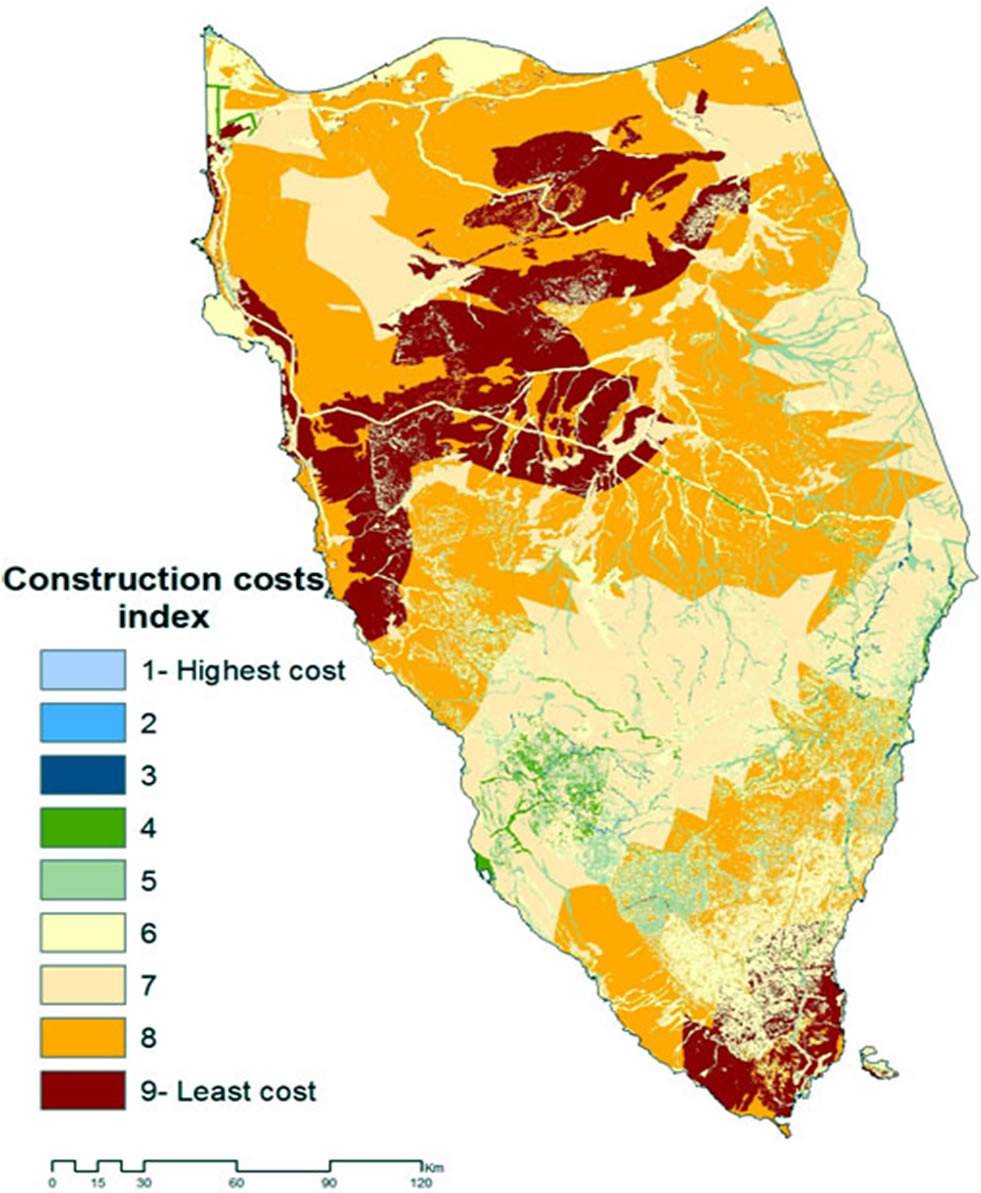 (c)
(c)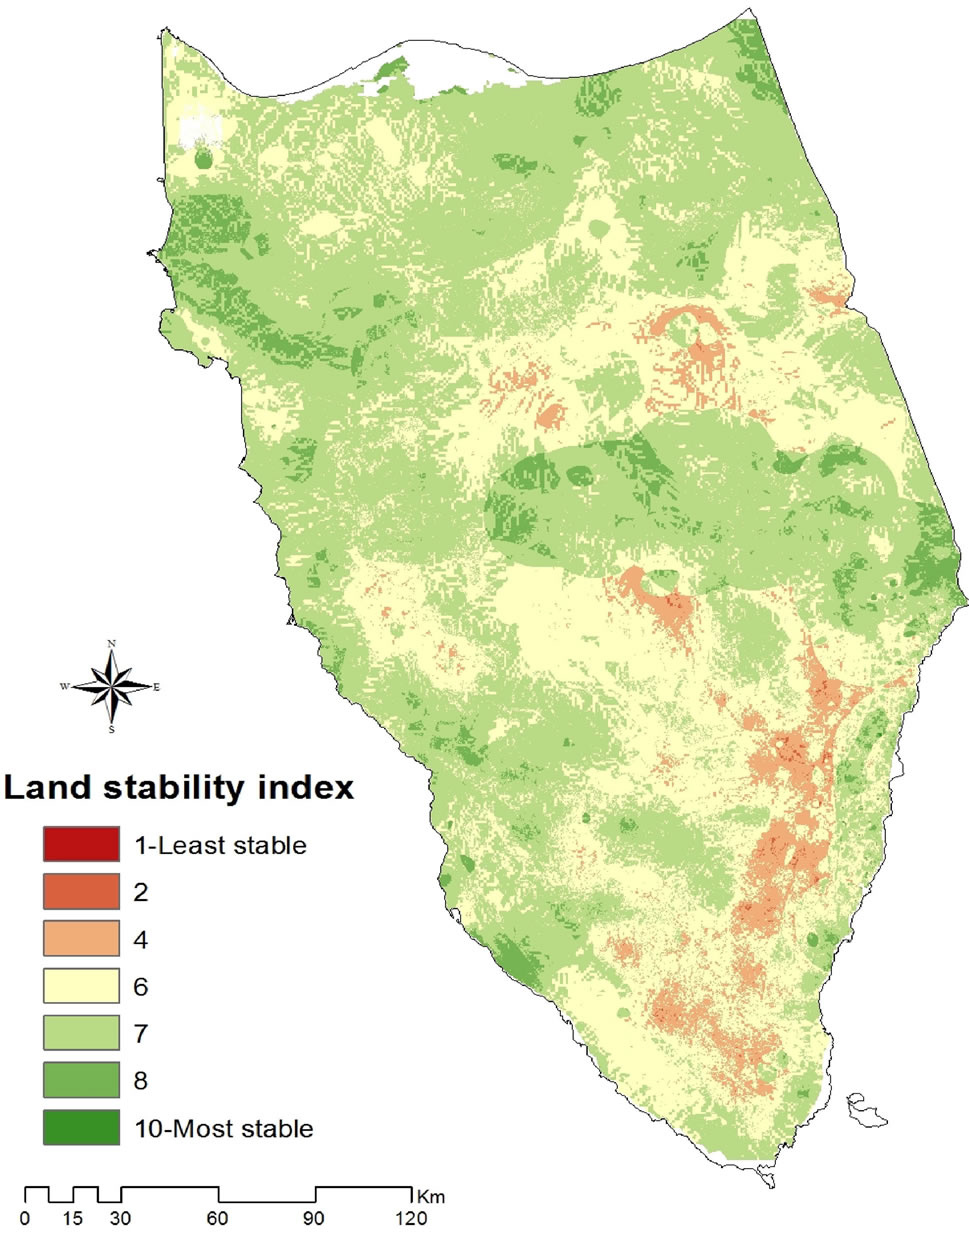 (d)
(d)
Figure 7. Themes sub-models index maps: (a) Land resources; (b) Accessibility; (c) Land stability; (d) Construction costs.
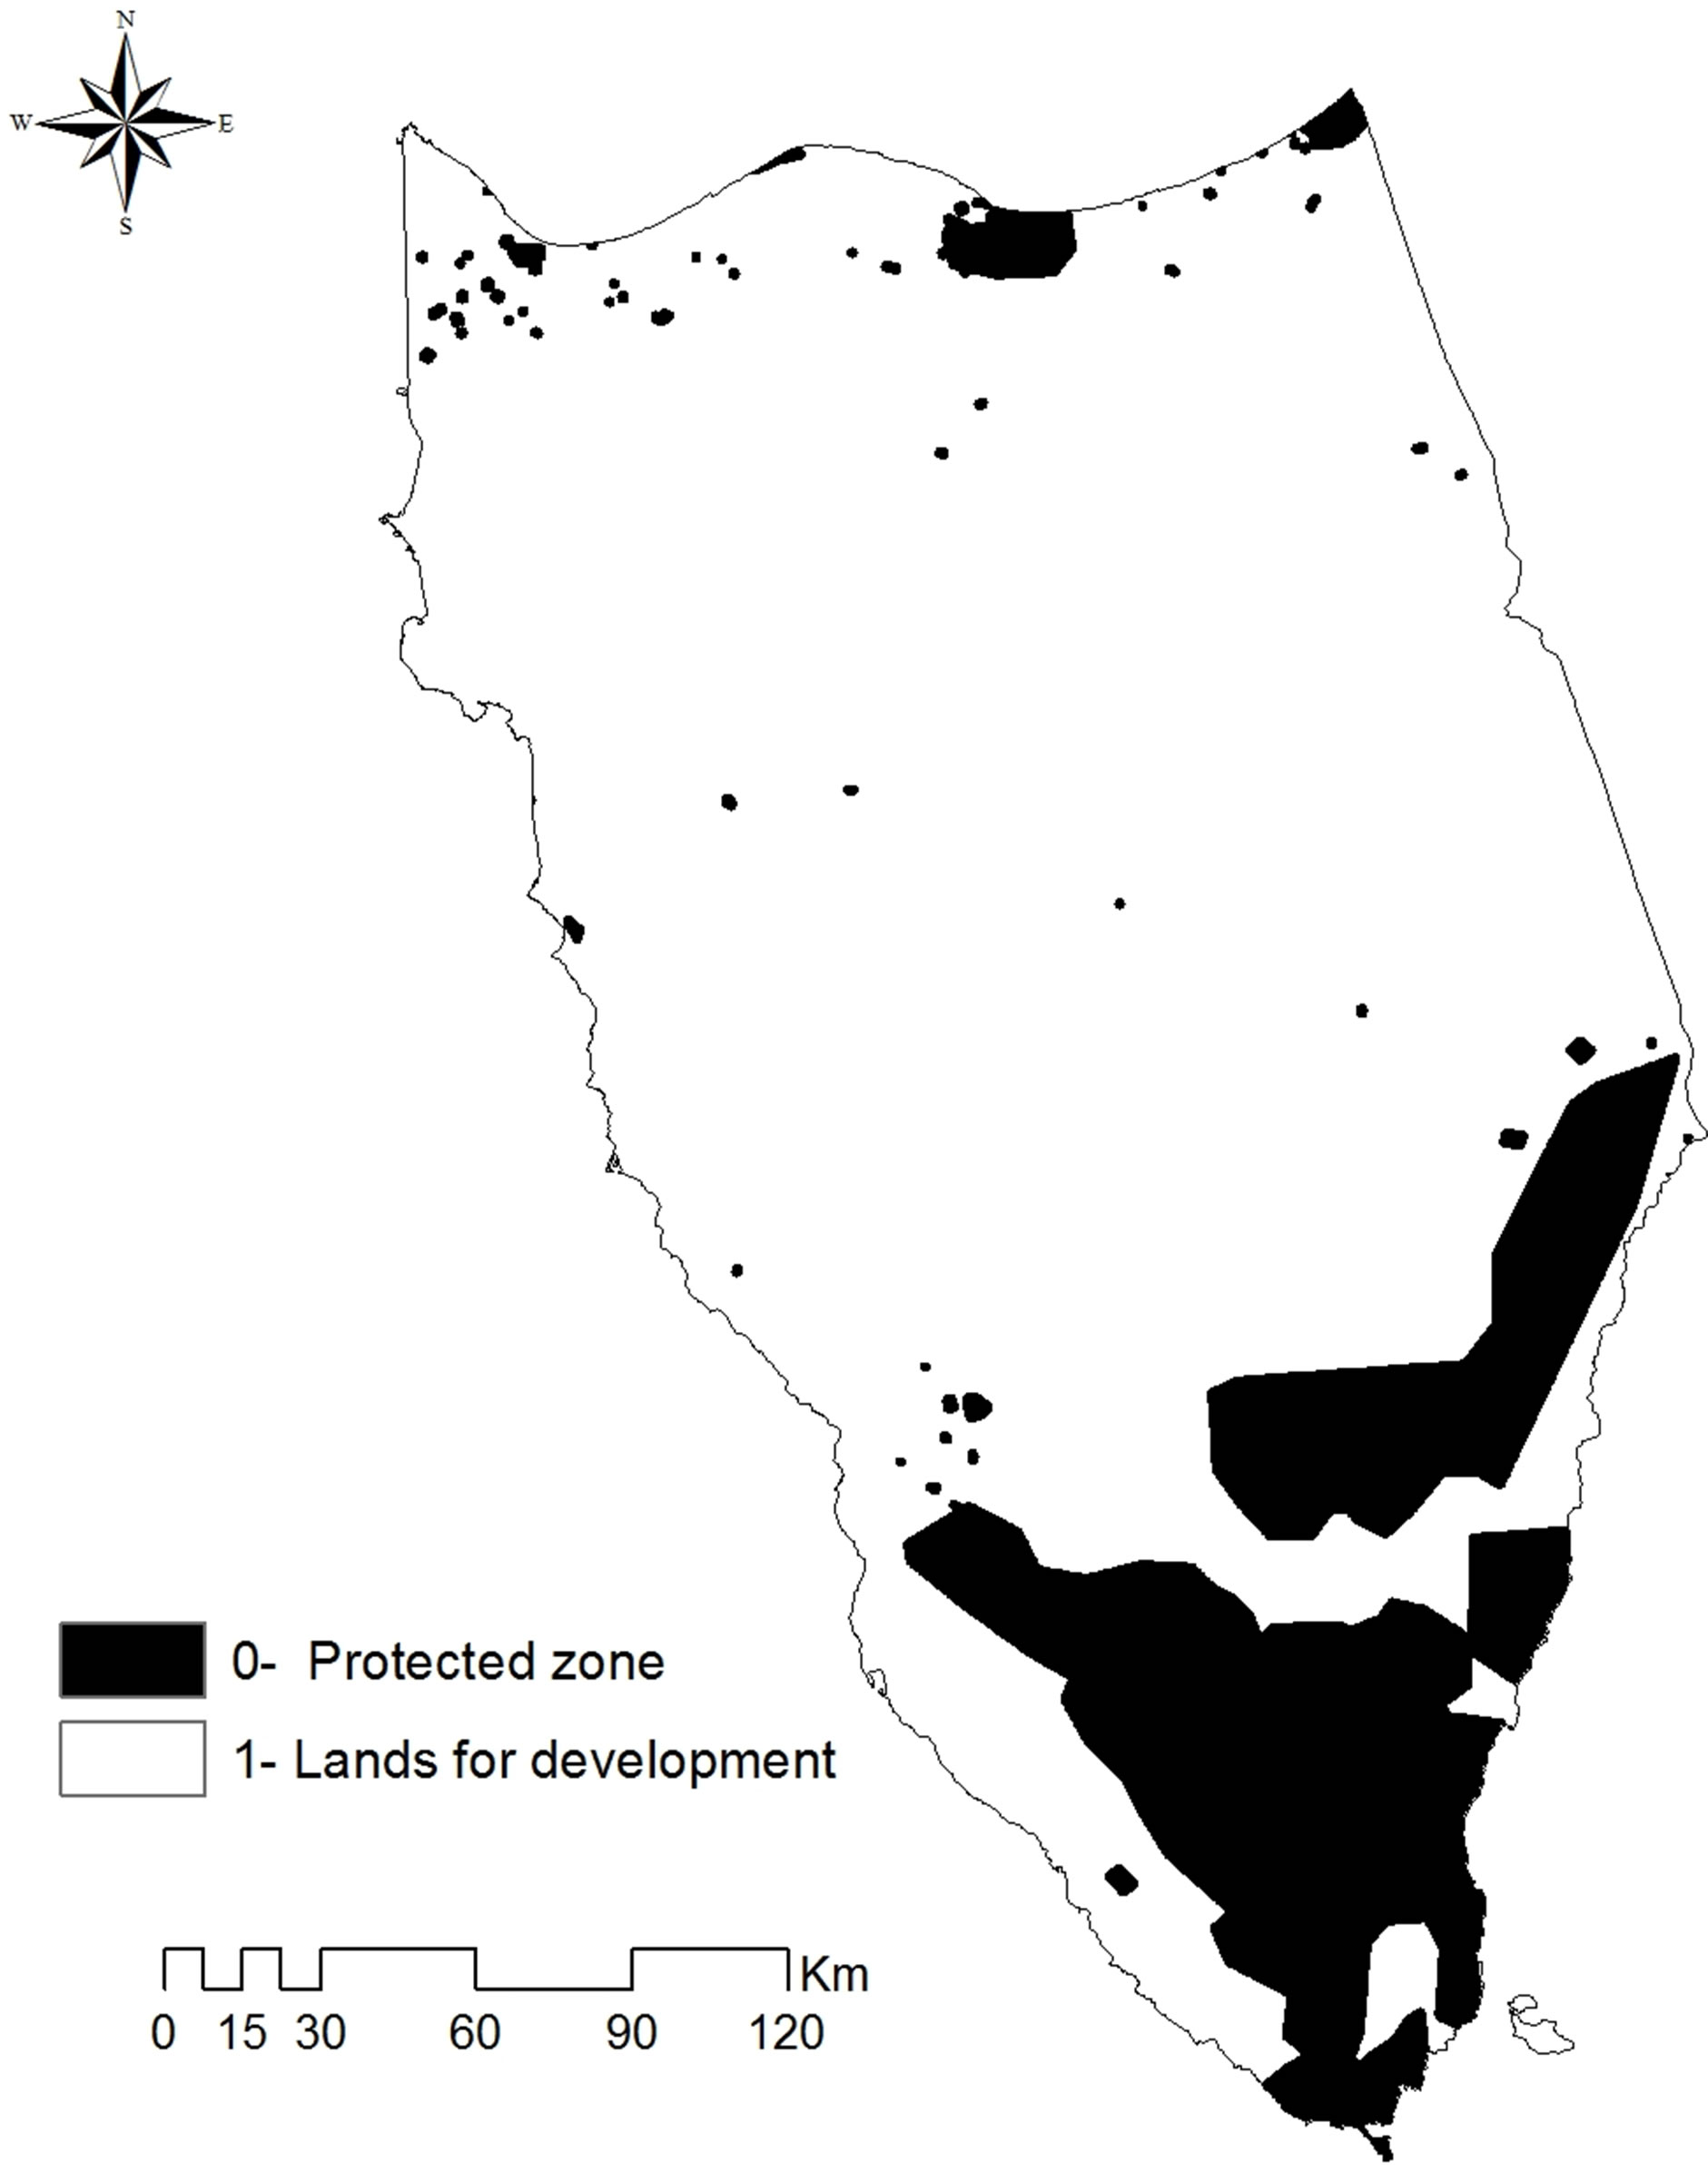
Figure 8. The land protection theme binary sub-model.
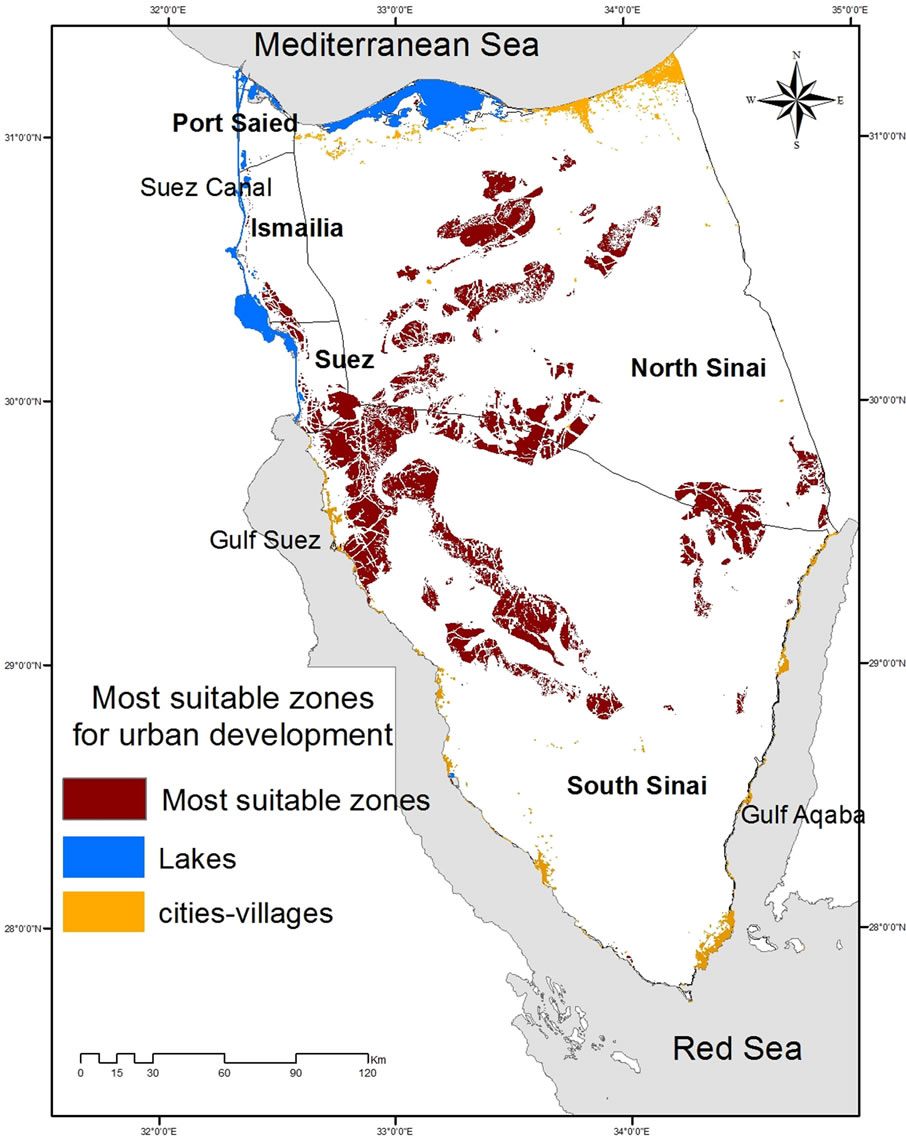
Figure 9. Most suitable zones for urban development in Sinai Peninsula.
transparency, and a sense of shared responsibility for all parties involved in the land-use planning process. This
Table 7. (a)-(c) depicts the analytical hierarchy process AHP used to calculate the factor weights. (d) depicts the calculation of the consistency ratio (CR). (a) Pairwise comparison matrix; (b) Normalized pairwise comparison matrix and computation of weights; (c) Normalized pairwise comparison matrix and calculated weights; (d) Calculation of the consistency ratio (CR).
 (a)
(a) 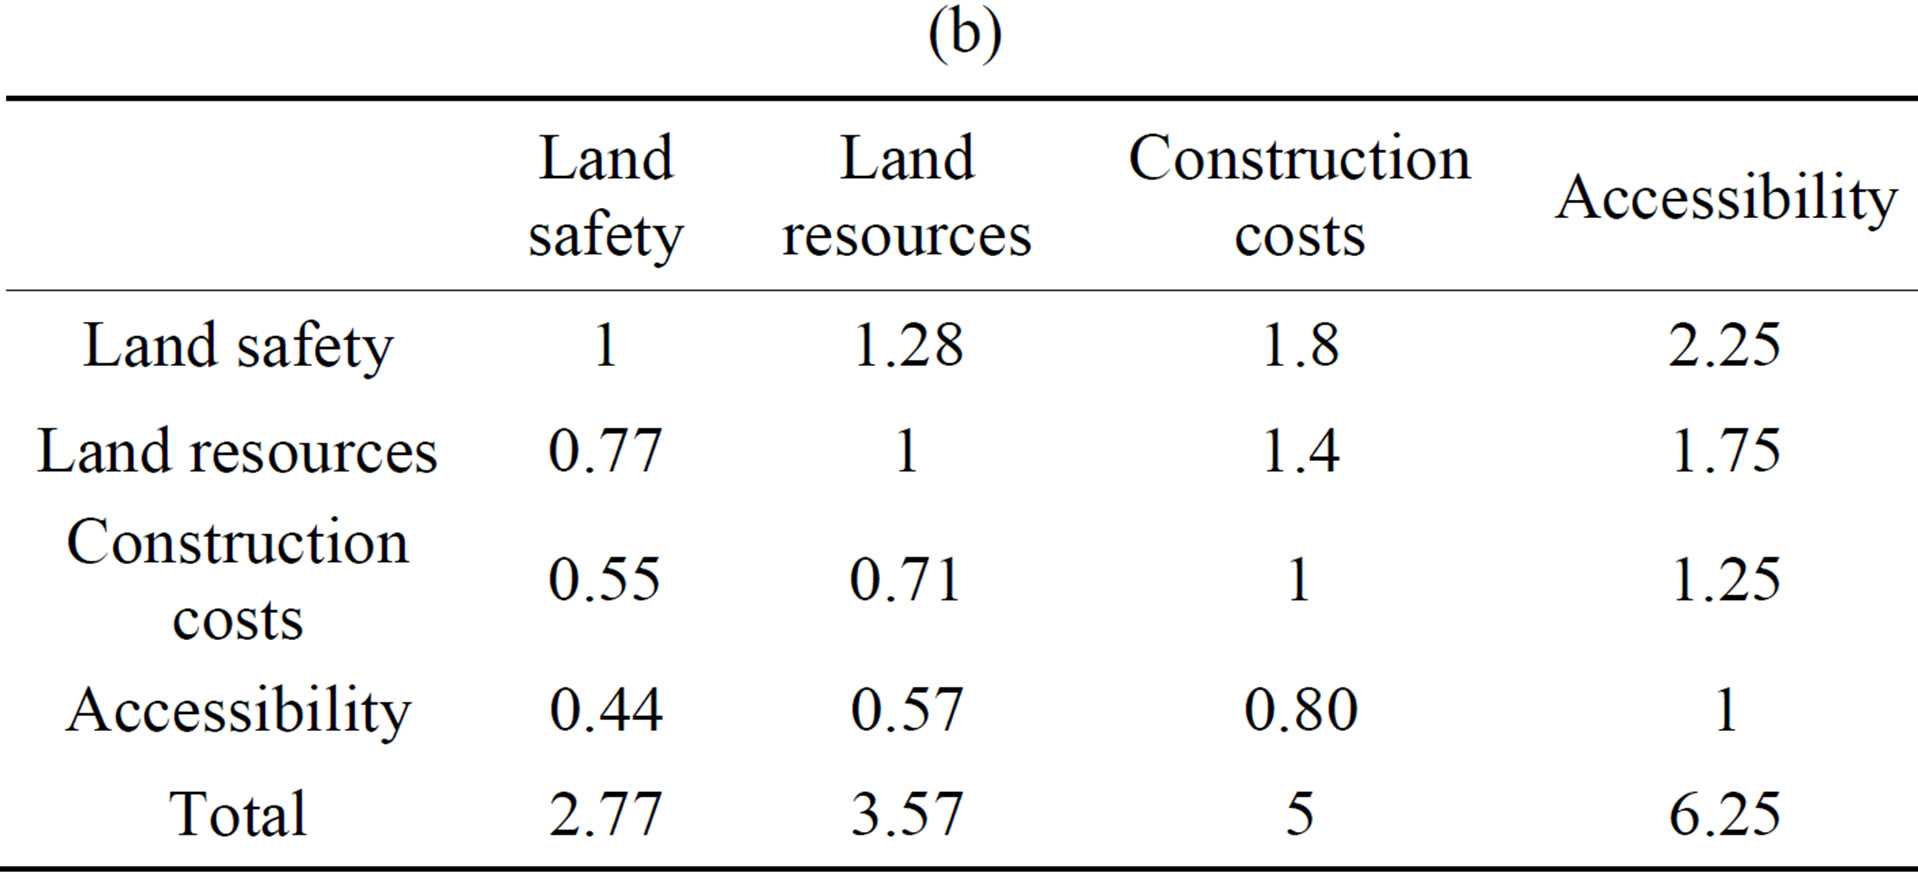 (b)
(b) 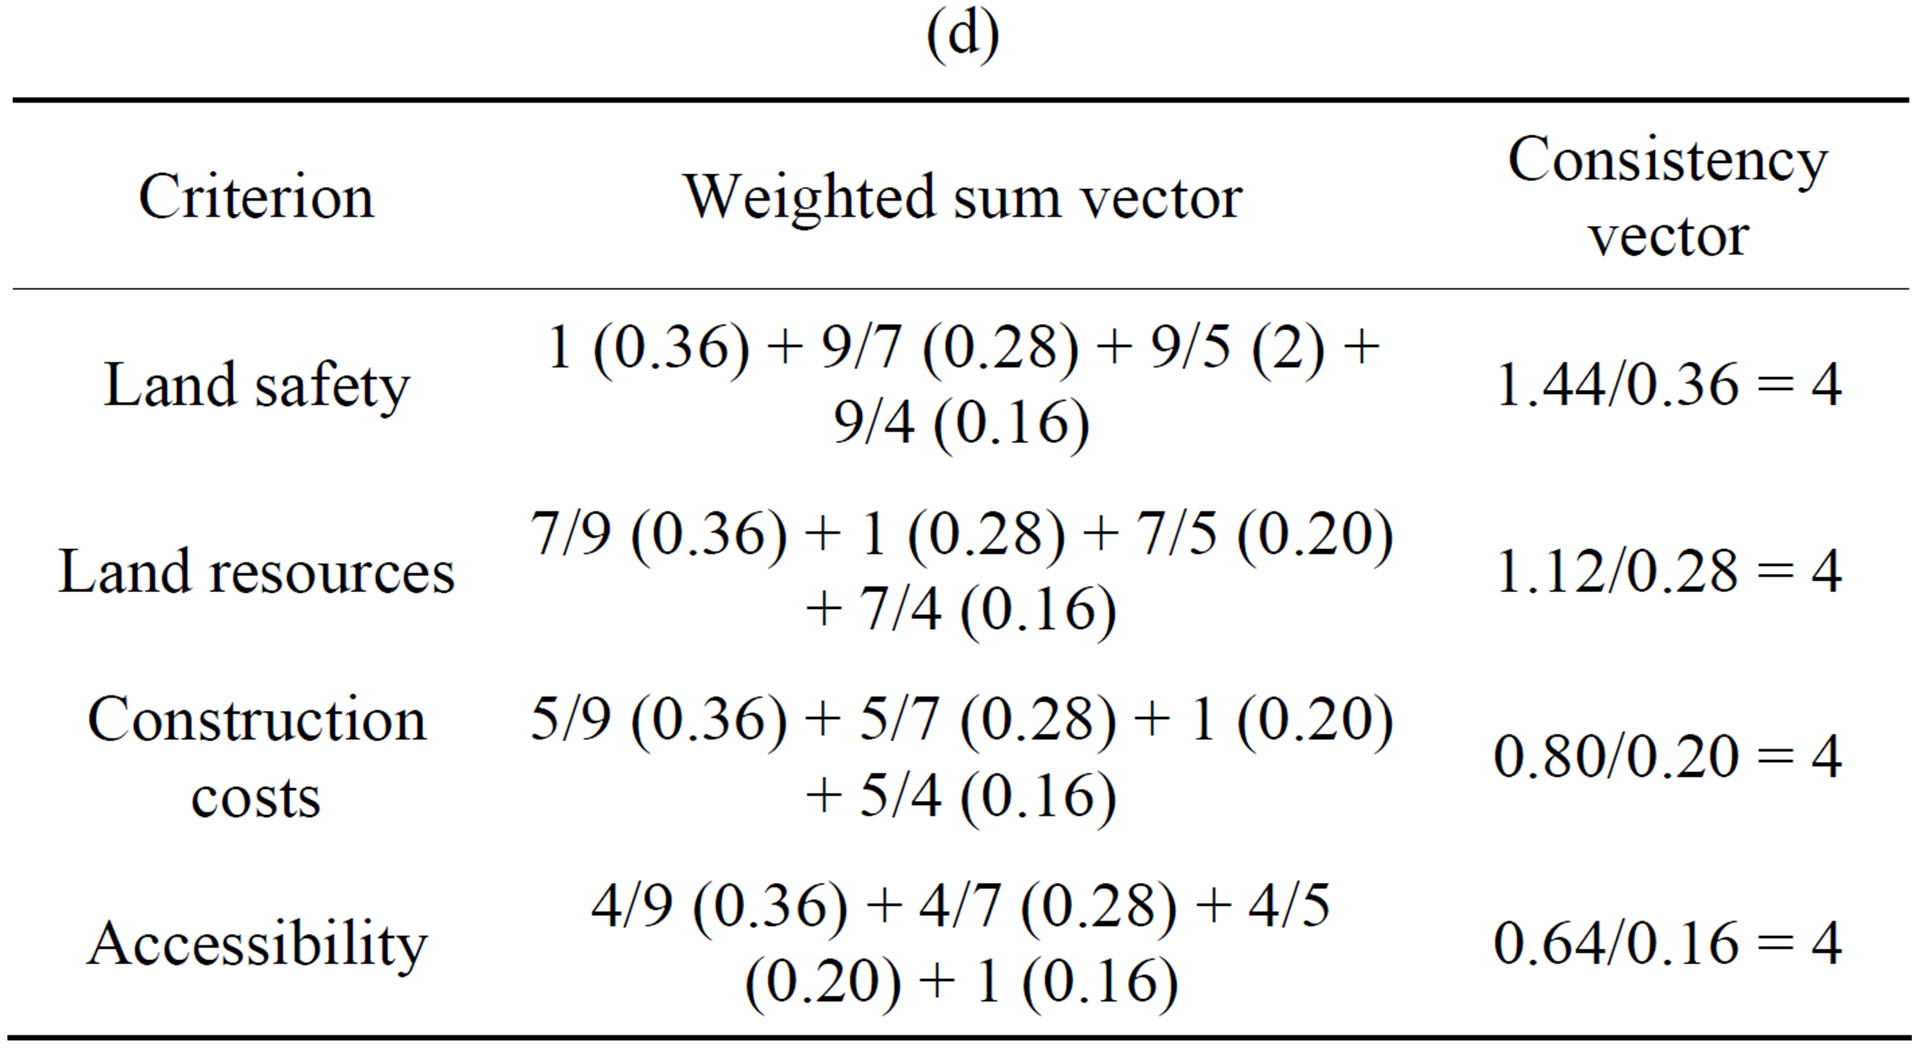 (c)
(c) 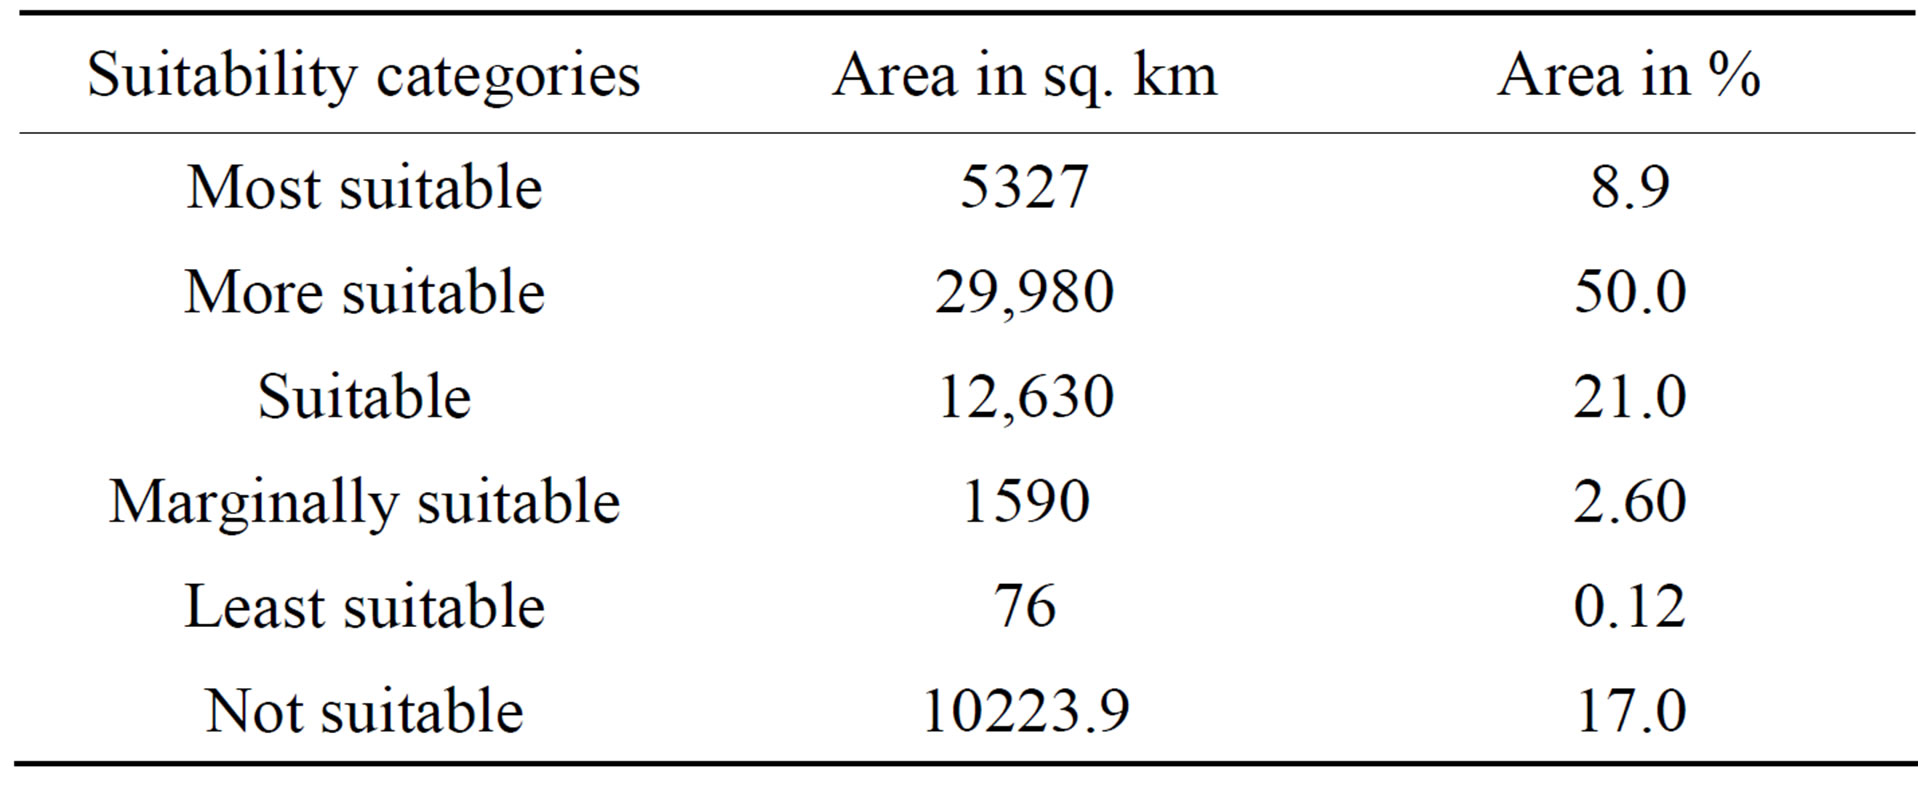 (d)
(d)
Table 8. Area under different suitability categories.
issue is quite valuable especially in developing countries.
REFERENCES
- D. F. Brown, “Back to Basics: The Influence of Sustainable Development on Urban Planning with Special Reference to Montreal,” Canadian Journal of Urban Research, Vol. 15, No. 1, 2006, pp. 99-117.
- I. Bystron, C. MacDonald and J. Stansfield, “Department of Geography,” University of Guelph, Canada, 2013. http://www.uoguelph.ca/geography/research/geog4480_w2013/index.html
- L. J. Luo, Z. He and Y. Hu, “Study on Land Use Suitability Assessment of Urban-Rural Planning Based on Remote Sensing—A Case Study of Liangping in Chongqing,” The International Archives of the Photogrammetry, Remote Sensing and Spatial Information Sciences, Vol. 37, Part B8, Beijing, 2008.
- M. Cerreta and P. De Toro, “Urbanization Suitability Maps: A Dynamic Spatial Decision Support System for Sustainable Land Use,” Earth System Dynamics, Vol. 3, 2012, pp. 157-171. http://dx.doi.org/10.5194/esd-3-157-2012
- I. L. McHarg, “Design with Nature,” Wiley, New York, 1969.
- L. Hopkins, “Methods for Generating Land Suitability Maps: A Comparative Evaluation,” Journal of American Institute, Vol. 34, 1977, pp. 19-29.
- R. K. Brail and R. E. Klosterman, “Planning Support Systems,” ESRI Press, Redlands, 2001.
- M. G. Collins, F. R. Steiner and M. J. Rushman, “LandUse Suitability Analysis in the United States: Historical Development and Promising Technological Achievements,” Environmental Management, Vol. 28, No. 5, 2001, pp. 611-621. http://dx.doi.org/10.1007/s002670010247
- J. M. C. Pereira and L. Duckstein, “A Multiple Criteria Decision-Making Approach to GIS-Based Land Suitability Evaluation,” International Journal of Geographical Information Systems, Vol. 7, No. 5, 1993, pp. 407-424. http://dx.doi.org/10.1080/02693799308901971
- R. Store and J. Kangas, “Integrating Spatial Multi-Criteria Evaluation and Expert Knowledge for GIS-Based Habitat Suitability Modeling,” Landscape and Urban Planning, Vol. 55, No. 2, 2001, pp. 79-93. http://dx.doi.org/10.1016/S0169-2046(01)00120-7
- G. F. Bonham-Carter, “Geographic Information Systems for Geoscientists: Modeling with GIS,” Pergamon Press, New York, 1994.
- J. C. Cambell, J. Radke, J. T. Gless and R. M. Whirtshafter, “An Application of Linear Programming and Geographic Information Systems: Cropland Allocation in Antigue,” Environment and Planning A, Vol. 24, No. 4, 1992, pp. 535-549. http://dx.doi.org/10.1068/a240535
- S. Kalogirou, “Expert Systems and GIS: An Application of Land Suitability Evaluation,” Computers, Environment and Urban Systems, Vol. 26, No. 2-3, 2002, pp. 89-112. http://dx.doi.org/10.1016/S0198-9715(01)00031-X
- W. Miller, W. M. G. Collins, F. R. Steiner and E. Cook, “An Approach for Greenway Suitability Analysis,” Landscape and Urban Planning, Vol. 42, No. 2-4, 1998, pp. 91-105. http://dx.doi.org/10.1016/S0169-2046(98)00080-2
- R. Gunasekera, “Use of GIS for Environmental Impact Assessment in Interdisciplinary Approach,” Interdisciplinary Science Reviews, Vol. 29, No. 1, 2004, pp. 37-48. http://dx.doi.org/10.1179/030801804225012473
- J. R. Eastman, P. A. K. Kyem, J. Toledano and W. Jin, “GIS and Decision Making,” UNITAR, Geneva, 1993.
- R. L. Church, “Geographical Information Systems and Location Science,” Computers and Operations Research, Vol. 29, No. 6, 2002, pp. 541-562. http://dx.doi.org/10.1016/S0305-0548(99)00104-5
- R. Janssen and P. Rietveld, “Multicriteria Analysis and Geographical Information Systems: An Application to Agricultural Land Use in the Netherlands,” Geographical Information Systems for Urban and Regional Planning, Kluwer Academic Publishers, Dordrecht, 1990, pp. 129- 139.
- Central Agency for Public Mobilization and Statistics, CAPMAS, National Information Center (NIC), Nasr City, Cairo, 2013.
- Center of Housing and Building Researches, Ministry of Housing, Utilities and Urban Development, “Egypt, Mines and quarry map of Egypt,” 2007.
- Shutle Radar Topography Mission, United States Geological Survey (USGS), 2000. http://seamless.usgs.gov
- Egyptian Military Survey Department, “The Topographic Map of Egypt,” 1995.
- Egyptian General Petroleum Corporation, CONOCOCoral, “The Geological Map of Egypt, Scale 1:500,000,” Egypt, Cairo, 1987.
- Ministry of State for the Environment, Egyptian Environmental Affairs Agency (EEAA), Department of Nature Conservation, National Biodiversity Unit, Egypt: “National Strategy and Action Plan for Biodiversity Conservation,” 1998.
- Research Institute for groundwater (RIGW), National Water Research Center (NWRC), The “Hydro-Geological Map of Egypt, Scale 1:200,000,” 1999.
- ESRI, “Working with the ArcView Spatial Analyst,” Environmental Systems Research Institute, Inc., Redlands, 1996.
- General Organization for Physical Planning, GOPP, “The Environmental Vision of the Strategy of Urban Development in Egypt,” Unpublished Report, GOPP, Cairo, 2007.
- J. R. Eastman, W. Jin, P. A. K. Kyem and J. Toledano, “Raster Procedures for Muli-Criteria/Multi-Objective Decisions,” Photogrammetric Engineering & Remote Sensing, Vol. 61, No. 5, 1995, pp. 539-547.
- D. T. Bailey, “Development of an Optimal Spatial Decision-Making Using Approximate Reasoning,” Ph.D. Dissertation, Queensland University of Technology, 2005.
- T. Saaty, “A Scaling Method for Priorities in Hierarchical Structures,” Journal of Mathematical Psychology, Vol. 15, No. 3, 1997, pp. 234-281. http://dx.doi.org/10.1016/0022-2496(77)90033-5
- T. A. Saaty, “Decision-Making for Leaders,” 2nd Edition, RWS Publication, Pittsburgh, 1992.
- T. L. Saaty, “The Analytic Hierarchy Process,” McGrawHill, New York, 1980, pp. 20-25.