Journal of Geographic Information System
Vol.5 No.2(2013), Article ID:30250,14 pages DOI:10.4236/jgis.2013.52016
The Use of VHSR Imagery for Wildland Fire Prevention: Application to Land-Clearing Management in the South of France
1Ecole des Mines d’Alès-LGEI, Alès, France
2IRSTEA, St-Martin-d’Hères, France
Email: sophie.sauvagnargues@mines-ales.fr
Copyright © 2013 Sophie Sauvagnargues et al. This is an open access article distributed under the Creative Commons Attribution License, which permits unrestricted use, distribution, and reproduction in any medium, provided the original work is properly cited.
Received February 26, 2013; revised March 26, 2013; accepted April 10, 2013
Keywords: Remote Sensing; Land-Clearing Management; Very High Spatial Resolution; Prevention Policy to Protect Forests from Fire
ABSTRACT
Every year, the French Mediterranean area is subject to wildland fires. The prevention policy promotes the major role of forest layout, for which it is necessary to build appropriate facilities such as reducing ignition and fire propagation risks near the borders of roads and tracks, creating forest tracks to allow firefighters to move safely through the forest during a fire, creating fuel breaks in order to divide up forests and limit the propagation of fire. Land-clearing along a forest track consists in creating discontinuity between the herbaceous stratum and the tree stratum by eliminating the shrubby stratum and cutting tree crowns. It avoids fire propagation by convection, and enables firefighters to deal with the fire in safety. The main difficulty for forest officers is to identify an optimized method to select appropriate tracks to clear, because it is impossible to clear all the tracks each year. Remote sensing tools would seem to be particularly useful for obtaining the best strategic and economic overview of forest tracks at departmental scale. This theme “land-clearing evaluation method” was selected as a target application for the images derived from the new Pleiades sensors: products and services required by end users. The objective of this work is to assess the real potentiality of such Very High Spatial Resolution (VHSR) imagery for land-clearing management. The methodology used consists in image classification and spatial analysis in order to extract land-clearing quality, and also evaluation of land-clearing quality based on field questionnaires validated through interactions with firefighters and rangers. The development of this methodology and its application to QuickBird images-used as Pleiades data simulations-successfully showed that VHSR Imagery is useful for preventing fire risk. It seems to be a good perspective for providing operational mapping services to help land-clearing management.
1. Introduction
Every year, the French Mediterranean area is subject to wildland fires. From 1973 to 2011, the average annual number of fires in this area was 2657, and the average annual surface area burned was about 23,000 hectares (www.promethee.com). However, annual assessments are very variable: most of the fires are very small but in 2003, for example, there were 14 fires bigger than 1000 hectares.
The French Government has put in place a prevention policy to protect forests from fire. This national prevention policy groups together the technical and regulatory methods implemented to protect lives, human goods and the environment [1]. The main topics of the national prevention policy are: cause reduction, forest surveys and patrols, preventive infrastructure, public information, risk management and cartography. Preventive infrastructure mainly consists in creating tracks, and setting up water tanks and watchtowers in forests.
For French firefighters, the national strategy is based on the control of forming fires at initial level [2]. This explains the major role of forest layout, for which it is necessary to build appropriate facilities [3]. That means reducing ignition and fire propagation risks near the borders of roads and tracks, creating forest tracks to allow firefighters to move safely through the forest during a fire, and creating fuel breaks in order to divide up forests and limit the propagation of fire.
A fuel break can be defined as “a strategically located wide block, or strip, on which a cover of dense, heavy, or flammable vegetation has been permanently changed to one of lower volume or reduced.
“Flammability” [4,5]. These facilities must be safe for vehicles and firefighters. With inappropriate land layout, firefighters are forced to make defensive manoeuvres against the fire because of fire radiance. A well-cleared area allows firefighters to intervene safely, and to adopt an offensive strategy [6,7].
For example, a wildland fire with a wind speed of about 50 km/h, burning 8-meter high vegetation will produce a radiant flux of about 1 watt/cm² at 22 meters. The pain threshold for a firefighter wearing protective equipment is about 0.7 watt/cm² [8,9]. It is therefore impossible for him/her to approach and fight the fire in this case.
Land-clearing consists in reducing vegetation to limit its horizontal and vertical continuity. A land-clearing operation, such as creating glades, reduces the fuel available for a potential fire and limits its propagation [10-12].
More precisely, along a forest track, land-clearing consists in creating a 2-meter high discontinuity [13] between the herbaceous stratum and the tree stratum (>3 meters high) by eliminating the shrubby stratum and cutting tree crowns. It avoids fire propagation by convection from the herbaceous stratum to the tree stratum, and enables firefighters to deal with the fire in safety. Land-clearing must be carried out all along forest tracks, clearing a width generally between 10 and 20 meters on each side, depending on the local prevention policy, topographic aspects and the strategic importance of the track location.
Land-clearing operations are under the supervision of public organizations: French National Forest Office for public forests, and district offices for municipal and some private forests. They are more particularly in charge of track creation, upkeep and land-clearing operations.
There are various methods of land-clearing: manual, mechanical, chemical or animal clearing, and prescribed fires [14,15]. Whatever the land-clearing method used, its effectiveness is short-lived (i.e. 2 - 3 years on average) and the costs are very high (www.ofme.org). The main difficulty for forest officers is to identify an optimized method to select appropriate tracks to clear each year, because it is impossible to clear all the tracks each year [16]. For example, in the French Var Department, where forest covers about 70% of the total surface area, there are about 6000 km of forest tracks.
All the existing spatial methods designed to evaluate land-clearing priorities aim at clearing the areas most exposed to fire risk first [17]. These spatial methods take into account parameters such as topographic aspects (e.g. crests or thalwegs), slope, wind exposure, and vegetation density. As far as possible, it is also necessary to know what land-clearing operations have previously been carried out on the area [15].
Remote sensing tools would seem to be particularly useful for obtaining the best strategic and economic overview of forest tracks at departmental scale [18,19]. And, more precisely, the specific theme “land-clearing evaluation method” was selected by the French Space Agency (CNES) as a target application when specifying the products and services to be provided by the images derived from the new Pleiades sensors: products and services required by end users.
1.1. ORFEO Accompaniment Program
In 2003, initiated in France by the CNES, the ORFEO (Optical and Radar Federated Earth Observation) Accompaniment Program was set up in order to prepare, accompany and promote the use and exploitation of the images derived from new the Pleiades and Cosmo-Skymed sensors (http://smsc.cnes.fr/PLEIADES/A_prog_accomp.htm). Such a program was needed because of: the new capabilities and performances of the ORFEO systems (high optical and radar resolution, access capability, data quality, possibility simultaneously to acquire optical and radar data), the implied need for new methodological developments: new processing methods, or the adaptation of existing methods, the need to carry out those new developments in very close cooperation with end-users, and to integrate new products in their systems.
The Accompaniment Program consists of two parts, between which there needs to be a high level of interaction: A methodological part, whose objective is to define and the develop tools for the operational exploitation of the future submetric optical and radar images (ORFEO Toolbox).
A thematic part, which covers a large range of applications (civil and defense), and aims at specifying and validating value-added products and services required by end users. This part includes considering how to integrate products into operational systems or processing lines. It also includes careful consideration concerning the intermediary structures to be developed to help nonautonomous users.
This program uses simulated data (acquired during airborne campaigns) and satellite images quite similar to Pleiades (such as QuickBird and Ikonos), used communally on a set of special sites. The products and services to be specified are validated using those simulated data.
Once completed, the images derived from the Pleiades-HR sensors will enable users to very quickly access daily-updated infra-metric resolution data for every point on Earth [20]. To achieve this, the Pleiades system consists of a constellation of two optical satellites (visible and near infrared domains) on a Sun-synchronous orbit at 694 km. Two satellites are essential to guarantee the accessibility and revisit frequency required to provide an operational response to defense and civil security missions [21].
With its two agile satellites the Pleiades system will offer: daily access to every point on Earth, a panchromatic resolution of 0.7 m in vertical viewing, four spectral bands (blue, green, red and near-infrared) with a resolution of 2.8 m in vertical viewing, a field of view of 20 km, the acquisition of a 120 km × 120 km image mosaic in the same orbit, the acquisition of almost instantaneous stereoscopic couples (or even triplets) of 20 km by 300 km, the acquisition of cloud free images covering 2,500,000 km² per year, very accurate localization of the images (<1 m with ground control points) enabling optimal use of the data in Geographical Information Systems (GIS).
The work presented below, an example of research into the use of remote sensing for Civil Security applications, shows the great interest of the ORFEO Accompaniment Program with regard to the specific topic of wildland fires.
1.2. Objectives of the Study
The objective of this work is to assess the real potentiality of such Very High Spatial Resolution (VHSR) imagery for land-clearing management: identification of the quality level of land-clearing in relation to firefighting safety aspects, and evaluation of diachronic land-clearing evolution parameters.
More precisely, this paper will present a method based on VHSR imagery in order to: identify the various ecological facies and their combinations—what is defined as “fuel types” in the literature [22,23]—in a forest in the French Mediterranean area define qualification criteria for various clearing levels related to firefighting safety aspects elaborate a correspondence between the various ecological facies and the qualified clearing levels evaluate the evolution in clearing level using diachronic analysis.
1.3. Study Area
The study area is located in the Var Department in the south-east of France. This Department is subject to a Mediterranean climate characterized by hot, dry summers and a northerly prevailing wind, which dries up vegetation and make it very vulnerable to wildland fires. During the summer of 2003, one large fire burnt 10% of the “Massif des Maures” [24].
More precisely, the study area is in the forest area call “Massif des Maures”, which covers 150,000 hectares (Figure 1). It has a steep topography, is located near the Mediterranean Sea and is largely covered by forest.
The vegetation of the “Massif des Maures” is heterogeneous, drier on the South side, and the soils are siliceous. The main components of the resulting mixed vegetation (Picture 1) are as follows [25]:
Ÿ herbaceous stratum: grass family
Ÿ shrubby stratum: arbutus, heathers, cistus, brooms
Ÿ trees stratum: oaks (cork oaks, live oaks, …), chestnut, pines (maritime pines and Aleppo pines)
The local prevention policy to protect forests from fires consists in making forest less vulnerable to fire propagation and allowing firefighters to work efficiently and safely, close to the fire.
This local prevention policy is considerably more constraining than the national one, because of the high vulnerability to wildland fires [9]. Land-clearing can cover very large areas, depending on the height of the trees: the cleared width must be at least 8 times the
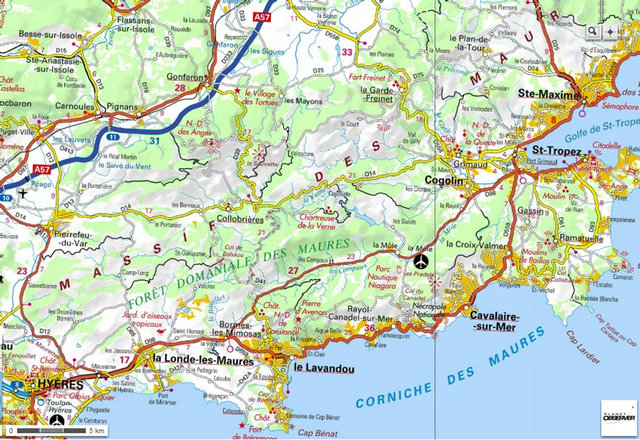
Figure 1. Location of the “Massif des Maures”.
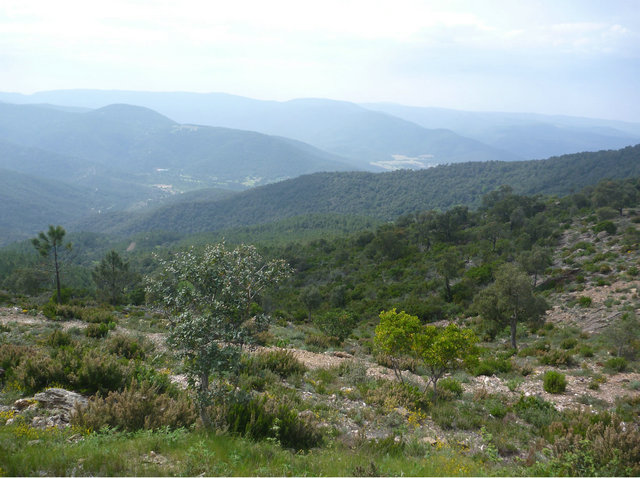
Picture 1. Characteristic vegetation of the study area (Rayol area).
height of dominant vegetation, and cannot be less than 50 meters. In the case of one side being dominant in the propagation process, the width will be larger.
Trees act as a wind break, decreasing the wind speed and rate of spread, and thus reduce the risk of spot fires. It is important to keep full-grown trees in cleared areas, but their density will depend on their location in the forest area. Horizontal discontinuity must be maintained by spacing crowns at least 5 meters apart. Trees must be pruned at 2.5 meters minimum (Picture 2).
Our partners were local firefighters (Service d’Incendie et de Secours du Var) and the local rangers’ office (Sivom du Pays des Maures).
2. Materials
2.1. Data
In order to anticipate the real Pleiades images, planned for 2012, the VHRS satellite images used, provided by QuickBird and Pelican, were quite similar to the future Pleiades images.
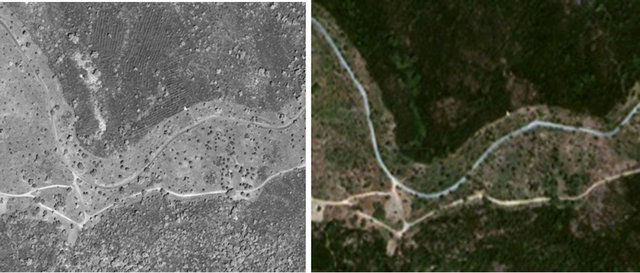
QuickBird images are developed by DigitalGlobe®, and are the only product with infra-metric spatial resolution. The QuickBird product is a panchromatic image with a spatial resolution of 0.61 meters (see Figure 2(a)). The panchromatic bandwidth (0.45 - 0.90 µm) is broader towards the NIR than the Pleiades one (0.48 - 0.83 µm). QuickBird is also a multispectral image (see Figure 2(b)) made up of blue, green, red and infrared bands, with a spatial resolution of 2.44 meters. The QuickBird field of view is 16.5 km, whereas that of Pleiades will be 20 km (Source: http://smsc.cnes.fr/PLEIADES/index.htm).
Pelican images are produced by the CNES from images acquired by airborne sensors, and are intended to simulate Pleiades images. Pelican is an airborne image acquisition-system composed of four digital cameras with 4096 × 4096 pixel arrays.
The four digital cameras produce four straight bandwidths in blue (452 - 529 nm), green (512 - 595 nm), red (623 - 706 nm) and infrared (780 - 932 nm) [26].
Such enhanced spatial and spectral performances are opening the way for new possibilities in the study of
 (a) (b)
Figure 2. (a) and (b) Panchromatic and multispectral images used (showing land-clearing along forest tracks).
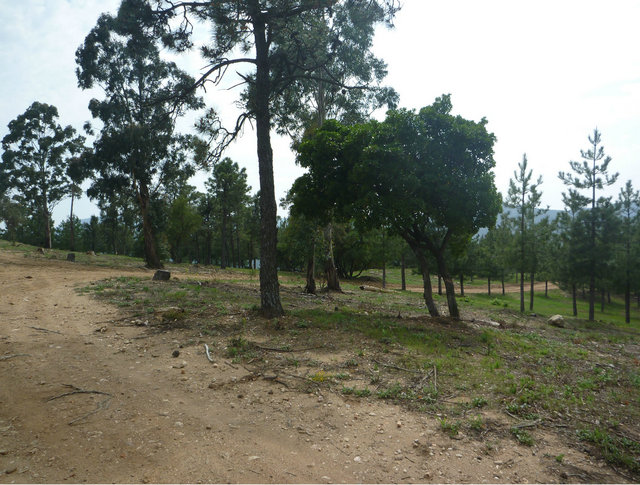
Picture 2. Example of land-clearing along forest track on the study area.
natural hazards. In the past, lower-resolution images from other satellites (SPOT, LANDSAT) enabled researchers to understand such phenomena as agricultural abandonment or the fall of biodiversity in natural areas. The production of very high spatial resolution (VHSR) data allows a new understanding of the environment and vegetation characterization [27-30], and especially in the Mediterranean ecosystems [7]. Moreover, these new products enable detailed and objective quantification of a situation through their complex object recognition capacities [31].
The other Geographic Information System data used:
Ÿ GIS data from the rangers’ office (SIVOM du Pays des Maures): land-clearing operation units, previous land-clearing operations since 2000.
Ÿ GIS data from the firefighters (Service d’Incendie et de Secours du Var): forest tracks, land-clearing areas.
2.2. Main Processing Tools
The software used to perform this work was the ORFEO Toolbox (OTB).
In the framework of the methodological part of the ORFEO Accompaniment Program, the French Space Agency (CNES) decided to develop OTB: a set of algorithmic components designed for large remote sensing images, which enables the capitalizing of methodological knowhow, and therefore uses an incremental approach to benefit from the results of methodological research.
The ORFEO Toolbox (OTB) is distributed as an open source library of image-processing algorithms [32]. OTB is based on the medical image processing library ITK and offers particular functionalities for remote sensing image processing. From OTB, developers designed stand-alone software to demonstrate what can be done with this library. Moreover developers developed an OTB-based application for building processing chains, named Monteverdi.
OTB is distributed under a free software license CeCILL (similar to GPL) to encourage contribution from users and promote reproducible research. OTB is designed to process huge images through streaming and multi-threading capabilities, so no supercomputer is required (Source: http://www.orfeo-toolbox.org/otb/).
3. Methods
3.1. Overview
The general methodology used is based upon two types of reasoning: deductive, consisting in image classification with OTB followed by spatial analysis of data using the ARCGIS® GIS in order to extract land-clearing quality inductive, consisting in evaluating land-clearing quality based on field questionnaires with end-users.
3.2. Image Classification Processing
The classification process precisely identifies the geographic objects in an image. This classification aims to identify:
Ÿ bare rocks
Ÿ the herbaceous stratum
Ÿ the low shrubby stratum (between 10 cm and 50 cm)
Ÿ the high shrubby stratum (between 50 cm and 2 m)
Ÿ the tree stratum
Ÿ shade The object oriented classification approach applied uses all the information contained in the satellite images [30]: spectral characteristics, spatial organization and relationships between objects. It increases the quantity and quality of information extracted [33-36]. It is particularly well adapted to map fuel types in Mediterranean regions [7,17,37].
The object oriented classification approach is first based on segmenting images to produce spatial units [38]. This operation is performed according to homogeneity criteria, e.g. shape, texture and radiometry [39], empirically determined to be as close as possible to the real geographic objects [30,35]. The quality of classification depends on the efficiency of the segmentation (good discrimination of geographic objects, eliminating mixups between the spectral responses of different objects).
This classification enables information to be represented in layers each corresponding to a specific scale [40]. With a segmentation made using different spatial resolutions, it is therefore possible to obtain different levels of spatial organization; For this work, the first level of segmentation must distinguish cleared areas (which we will call “DFCI areas” in this work: land-clearing area along a forest track) from forest areas; the second aims to segment various strata in the DFCI areas: bare rocks, herbaceous stratum, low shrubby stratum, high shrubby stratum, tree stratum, shade (as shown in Figure 3). This fine segmentation is performed in order precisely to identify isolated trees in the DFCI areas [41].
More precisely, the image processing workflow consists of several processing operations, outlined in the following paragraphs.
3.2.1. Geometrical Corrections
Multispectral and panchromatic images are geometrically corrected using a sensor model (i.e. a Rational Function Model, where Rational Polynomial Coefficients are included in the images’ metadata) and a Digital Terrain Model (DTM) SRTM© with spatial resolution 10 m and elevation precision 2.5 m. This processing operation produces registered and orthorectified images.
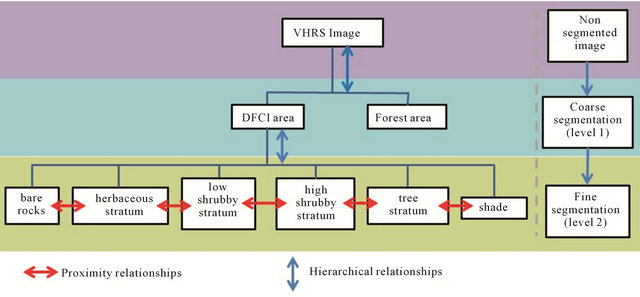
Figure 3. Various level of segmentation.
3.2.2. Image Fusion
This combines the submetric spatial resolution (from panchromatic images) and the four-band spectral resolution (from the multispectral images) in order to obtain the best imagery quality for feature extraction. This processing is known as a pan-sharpening. The method used is provided in OTB [42]. First the multispectral image is resampled at the same spatial resolution as the panchromatic one (size PAN = size XS × 4). Then a low pass filter is applied to the panchromatic one in the Fourier domain and the resulting content is normalized with the multispectral image. Finally the 4-ratio image is multiplied by the panchromatic image.
(PAN + XS) = (XS/PAN filtré) × PAN
3.2.3. Area-of-Interest Selection
In order to select areas of interest inside the forest area of the Massif des Maures, three DFCI areas were located, as shown in Figure 4. These areas were chosen for their diversity of ecological facies, and variety of land-clearing operation techniques. They are small areas to limit computation time.
3.2.4. Feature Selection
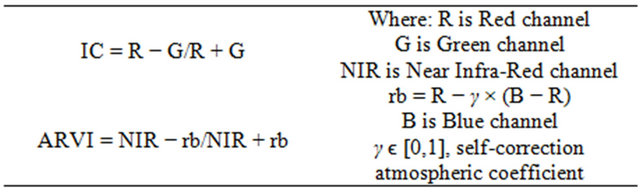
To discriminate the six classes (i.e. bare rocks, herbaceous stratum, low shrubby stratum, high shrubby stratum, tree stratum and shade), five features were empirically selected: the red band, the near-infrared band, the panchromatic image and two specific indexes to highlight vegetation and soil respectively. The bands and the indexes were obtained from pan-sharpened images. The two indexes are as follows:
IC (Color or Clarity Index) discriminates ground cover by luminous flux. It is elaborated using the Green and Red channels.
ARVI (Atmospherically Resistant Vegetation Index), a
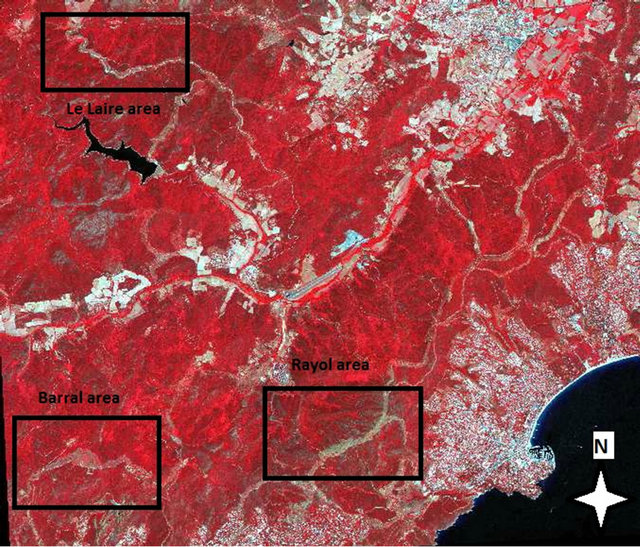
Figure 4. Location of the areas of interest.
variant of the NDVI that incorporates the Blue channel in order to reduce atmospheric effects [43]. It discriminates well between forest and DFCI areas.
3.2.5. Coarse Segmentation
A mask is computed and applied to the DFCI area of interest to isolate the potentially cleared land area. Using the ARCGIS® GIS, a buffer is generated from the forest tracks (as vector data). The buffer width corresponds to 50 meters each side of the tracks, according to the clearing rules. After binarisation (i.e. pixel value = 1 for the areas of interest, 0 otherwise) the buffer is multiplied by the selected features to mask them.
3.2.6. Fine Segmentation
As mentioned before, this process is an important task for appropriately defining objects before the objectoriented classification. Observations led us to use only spectral information as homogeneity criteria. The Meanshift algorithm [44] was exploited to group (or cluster) adjacent pixels as objects. This algorithm requires three user-defined parameters. The spectral and spatial windows were needed to iteratively calculate the shifted local means (i.e. the grouping approach). Concerning the image resolution and size of smallest the possible tree crowns or shrubs, the minimum spatial window had to be selected (i.e. 3 × 3). The spectral window was set empirically as the value where the objects fitted the smallest tree crowns or shrubs in the image. The third parameter was the final minimum region size after grouping. The last is the convergence criterion of the iterative process and also had to be set to its minimum value (i.e. one pixel) for the same reasons.
3.2.7. Classification
The final step was performed using a support vector machine, known as SVM [45], well adapted to this topic [46]. This is a kernel-based algorithm which is widely used for classification and regression tasks in image processing. The classification workflow consisted in manually selecting training sets for each class (i.e. as representative as possible of intra class diversity) then applying the algorithm to classify the whole image. As a result, user-defined colors were assigned to each class for a convenient representation.
3.3. Spatial Reasoning
The objective of land-clearing operations is to create vertical and horizontal discontinuity within the DFCI areas. The shrubby strata (low and high) and tree stratum contribute the most to fire propagation, and must absolutely be mapped. The end-users’ (firefighters’ and rangers’) needs involve having maps representing three levels of land-clearing quality, i.e. good, medium and bad. A spatial reasoning based method was set up to generate such a map.
Since shade gives no information about vegetation, shady areas were not taken into account. Bare rocks and the herbaceous stratum need no particular attention and were thus considered to be well-cleared. The low shrubby stratum is also considered as a well-cleared area according to firefighters and rangers. On the other hand, massed trees require attention since their crowns can hide the shrubby stratum. They were consequently mapped as badly-cleared. A spatial reasoning strategy was then introduced to define clearing quality based on neighborhood and density relationships between trees and high shrubs. It consisted in generating a five-meter buffer around each tree and calculating the percentage of high shrubby stratum. The Table 1 below shows the correspondences between land-clearing quality and ecological facies in the DFCI areas.
3.4. Field Questionnaires
Collecting the final users’ point of view is of major interest. In the case of this study the field questionnaires had a dual purpose. On the one hand, the process consisted in obtaining several assessments for defining the predominant parameters in evaluating land-clearing quality. On the other hand, it provided field observations for evaluating, improving and validating the image processing and spatial analysis methods. The approach is described below: Identifying the main parameters used to describe a plot, for rangers and firefighters: type of vegetation, location of plot, quantity of vegetation, continuity between various strata, previous land-clearing operations or wildland fires, technical aspects of land-clearing operations Selecting the land parameters affecting clearing levels: species, growth, height and coverage of each stratum, vertical and horizontal continuity between stratum, winds aspects, slope (if more than 20%), mountainside, etc.
Drawing up a field questionnaire to evaluate clearing levels.
3.5. Diachronic Analysis
Mapping the evolution of vegetation from year to year makes it possible to characterize the scheduling of landclearing operations, evaluate the real impact of landclearing operations, and evaluate the evolution of vegetation without any land-clearing operations.
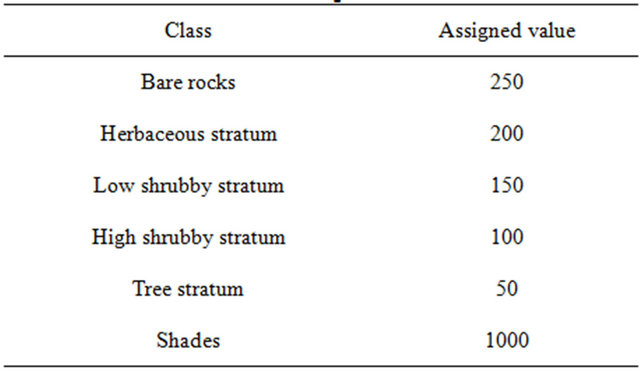
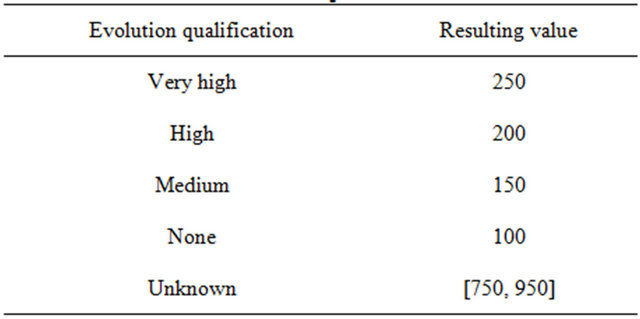
The objective is to observe the evolution of vegetation in order to plan land-clearing operations more efficiently. The method was divided into three steps. From two classification results (i.e. corresponding to two distinct years), a specific value was first assigned for each class. For convenience reasons, the values chosen were integers and relatively distant from each other. Secondly a pixelbased differentiation was performed. Finally, the resulting signed values were interpreted as an evolution criterion. This strategy is illustrated in Table 2.
4. Results and Discussions
The previous part aims at describing the methodological choices made in this precise context of using Very High Spatial Resolution imagery for land-clearing management. The objectives are to identify the quality level of land-clearing in relation to firefighting safety aspects and to evaluate diachronic land-clearing evolution parameters. In this part, the results of the methods will be presented and discussed in relation to the end users’ expectations.
4.1. Strata Classification
A specific method was designed [47], tested and improved. The workflow was mainly carried out using the OTB-based software, i.e. Monteverdi. This workflow is presented in Figure 5.
Three input data are required, i.e. a VHRS image (with metadata), a DTM for the orthorectification process and a binary mask for the coarse segmentation. In its current
Table 1. Spatial reasoning strategy.
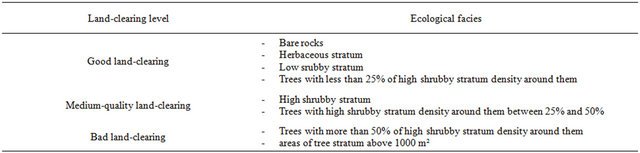
Table 2. From two classification maps to an evolution map. Note that an “unknown” evolution can happen due to shade. The sign is thus not significant in this case.
(1) Value assignment
(2) Differentiation
(e.g. 2008-2009)
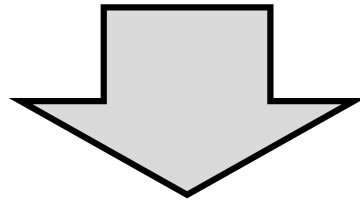
(3) Value interpretation
state, each processing operation needs to supervised, thus obliging a user to intervene. Nevertheless, in practice, only the fine segmentation and classification steps require external interventions (respectively to tune the spectral window parameter and select training sets). Automating the workflow would be advantageous, but needs more work on defining generic parameters and training sets.
As mentioned above, this workflow aims at identifying the following classes in the DFCI areas: bare rocks, herbaceous stratum, low shrubby stratum (between 10 cm and 50 cm), high shrubby stratum (between 50 cm and 2 m), tree stratum, and shade. Good classification results are necessary since the spatial reasoning and diachronic analysis are based on them. Figures 6 and 7 show classification results on a subset of the Barral area
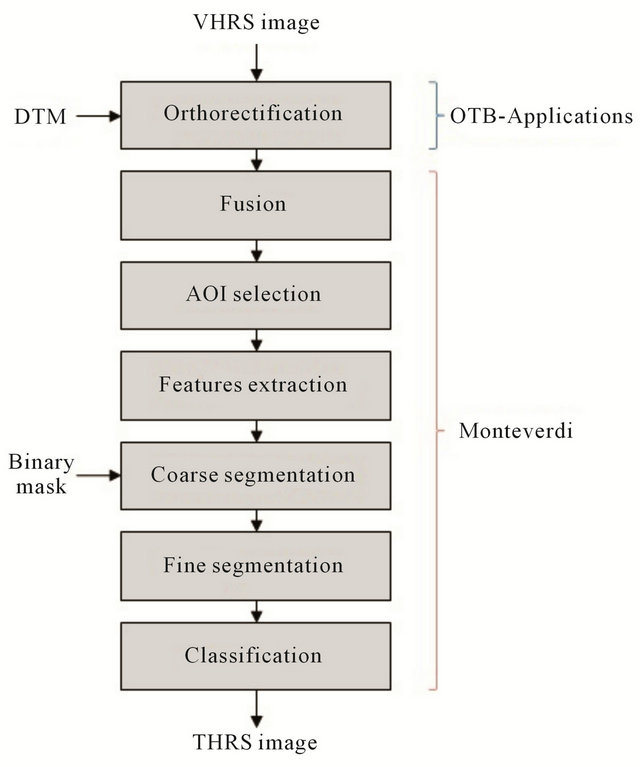
Figure 5. Strata classification workflow.
for 2009. This classification gives particularly good results (overall accuracy about 87%). The Kappa coefficient [48], that gives a probability of a good classification, reached up to 93.37%. The strata are well distinguished as shown in Figure 6 (look at the water tank to properly situate the picture on the right). Moreover, the classification also presents good shade identification, as presented in Figure 7 [49].
4.2. Image-Based Land-Clearing Quality Assessment
Using the classification described above, the spatial analysis is very reliable [49], as shown in Figure 8. It is based on the ratio of high shrubs (50 cm - 2 m) within a 5- meter radius around a tree. The various land-clearing levels were established in collaboration with end-users, based on the spatial reasoning strategy presented previously in Table 1.
4.3. Questionnaire-Based Land-Clearing Quality Assessment
The objective is to validate the spatial reasoning (presented previously) by land validation with end users. This is done in order to gather consensus between rangers and firefighters on clearing quality levels, and to validate the results of spatial analysis based on the QuickBird image (2009) with land evaluation with the end users (2011).
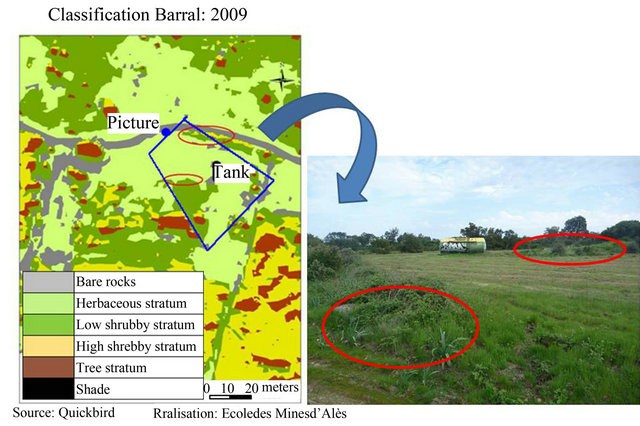
Figure 6. Classification results to highlight the shrubby stratum identification.
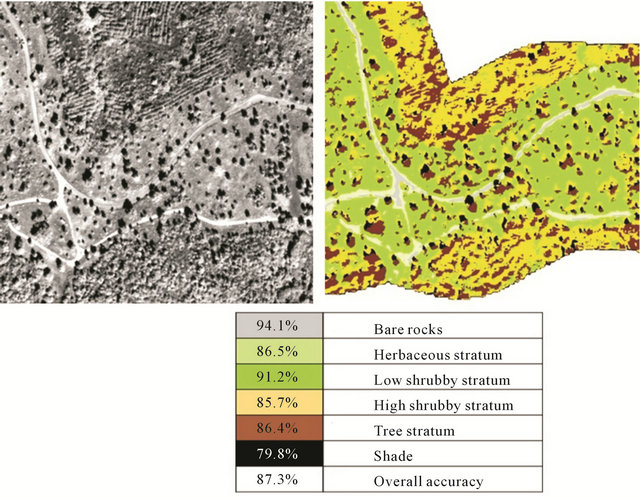
Figure 7. Classification results to highlight shade identification.
The clearing level evaluation was carried on the selected plots using the in-field questionnaire established previously, with both rangers and firefighters (Pictures 3-5).
Eleven plots were selected for in-field validation, and 3 to 6 persons evaluated clearing levels on each plot.
The main results of the evaluation based on field questionnaires showed good consensus between rangers and firefighters (there were just a few minor differences). The differences between rangers and firefighters essentially concerned coverage evaluations for bare rocks vs. herbaceous stratum. However, the global evaluation of the clearing level was the same for rangers and firefighters [50].
The comparison between spatial analysis (based on VHRS images taken in 2009) and clearing level evaluation (based on land observations made in 2011) shows that the vegetation has grown from 2009 to 2011, and for plots where there was a consensus in 2009, there was a consensus in 2011. It is thus possible to conclude that there is a good consistency between in-field analysis and
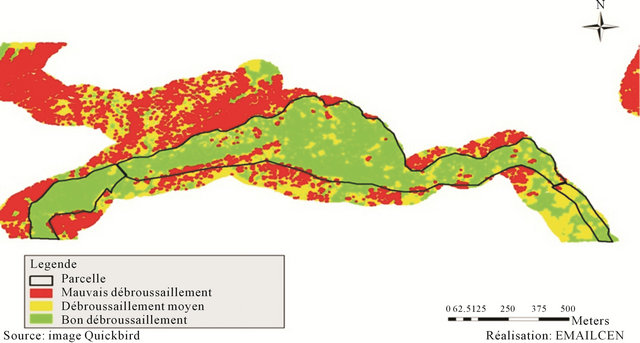
Figure 8. Land-clearing levels map (Barral area, 2009) resulting from spatial analysis of the strata classification.
spatial analysis, and that the spatial analysis is therefore totally reliable.
4.4. Strata Evolution Mapping
The objective was to define the shrub evolution, using the allocation of a value to each ecological facies, and then making the difference of values between two images for the same pixel to evaluate the vegetation evolution level. The results in Figure 9 below show that the landclearing operations between 2006 and 2008 had a strong impact on the vegetation. But this impact does not seem to continue for a long time: the vegetation increased strongly between 2008 and 2009. Some specific species, such as arbutus unedo, are particularly dynamic after fires or land-clearing operations [51].
4.5. Further Discussion
Sharing data from Very High Spatial Resolution (VHRS) imagery on a territory such as a forest area may be of particular interest to users. It enables them to program land-clearing operations only when and where they are useful. Land-clearing operations consist in reducing vegetation to limit its horizontal and vertical continuity, depriving the fire of fuel, and creating firebreaks to halt its propagation. To that end, this work aims to develop a specific methodology for land-clearing management: identification of the quality level of land-clearing in relation to firefighting safety aspects, and the evaluation of land-clearing evolution parameters.
In the Maures forest area, about 300 hectares of land need to be cleared every year, mainly by forest grinding. The financial burden is high and recurrent, and different
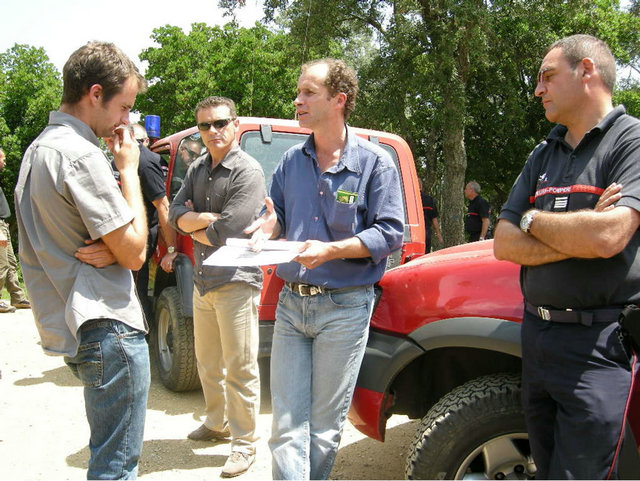
Picture 3. Selected plots for in-field validation and clearing level evaluation with end users.
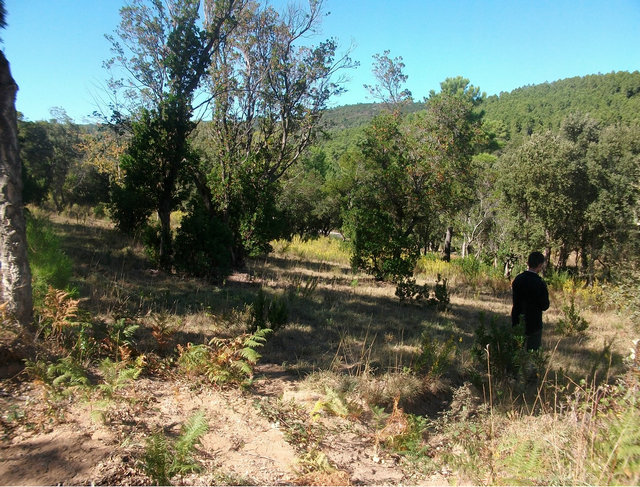
Picture 4. Selected plots for in-field validation and clearing level evaluation with end users.
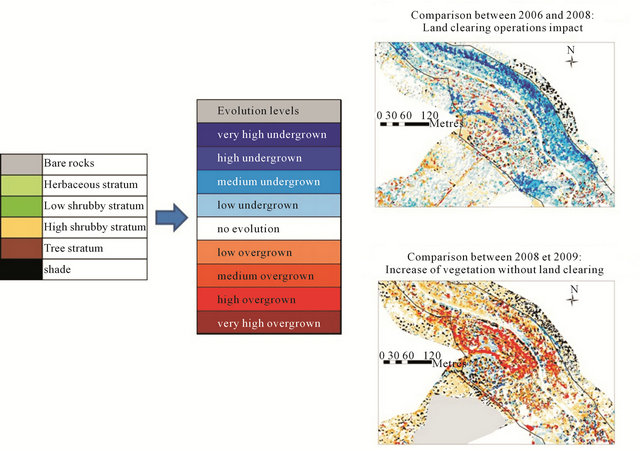
Figure 9. Evolution of the vegetation among 2006, 2008 and 2009.
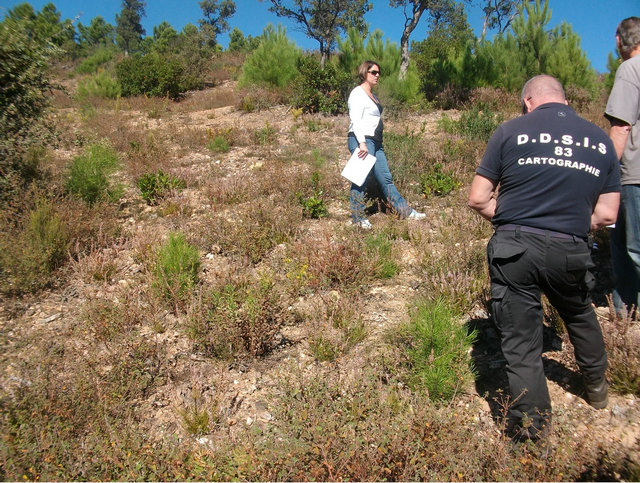
Picture 5. Selected plots for in-field validation and clearing level evaluation with end users.
techniques are used to delay land-clearing operations (pasturing, improving soil and fodder production capacity, etc.).
Precise scheduling of land-clearing operations enables the modeling of new growth, and thus makes it possible to compare the various land-clearing techniques used. The main interest is obtain both the firefighters’ and the foresters’ points of view, and to obtain consensus on safety aspects in cleared areas, in order to locate high fire risk areas, update operational cartography and plan against forest fires.
5. Conclusions
The methodology presented above was based upon: a deductive approach, consisting in an image classification processing operation with OTB© followed by spatial analysis of data with the ARCGIS© GIS in order to extract land-clearing quality and evolution; and on an inductive approach, consisting in evaluating landclearing quality through field questionnaires with end-users.
The methodology were applied to a French Mediterranean area, the “Massif des Maures”, which is highly sensitive to fire risk. The methodology was validated for this study area through interactions with firefighters and rangers, and comparisons with field observations.
As part of the ORFEO Accompaniment Program, the development of a methodology and its application to QuickBird images-used as Pleiades data simulationssuccessfully showed that Very High Resolution Satellite Imagery is useful for preventing forests fire risk. From the Pleiades data acquisition, the methodology will be applied to the same area, and then extended to a new French Mediterranean area where the ecological facies are slightly different (e.g. Northern Massif of Montpellier). These future studies will lead to new experiments for updating and generalizing the methodology.
The local end-users, i.e. the firefighters (Service d’Incendie et de Secours du Var) and the rangers office (Sivom du Pays des Maures), are very interested in such decision supports. After some needed further validation and generalization work [16], there seems to be a good perspective for providing operational mapping services to help land-clearing management in the Mediterranean area.
6. Acknowledgments
This work uses QuickBird images developed by DigitalGlobe®, Pelican data and Orfeo Tool Box, all provided by the French Space Agency (CNES). This work was partially funded by the French Space Agency.
The authors want to acknowledge the users of this work, especially Jean-Claude Poppi, firefighter from the Service d’Incendie et de Secours du Var and Jacques Brun from the local rangers’ office (Sivom du Pays des Maures). We also want to thank all others contributors.
REFERENCES
- Ministère de l’Agriculture, de l’Agroalimentaire et de la Forêt, “Prévention des incendies de foret,” 2012. http://agriculture.gouv.fr/IMG/pdf/2012-07-31-Prevention_des_incendies_de_foret__dossier_dinformation_MAAF_2012_cle45934d.pdf
- D.S.C., “Guide de Stratégie Générale en Matière de Protection de la Forêt Contre l’Incendie,” Ministère de l’Intérieur, Direction de la Sécurité Civile, 1994, 14 p.
- E. Rigolot and D. Alexandrian, “Learning from Fuel- Break Behaviour during the 2003 Larges Fires in South Eastern France,” Forest Ecology and Management, Vol. 234, 2006, p. 227. doi:10.1016/j.foreco.2006.08.254
- N. Cassagne, F. Pimont, J.-L. Dupuy, R. Linn, A. Mårell, C. Oliveri and E. Rigolot, Using a Fire Propagation Model to Assess the Efficiency of Prescribed Burning in Reducing the Fire Hazard,” Ecological Modelling, Vol. 222, No. 8, 2011, pp. 1502-1514. doi:10.1016/j.ecolmodel.2011.02.004
- L. R. Green, “Fuelbreaks and Other Fuel Modification for Wildland Fire Control,” US Department of Agriculture Handbook, 1977.
- D.D.S.C., “Guide National de Référence, Techniques Professionnelles,” Manœuvres Feux de Forêts. Ministère de l’Intérieur, Direction de la Défense et Sécurité Civiles, 2008, 105 p.
- R. Lasaponara and A. Lanorte, “On the Capability of Satellite VHR QuickBird Data for Fuel Type Characterization in Fragmented Landscape,” Ecological Modelling, Vol. 204, No. 1-2, 2007, pp. 79-84.
- F. Jacques, “Méthodologie Expérimentale Pour la Détermination des Limites d’Emploi des Équipements de Protection Individuelle des Sapeurs-Pompiers—Application à la Lutte Contre le feu par des Essais sur l’Homme en Conditions Opérationnelles,” Thèse de Doctorat, Ecole Nationale Supérieure des Mines de Saint-Etienne, 2008, p. 259.
- DDSIS83, “Guide des Équipements de DFCI,” Préfecture du Var, 2004, p. 51.
- M. Finney, “Design of Regular Landscape Fuel Treatment Patterns for Modifying Fire Growth and Behavior,” Forest Science, Vol. 47, No. 2, 2001, pp. 219-228.
- E. Chuvieco, J. Wagtendonk, D. Riaño, M. Yebra and S. L. Ustin, “Estimation of Fuel Conditions for Fire Danger Assessment,” Earth Observation of Wildland Fires in Mediterranean Ecosystems, 2009, pp. 83-96. doi:10.1007/978-3-642-01754-4_7
- Equipe PYROSCOPE, “Efficacité des Coupures de Combustible Face au feu, Feux de Saint CYPRIEN,” 9 Août 2002, Communes de LECCI et ZONZA. Ministère Agriculture et Forêts, SDIS de Corse du Sud, 2002, p. 18.
- CEMAGREF, “Guide Technique du Forestier Méditerranéen Français, Protection des Forêts Contre l’Incendie,” Chapitre 4, Technical Report, Aix en Provence, 1990, p. 65.
- M. Etienne and E. Rigolot, “Méthodes de Suivi des Coupures de Combustible,” Réseau Coupures de Combustible RCC 1st Édition, de la Cardère Morières, 2001, 48 p.
- E. Rigolot, L. Castelli, M. Cohen, M. Costa and Y. Duché, “Recommendations for Fuel-Break Design and Fuel Management at the Wildland Urban Interface: An Empirical Approach in South Eastern France,” Institute of Mediterranean Forest Ecosystems and Forest Products Warm International Workshop, Athènes, 2004, pp. 131- 142.
- H. Hesseln and D. B. Rideout, “Economic Principles of Wildland Fire Management Policy,” USDA Forest Service, General Technical Report, PSW-GTR-173, 1999, 9 p.
- L. A. Arroyo, C. Pascual and J. A. Manzanera, “Fire Models and Methods to Map Fuel Types: The Role of Remote Sensing,” Forest Ecology and Management, Vol. 256, No. 6, 2008, pp. 1239-1252. doi:10.1016/j.foreco.2008.06.048
- D. Riaño, E. Chuvieco, J. Salas, A. Palacios-Orueta and A. Bastarrika, “Generation of Fuel Type Maps from Landsat TM Images and Ancillary Data in Mediterranean Ecosystems,” Canadian Journal of Forest Research, Vol. 32, No. 8, 2002, pp. 1301-1315.
- R. E. Keane, R. Burgan and J. Van Wagtendonk, “Mapping Wildland Fuels for Fire Management across Multiple Scales: Integrating Remote Sensing, GIS, and Biophysical Modeling,” International Journal of Wildland Fire, Vol. 10, No. 3-4, 2001, pp. 301-319. doi:10.1071/WF01028
- F. De Lussy, P. Kubik, D. Greslou, V. Pascal, P. Gigord, and J. P. Cantou, “Pleiades-HR Image System Products and Quality, Pleiades-HR Image System Products and Geometric Accuracy,” ISPRS International Conference, Hanover, 17-20 May 2005.
- P. Kubik, V. Pascal, C. Latry and S. Baillarin, “Pleiades Image Quality: From Users’ Needs to Products Definition. Sensors, Systems, and Next-Generation Satellites IX,” Proceedings of the SPIE, Vol. 5978, 2005, pp. 188-198. doi:10.1117/12.627570
- S. J. Pyne, P. L. Andrews and R. D. Laven, “Introduction to Wildland Fire,” 2nd Edition, John Wiley & Sons, Inc., New York, 1996.
- D. F. Merrill, M. E. Alexander, “Glossary of Forest Fire Management Terms,” 4th Edition, National Research Council of Canada, Canadian Committee on Forest Fire Management, Ottawa, 1987.
- M. Samson, “Le Monde,” 26 Août 2003.
- Préfecture du Var, “Document d’Objectifs,” Massif des Maure, Vol. I, Analyses et Objectifs, 2009.
- Deliot and Duffaut, “The Importance of Characterizing a Versatile Digital Camera System,” SPIE Newsroom, the International Society for Optical Engineering.
- L. Wang, W. P. Sousa, P. Gong and G. Biging, “Comparison of IKONOS and QuickBird Images for Mapping Mangrove Species on the Caribbean Coast of Panama,” Remote Sensing of Environment, Vol. 91, No. 3-4, 2004, pp. 432-440. doi:10.1016/j.rse.2004.04.005
- F. Kayitakire, C. Hamel and P. Defourny, “Retrieving Forest Structure Variables Based on Image Texture Analysis and IKONOS-2 Imagery,” Remote Sensing of Environment, Vol. 102, No. 3-4, 2006, pp. 390-401. doi:10.1016/j.rse.2006.02.022
- F. M. B. van Coillie, L. P. C. Verbeke and R. R. De Wulf, “Feature Selection by Genetic Algorithms in ObjectBased Classification of IKONOS Imagery for Forest Mapping in Flanders, Belgium,” Remote Sensing of Environment, Vol. 110, No. 4, 2007, pp. 476-487. doi:10.1016/j.rse.2007.03.020
- G. Mallinis, N. Koutsias, M. T. Strati and M. Karteris, “Object Based Classification Using QuickBird Imagery for Delineating Forest Vegetation Polygons in a Mediterranean Test Site,” ISPRS Journal of Photogrammetry and Remote Sensing, Vol. 63, No. 2, 2008, pp. 237-250. doi:10.1016/j.isprsjprs.2007.08.007
- N. Masini and R. Lasaponara, “Investigating the Spectral Capability of QuickBird Data to Detect Archaeological Remains Buried under Vegetated and Not Vegetated Areas,” Journal of Cultural Heritage, Vol. 8, No. 1, 2007, 53-60. doi:10.1016/j.culher.2006.06.006
- S. Steiniger and A. J. S. Hunter, “The Free and Open Source GIS Software Map—A Guide to Facilitate Research, Development, and Adoption,” Computers, Environment and Urban Systems, 2012. doi:10.1016/j.compenvurbsys.2012.10.003
- R. Caloz, and C. Collet, “Précis de Télédétection, Traitements Numériques d’Images de Télédétection,” Vol. 3, Presses de l'Université du Québec—Agence Universitaire de la Francophonie, Quebec, 2001.
- A. Karsenty, F. Alzir and J.-S. Centeno, “Classification Orientée Objet de la Perméabilité des Sols en Zone Urbaine à l’Aide d’Imagerie Très Haute Résolution et de Données Laser Scanner à Curitiba (Brésil),” INPE, Institute Nacional de Pesquisas Espaciais, 2007, pp. 565-572.
- U. C. Benz, P. Hofmann, G. Willhauck, I. Lingenfelder, and M. Heynen, “Multi-Resolution, Object-Oriented Fuzzy Analysis of Remote Sensing Data for GIS-Ready Information,” ISPRS Journal of Photogrammetry and Remote Sensing, Vol. 58, No. 3-4, 2004, pp. 239-258. doi:10.1016/j.isprsjprs.2003.10.002
- J. Qian, Q. Zhou and Q. Hou, “Comparison of PixelBased and Object-Oriented Classification Methods for Extracting Built-Up Areas in Arid Zone,” ISPRS Workshop on Updating Geo-Spatial Databases with Imagery & the 5th ISPRS Workshop on DMGISs, Urumchi, August 2007, pp. 28-29.
- L. A. Arroyo, S. P. Healey, W. B. Cohen and D. Cocero, “Using Object-Oriented Classification and High-Resolution Imagery to Map Fuel Types in a Mediterranean Region,” Journal of Geophysical Research, Vol. 111, No. G4, 2006.
- C. Corbane, N. Baghdadi, S. Hosford, J. Somma and S. Chevrel, “Application d’Une Méthode de Classification Orientée Objet Pour la Cartographie de l’Occupation du sol: Résultats sur ASTER et Landsat ETM,” Revue Française de Photogrammétrie et de Télédétection, 2004, pp. 13-26.
- S. Mansor, W. Hong and A. R. M. Shariff, “Object Oriented Classification for Land Cover Mapping,” Proceedings of the 23rd Asian Conference on Remote Sensing, 2002, pp. 7-9.
- P. Hofmann, “Detecting Informal Settlements from IKONOS Image Data Using Methods of Object Oriented Image Analysis—An Example from Capetown (South Africa),” Second Internat. Symposium on Remote Sensing of Urban Areas, Regensburg, 2001, pp. 107-118.
- V. Thierion, D. Maréchal, P.-A. Ayral, M. C. Lyx, V. Foitier, S. Sauvagnargues-Lesage and J.-C. Poppi, “VHSR Imagery Potentialities for Cleared Shrubland Detection in Operational Fire Management, SPACEAPPLI08-Toulouse, 2008.
- OTB, “The ORFEO Tool Box Software Guide Updated for OTB-3.0.,” CNES, Ed., Toulouse, 2009, 670 p.
- Y. J. Kaufman and D. Tanre, “Atmospherically Resistant Vegetation Index (ARVI) for EOS-MODIS,” IEEE Transactions on Geoscience and Remote Sensing, New York, 1992, pp. 261-270.
- D. Comaniciu and P. Meer, “Mean Shift Analysis and Applications,” Proceedings of the International Conference on Computer Vision, 1999, pp. 1197-1203.
- C. Cortes and V. Vapnik, “Support-Vector Networks,” Machine Learning, Vol. 20, No. 3, 1995, pp. 273-297. doi:10.1007/BF00994018
- B. Koetz, F. Morsdorf, S. Van der Linden, T. Curt and B. Allgöwer, “Multi-Source Land Cover Classification for Forest Fire Management Based on Imaging Spectrometry and Lidar Data,” Forest Ecology and Management, Vol. 256, No. 3, 2008, pp. 263-271. doi:10.1016/j.foreco.2008.04.025
- B. Kabar, “Développement d’Une Méthodologie de Traitement d’Images Pour le Suivi des Zones Débroussaillées de Défense des Forêts Contre les Incendies,” Mé- moire de Master II, Université Toulouse III/Ecole des Mines d’Alès, 2009.
- J. Cohen, “A Coefficient of Agreement for Nominal Scales,” Educational an Psychological Measurement, Vol. 20, No. 1, 1960, pp. 27-46.
- F. Perrot, “Développement d’un Outil d’Aide à la Décision Basé sur l’Imagerie Satellite Pour la Gestion des Zones Débroussaillées de DFCI,” Mémoire de Master II, Université Rennes II/Ecole des Mines d’Alès, 2010.
- R. Oz, “Développement d’un Outil Opérationnel Dédié au Suivi des Zones Débroussaillées Pour la Prévention des Incendies de Forêts en Méditerranée: Validation Opérationnelle des Seuils Établis avec les Utilisateurs Finaux,” Mémoire de Master II, Université Rennes II/Ecole des Mines d’Alès, 2011.
- P. Konstantinidis, G. Tsiourlis and P. Xofis, “Effect of Fire Season, Aspect and Pre-Fire Plant Size on the Growth of Arbutus Unedo L. (Strawberry Tree) Resprouts,” Forest Ecology and Management, Vol. 225, No. 1-3, 2006, pp. 359-367.