Journal of Geographic Information System
Vol. 4 No. 4 (2012) , Article ID: 22152 , 8 pages DOI:10.4236/jgis.2012.44039
GIS and Multi-Criteria Decision Analysis for Land Use Resource Planning
Department of Biosystems Engineering, Faculty of Agriculture and Environment, Gulu University, Gulu, Uganda
Email: m.nyeko@gu.ac.ug
Received March 9, 2012; revised April 7, 2012; accepted May 5, 2012
Keywords: GIS; Multi-criteria analysis; Land use
ABSTRACT
Natural resources management is indispensable in ensuring environmental sustainability and reducing the risk associated with climate change and increasing demand for ecological goods and services. Natural resources planners need to have at their disposal tools that can objectively help in prioritizing land use allocation. Traditional application of land use change model based on economic model, trend analysis, and or scenario analysis present some challenges of data availability and reliability necessary for implementation of the models. However, with the advent of information technology, GIS and remote sensing, biophysical data known for having influence on land use allocation can easily be accessed. The current study explores the application of GIS-Multi-criteria analysis in modeling future land use scenarios for resources planning and management using easy to construct biophysical parameters known for influencing future land use allocation. The decision problems in this study are to find the best spatial allocation of land to future agriculture and forest development, which are considered to present critical land use change in the study area. The afforestation scenarios are meant to offset the pressure on the native forest resources due to the increased demand for fuel and timber and also to contribute to the environmental protection and the agricultural land use scenarios are meant to increase productivity and ensure environmental protection. The land use scenarios did not consider “when” in the future the land use pattern may develop. The analyses of scenarios indicate that afforestation extent in the basin can be increased from 4.6% to 42.9% of the total basin area. However, the afforestation extent of 42.9% may be considered unrealistic, since in practice, it may not be possible to realize up to 42.9% afforestation, nevertheless, the spatial pattern of the afforestation may provide crucial insight into spatial afforestation policies and it future consequences. The agricultural land use can increase from 6.2% to 53.7% of the basin area. The agricultural land use expansion can be realised since the expansion of farm land is primarily the main option to achieve food production increase in the near future. The findings indicate potential use of the methodology in land use planning.
1. Introduction
It is increasingly becoming clear that natural resources management is indispensable in ensuring environmental sustainability and reducing the risk associated with climate change and increasing demand for ecological goods and services. Natural resources planners therefore need to have at their disposal tools that can objectively help in prioritizing land use allocation. Traditional application of land use change model based on economic model, trend analysis, and or scenario analysis [1-3]; and [4] present challenges of data availability and reliability required in implementation of the models. However, with the advent of information technology, Geographic Information Systems (GIS) and remote sensing, biophysical data such as roads, drainage networks etc. known to influence land use allocation are now easy to access.
GIS is a computer-based system that offers a convenient and powerful platform for performing land suitability analysis and allocation. The integration of multi-criteria methods of suitability assessments and allocation methods into a GIS system [5-6] improves the spatial capabilities of GIS and the analytical power as a formal decision making tools. The generic land use suitability model in GIS can be conceptualised as:
 (1)
(1)
where  is suitability measure and
  are factors affecting the suitability of the sites. The GIS based spatial MCDM uses weighted linear combination (WLC) to implement equation (1). The WLC operation assesses the suitability of grid cells by weighting and combining factor maps. WLC multiplies cell values in standardized factor maps by the corresponding factor weight, and then adds weighted values across factor maps. WLC model according to [7] is described as:
 (2)
(2)
where,  is the suitability index for pixel/cell
 ;
;  is the value criteria
  for pixel
  and
and  is the factor weight. The factor weights
  reflect the relative importance of each criterion for a given pixel.
Despite the potential of GIS-MCDM approach in allocating land to its potential use, its application in land use change planning has not been fully exploited, apart from determining suitable sites for land use projects such as hospital, schools and air ports. The current study explores application of MCDM and GIS to answer the complex decision problems of allocating land to potential uses and to produce the land use change maps. The decision problem in this study was to find the best spatial allocation of land to future agriculture and forest development which are considered critical land use expected to change significantly in the near future. The overall land suitability for land use was evaluated using a set of independent biophysical land use parameters and socioeconomic parameters, which influence land use potentials.
2. Materials and Methods
2.1. The Study Area
The study was conducted in the lower part of Aswa basin (Figure 1) located in Northern Uganda. The area covers approximately 12,225 km2, with over 1 million people inhabitants deriving their livelihood directly on land. Altitude ranges between 870 to 1908 meters above sea level and slope is gentle with most part (>97%) having slope less than 20%. Land cover comprises mainly of wood lands and Savannah grassland. The natural forest covers very little area of the catchment (>0.5%).
The redemption of the region from the 20 years of civil unrest is being met with number of environmental challenges most notable is deforestation of the native forest resources and massive afforestation aimed at averting the possible deforestation consequences. The rapid growth in the population and the needs to increase food production and meet the basic energy demand has triggered the land use change problem in the region. The pattern and extent of the new land uses can be of environmental concern. In particular, the composition and distribution of the new land uses are of fundamental important to the management of water resources in the basin. Proper planning and management of the land use
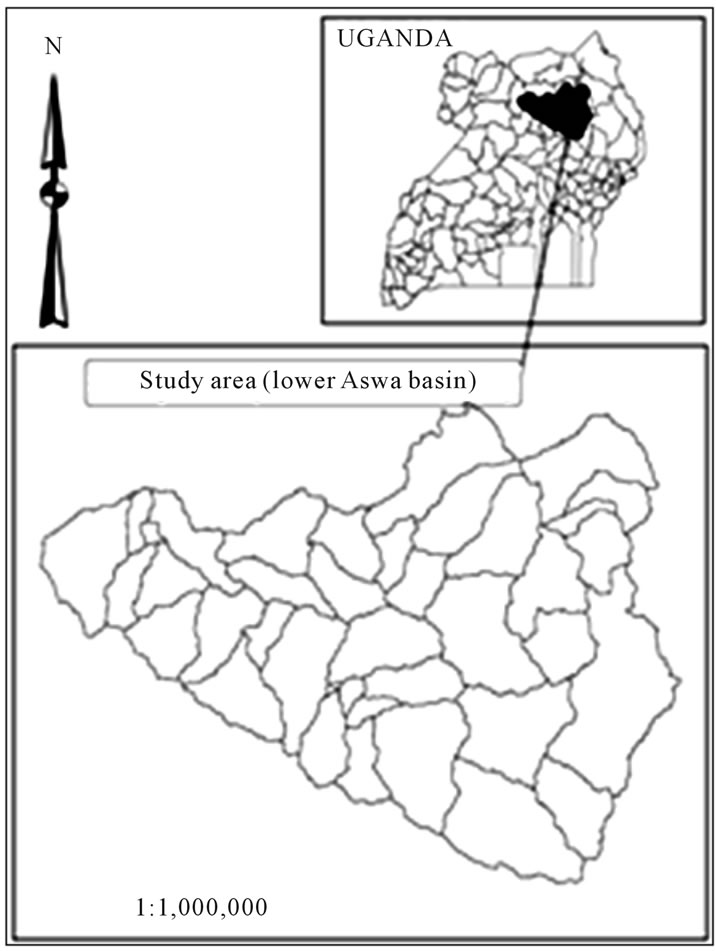
Figure 1. Study area.
changes in the basin should emphasis on allocating land objectively to avoid any future negative impact.
2.2. Criteria Analysis and Decision on Land Allocation
Land allocations using the WLC are based on weighted parameters (map layers) and may consider criteria such as proximity, accessibility, fertility and environmental protection. The choice of the parameters for use in land allocation (suitability analysis) therefore largely depends on the criteria set out. In the current study, the decision problems are to find the best spatial allocation of land to future agriculture and forest development.
The objectives of land allocation to agriculture are to increasing productivity of land, to increasing the scale of farming and to protect the environmental including controlling soil erosion and soil degradation. The criteria therefore used in suitability analyses of potential land parcel for allocation to agriculture are; land parcel should be fertile, land parcel should receive adequate amount of rainfall, land parcel should be accessible. The constraints used to restrict allocation of marginal land and gazetted land to agriculture are; no allocation to existing forest land, no allocation to land under settlement and wetland. Based on these criteria, the biophysical parameters used in suitability analyses of land for agriculture land use are; the Normalized Difference Vegetation Index (NDVI) used as measurement of biomass density and soil fertility, settlement and road network maps used in determining accessibility, rainfall map used in assessing adequacy of rainfall received, and reference land use map used in setting the constraints.
The objective of land allocation to forest is to increase wood production, and provide environmental protection such as soil erosion control, soil degradation control and windbreak. The criteria therefore used in suitability analyses of potential land parcel for allocation to forest are; land parcel should have minimum vegetation cover, should have low population, should receive adequate rainfall and the constraints are; no allocation to parcel with altitude (<900 m), no allocation to parcel already having forest cover and no allocation to land parcel with settlement. Based on these criteria, the biophysical parameters used in influencing the transition of land parcel to forest land were: NDVI, used to show vegetation density, elevation map, rainfall map, settlement and road network maps, and reference land use map used in setting the constraints.
Digital elevation model (DEM) derived from Shuttle Radar Topographic Mission (SRTM) at a resolution of 30 arcs second was used to prepare elevation map. Normalized Difference Vegetation Index (NDVI) was derived from Landsat 7 image. Stream network in the study area was generated from the DEM using minimum drainage area of 4000 hectors. Major roads were used as accessibility layers. Major roads and settlements were digitized from 2001 Landsat 7 image. 2002 population was used to create population density map. And the rainfall map was generated using point measurements from over 40 gauges located within the study area. Annual averages (using 20 years) of rainfall records at each gauge were interpolated using Kriging interpolation technique in ArcGIS to generate rainfall map.
2.3. Application of MCDM in Determining the Weights of the Parameters in Land Use Allocation
Central to land use allocation using the GIS-WLC is the weighted parameters that influenced transition of land parcel/cells from one state to another. Assigning weights to parameters is complex decision problems that involve multiple criterion function. In such a situation, confusion can arise if a logical, well-structured decision-making process is not followed. The MCDM methodology [8-10] can be objectively solve complex decision problem with multiple criteria.
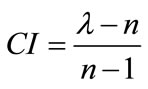
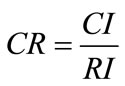
The current study used the Analytical Hierarchy Process (AHP) according to [9] was used. The AHP uses simple and straightforward axioms in analyzing multicriteria decision problems. However, the AHP always allows for some level of inconsistencies which should not exceed a certain threshold [9]. The weights of the parameters were determined using the pair-wise analysis of the parameter, based on the scale of relative importance [9]. The scale of 1 signifying equal value to 9 signifying extreme different was assigned to the pairwise parameter. The pair-wise matrix was then normalized and the eigenvalues of the normalized matrix, which represent the parameter weights, were computed. Analyses for any inconsistencies were later performed. The random Inconsistency indices (RI) (Table 1) developed by Saaty (1980) [9] was used to determine the consistency ratio (CR), which measures the degree of consistency. If the value of CR is smaller or equal to 0.1, the inconsistency is acceptable or else the pair-wise comparison may be revised [9].
 (3)
(3)
 (4)
(4)
 (5)
(5)
where;
 is the Consistency Index
 is the number of parameters
 is the average of the eigenvalues of the normalized comparison matrix (
 ), computed using equation (5).
2.4. Integration of GIS and MCDM
GIS provide a powerful platform for organization of map layers (raster logic) and performing logical and mathematical analyses during land suitability analyses. The logical and mathematical analysis uses the weights of each map layer and the analyses criteria in answering decision question on land allocations. GIS however, does not have the capability of objectively assigning the weights to each map layer. In many cases, making such decision on map layer weights (influence) is highly complex, involving multiple criteria. The MCDM provides the most effective approach to objectively make decision on such a complex problem. The integration of MCDM

Table 1. Random consistency index (RI).
and GIS therefore offers a platform for objectively using GIS in spatial decision making including planning for land use.
The structure of the integrated GIS and MCDM land use change model is shown in figure 2. ArcGIS application and the spatial analyst tools were used in logically performing the WLC operation. Before the WLC operation, the factor raster maps were all converted to an integer raster maps having the same “common measurement scale”. The common measurement scale of one to eight was adopted so as to match the land use map layer scale, which was classified to eight land use categories. Reclassification tool was used to convert the floating raster maps to integer raster maps and to set the common measurement scale.
The percentage influence of each raster layer (parameter map) was derived using the MCDM AHP procedures. Each input raster was weighted according to its percentage influence. The weight was a relative percentage, and the sum of the percentage influence weights for all the raster maps was equal to 100.
2.5. Land Use Scenarios Generation
The results of the WLC operation are suitability maps not the desired land use scenarios. To obtain the desired land use scenarios, which can be used in subsequent land use and natural resources management, the site suitability maps were transformed to “independent” suitability level map, with each suitability level “standing alone”.
The conditional tool “con” was used to perform the conditional if/else to evaluate the input cells and extract the suitability level maps. The extracted parcels of land or the “independent” suitability level maps were then aggregated/merge with the reference land cover maps (2001 land cover map) to obtain the desired land use change maps (land use scenario). The merge operation uses equations (6a) & (6b):
 6(a)
6(a)
 6(b)
6(b)
where i denotes suitability level (1 to 5) for allocation to agriculture (A) and forest (F) and LC2001 is the reference land cover. Equation (6a) gives the first level of treatment with agriculture taking precedence in allocation while equation (6b) gives second level of treatment with forest land allocation taking precedence. In total, ten treatments resulting into ten different land use change map were derived. Equations (6a) & (6b) were executed using the Raster calculator.
3. Results and Discussion
3.1. Pairwise Analysis of the Parameters
The hierarchy in the tables 2 and 3 shows the relative influence of each factor. In allocating suitable land to forest, land use was considered as the most influential factor, and it come on top of the hierarchy while roads was considered to have the least influence and is put at the bottom. In allocation of suitable land to agriculture, rainfall was considered the most influential and land use was the least influential.
The values in each cell represent the scale of relative importance for the given paired factors. The diagonal has the value of 1 throughout because the diagonal represent factors being compared to itself, and the scale equal importance “1” is assigned. In the lower diagonal the values of the scale are in fractions because the factors are being paired in the reverse order and the scale of relative importance is given as the reciprocal of the upper diagonal pairwise comparisons.
The pairwise matrixes were then normalized and the final factor weights computed from the vector weight of the normalized matrix (Table 4). In the allocation of suitable land to forest, the AHP allocated percentage influence of 35% to land cover as factor, followed by NDVI, with 25 percentage influence and least is road with 3 percentage influence. In the allocation of land to agriculture, AHP allocated 32 percentage influences to
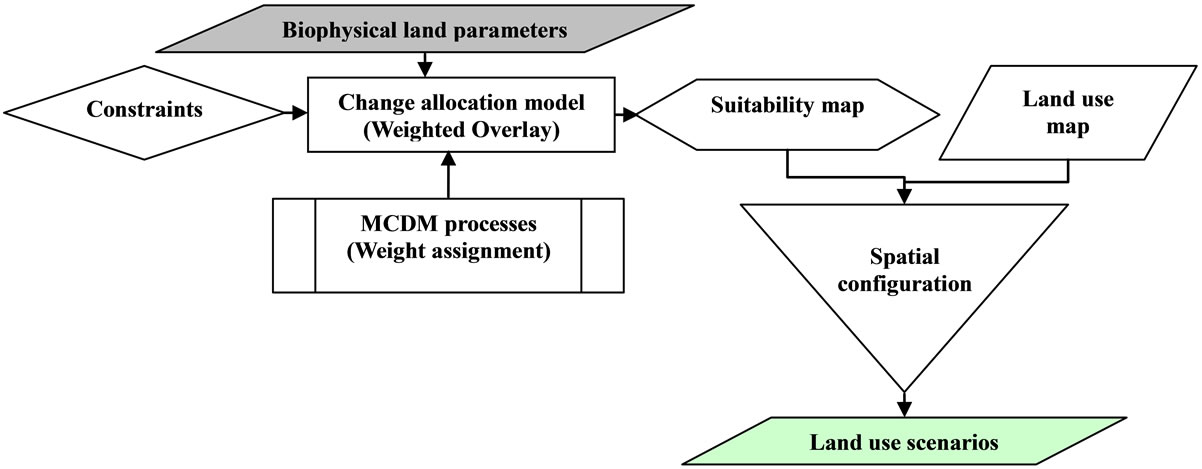
Figure 2. Structure of integrated GIS and MCDM model used in land use scenarios simulation.
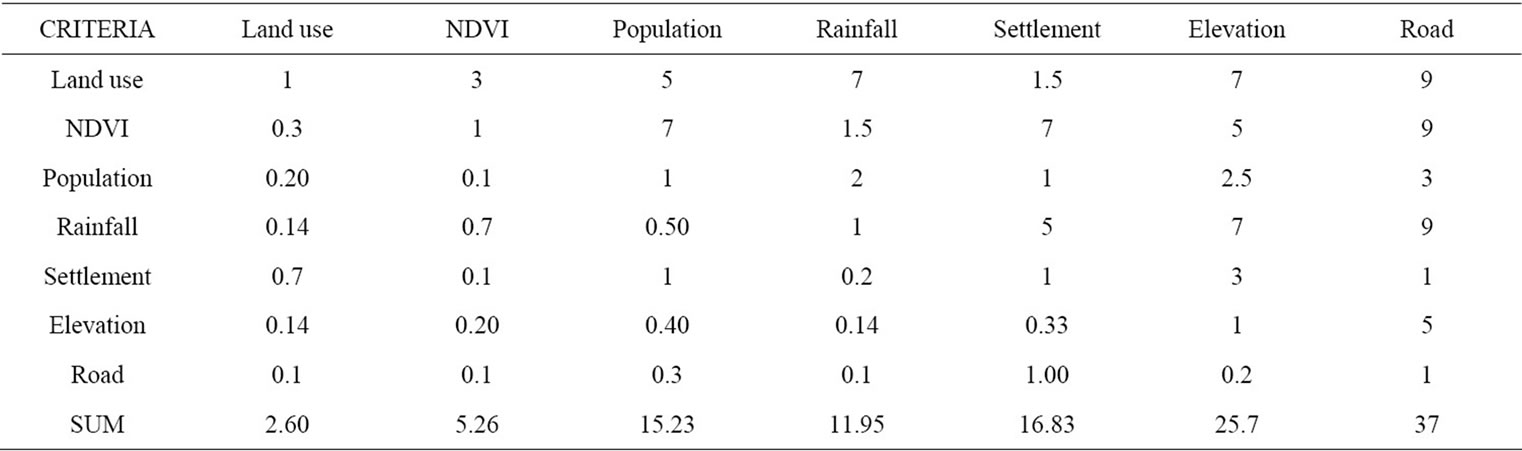
Table 2. Weights of paired factors concerning allocation to forest.

Table 3. Weights of paired factors concerning allocation to agriculture.
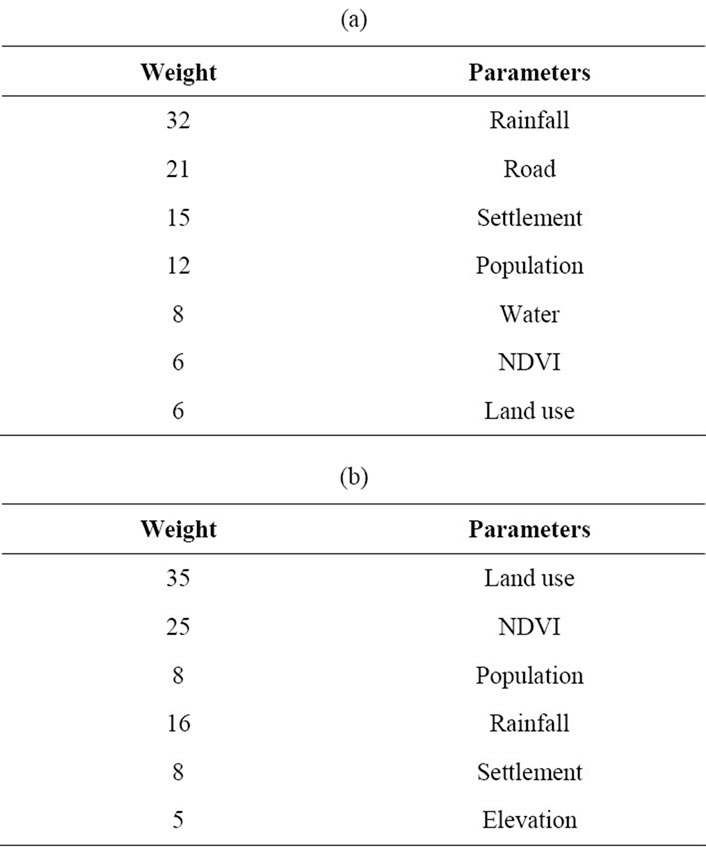
Table 4. (a) Weight of parameters that influence allocation of land to agriculture; (b) Weight of parameters influencing land allocation to forest development.
rainfall followed by roads with 21 percentages and least was land use which was given only 6 percentages influence as well as NDVI.
The result of the consistency analysis performed using the normalized matrix and the factor weights indicate that the Consistency Index (CI) for paired factors concerning allocation to forest land and agriculture were 0.006 (0.6%) and Consistency Ratio (CR) were 0.004 and 0.07 respectively, which were all smaller than 10% threshold proposed by Saaty (1980) [9]. The inconsistency made in the judgment was therefore acceptable.
3.2. Suitability of Land Parcels for Allocation to Agriculture and Forestry
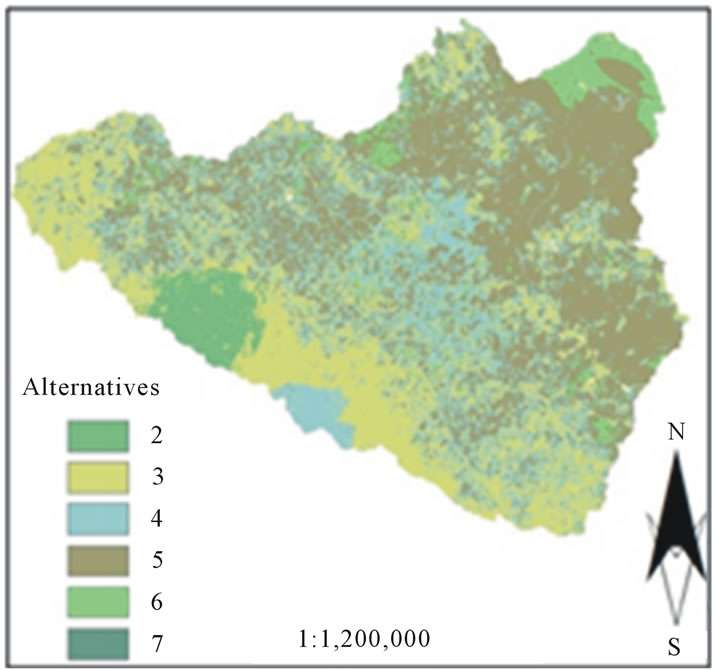
Figures 3(a) and (b) shows the suitability maps generated as a result of the WLC operations. Six alternatives spatially clustered land parcels were suitable for allocation to forest expansion (Figure 3(a)) while seven alternatives clustered land parcels were suitable for allocation to agriculture. The percentage coverage of each alternative parcels of land is given in Table 5. For example the first alternative which is the highly preferred sites for future allocation to forest has a total coverage of 7.8% of the total basin area.
And the most preferred alternatives for future agriculture cover an area of 0.4% of the total basin area (Table
 (a)
(a)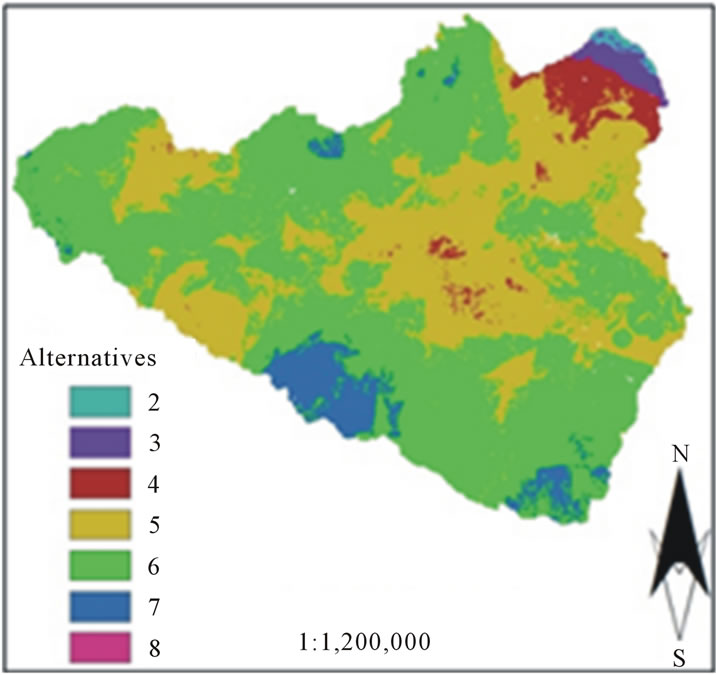 (b)
(b)
Figure 3. (a) Land suitability maps for afforestation; (b) Land suitability maps for agricultural expansion.
5). The seventh alternative for agricultural expansion and the sixth alternative for afforestation indicated insignificant coverage and were therefore ignored. Meanwhile the third alternative and sixth alternative for agricultural expansion were identical both in extent and in space and were merged together. In general, five alternatives both for agriculture and forest were considered during the final land use scenarios generation.
3.3. Final Land Use Scenarios
Using Equations (6a) and (6b) ten treatments resulting into ten land use scenarios were obtained. Out of the ten
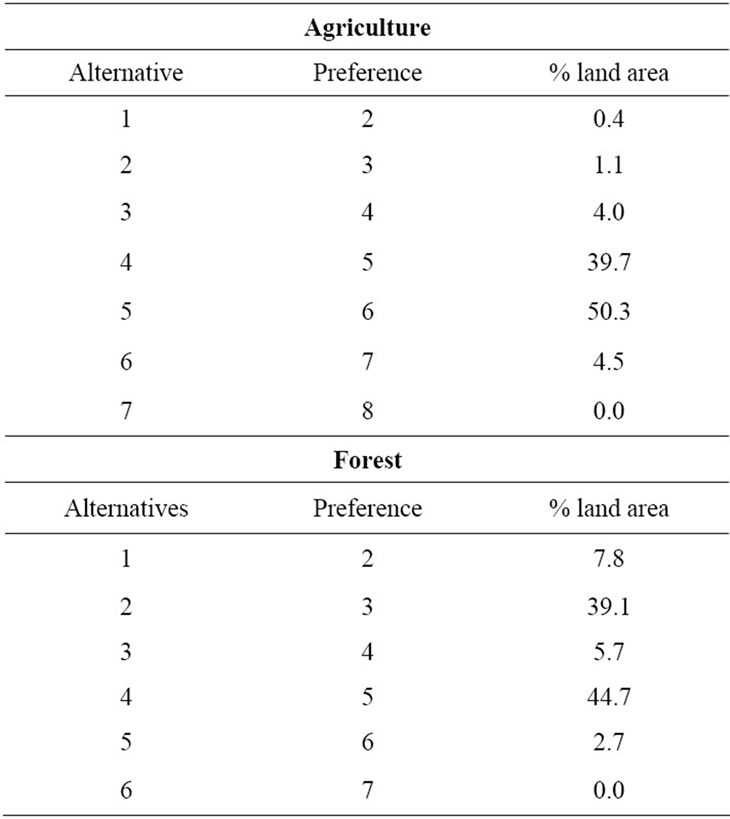
Table 5. Land use experiments: areas allocated to each alternative and the allocation preference.
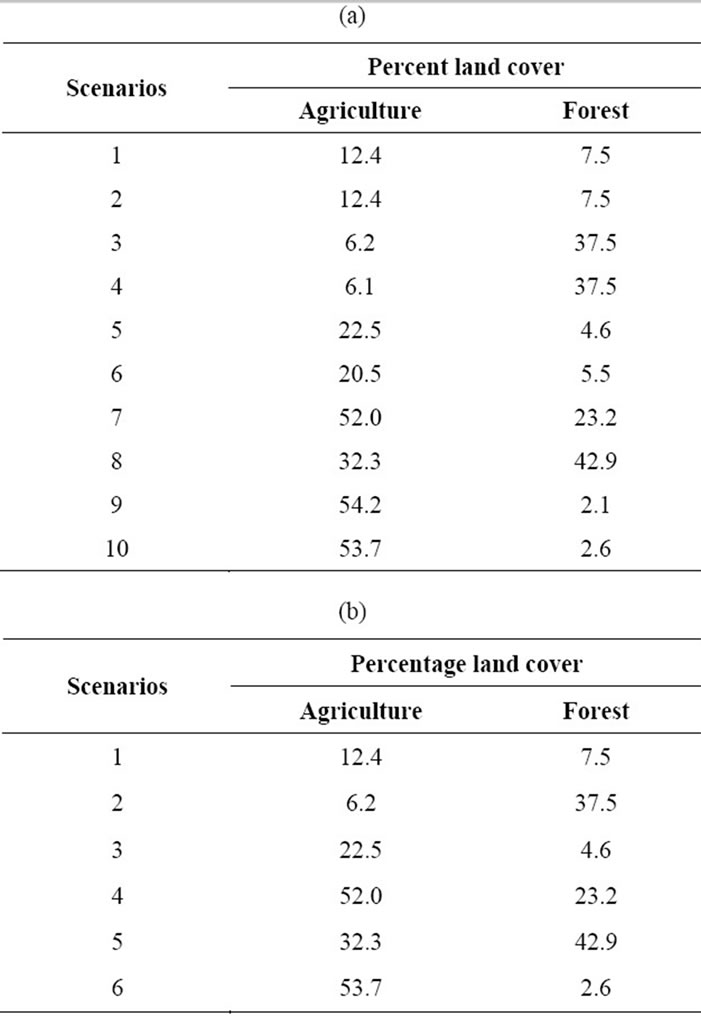
Table 6. (a) Extent of land cover change generated using equations (6a) & (6b); (b) Land use scenarios coverage.
 (a)
(a)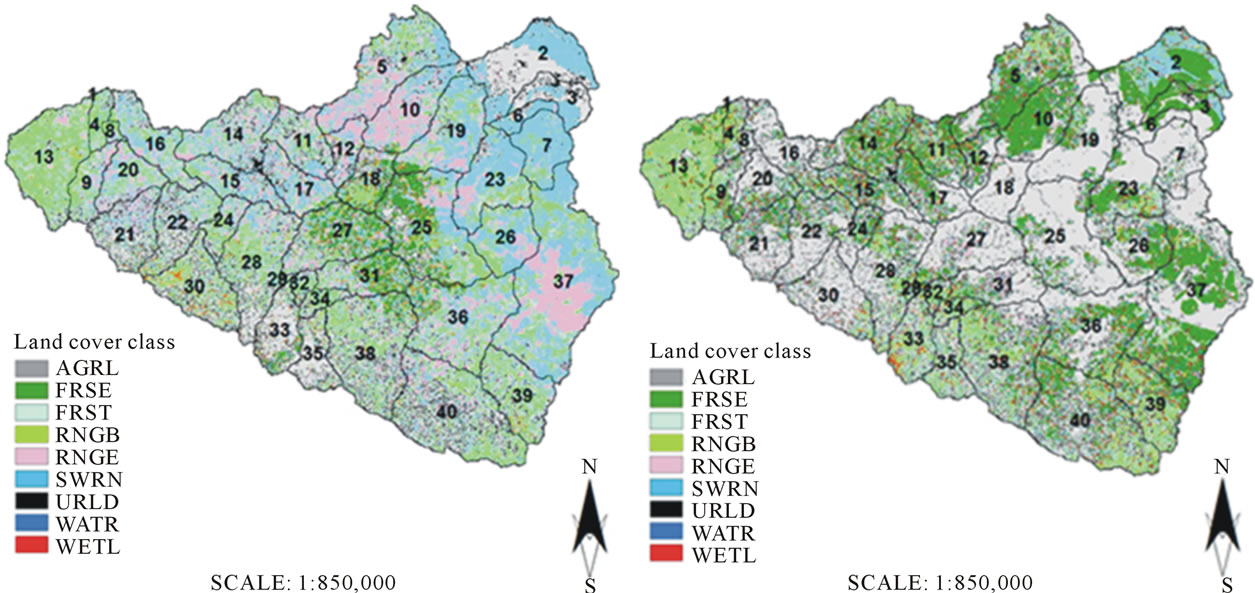 (b)
(b)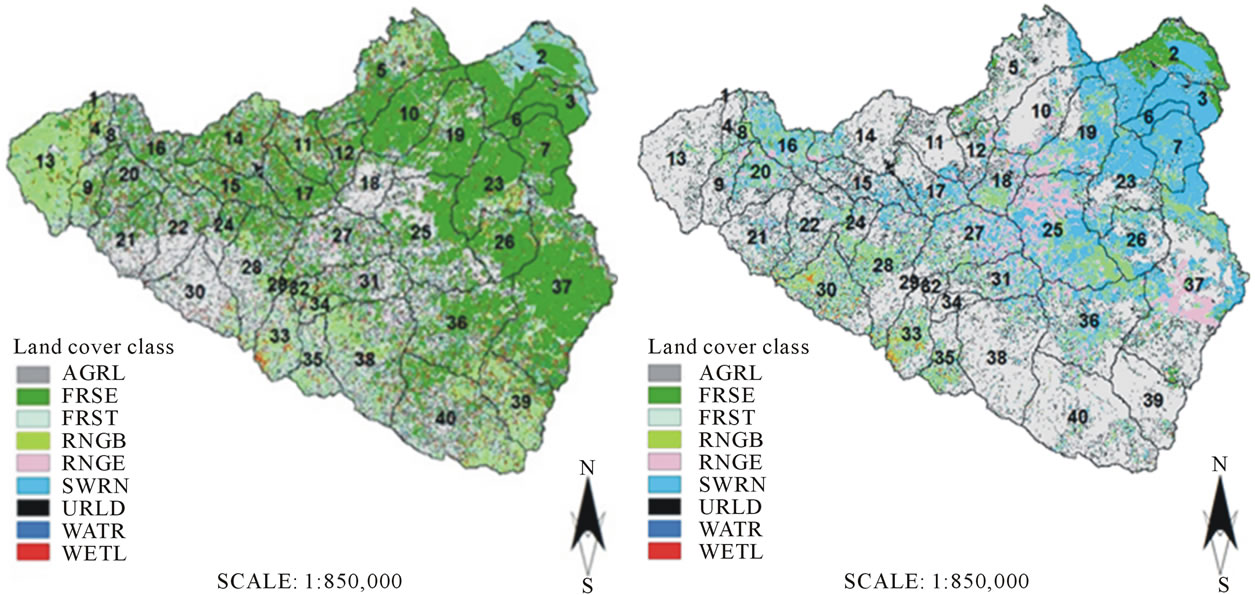 (c)
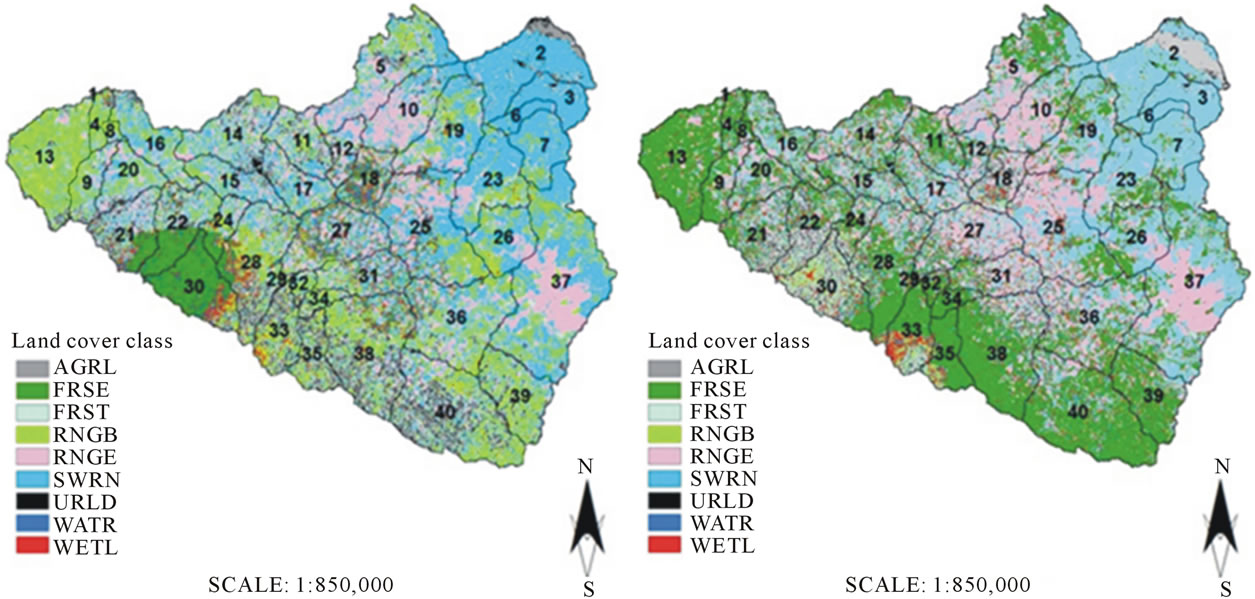
(c)
Figure 4. (a) Land use scenario I; (b) Land use scenario II; (c) Land use scenario III; (d) Land use scenario IV; (e) Land use scenario V; (f) Land use scenario VI.

Table 7. Key to land use categories.
scenarios, eight scenarios were paired. The paired scenarios were identical both spatially and in coverage. Only two scenarios were unique. The identical paired scenarios were reduced to four (table 6(a)). In total six unique scenarios were finally generated (Figures 4(a)-(f)). The key to land cover categories is presented in Table 7.
4. Conclusion
The land use scenarios developed were meant to reflect the afforestation incentives and the agricultural land use expansion in the near future. The scenarios were however time independent and did not consider “when” in the future the land use pattern may develop. This in particular is one of the weaknesses in the GIS-Multi-criteria approach, which however does not affect simulation of spatial land use scenarios, relevant in testing the spatial land use polices for future land use planning with the objective of optimizing environmental benefits. In general, the land use scenarios modeling using GIS based multi-criteria analysis showed high potential for use in land use planning.
REFERENCES
- A.Veldkamp and L. O. Fresco, “CLUE-CR: An Integrated Multi-Scale Model to Simulate Land Use Change Scenarios in Costa Rica,” Ecological Modelling, Vol. 91, No. 1-3, 1996, pp. 231-248. doi:10.1016/0304-3800(95)00158-1
- P. H. Verburg, G. De Koning, K. Kok, A. Veldkamp and J. Bouma, “A Spatial Explicit Allocation Procedure for Modelling the Pattern of Land Use Change Based upon Actual Land Use,” Ecological Modelling, Vol. 116, No. 1, 1999, pp. 45-61.
- P. H. Verburg, W. Soepboer, A. Veldkamp, R. Limpiada and V. Espaldon, “Modeling the Spatial Dynamics of Regional Land Use: The CLUE-S Model,” Environmental Management, Vol. 30, No. 3, 2002, pp. 391-405. doi:10.1007/s00267-002-2630-x
- B. S. Soares-Filho, G. C. Cerqueira and C. L. Pennachin, “DINAMICA—A Stochastic Cellular Automata Model Designed to Simulate the Landscape Dynamics in an Amazonian Colonization Frontier,” Ecological Modelling, Vol. No. 154, 3, pp. 217-235.
- J. R. Eastman, P. A. Kyem, J. Toledano and W. Jin, “GIS and Decision Making,” United Nations Institute for Training and Research, Geneva, 1993.
- W. Xiang and D. L. Whitley, “Weighting Land Suitability Factors by the PLUS Method,” Environment and Planning B: Planning and Design, Vol. 21, No. 3, 1994, pp. 273-304. doi:10.1068/b210273
- H. Jiang and J. R. Eastman, “Application of Fuzzy Measures in Multi-Criteria Evaluation in GIS,” International Journal of Geographical Information Science, Vol. 14, No. 2, 2000, pp. 173-184.
- R. L. Keeney and H. Raiffa, “Decision with Multiple Objectives: Preferences and Value Tradeoffs,” John Wiley & Sons, New York, 1976.
- T. L. Saaty, “The Analytical Hierarchy Process,” McGrawHill, New York, 1980.
- V. Chankong and Y. Y. Haimes, “Multiobjective Decision Making: Theory and Methodology,” Elsevier-North Holland, New York, 1983.