Journal of Geographic Information System
Vol.4 No.2(2012), Article ID:18764,11 pages DOI:10.4236/jgis.2012.42016
Using of GIS Spatial Analyses to Study the Selected Location for Dam Reservoir on Wadi Al-Jirnaf, West of Shirqat Area, Iraq
Natural Resources Research Center, University of Tikrit, Tikrit, Iraq
Email: sabbar_salih@yahoo.com
Received October 19, 2011; revised December 18, 2011; accepted January 13, 2012
Keywords: GIS; Spatial Analysis; Geometry; Dam Reservoir; Iraq
ABSTRACT
The GIS data of digital elevation model, topographic maps of different scales, satellite images and GPS were used to analyze the geometrical relations, bathometric properties and shape form of selected depressions on Al-Jirnaf valley. GIS was used to analyze the hydromorphometry and geometry of the depressions, these analyses explain the role of main valley’s contribution to the hydrology of the valley, then, three locations for water storage were suggested. 2D and 3D models of the sites were given, the maximum level, volume, surface area, circumference, shape factor of three supposed reservoirs calculated for different hypothetical levels of water in the reservoir, and the optimal level were determined, the maximum suggested levels are 190, 185 and 180 m, the areas are 3.25, 7.97 and 20.47 km2, the volumes are 0.0096, 0.0334 and 0.1118 km3 for the three locations respectively. This experimental procedure can be repeated in other depressions for the same purpose.
1. Introduction
The studied area extends northwest of Shirqat, from Miran Village (northwest) to Horiyah Village (southeast), and spill in Tigris River in the south border of this village, the basin of the valley is covered about 579 km2 (Figure 1).
The valley flooded by the water of small tributaries of dendritic pattern from northern and eastern areas, the length of main valley is about 36.4 km, the elevation of bottom of upstream valley is about 250 m asl, but decreased to 155 m asl in the suggested locations of the dam (Figure 1).
Geomorphologically, the area under study situated at the transition area between the southwest part of the foot hill zone and unfolded zone on the physiographical classifications of Iraq [1].
The annual rainfall in the area about 230 mm, thus the main percent of rainfall in the area during the wet season from December to March. The basin of the valley located in the transition area between arid-semi arid zone, it is characterized by high evaporation, especially during the hot summer, and thus the location of the suggested reservoir must be deep depression with low surface area to decrease the area of evaporation.
There are no detail previous studies about the area, but there are few studies about the water harvesting from the seasonal valleys in different areas in Iraq such as the studies of Thathar Valley. The results of these studies encourage this study.
Iraq has a hard water deficit, especially during the dry seasons, because of the non-homogeneous distribution of water resources. The water shortage led to decrease the agricultural and grazing areas.
The subject of water management has great importance in Iraq especially in the regions that have low water resources. From this point of view, it is well known in a lot of countries to build small dams on the seasonal valleys for better management of water that to be used of agriculture and irrigation purposes.
The advantages of this project in the future are to increase the population density in area and decrease the migration. Also, to increase the area of agriculture and pastures.
The present study aimed to:
• Investigate the morphometric parameters and drainage pattern of the valley watershed, which explain the main subasins which control the gathering of water to the main valleys, these parameters must be taken in consideration in the selection of dams and reservoirs locations.
• Determine the own watershed for every selected location of the dam.
• Determine the maximum level for every reservoir.

Figure 1. The studied area.
• Evaluation of geometrical parameters, such as volume, surface area, depth and shape of every topographic depression which is suggested as reservoir, using the geographic information system to select the optimal location.
2. Materials and Methods
Digital elevation data, topographic maps of scale 1:125000, satellite image which cover the area of study used to derive the morphometric and geometric parameters.
The boundaries of the watershed derived from the digital elevation data by software Global Mapper V-10.00, the software ArcGIS V-9.2 used to derive the layers of different orders of valleys from the topographic maps. According to the results of morphometric analyses, three locations were selected as suggested water reservoir.
The path profiles were done by Global Mapper in the three selected locations, also the watersheds of the selected reservoirs were derived. The digital elevation data exported from Global Mapper as a SURFER grids to draw the 3D models and to extract the data of geometric analyses for the suggested locations. The watershed and location of water body were projected on the watershed area of the valley.
The levels, surface areas, volume of reservoirs, determined for every suggested location using SURFER software.
3. Results and Discussions
The valleys of the orders 1 - 6 derived from the source maps using ArcGIS, the orders 1st, 2nd, 3rd reflect an idea about the drainage pattern, but not reflect an impression about the main subasins in the area (Figures 2-4), the valleys of 4th order give a clear idea about the subasins and integrate the illustration of drainage pattern (Figure 5).
The behavior of 5th and 6th order support the ideas of selection of the optimum locations for water storage, and the division of the total watershed as sub-divisions as watersheds for suggested locations (Figures 6 and 7).
The geomorphologic 3D model (Figure 8), reveal to the gentle gradient of the valleys on the southwestern side more than the northeastern, this phenomenon may be reflect the effect of the geological structures of the area, the behavior of valleys in the middle of western side of main channel reflect faults phenomena.
The studies of basins have a hydrological indicators, such as drainage properties, hydrology of streams and sedimentation [2]. Morphometric analyses used to study the properties of the basin. The basic of this technique suggested by [3] and developed by [4]. The morphometric properties of the basins related directly with physiographic and structural factors, especially the geological structures, climate, plant cover and any another changes [5].
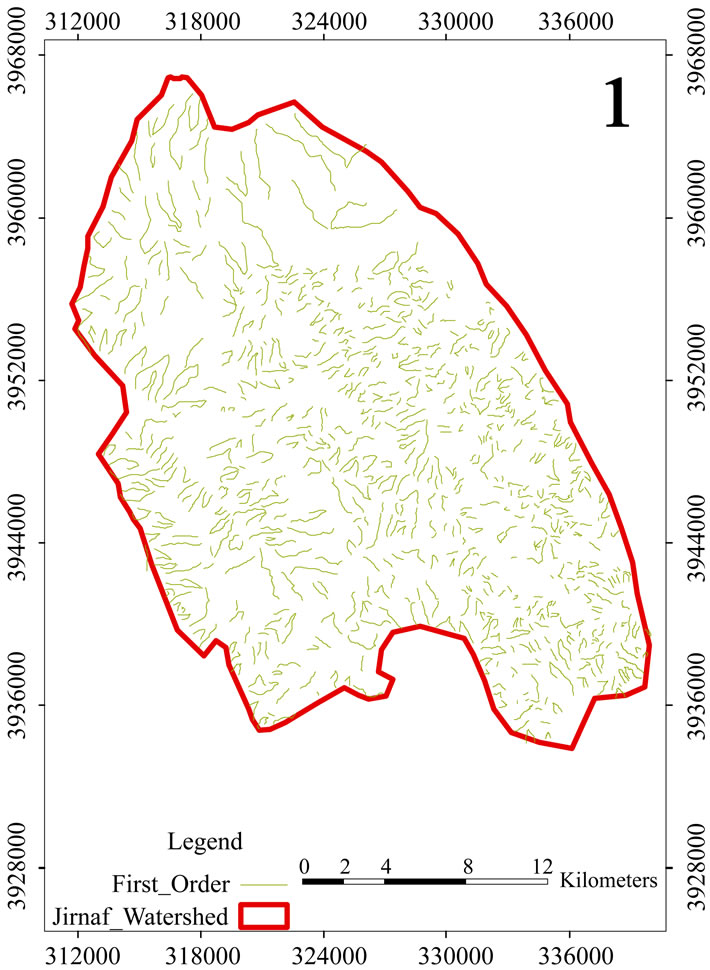
Figure 2. The valleys of 1st order in the studied watershed.
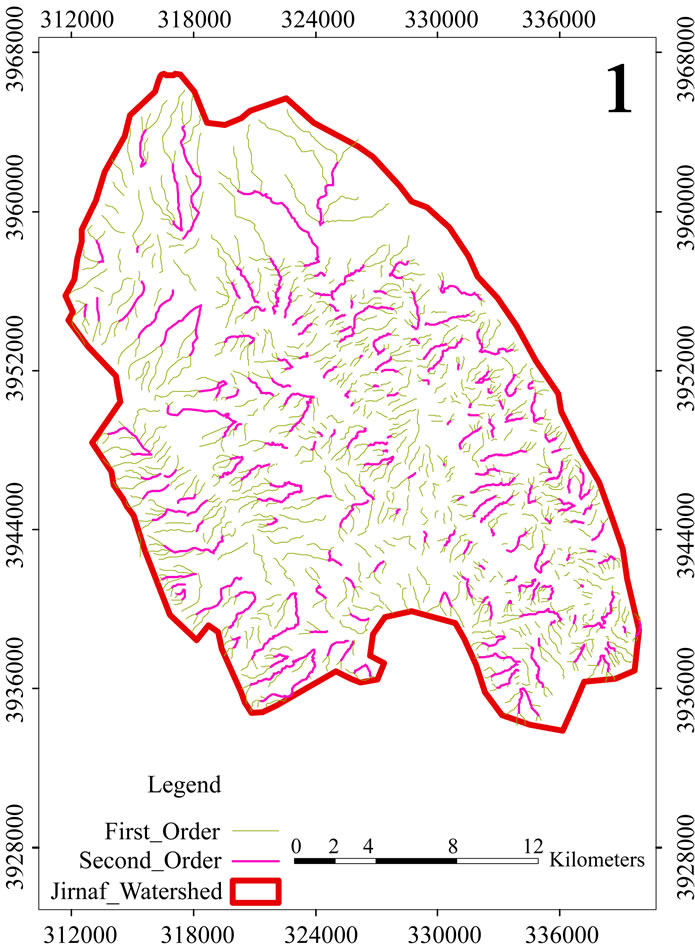
Figure 3. The valleys of 2nd order in the studied watershed.
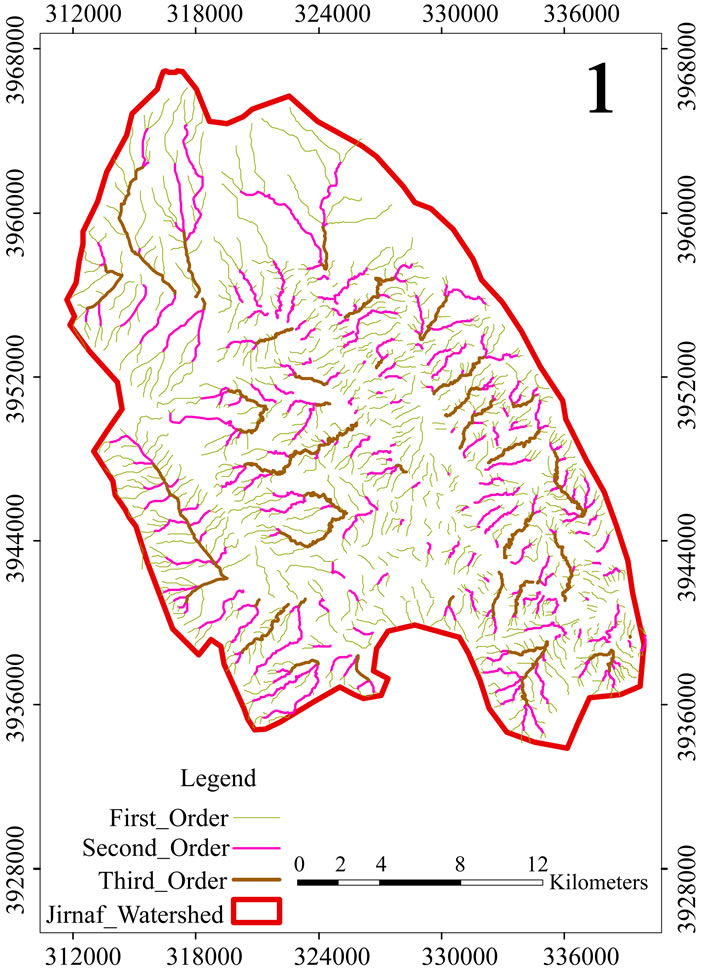
Figure 4. The valleys of 3rd order in the studied watershed.

Figure 5. The valleys of 4th order in the studied watershed.
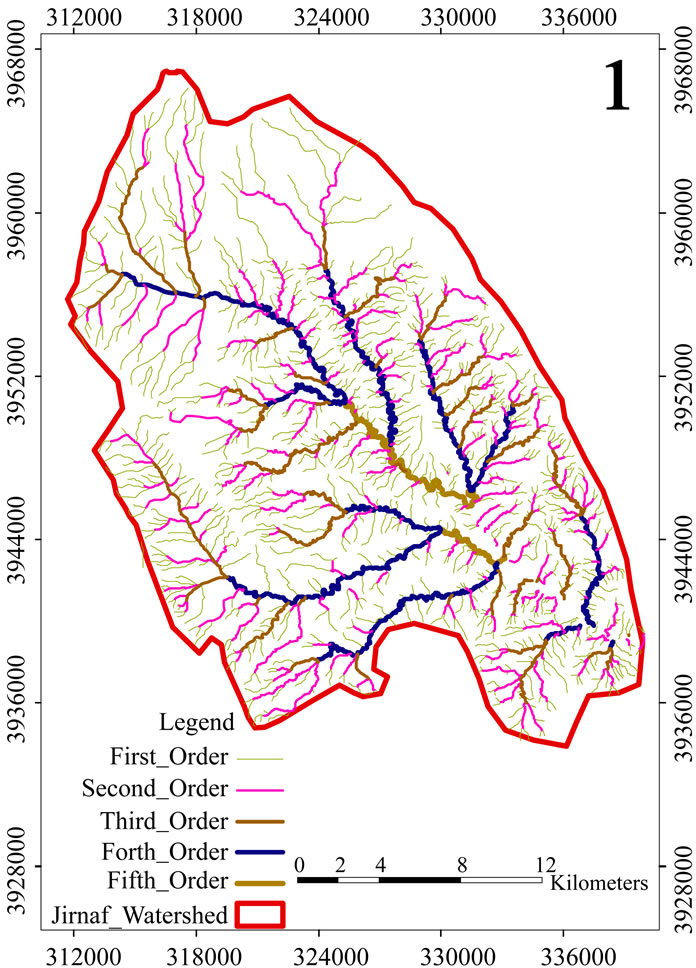
Figure 6. The valleys of 5th order in the studied watershed.
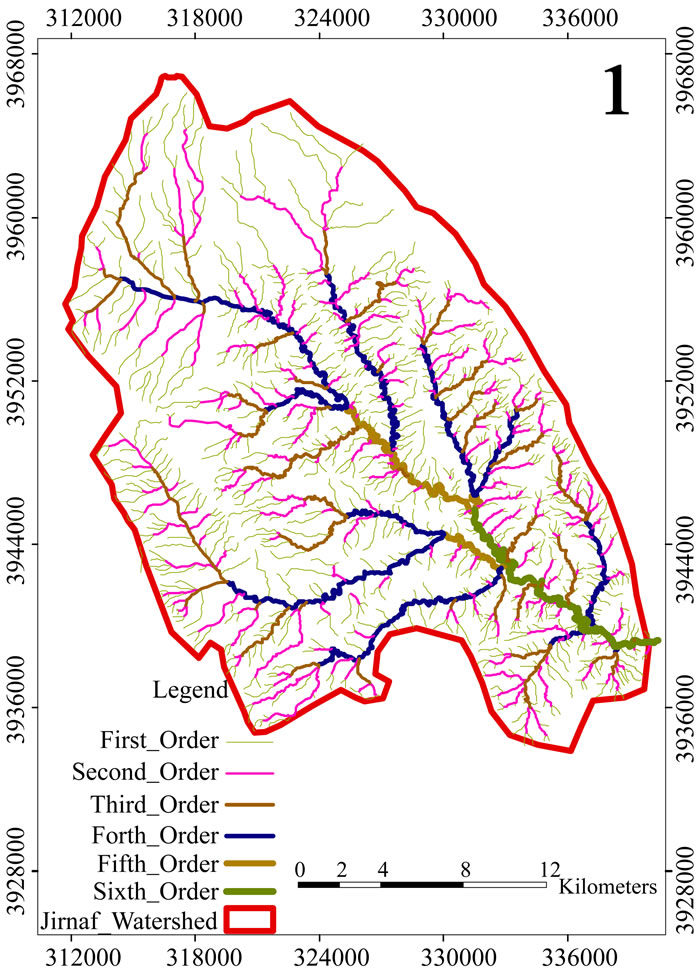
Figure 7. The valleys of 6th order in the studied watershed.
 (a)
(a) (b)
(b)
Figure 8. Three dimentional models of the studied valley basin ((a) front view and (b) side view).
The topographic maps of scales (1:100000, 1:50000, and 1:25000) used to draw the drainage system of the basin (Figure 7). The number and length of stream orders were determined (Table 1), the circumference, area and length of the basins were measured and used for the mophometric analyses (Table 2).
The drainage basin represent the basic unit for the morphometric analyses because the area, circumference, length and width of drainage basin can be measured [6], therefore, the morphometric analyses used to predict the relation between the geomorphologic properties and the characters of the stream.

Table 1. Stream orders and bifurcation factors of Wadi-AlJirnaf basin.

Table 2. Morphometric properties of Wadi-AlJirnaf basin.
3.1. Shape and Area Properties
These properties are very important to get the quantum relations which used to determine the shape and hydrogeology of the basin. The determination of the area of the basin is very important because its effect on the volume of the discharge. The main shape properties of the basin is:
3.1.1. Area Consistency Ratio (ACR)
It means the convergence of the shape of the basin to the shape circle, this ratio calculated from the relation below [7]:
ACR = Ab/a, When: ACR = Area consistency ratio;
Ab = area of the basin (km2);
a = area of circle which have the same circumference of the basin.
The value of ACR less than or equal to (1) [8]. The area of the basin determine by personal geodatabase of ArcGIS.
Then the area consistency ratio of the studied valley equal to: ACR = 579.5/950.91 = 0.61 If the value of a ACR approach to (1) that reveals to the convergence of the shape of basin to the circle which characterized by high discharge. While the decreasing of the ratio reveal an elongated shape of the basin which cause the elongation of the stream and the delay of flooding wave. The medium area consistency ratio of the studied case (0.61) indicates the ellipsoid to elongated shape of the basin, that lead to the medium to high flooding velocity with high discharge and high sediment transport, this parameter one of the controlling factors on the design of the suggested dam.
3.1.2. Circumference Consistency Ratio (CCR)
This ratio calculated from the relation below [9]:
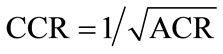 , When: CCR = circumference consistency ratio, ACR = Area consistency ratiol.

When highest ACR then lowest CCR, the value of this ratio always more than (1).
The increasing of this value reveals to divergence of the shape of basin from the circle to ellipsoid. The value of CCR (1.28) confirms the above conclusion about the medium flooding velocity, which one of the controlling factors on the design of the suggested dam.
3.1.3. Basin Form Factors (BFF)
It reflects the convergence and divergence of the shape of the basin from the triangle shape, the increasing of this value reveal to convergence to the triangle shape, it is very important to determine the velocity of flooding wave and the annual flow system [2]. In addition, it is determined the ratio between average width to longer axial length for the basin described as the distance between the basin outlet to distal point of the basin, while the width of the basin determined by the division of the basin area on the axial length. The value of this factor ranged between (0 - 1) the increasing of value reveal triangular shape of high discharge. BFF determined from the relation below [9].
BFF = Ab/L2 When, BFF = Basin Form Factor, Ab = area of the basin (km2), L = Actual basin length (km), BFF = 579.5/(36.4)2 = 0.44 The basin form affect the volume of discharge and flow velocity which cause the increasing of sedimentation in the circular basin with respect to elongated basin.
The low value of BFF (0.44) indicates the decreasing of sedimentation in the bottom valley which reveal to low trap efficiency, also, indicate the water losing by evaporation and infiltration.
3.1.4. Consolidation Factor (CF)
The factor indicate the symmetry between the circumference and the total area of the basin, the high value of the factor reveal to the increase of meandering.
CF = ((length of circumference)2/(area of the basin) × 4 × (3.14) = 258.9.
The low value of the parameter indicate to low meandering of the valley tributaries.
3.2. Relief Factors
3.2.1. Relief Ratio (RR)
It represents the diversity between highest (HL) and lowest (LL) point of the basin (m)/circumference (km).
RR = 110/109.3 = 1.01 m/km.
The ratio reflects medium value of RR which refers to medium surface gradient of the area.
3.2.2. Roughness Factor (RF)
It represents the relation between the Longitudinal Drainage Density and the total length of valleys.
RF = (LDD) km/km2 × (HL-LL)/Circumstance of the basin = (2.06 × 110)/109.3 = 2.07 m/km2.
The factor reflects medium value of RF which refers to medium roughness of the area.
3.3. Discharge Properties and Morphometric Analyses
Morphometric studies determine the factors which affect the velocity and discharge and its ability to sediments transport.
The morphometric analyses which explained in (Figure 7) used to study the effect of morphometry on the discharge properties as that follows:
3.3.1. Stream Orders
The determination of stream order of the basins is very important to study the amount of water discharge of all valley [10]. The stream order of the basins reflect the ability of erosion and sedimentation to avoid the effect of erosion on the land, as well as the effect of flooding.
There are many of methods to determine the stream orders as in [3,4], but the most common and simple method is strahler one [9] (Al-Nakkash, and Al-Sahhaf, 1989). In this method the first order represented by the valley which haven’t branches, when two branches connected together to form second order valley, the stream orders of the area were determined by this method, the maximum stream order is 6th order, and the number of valleys in every order was listed in (Table 1). The ArcGIS-9 software used to measure the length of valleys in every order. These lengths listed in (Table 1).
3.3.2. Bifurication Ratio
It is the ratio between the number of the branches in any stream order to the number of branches of the next order, the ratio calculated depends on the equation below:
BR = Nn/Nn+1, When, BR = Bifurcation ratio, Nn = the number of branches in any stream order, Nn+1 = the number of branches in the next stream order.
The minimum theoretical value of this ratio is (2), it is always ranged between (3 - 5), [3] (Horton, 1945), it reflects of the climatological, geological, and morphological conditions of the area, it is one of important factors that control the discharge, [11]. The bifurcation ratio of the studied area tabled in Table 1, this ratio equal to 4, 4.5, 3.9, 3.25 and 4 for the 1st, 2nd, 3rd, 4th and 5th orders respectively. The high ratios reflect that the valleys of these orders are located in the zone of weathering. The zone of sedimentation located out of the area of study to the direction of downstream.
3.3.3. Drainage Density
The drainage density is very important factor related with the geomorphology and hydrology, it reflects the flow method of surface water which effected by geology, gradient, plant cover, quantity and intensity of precipitation [8]. This factor represents indirect indicator to the length of valleys, it is ranged between (600 m)/km2 for the basins of low discharge to more than (3 km)/km2 for the basins of high discharge [12].
In the case of high drainage density, the drainage peak is high, and vice versa [13]. The area of low drainage density characterized by rough texture, while the area of high drainage density have a soft texture as a result of low resistance of soil material against the erosion or the hidden of plant cover. [14], there are two types of drainage density [9]:
3.3.3.1. Longtudinal Drainage Density (LDD)
It is the ratio between the summation of the valleys lengths in the basin (SL) to the area of the basin (Ab), LDD = SL/Ab = 1197.2/579.5 = 2.06.
3.3.3.2. Numerical Drainage Density (Stream Frequency) (NDD)
It is the ratio between the number of the valleys in the basin (SN) to the area of the basin (Ab).
LDD = SN/Ab = 1219/579.5 = 2.1.
The number of valleys in every stream order and the length of these valleys are tabled in Table 1. The value of the two types of drainage density reveal to high drainage of the basin.
3.3.4. Reflecting Facctor (RF)
It is an important factor to determine the meandering that has negative effect up on the flow in the stream [9]: RF = L/Ol = 36.4/34 = 1.07, where Rf = Reflecting factor, L = the actual basin length of the valley (Km), Ol = the optimum basin length of the valley (km)
The reflection of the stream graded from the straitening to the reflecting where the sedimentation occurs in one of the stream sides and the erosion occurs in the other side, depending on the changes in discharge and sediment transport that effected by the geology, topography, plant cover, soil properties, and land use [15]. The maximum axial straight length (optimum) and maximum axial actual length in the valley listed in (Table 1) and the reflecting factor of the area is 1.07, this high value interpreted by the high reflection of the valleys of 4th orders in the connection points with the valley of 5th order. The high reflection in this valley may be interpret by the effect of structural effects such as the existence of fault.
3.3.5. Drainage Patterns
Drainage pattern means the shape or form of the drainage channels on the earth surface, it is a reflection of geological structures, rock hardness, earth movements, geological history and geomorphology of the basin [16]. The patterns differ from area to another depending on the gradient, the existence of joints and cracks, depending on the variety of properties of these factors, the drainage channels develop the drainage system [5], the drainage pattern traced from the topographic map of scales (1/100,000, 1:50,000 and 1:25,000) (Figure 7) [17].
Two types of drainage pattern were recognized in the studied basin:
3.3.5.1. Dendritic Pattern This pattern occurs in the areas of homogeneous hardness, it is characterized by non systematic branches. It also appear in flat areas because the variety of rock hardness is very low and not affect the drainage directions.
The branching density of valleys vary in this type of pattern depending on precipitation, it increase with the increasing of precipitation, and vice versa [18].
This type of pattern characterized by the quickness of water flow. The pattern texture mean the number of branches and the distance between them in the basin, the texture named soft texture when the distance between the channels less than 100 m, medium texture when the distance ranged between 100 m - 1000 m, and named rough texture if the distance more than 1000 m [19]. The drainage map (Figure 7) clarify that the dendritic drainage pattern clearly appear in the studied area.
3.3.5.2. Parallel Pattern This pattern occurs in the areas of high gradient, and when the existence of structural barriers. The distance between the parallel valleys controlled by structures and the topography of the area.
3.4. Geometry of Suggested Reservoir
According to the results of morphometric analyses of the valley watershed, three sections were selected as locations for suggested dams on the necks of major valleysand the maximum levels, horizontal extensions of every section were plotted in (Figures 9-11), the longitudinal section in (Figure 12) reflect the gentle and stable gradient of the valley.
The watershed of every suggested location derived from the digital elevation data by Global Mapper and exported to SURFER v-8, the derived data processed and projected on the area of total watershed of Jirnaf valley to explain the location of own watershed for every location as in (Figure 13).
The digital elevation data of dam reservoir for each suggested location derived by Global Mapper DEM and exported to SURFER, the derived data processed and projected on the area of total watershed of Jirnaf valley to explain the location of own reservoir for every suggested location as in (Figure 14).
The watershed of every suggested location derived from the digital elevation data by Global Mapper and exported to SURFER v-8, the derived data processed and projected on the area of total watershed of Jirnaf valley to explain the location of own watershed locations as in (Figure 13).
The digital elevation data of reservoir for each suggested location derived by Global Mapper DEM and exported to SURFER, the derived data processed and projected on the area of watershed of Jirnaf valley to explain the location of own reservoir for suggested locations (Figure 14).
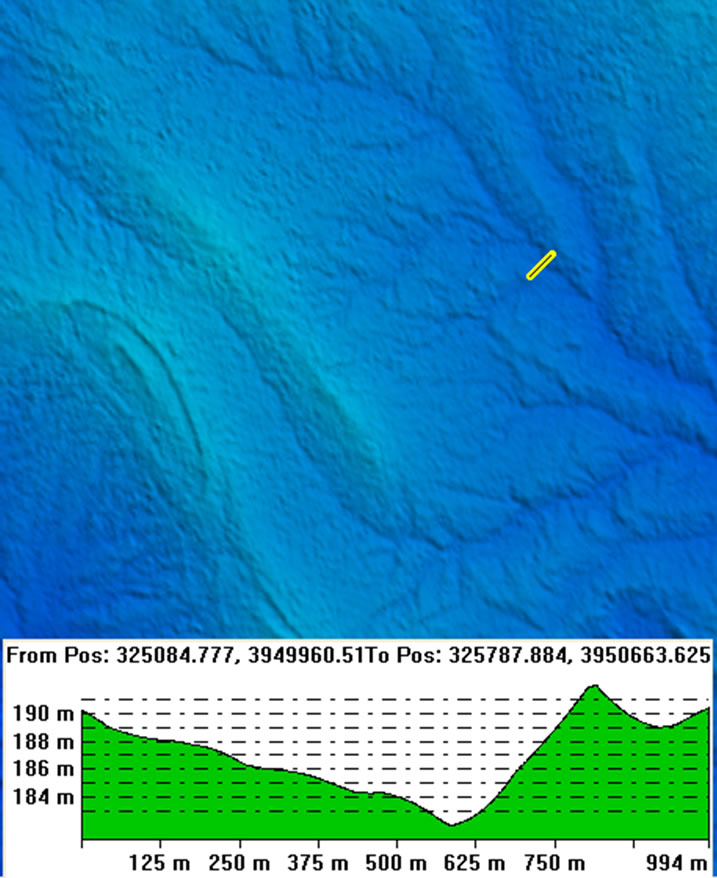
Figure 9. The 1st selected locations of suggested dam on the necks of major valleys, and the section of selected location.
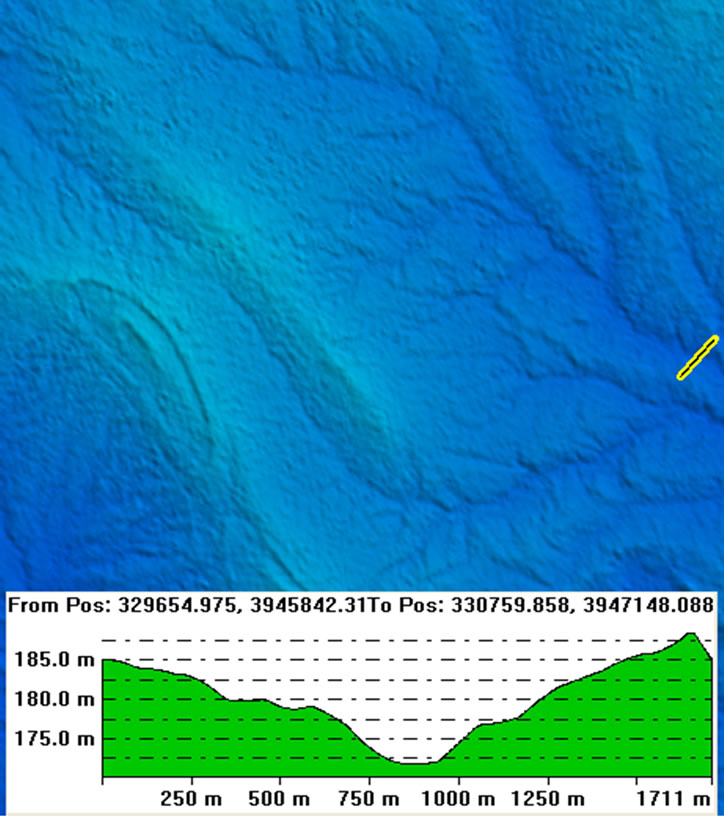
Figure 10. The 2nd selected locations of dam on the necks of major valleys, and the section of selected location.
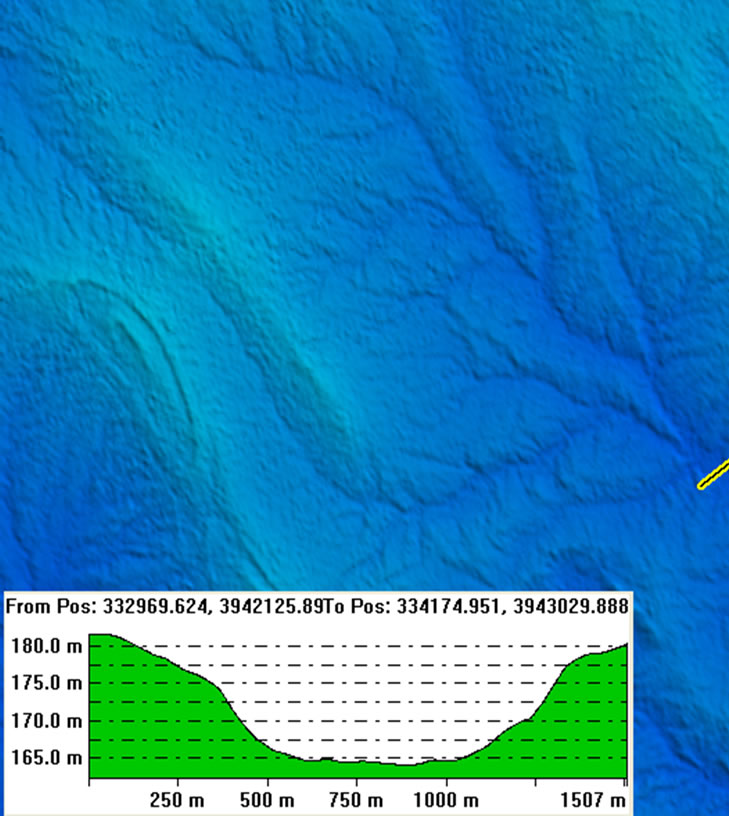
Figure 11. The 3rd selected locations of suggested dam on the necks of major valleys, and the section of selected location.
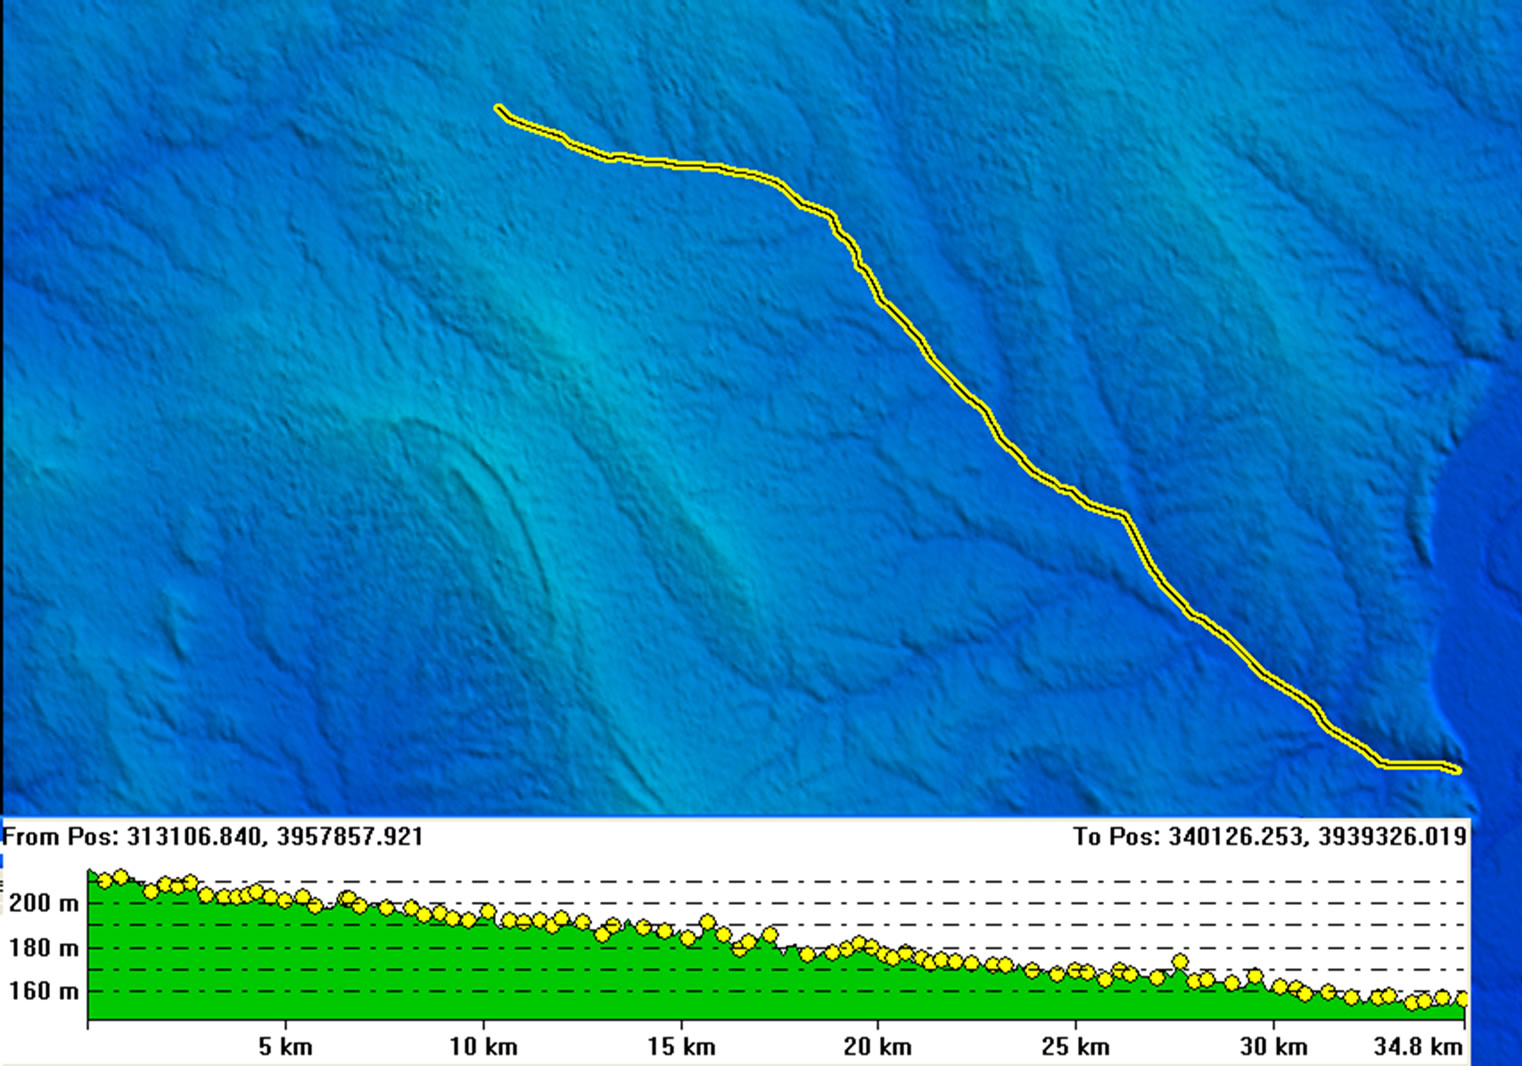
Figure 12. The longitudinal section of the Al-Jirnaf valley, it reflects the gentle and stable gradient along the section.
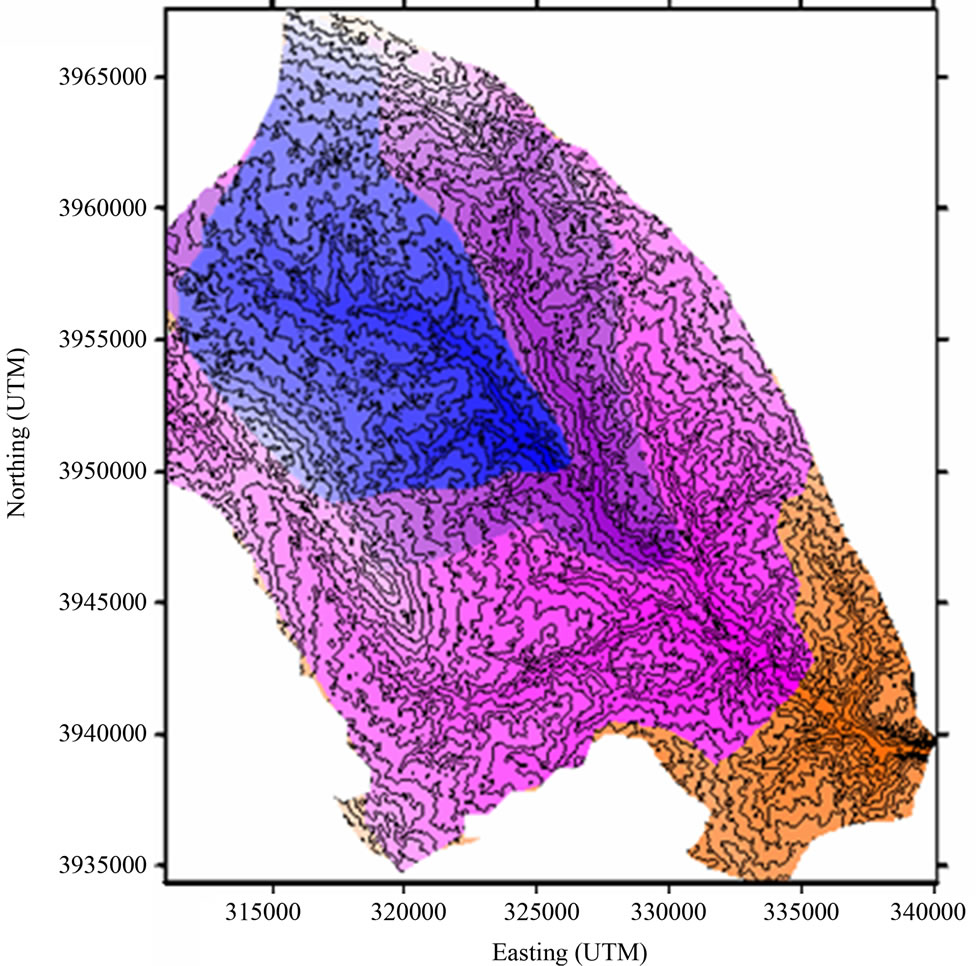
Figure 13. The watershed of the suggested locations, blue represent the watershed of 1st location, (blue + violet) for the 2nd and (blue + violet + rose) for the 3rd location, (blue + violet + rose + orange) represent the total watershed of the valley.
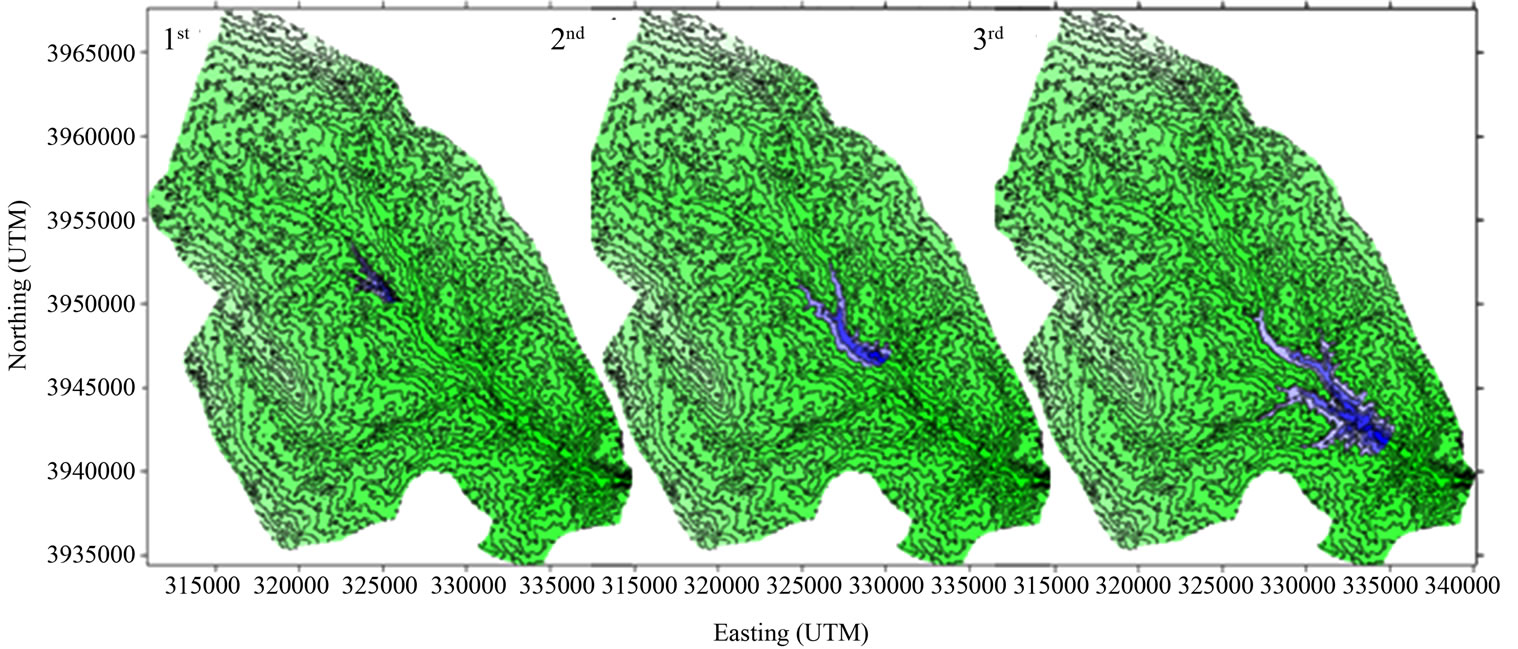
Figure 14. The locations of suggested reservoirs within the total watershed of valley.

Table 3. The geometrical parameters of suggested reservoirs.
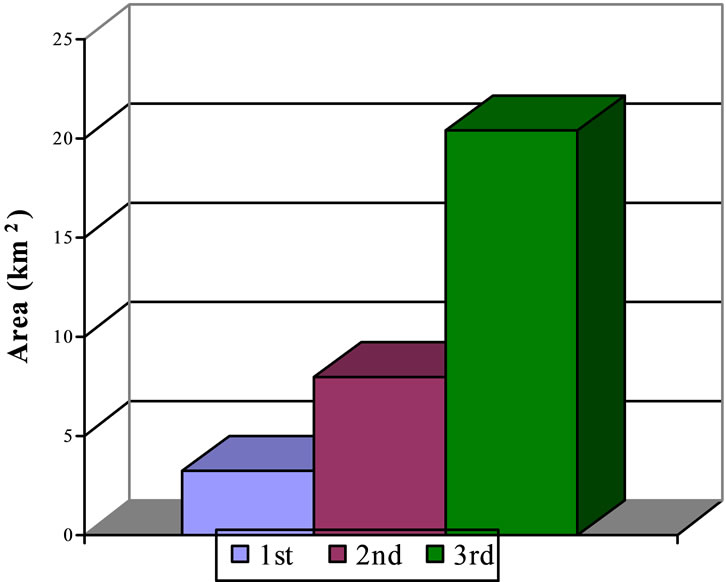
Figure 15. The variation of surface area of three suggested reservoirs.

Figure 16. The variation of volume of three suggested reservoirs.
The hypothetical geometrical parameters of suggested reservoirs represented by maximum water levels, surface area and volume, were derived by the option of volumetric data in SURFER V-8 (Table 3 and Figures 15 and 16), the acquired data can be used by the decision makers and designers to chose the optimum location after achievement the addition studies of engineering and structural geology, economical and environmental evaluations, and the ownership of the acres in the areas.
4. Conclusions
1) According to morphometric analyses, three suitable locations were selected for water reserve in the valley.
2) The own watershed for every location were derived and projected on the total watershed of the valley.
3) The own water reservoir for every location were derived and projected on the watershed of the valley.
4) The hypothetical maximum water levels, surface area and volume, were derived for suggested reservoirs.
5) The acquired data can be used by the decision makers and designers to chose the optimum location.
REFERENCES
- T. Buday and S. Z. Jassim, “The Regional Geology of Iraq. Vol. 2: Tectonism, Magmatism and Metamorphism,” Publication of the Geological Survey of Iraq, Baghdad, 1987.
- M. M. A. Al-Sahhaf and K. M. Al-Hassan, “Hydromopho- metry of Al-Khawsar Basin, Study of Applied Geomorphology,” Journal of Iraqi Geography Society, Al-Ani Press, Baghdad, 1990.
- R. E. Horton, “Erosional, Development of Streams and Their Drainage Basins, Hydrophysical Approach to Morphology,” Geological Society of American Bulletin, Vol. 56, No. 3, 1945, pp. 275-370. doi:10.1130/0016-7606(1945)56[275:EDOSAT]2.0.CO;2
- A. N. Strahler, “Quantitative Analyses of Watershed Geomorphology,” Transactions on American Geophysical Union, Vol. 38, No. 6, 1954, pp. 912-920.
- H. R. Sallama, “Geomorphological Analyses of Morphometric Properties of Water Basins in Jordan,” Dirasat Journal, Vol. 7, No. 1, 1980, pp. 97-132.
- P. Macula, “Modern Idea in Geomorphology,” 6th Edition, University of Baghdad, Baghdad, 1986.
- M. F. Al-Moula, “Morphometric Study for Specifying Location of Dam in Wadi Al-Tharthar Basin North of Hatra Using Remote Sensing Techniques,” M.Sc. Thesis, University of Mosul, Mosul, 2002.
- S. T. Jabbori, “Hydrology and Water Management,” Dar Al-Kutub Press, Mosul, 1988.
- A. B. Al-Naqqash and M. A. Al-Sahhaf, “Geomorphology,” National Library in Baghdad University, Baghdad, 1989.
- A. N. Strahler, “Geomorphology,” Dar Al-Zaman Press, Baghdad, 1964.
- M. M. Ashor, “Morphometric Analyses Methods for Water Drainage Nets,” Qatar University, Doha, 1986.
- B. A. Kashif Al-Ghitaa, “Hydrology and Application,” Ministry of Higher Education, Organization of Technical Institutes, Baghdad, 1982.
- M. S. Hassan, B. Kh. Dawood and S. M. Al-Rawi, “Engineering Hydrology,” Dar Al-Kutub Press, Mosul, 1992.
- S. Buhairi, “Geomorphology,” Dar Al-Fikir Press, Damascus, 1979.
- F. H. Al-Neash, “Tigris River Meandering between Senhareeb Dam and Greater Zab Link,” Ph.D. Thesis, University of Mosul, Mosul, 1999.
- W. D. Thornberry, “Principles of Geomorphology,” Dar Al-Kutub Press, Mosul, 1975.
- Directorate of Military Survey, “Base Map of Sharqat Area,” 1-38-B-02, Scale: 1:50000, 1989.
- A. A. Al-Babwati, “The Geomorphological Features of Tharthar Valley,” M.Sc. Thesis, University of Baghdad, Baghdad, 1991.
- R. A. Zuidam and F. I. Zuidam, “Terrain Analyses and Classification Using Aerial Photographs,” Textbook of Photo Interpretation, Vol. 7, ITC, Enschede, 1979.