Natural Science
Vol.5 No.12(2013), Article ID:41486,8 pages DOI:10.4236/ns.2013.512154
Tide variation and signals during 2000-2004 in the northern Gulf of Aqaba, Red Sea
![]()
Department of Coastal Environment, Faculty of Marine Sciences, The University of Jordan-Aqaba, Aqaba, Jordan; r.manasrah@ju.edu.jo
Copyright © 2013 Riyad Manasrah. This is an open access article distributed under the Creative Commons Attribution License, which permits unrestricted use, distribution, and reproduction in any medium, provided the original work is properly cited. In accordance of the Creative Commons Attribution License all Copyrights © 2013 are reserved for SCIRP and the owner of the intellectual property Riyad Manasrah. All Copyright © 2013 are guarded by law and by SCIRP as a guardian.
Received 3 October 2013; revised 3 November 2013; accepted 10 November 2013
Keywords: Sea Level; Seiches; Semi-Enclosed Seas; Gulf of Aqaba; Red Sea
ABSTRACT
Variations of tide and mean sea level (MSL) were studied during the period August 2000-March 2004 in the northern Gulf of Aqaba to detect the seasonal differences of tide records and tide components signals. The study revealed seasonal cycle of the MSL in the northern Gulf, which was lower during summer than in winter due to the relative strong wind and higher evaporation during summer. The MSL during the year of 2003 was the lowest comparing to the other years during the study period which might be related to wind driven force and mixed layer depth. The statistical comparison analysis of the MSL among winters, springs and summers of the years 2000- 2004 exhibited significant difference values (p < 0.0001) among springs and summers, whereas no significant differences among winters (p ( 0.1) were manifested. Power spectrum analysis of the MSL revealed six distinguished signals with different periods that four of these signals (12.36, 6.19, 4.12 and 1.01 h) were superimposed by seiches in both the Gulf of Aqaba for the first mode and the Red Sea for the second and third mode with the principle harmonic components. The signals of 23.87 and 8.44 h are basically a luni-solar diurnal partial tide (K1) and a lunar terdiurnal constituent (M3), respectively.
1. INTRODUCTION
The Gulf of Aqaba is a unique semi-enclosed water body located at the northern end of the Red Sea (Figure 1). The seasonal variation of the sea surface temperature in the Gulf is about 6˚C - 7˚C with mean value of about 23.9˚C. The upper 200 m of the water column has different water mass characteristics during summer and winter. During summer, the stratification exists, while mixing condition dominates during winter. Below 200 m the water is homogenous during summer and winter [1-3].
The Gulf of Aqaba is located within the very warm portion of Sahara bio-climatic zone. The climate is arid with high evaporation (200 - 365 cmy−1) and negligible precipitation (~2.2 cmy−1) and runoff [4,5]. The area is influenced by the airflows from the Indian monsoonal trough and the Mediterranean low-pressure system [6]. Winds during all seasons of the year are fairly similar in terms of magnitude (mean: 4 - 5.5 ms−1) and direction (90% northerly winds). During summer, winds represent a diurnal cycle, while no signals appear during winter and spring seasons [7-9].
The water inflow and outflow of the Gulf of Aqaba are controlled by sea level and density differences between the Gulf and the Red Sea. On the other hand, the sea level changes of the Gulf are determined by the water balance of the Red Sea, which depends on a real decrease of water volume due to intensive evaporation from sea surface, the variation of a positive component of water exchange through Bab el Mandeb and Suez Canal and the water redistribution in the sea due to the wind [8,10].
The present work focuses on investigating the seasonal variation of mean sea level (MSL) in relation to Global MSL, seasonal differences of tide records, and tide components signals in the northern Gulf of Aqaba in order to present a scientific rationale for possible planning and directing to the decision makers for durable development.
2. MATERIALS AND METHODS
A pressure sensor was deployed on a base settled on the bottom of coastal water in front of the Marine Science Station (MSS) in the northern Gulf of Aqaba (Figure 1). The water pressure measurements (mean sea level data) over the sensor were sent directly and continuously to the tide gauge with interval of 10 minutes. In addition, mean sea level (MSL) at a suggested bench mark nearby the tide gauge (Figure 2), which is represented a known altitude in proportionality to Global MSL, were measured using physical scales on the ground and correlated with the concurrently recorded MSL at the MSS by the tide gauge in order to generate a long term records of the MSL in the northern Gulf of Aqaba reference to Global MSL during the period August 2000-March 2004 (Figures 1 and 2). The spectrum and statistical analysis of tide were performed using MATLAB 5.3 software.
3. RESULTS
3.1. Long Term Mean Sea Level (MSL) Records
Weekly average of the MSL records (cm) in the years 2000-2004 in the northern Gulf of Aqaba revealed obvious variations from year to year (Figure 3). A decrease trend of the MSL during the study period was detected which is following the linear fit curve:

where MSL is the mean sea level, t is the Julian days after August 1st, 2000.
This implies that the decrease rate of the MSL was 19.18 cm·yr−1 among the years 2000-2004. The monthly mean and standard deviation of the MSL records in the northern Gulf are shown in Table 1. The highest MSL
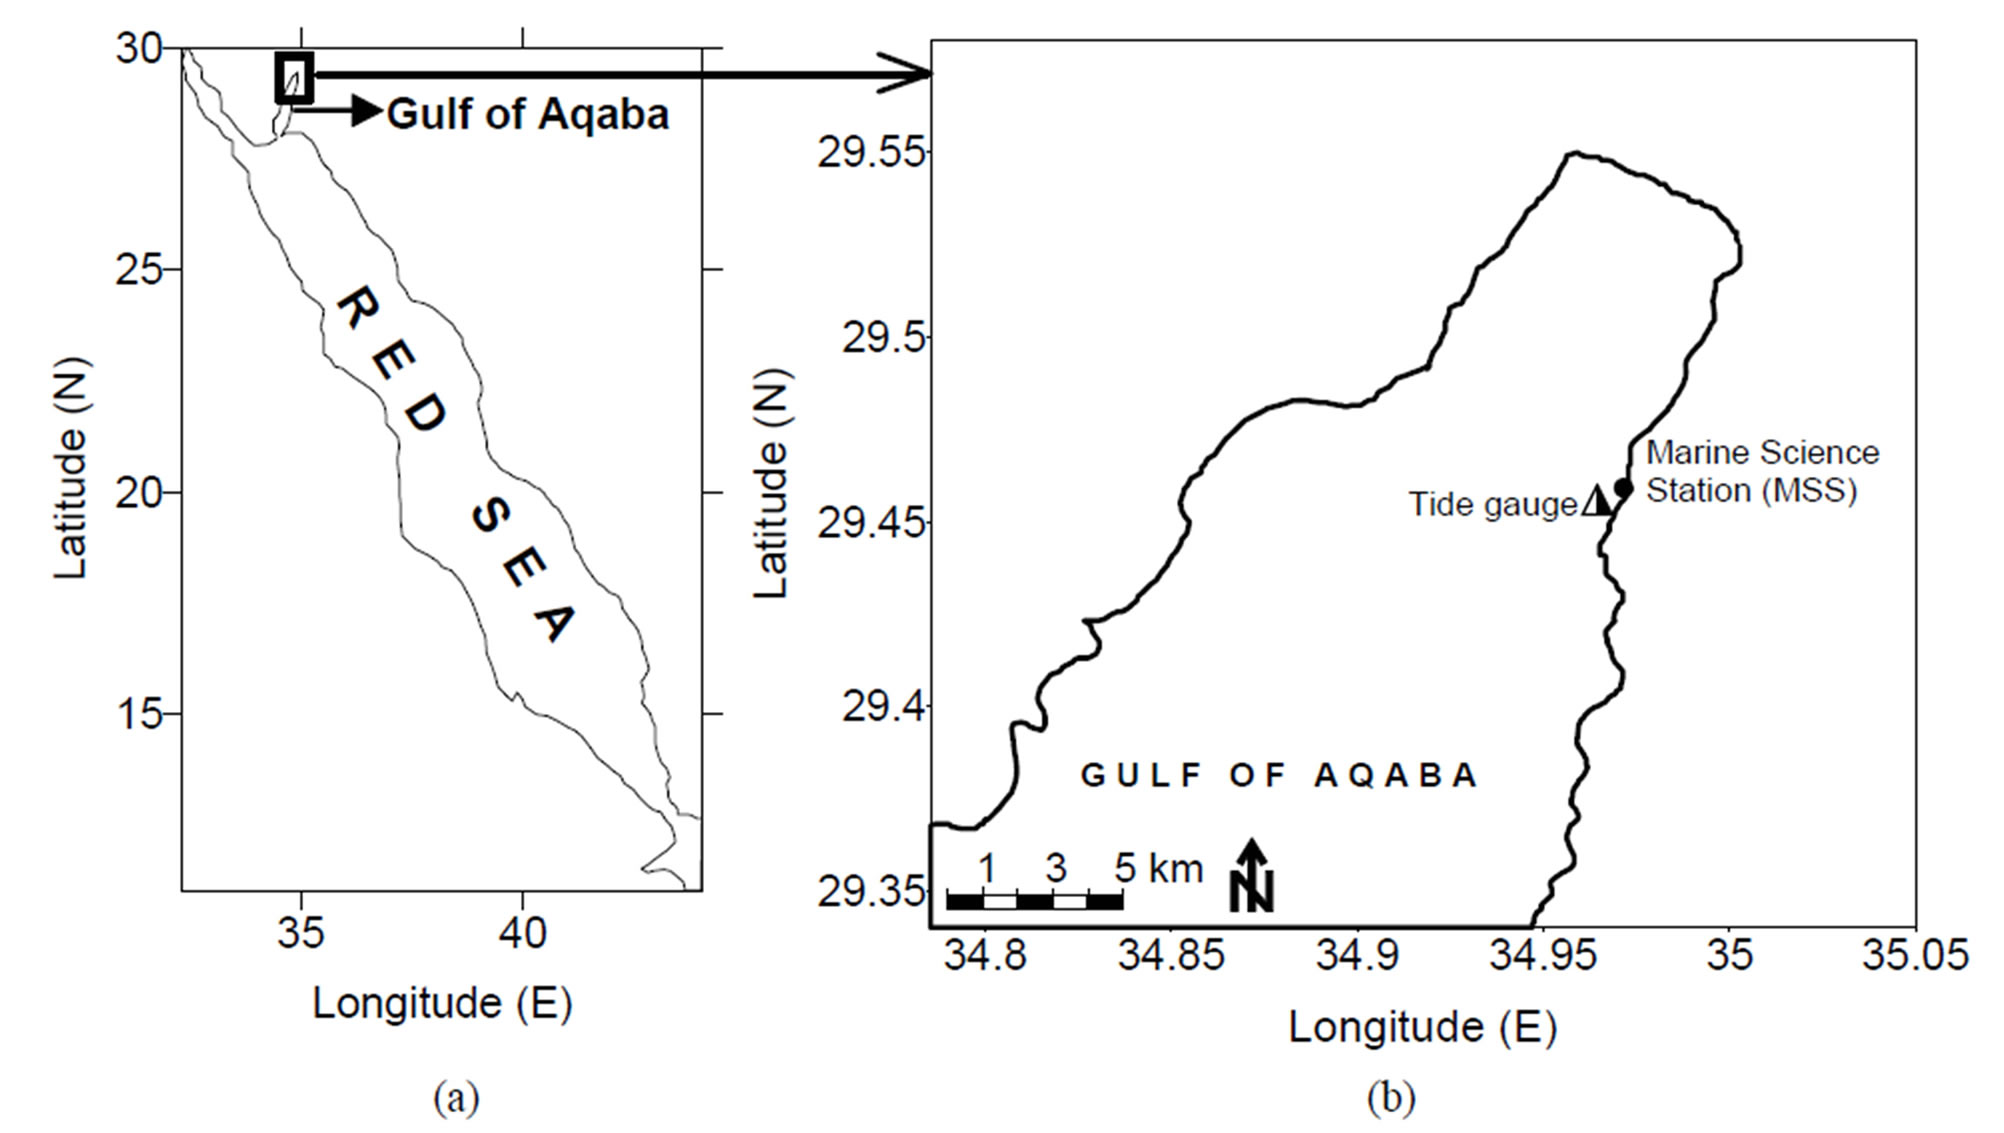
Figure 1. (a) Map of the Red Sea showing the location of Gulf of Aqaba and the study area. (b) Study area and tide gauge location in the northern Gulf of Aqaba.

Figure 2. Schematic of the tide gauge measurement system in the northern Gulf of Aqaba.

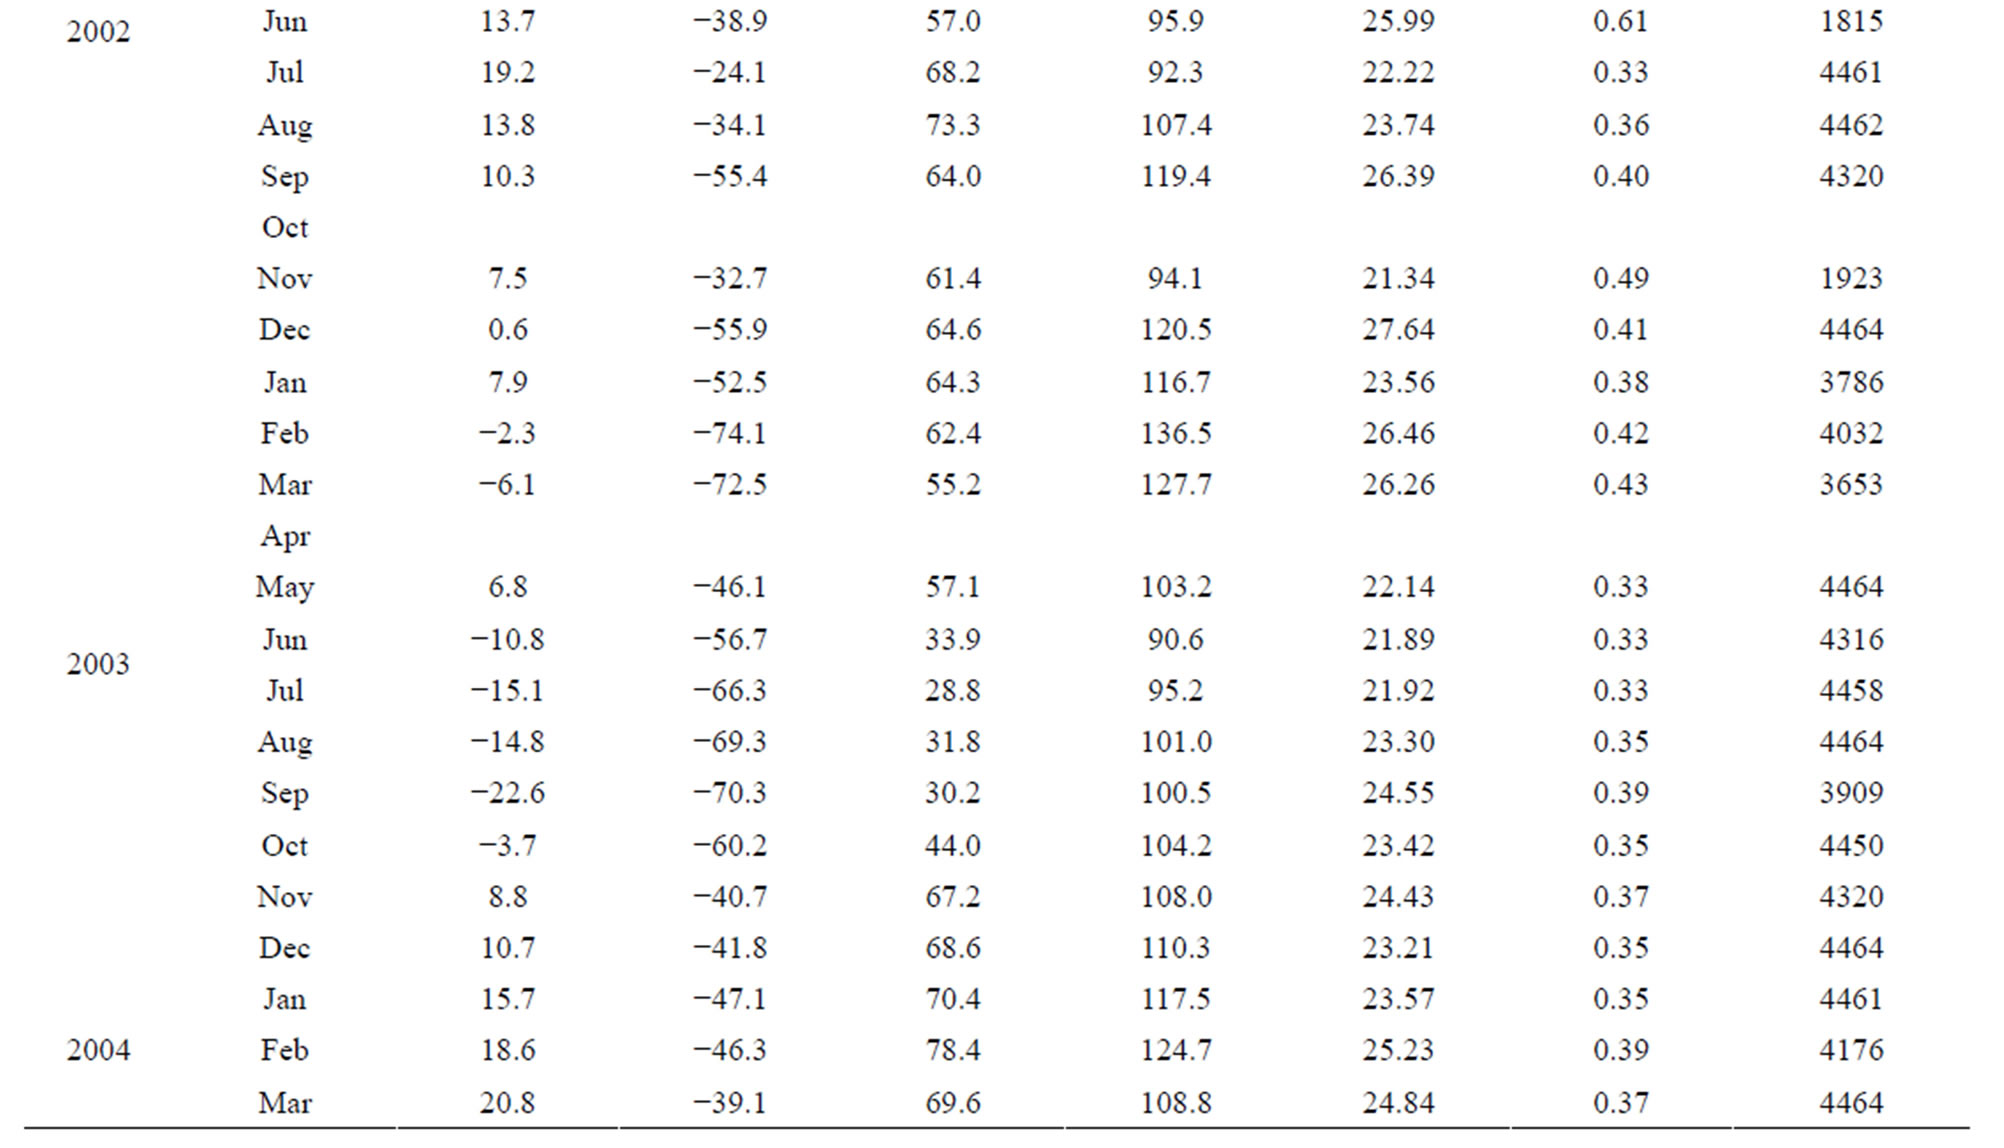
Table 1. Monthly statistical summary of the MSL (cm) records in the northern Gulf of Aqaba during the period August 2000-March 2004.
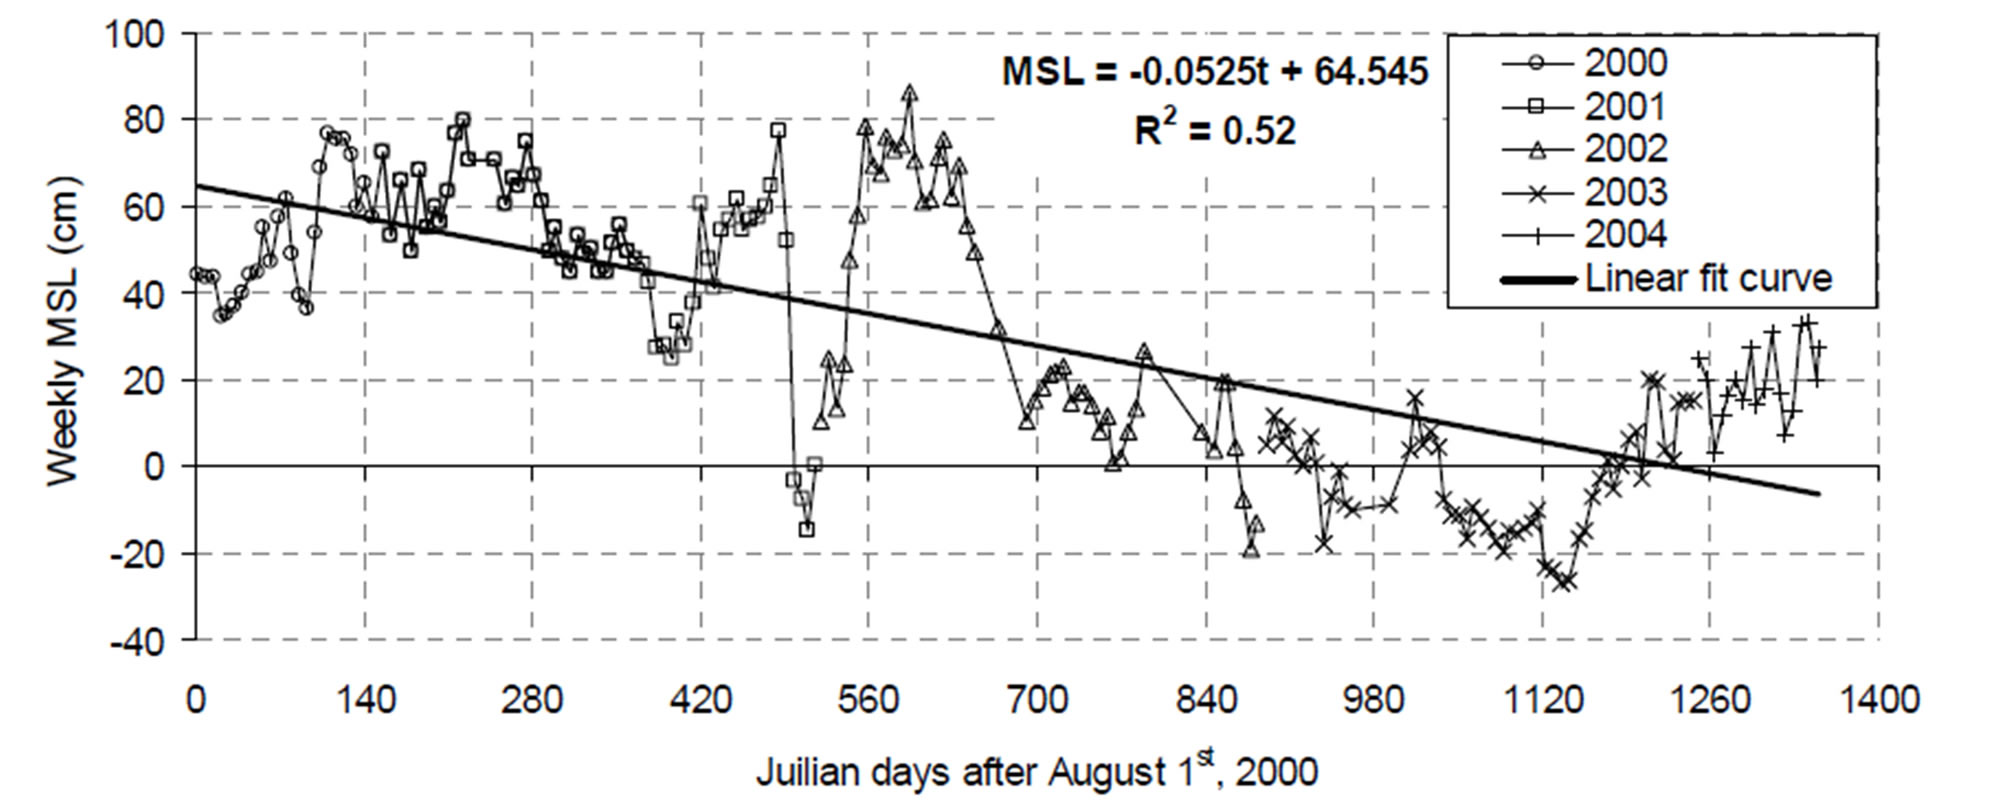
Figure 3. Weekly average of mean sea level (cm) records during the period of August 2000 to March 2004 in the northern Gulf of Aqaba.
was recorded during March 2000 (76.3 cm) and the lowest was −22.6 cm recorded during September 2003.
3.2. Seasonal Variation of Mean Sea Level (MSL)
During summer the MSL decreased significantly than during winter. Subsequently, this created a seasonal cycle of the MSL during the years 2000-2004 (Figure 4). One way ANOVA test were performed to examine the differences of MSL among winters, springs and summers of the years 2000-2004 (Figure 5, Table 2). No significant differences (p ~ 0.1) of MSL variation among winters, whereas significant differences (p < 0.0001) was patent among springs and summers during the study period (Table 2). The decrease of MSL during winter, spring and summer of the year 2003 was significant (mean values: 9.1, −10.1 and −10.0 cm, respectively) comparing with the other years, while during the year 2001 the MSL was significantly the highest during all seasons (mean values: 44.1, 66.7 and 47.8 cm, respectively; Table 2).
3.3. Tide Components Signals
Spectrum analysis of tide records in the northern Gulf of Aqaba was done in order to detect components of the tide signals. The analysis revealed six distinguished signals with different periods (Figure 6). The diurnal (T1 = 23.87 h) and Semidiurnal signals (T2 = 12.36 h) were dominated with distinctive amplitude comparing with the other signals. Based on the principle harmonic components (Table 3) [11], the semidiurnal tide signal is basically principle lunar partial tide (M2) and the diurnal tide signal is luni-solar diurnal partial tide (K1).
Moreover, the periodic signals T3 (8.44 h), T4 (6.10 h) and T5 (4.12 h) represent shallow water compound and overtides of the principal solar and lunar constituents. The signal T3 might comprise the lunar terdiurnal constituent (M3), T4 might imply the lunar or/and solar quarter-diurnal harmonics (M4; S4; MS4), and T5 might comprise the lunar and solar sixth diurnal harmonics (2MS6; 2SM6).
On the other hand, the signals (T2, T4, T5 and T6) might be generated or superimposed by unbroken standing waves or so-called seiches. The reason for these seiches is that progressive barotropic waves traveling along the basin are reflected at the far ends and then the two sets of waves traveling in opposite directions can interfere with each other resulting in a standing wave with the resonance period of the basin. Owing to the fast propagation,  , the effect of the inertial frequency can be ignored. Then the period of oscillation (T) of the seiches is given by:
 , (1)
, (1)
which is known as Merian’s formula where L is the length of the water body [m], C is the long wave speed [ms−1], g is the earth gravity [ms−2], H is the mean depth of the water body [m], and n is a positive integer [11-13], Equation (1) was derived for a long water body of uniform width and depth.
The fundamental periods of the seiches in both the Gulf of Aqaba and Red Sea have been calculated using Equation (1) based on the mean depth H, and the length L of the water body, L. Due to the complex bathymetry of both the Gulf of Aqaba and the Red Sea we can expect only approximated results.
For the Gulf of Aqaba we take L = 180 ´ 103 m, g = 9.81 ms−2, H = 800 m, and n = 1; and for the Red Sea we use L = 1930 ´ 103 m, g = 9.81 ms−2, H = 750 m, and n = 1. Then the fundamental periods of the first mode seiche are 1.13 h and 12.51 h for the Gulf of Aqaba and Red Sea, respectively. The seiche period in the Gulf of Aqaba agrees well with the observed value T6 (1.01 h) and T2 (12.36 h), respectively (Figure 6). Nevertheless, for the second and third mode seiche in the Red Sea (n = 2 and
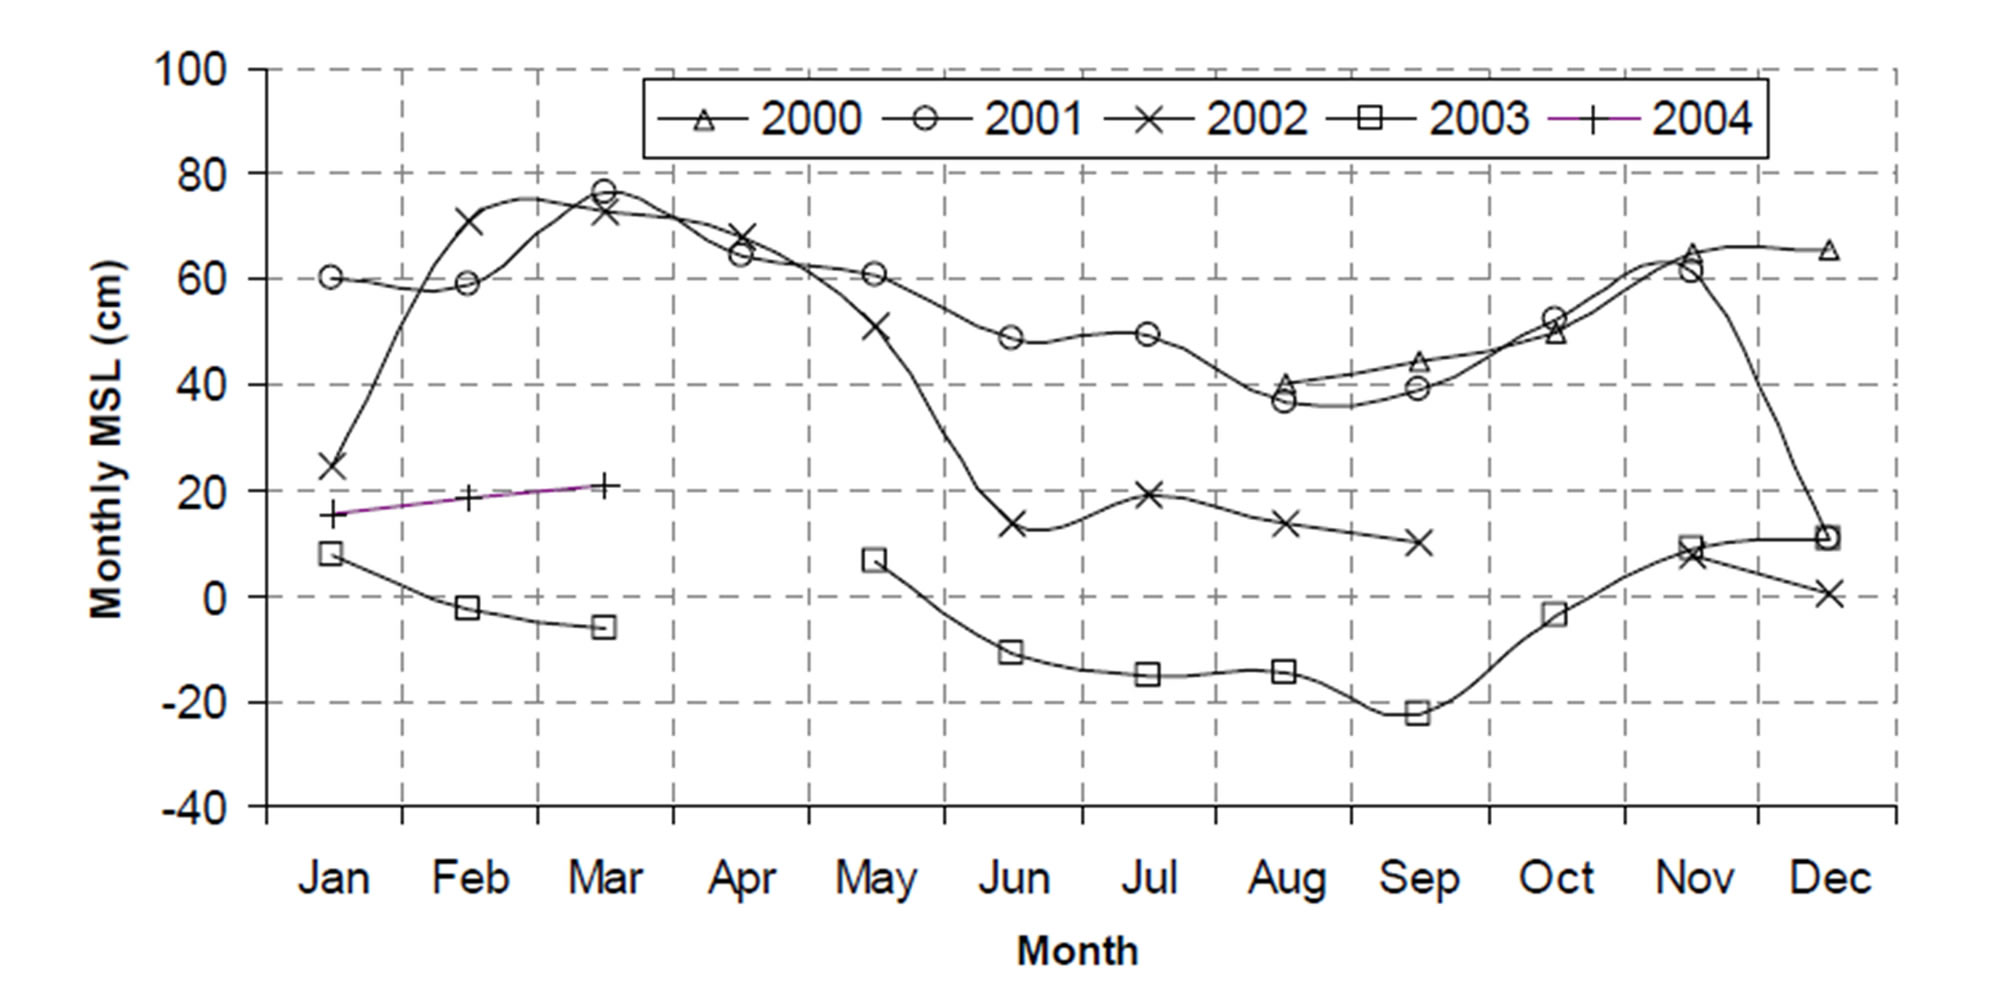
Figure 4. Monthly average of mean sea level (cm) records during the period of August 2000 to March 2004 in the northern Gulf of Aqaba.

Table 2. Statistical comparison analysis of mean seal level (cm) records during winters, springs and summers seasons of the years 2000-2004 in the northern Gulf of Aqaba.

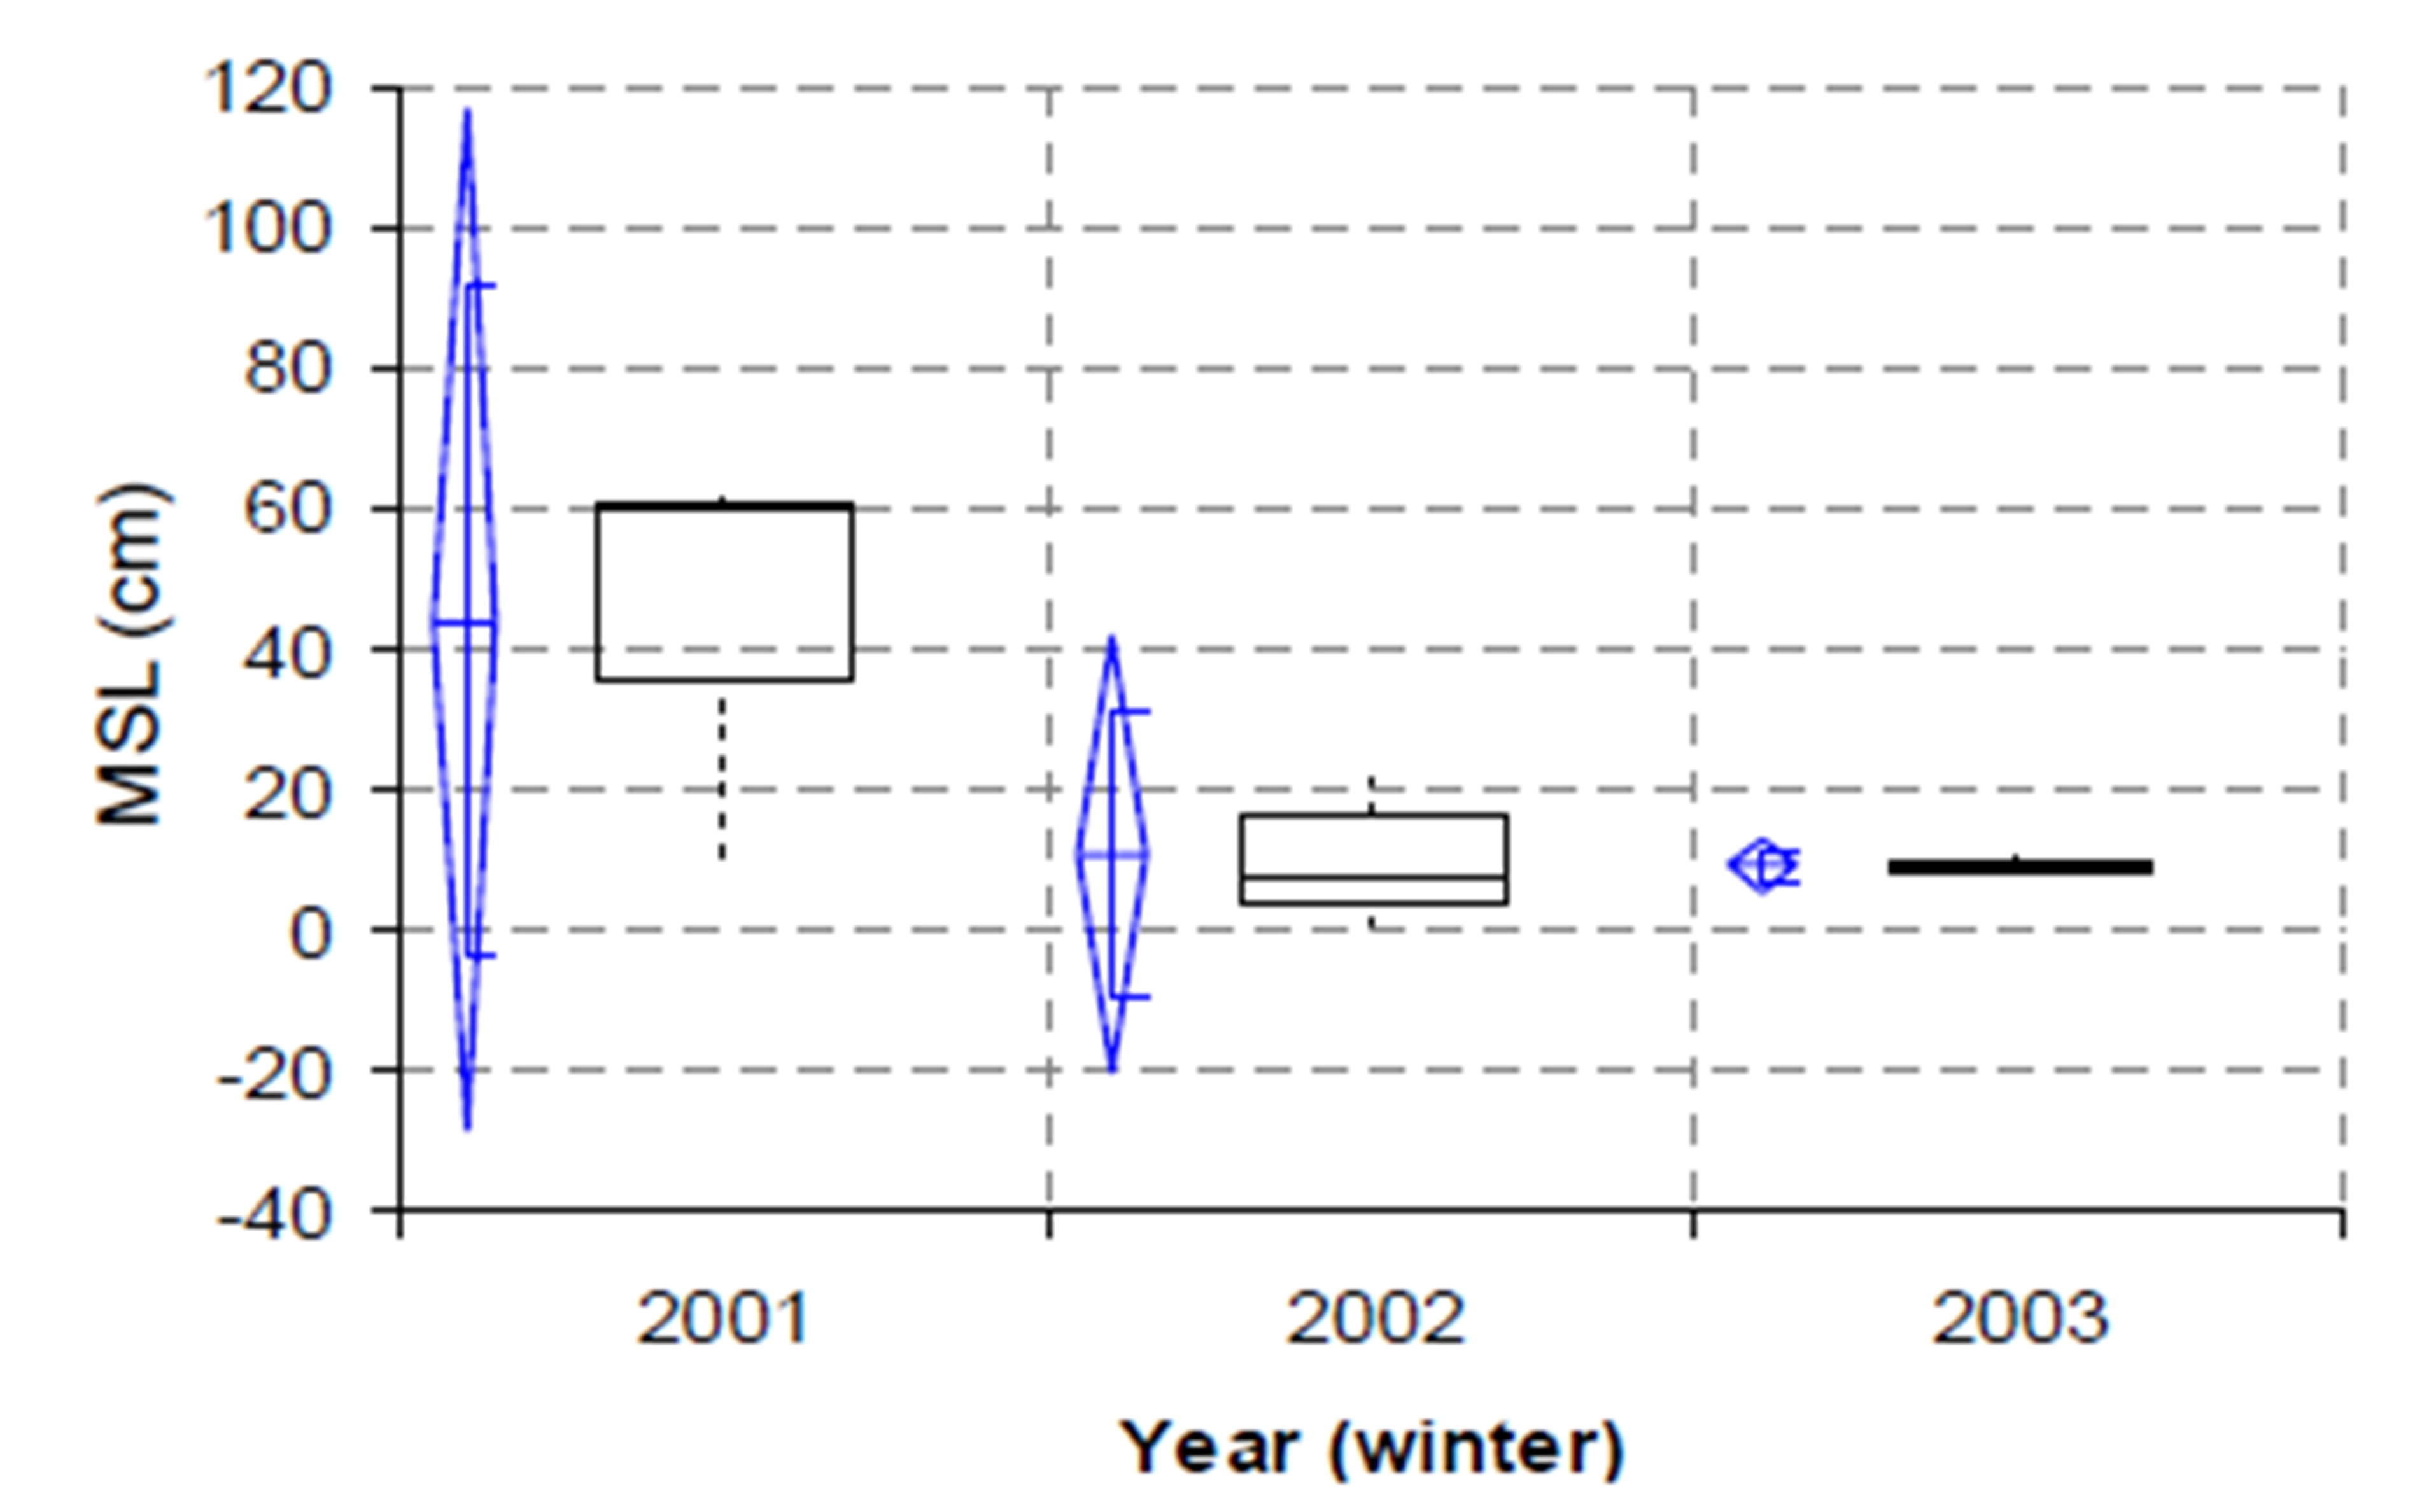
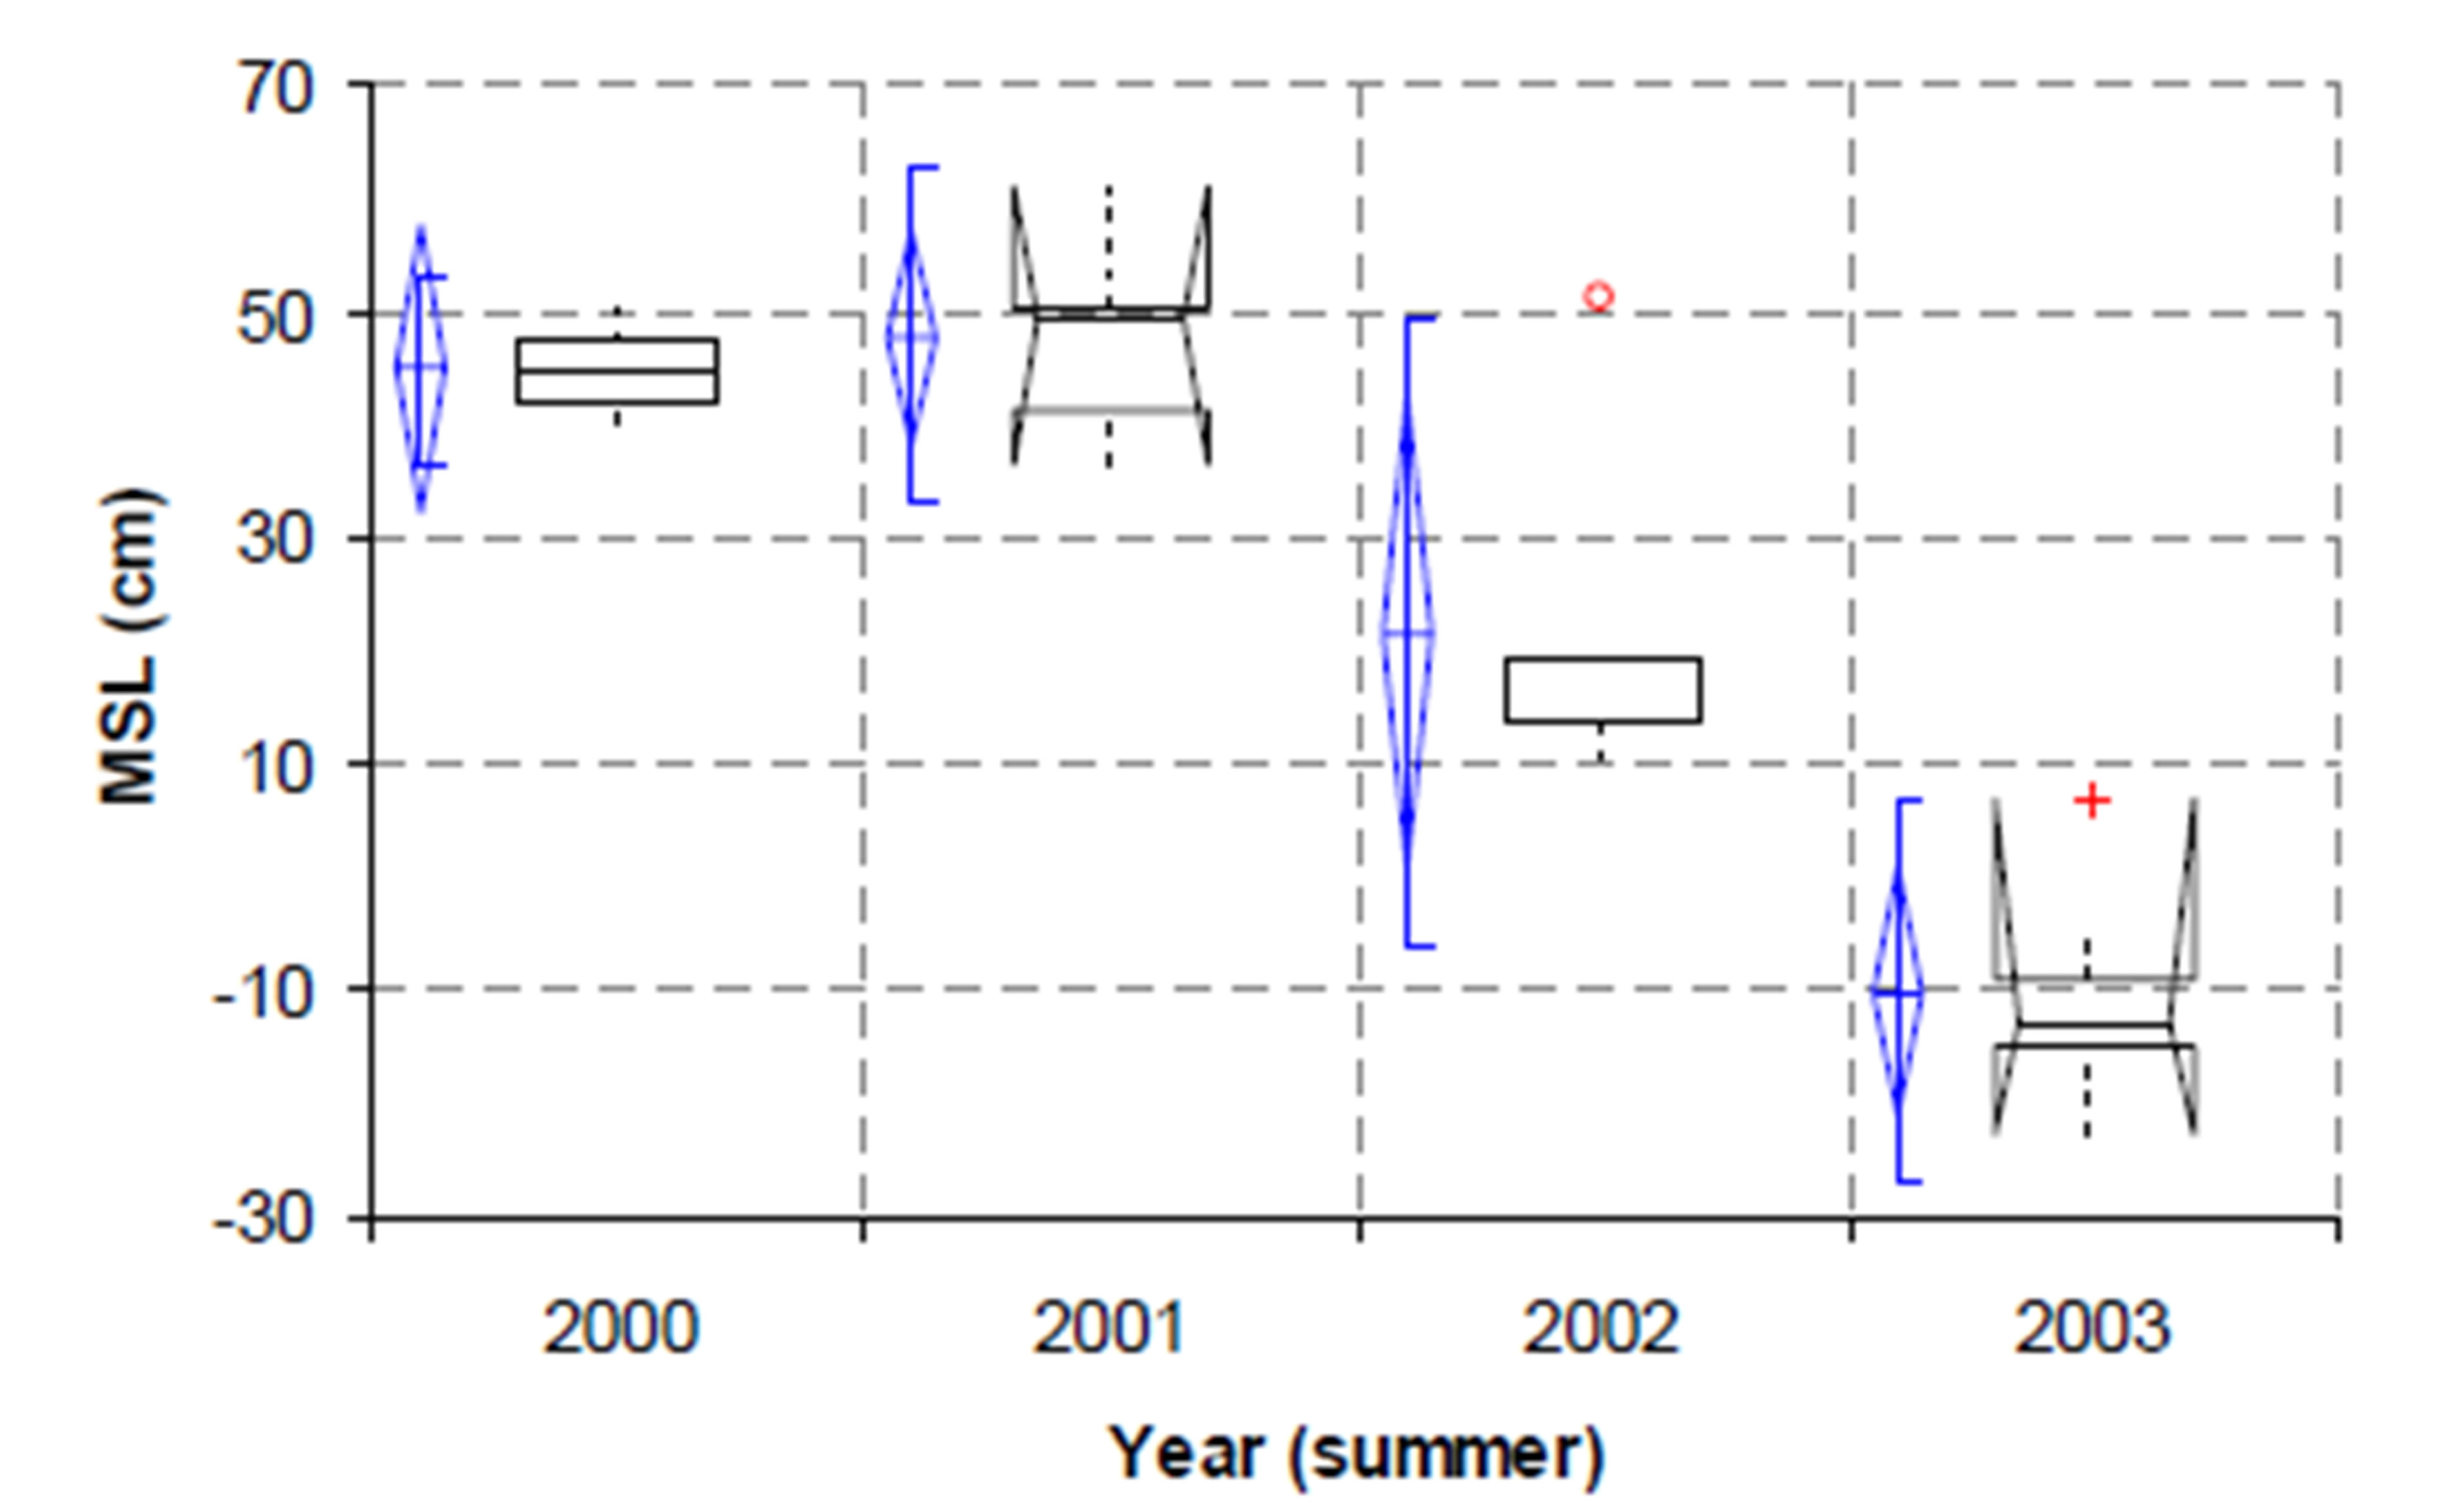
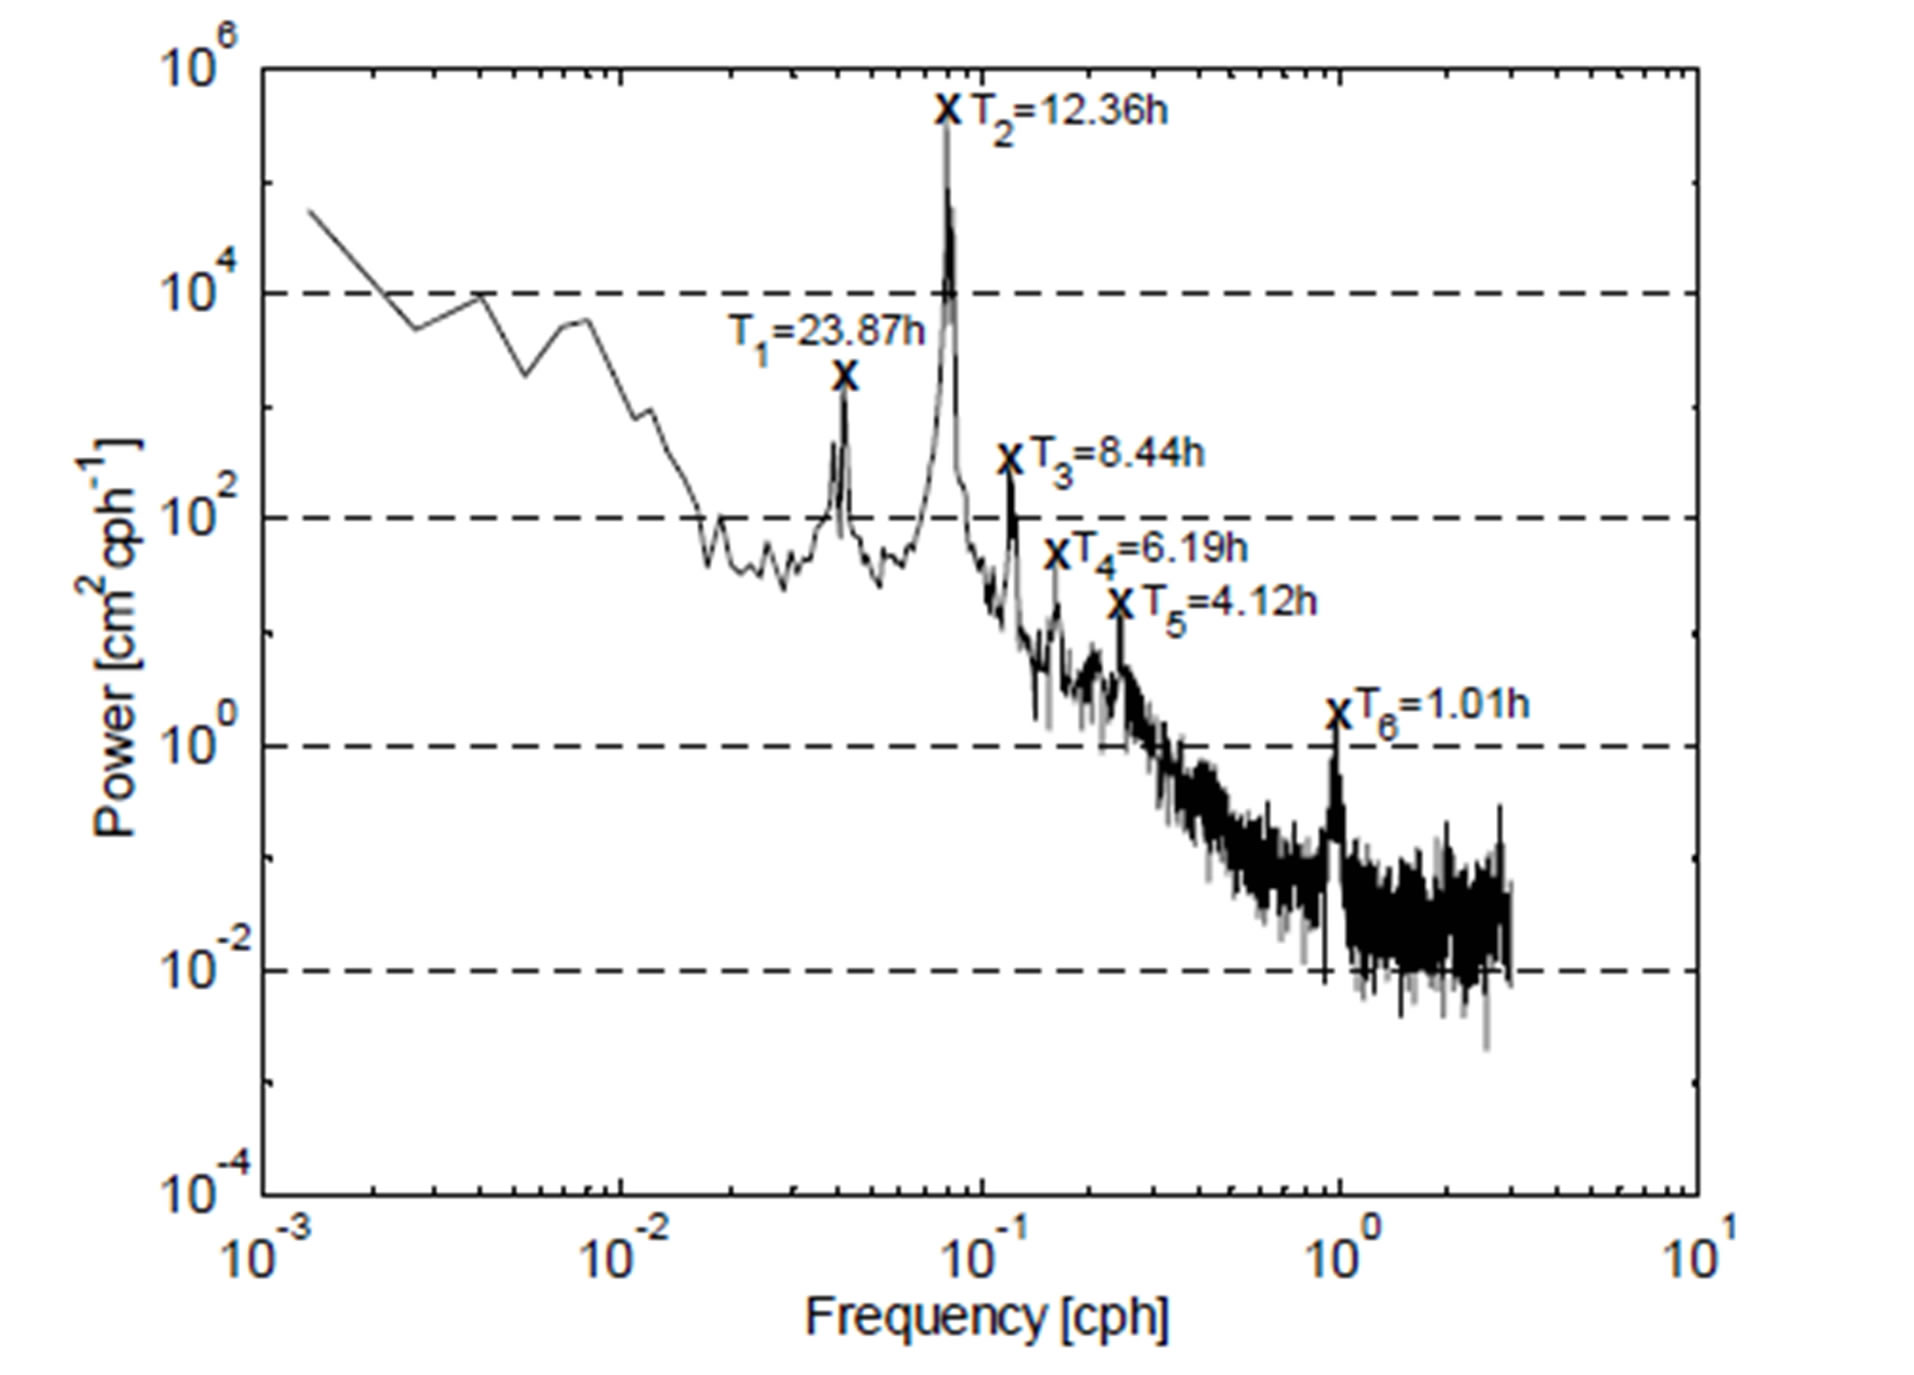
Figure 5. Box-Whisker plots of mean sea level (cm) during winters, springs and summers seasons of the years 2000-2004 in the northern Gulf of Aqaba.
3), the fundamental periods using Equation (1) will be 6.25 h and 4.17 h, respectively, which they are close well to those detected periods T4 (6.19 h) and T5 (4.12 h), respectively (Figure 6). Therefore, the period signals of T2, T4, T5 and T6 are superimposed by seiches in both the Gulf of Aqaba and the Red Sea with the principle harmonic components.
4. DISCUSSIONS AND CONCLUSION
In general, various factors affect the volume or mass of the ocean, leading to changes in MSL, such as
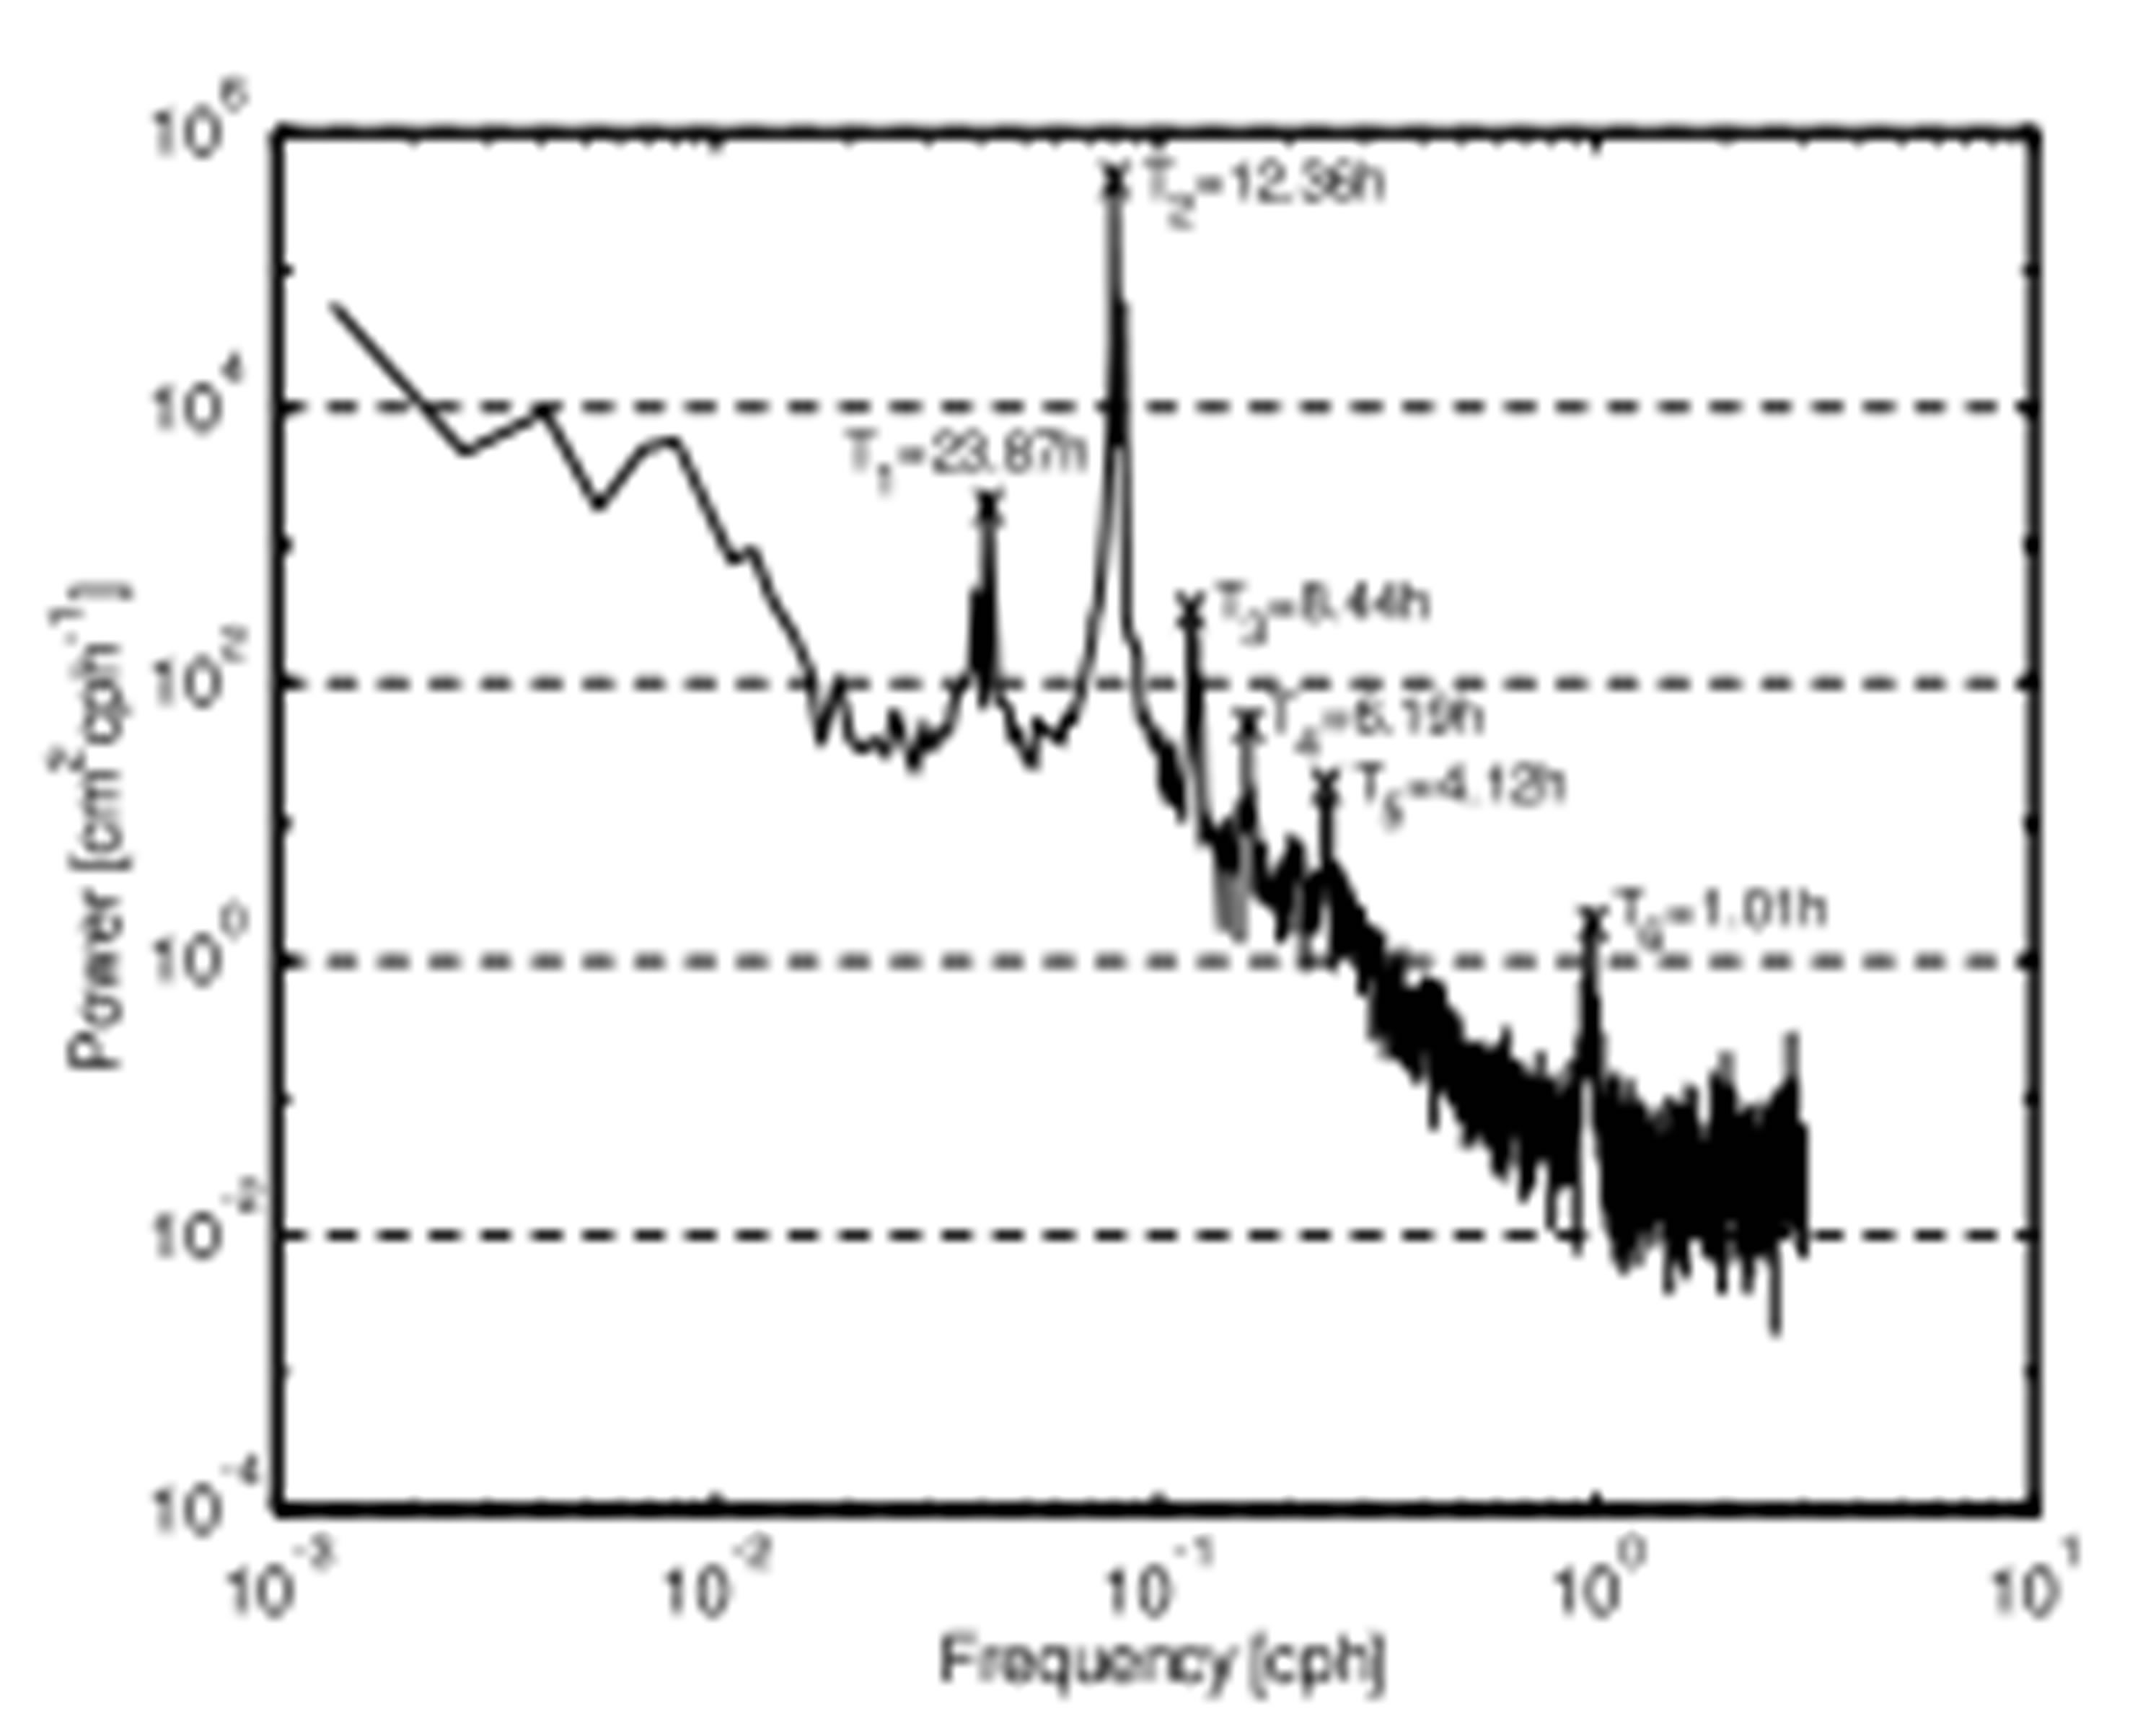
Figure 6. Power spectrum of mean sea level of the years 2000- 2004 in the northern Gulf of Aqaba.
changes of atmospheric pressure (the inverse barometer effect), climate, ocean currents, local ocean temperature and shape of the ocean basins and land/sea distribution.
In the Gulf of Aqaba, the maximum range of seawater temperature in the upper 300 m of the water column was 6˚C - 7˚C among the years 1997-2003. The statistical analysis of temperature measurements in the Gulf of Aqaba showed no significant spatial and temporal difference between three sites in the upper 300 m depth during the study period [2,8], thus temperature variation is quit stable and has a low annual range in the northern Gulf of Aqaba, which can not affect significantly on the MSL variations.
Atmospheric pressure in the northern Gulf of Aqaba (Figure 7) for different periods during the years 2002 and 2003 revealed a stable and standard pressure variation in such arid and warm portion of Sahara bio-climatic zone. The average atmospheric pressure during summer was 1006 hPa, while during winter it was 1014 hPa. Therefore, atmospheric pressure in the northern Gulf of Aqaba plays no roles as a factor affecting the MSL.
Tidal currents and water levels in the northern Gulf of Aqaba show strongly the effects of remote forcing. Water levels reflect remote forcing, with annual variations in sea surface height in the Gulf driven by wind-induced setup in the main part of the Red Sea, although winds on the Gulf itself are also important [14]. [15] estimated that annual variability in the sea surface tilted between Aqaba and the strait of Tiran is approximately 7 to 8 cm depending mostly on annual variations in mixed layer depth in the Gulf, with the greatest depression of the free surface near Aqaba occurring in late summer when the mixed layer is the shallowest.
The source of sea level change is due to changes in the average density of the water column and sometimes es-

Table 3. Principle harmonic components according to Defant (1961).

Figure 7. Atmospheric pressure (hPa) distribution during selected days in the years 2002-2004 in the northern Gulf of Aqaba.
timated by computing the steric height (e.g., [16]), or by estimating the baroclinc pressure field (as was done by [17]). Through these computations, the findings of annual changes in steric amount are only several cm in the Red Sea near the strait of Tiran [16,17].
5. ACKNOWLEDGMENTS
The author would like to thank the technical staff at the Marine Science Station for their help in field work. Special thanks are due to Mr. Mysara Al-Amor for his help.
REFERENCES
- Manasrah, R. and Badran, M.I. (2008) Inter-annaul variation in the seawater thermohaline structure in the northern Gulf of Aqaba, Red Sea. Dirasat Pure Sciences, 35, 123- 135.
- Manasrah, R., Badran, M., Lass, U. and Fennel, W. (2004) Circulation and winter deep-water formation in the northern Red Sea, Oceanologia, 46, 5-23.
- Al-Rousan, S., Al-Moghrabi, S., Pätzold, J. and Wefer, G. (2003) Stable oxygen isotopes in Porites corals monitor weekly temperature variations in the northern Gulf of Aqaba, Red Sea. Coral Reefs, 22, 346-356. http://dx.doi.org/10.1007/s00338-003-0321-6
- Anati, D.A. (1974) Water transports in the gulf of Aqaba. L’Oceanographic Physique de la Mer Rouge, CNEXO, 2, 165-173.
- Assaf, G. and Kessler, J. (1976) Climate and energy exchange in the Gulf of Aqaba. Monthly Weather Review, 104, 381-385. http://dx.doi.org/10.1175/1520-0493(1976)104<0381:CAEEIT>2.0.CO;2
- Hulings, N. (1989). A review of marine science research in the gulf of Aqaba, Marine Science Station.
- Manasrah, R., Zibdah, M., Al-Ougaily, F., Yusuf, N. and Al-Najjar, T. (2007) Seasonal changes of water properties and current in the northernmost Gulf of Aqaba, Red Sea. Ocean Science Journal, 42, 113-116. http://dx.doi.org/10.1007/BF03020878
- Manasrah, R. (2002) The general circulation and water masses characteristics in the Gulf of Aqaba and northern Red Sea. Meereswissenschaftliche Berichte (Marine Science Report), 50, 1-120.
- Berman, T., Paldor, N. and Brenner, S. (2002) The seasonality of tidal circulation in the Gulf of Elat (Aqaba). Israel Journal of Earth Sciences, 52, 11-19. http://dx.doi.org/10.1560/G72J-CYHM-D202-FJY2
- Bogdanova, A.K. (1974) Indirect estimation of the seasonal variation of the water exchange through Bab El Mandeb. Center National Pour L’exploitation des Ocean, CNEXO, 2, 253-265.
- Defant, A. (1961). Physical oceanography. Pergamon Press, New York.
- Pond, S. and Pickard, G.L. (1983) Introductory dynamical oceanography. 2nd Edition, Pergamon Press, Oxford.
- Neumann, G. and Pierson, W. (1966) Principles of physical oceanography. Prentice Hall.
- Monismith, S.G. and Genin, A. (2004) Tides and sea level in the Gulf of Aqaba (Eilat). Journal of Geophysical Research, 109, C04015. http://dx.doi.org/10.1029/2003JC002069
- Berman, T., Paldor, N. and Brenner, S. (2000) Simulation of wind driven circulation in the Gulf of (Aqaba). Journal of Marine Systems, 26, 349-365. http://dx.doi.org/10.1016/S0924-7963(00)00045-2
- Tomczak, M. and Godfrey, J. (2003) Regional Oceanography: An introduction. 2nd Edition, Daya Publishing House.
- Sofianos, S.S. and Johns, W.E. (2001) Wind induced sea level variability in the Red Sea. Geophysical Research Letters, 28, 3175-3178. http://dx.doi.org/10.1029/2000GL012442

