Natural Science
Vol.5 No.1A(2013), Article ID:27618,9 pages DOI:10.4236/ns.2013.51A021
Environmental factors control and climate change impact on forest type: Dong PraYa Yen-KhaoYai world heritage in Thailand
![]()
1Faculty of Environment and Resource Studies, Mahidol University, Thailand; *Corresponding Author: nathsuda.pum@mahidol.ac.th, nathsuda@gmail.com
2Kasetsart University, Sakhonnakhon, Thailand
Received 29 November 2012; revised 27 December 2012; accepted 9 January 2013
Keywords: Carbon Content; Dong PraYa Yen-KhaoYai Forest Complex; Cluster Analysis; CCA; Climate Change
ABSTRACT
Climate is a major determinant of global vegetation patterns and has a significant influence on the distribution and structure of forest ecosystems. Dong PraYa Yen-KhaoYai Forest Complex has been a UNESCO natural world heritage site since 2007, but little is known about its plant community. Our study aims to identify each plant community within the world heritage area and calculate its potential for carbon content. We determine both the relationship between forest type and both physio-chemical soil properties and climate change impact. We employed allometric equations to calculate aboveground biomass and both cluster analysis and canonical correspondence analysis (CCA) to examine the relationship between forest type and physiochemical soil properties. An equation for each physical parameter was used to predict the forest model. The climate scenario under A2 and B2 was applied to calculate future predominant forest types. Our results reveal that the forest ecosystems at Tab Lan (TL) have the highest species count (332 species) followed by Pang Srida (PD), KhaoYai (KY), Dong Yai (DY), and Tapraya (TY), with 293, 271, 169, and 99 species, respectively. We found KY to have the highest recorded carbon storage value at 2507.6 tC/ha followed by TL, PD, TY, and DY (1613.8, 1269.1, 844 and 810.7 tC/ha, respectively). Cluster analysis results indicated that the dominant species in each forest type is different. Moreover, CCA revealed that soil organic matter (SOM) and soil acid-base indicators are the best parameters to establish correlation for each forest type. Based on our results, future climate predictions show a negative impact on evergreen forests, but a positive one on deciduous ones.
1. INTRODUCTION
Forest area use is an optimum option for climate change mitigation. In developing countries, however, forest degradation is in direct conflict with controlling climate change. Exercising a natural forest reserve strategy is an option that will protect and preserve existing forests. Reforestation should also be employed. Forest ecosystems are vital for the welfare of living things and mankind [1]. Forests are sources of raw materials and provide basic human needs such as food, clothing, housing, and medicine [2]. Additionally, forests balance the environment. Deforestation impacts soil and water resources, leading to direct and indirect socioeconomic problems.
The IPCC [3] report on the impact of the Global Climate Model (GCM) on tropical forests does not especially focus on Thailand. Thai natural forest resources may experience different impacts of climate change than reported. This research is the first of its kind that downscales the global climate model to a regional one, specifically, to a 25 km × 25 km grid size of forestry covering Thailand [4]. We selected physical factors that account for every forest type in Thailand. The objectives of our research are the following: first, to identify environmental factors that control forest type; to calculate total carbon content of each forest type; and to examine the impact of climate change on forest type.
2. STUDY AREA
The total area of the Dong PraYa Yen-Khao Yai forest complex is 6152.13 sq. km2. It is situated at 14˚00' - 14˚33'N and 101˚05' - 103˚14'E in northeastern Thailand, covering 6 provinces including Saraburi, Nakhon Nayok, Nakhon Rachasrima, Prachin Buri, Sakaew, and Buri Rum. Dong PraYa Yen-KhaoYai Forest Complex is the second UNESCO world heritage site created in Thailand, and is comprised of four national parks and a wildlife sanctuary (Figure 1). Khao Yai National Park consists of hill evergreen forest(KY_HEF), moist evergreen forest (KY_MEF), dry evergreen forest(KY_DEF), mixed deciduous forest (KY_MDF), secondary forest (KY_SF), grasslands (KY_GL), and deciduous dipterocarp forest (KY_DDF). Tab Lan National Park consists of hill evergreen forest (TL_HEF), moist evergreen forest (TL_ MEF), dry evergreen forest (TL_DEF), mixed deciduous forest (TL_MDF), deciduous dipterocarp forest (TL_ DDF), and palm forest (TL_PF). Pang Srida National Park consists of dry evergreen forest (PD_DEF), mixed deciduous forest (PD_MDF), deciduous dipterocarp forest (PD_DDF), secondary forest (PD_SF), and grassland (PD_GL). Ta Phraya National Park consists of dry evergreen forest (TY_DEF), mixed deciduous forest (TY_ MDF), deciduous dipterocarp forest (TY_DDF), and grassland (TY_GL). Dong Yai Wildlife Sanctuary consists of deciduous dipterocarp forest (DY_DDF), mixed deciduous forest (DY_MDF), deciduous dipterocarp forest (DY_DDF), and grassland (DY_GL). This world heri tage site encompasses all major habitat types and at least 2500 plant species (16 endemic) of the 20,000 - 25,000 species estimated for Thailand [5].
3. METHODOLOGY
Dong PraYaYen-KhaoYai forest complex consists of eight ecosystems: hill evergreen forest, moist evergreen forest, dry evergreen forest, mixed deciduous forest, dipterocarp deciduous forest, secondary forest, palm forest, and grassland. For each forest type, three plot sizes including 40 × 40 m2, 4 × 4 m2, and 1 × 1 m2 were plotted. All seventy-four plots were examined. Above and below ground biomass were calculated by using allometric equations (protocols described in the works of [6,7]). Soil was randomly chosen for 1 subsamples in 3 samples. Total soil sampling included 27 pits from our total study area. Soil was collected in 4 levels: 0 - 30 cm, 30 - 60, 60 - 90, and >90 cm, for analyzing texture, bulk density, soil moisture, soil reaction (pH), soil organic matter (SOM), % organic carbon (%OC), cation exchange capacity (CEC), total nitrogen, available phosphorus (avai.P), available potassium (avai.K), and total organic carbon (TOC) by using standard methods [8]. To reduce the number of sample plots, similar forest types were grouped. Twenty-four plots were further analyzed for cluster and canonical correspondence analysis (CCA) to examine the relationship between forest type and physio-chemical
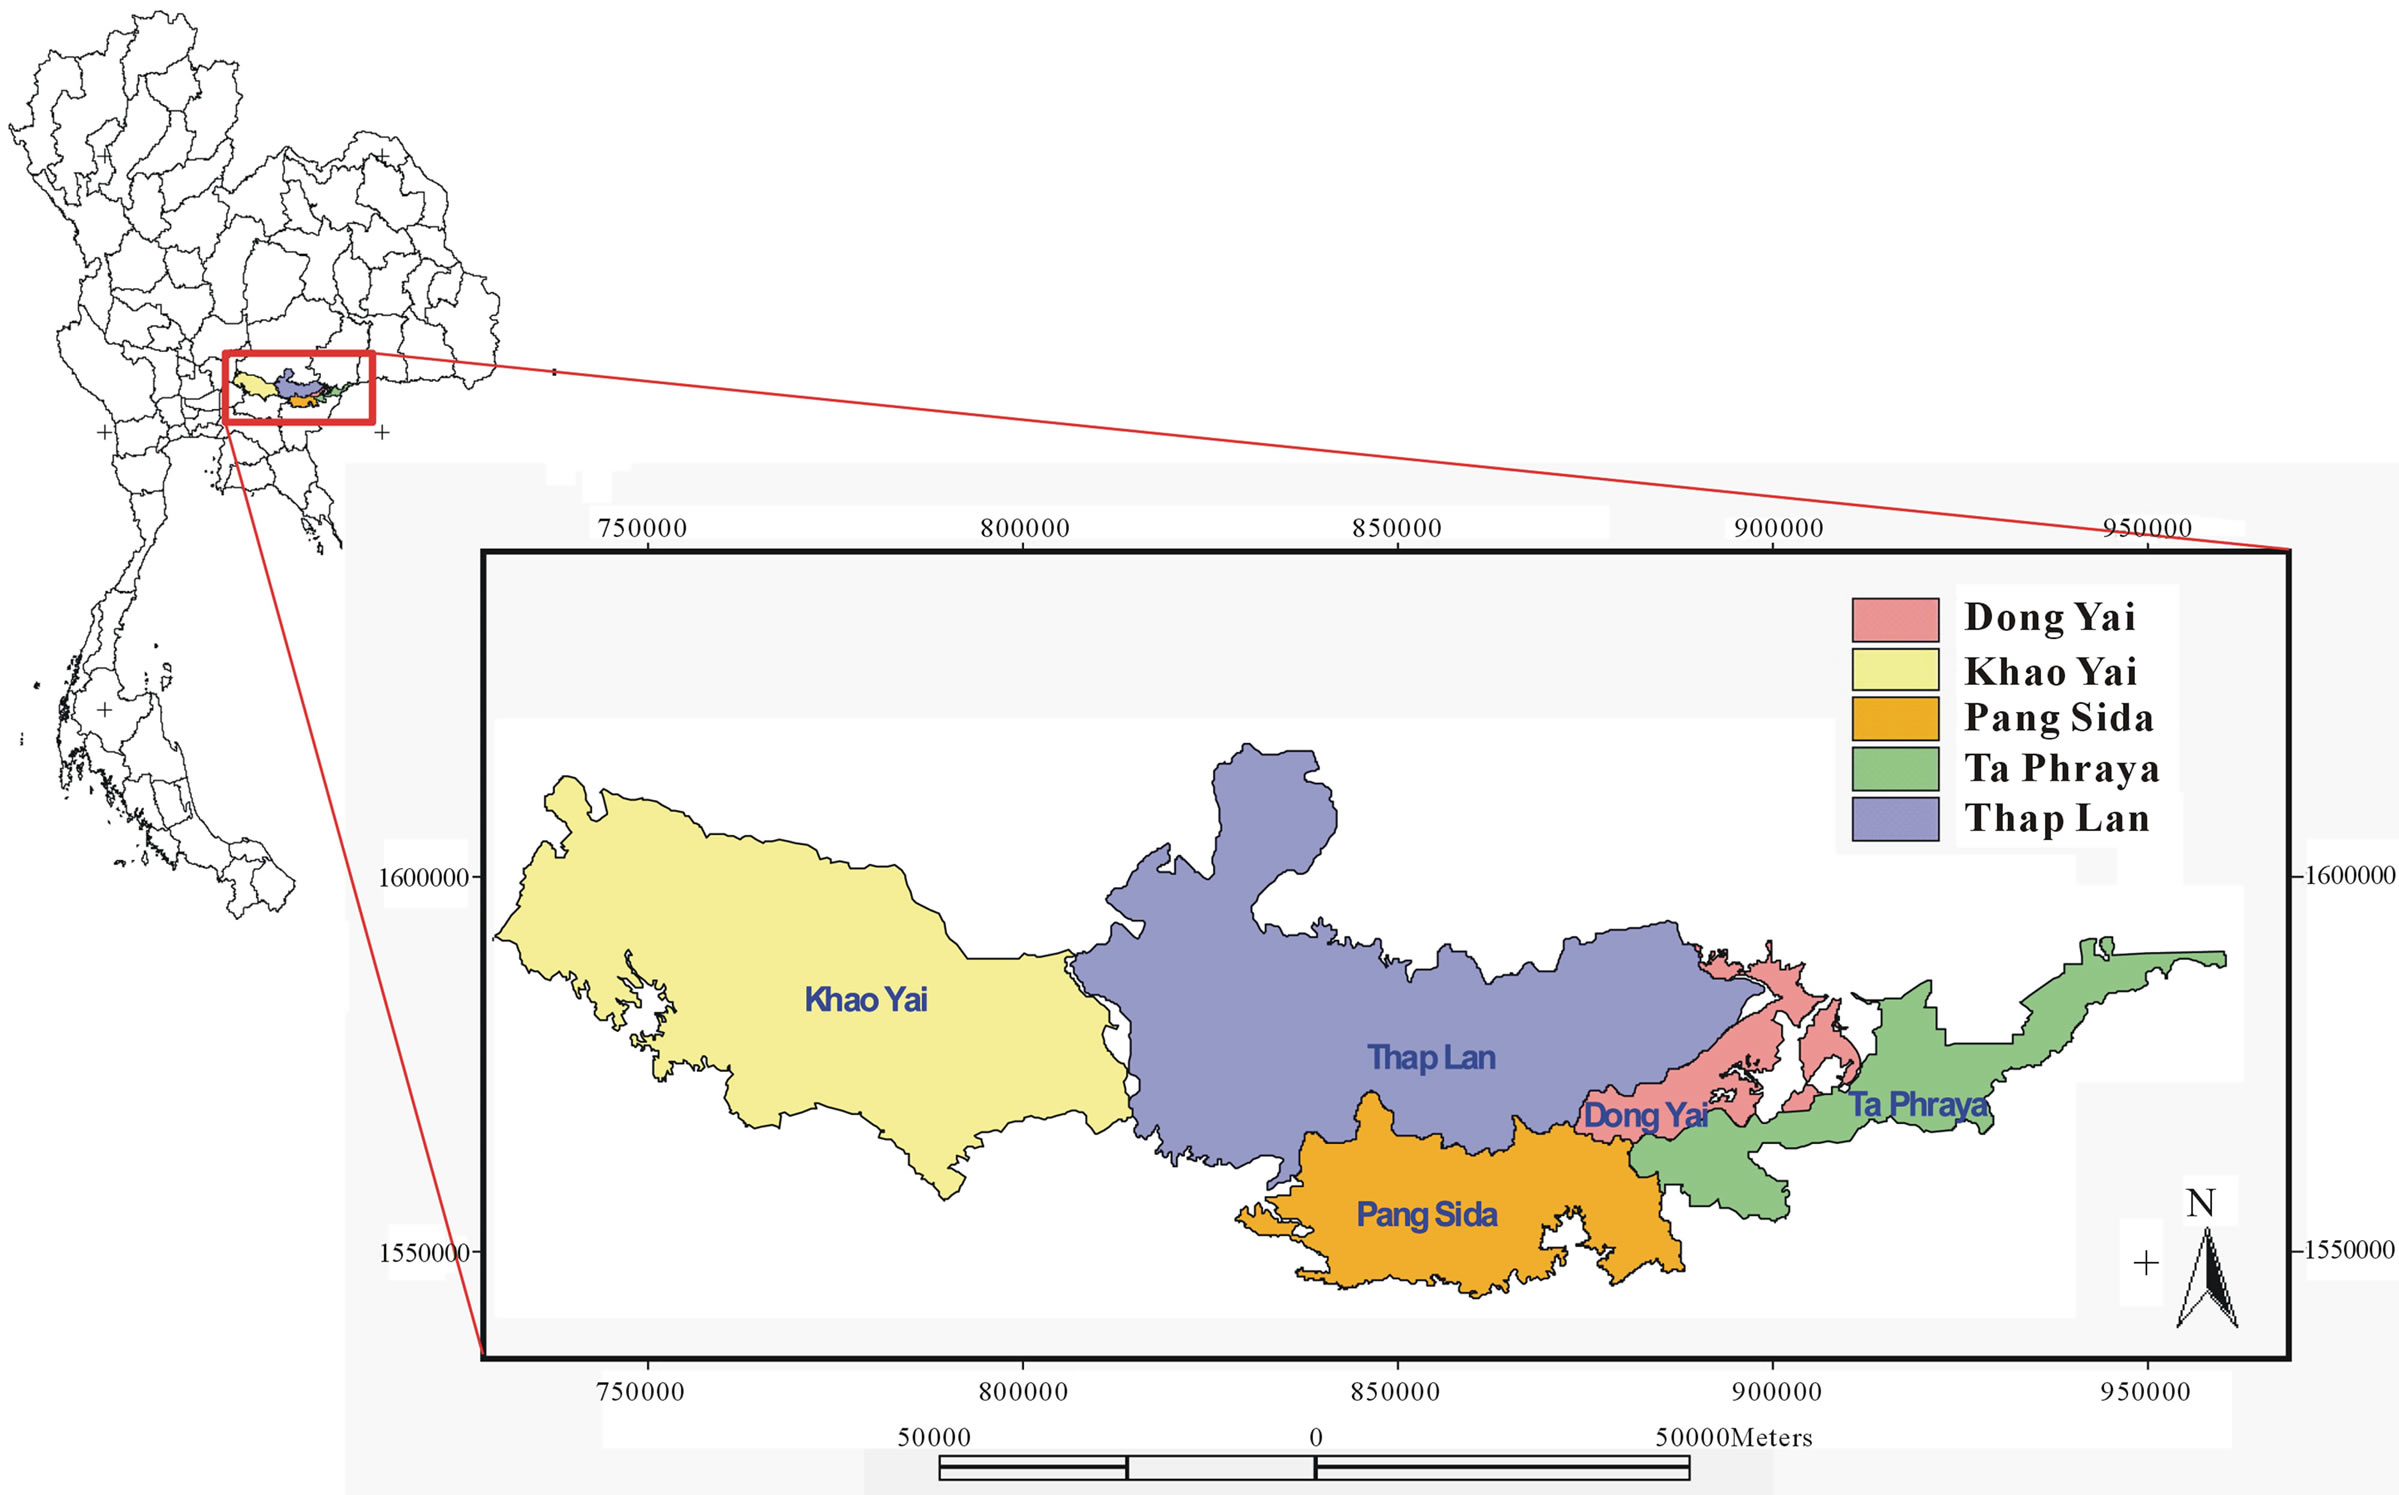
Figure 1. Map of Thailand and study area.
soil properties [9]. We applied fuzzy probability theory [10] to model each forest type. The predicted forest types were compared with the actual classifications by the Royal Forest Department in Thailand, 2002 [11]. Finally, climate scenario under A2 and B2 [4] during the years 2000-2040 was performed with the predicted forest model.
4. RESULTS
4.1. Plant Species
Plant species were identified according to the guidelines of Gardner et al. [12]. A local expert and plant taxonomist from the Royal Forest Department found that TL was the most abundant species (332 species), followed by PD (293 species), KY (271 species), DY (169 species), and TY (99 species), respectively.
4.2. Important Value Index (IVI) in Plant Communities
There exists high forestry biodiversity in each national park. Therefore, we presented only the top five of the highest IVI values of each species in a study area as follows (Table 1).
4.3. Cluster Analysis
By using IVI values to assign sample units to groups based on redundant response patterns, we classified our samples units into 7 groups (Figure 2).
Group 1 is the largest and comprises types KY, TL, PD, DY, and TY. These include KY-HEF, KY-DEF, KY-MEF; TL-MEF, TL-MDF, TL-DEF, TL-PF and TL-HEF; PDMEF, PD-DEF; DY-DEF, DY-MDF; TY-DEF. Most forest types of this group are characteristically high in moisture. Group 2 consists of only KY_DDF, Group 3 of only DY_GL, Group 4 of PD_MDF and TY_MDF. Moreover, Group 5 is composed of mostly dry dipterocarp forest (DDF) except the dipterocarp forest in KY that is placed in Group 2. Group 6 consists of KY_MDF, PD_SF, KY_SF, and KY_GL. Group 7 incorporates PD_GL and TY_GL.
By using two-way cluster analysis, we discerned that the dominant species of each evergreen forest is distinct. This infers that each forest type is the same, but the dominant plant species is different, highlighting species diversity (Figure 3).
4.4. Canonical Correspondence Analysis (CCA)
Fourteen soil parameters in four depths (0 - 30, 30 - 60, 60 - 90, >90 cm) were tested by correlation coefficient to find the best representative parameter before further analysis (CCA). We found that OM, OC, TOC, and N ex-
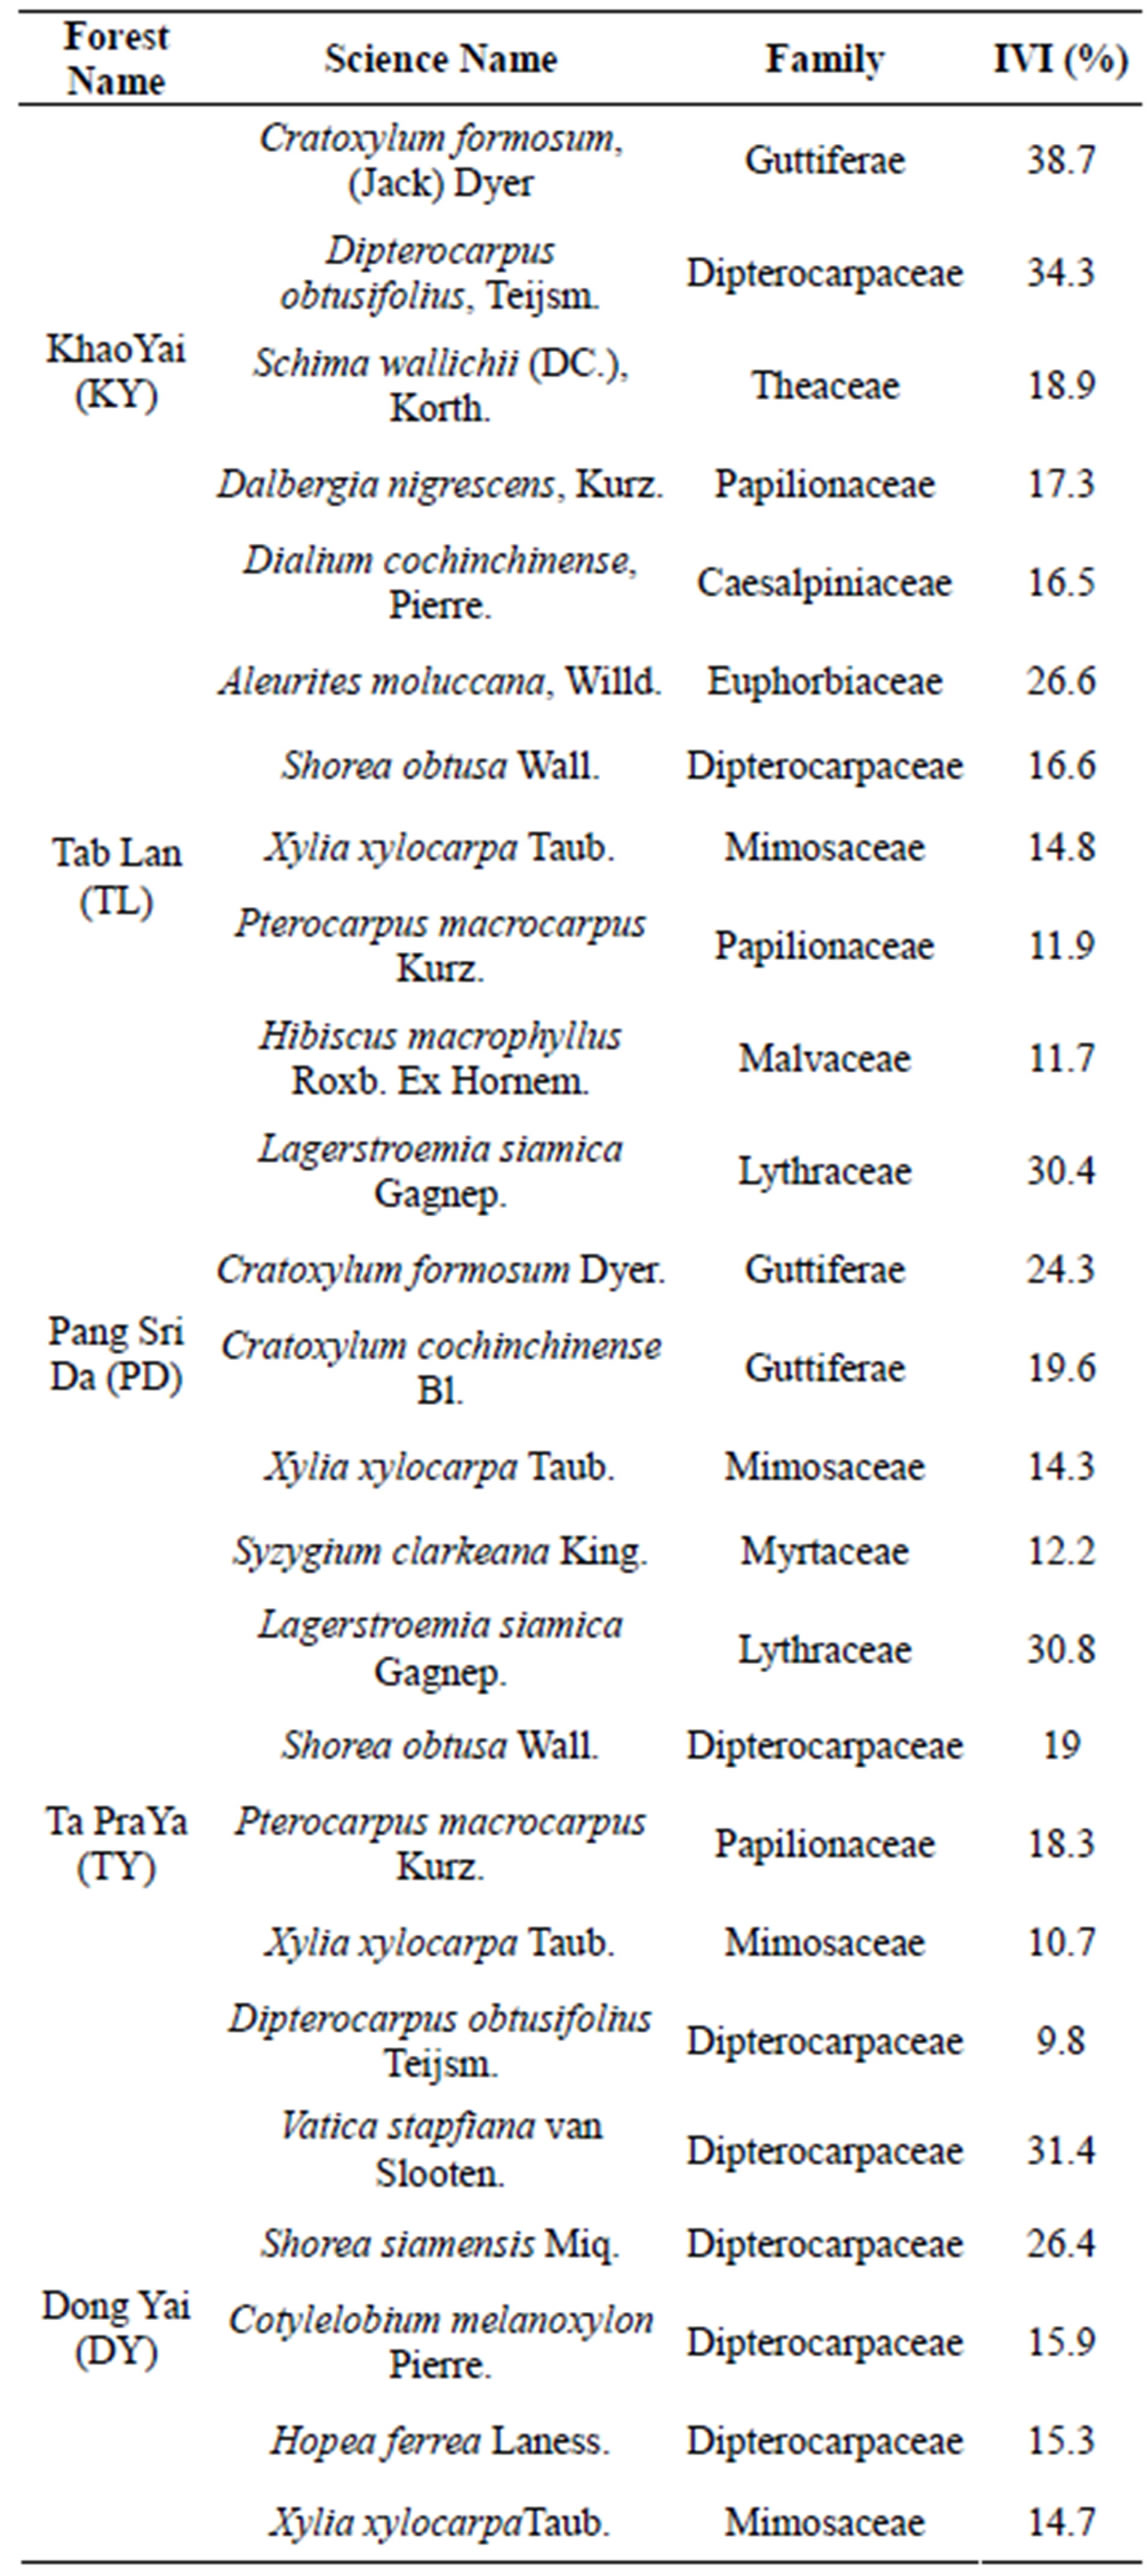
Table 1. List of the top five of the highest IVI values.
hibited high correlation (r > 0.9; p < 0.01) for every soil depth parameter. OM was there representative parameter used to calculate the correlation. pH and phosphorus content have high positive correlations (r > 0.6; p < 0.01) for every soil depth. We thus selected pH as a representative parameter to calculate the correlation. CEC, sand and clay also exhibit high correlations (r > −0.7; p < 0.01) for every soil depth, and we subsequently chose sand as a parameter to calculate further correlations. In summary,
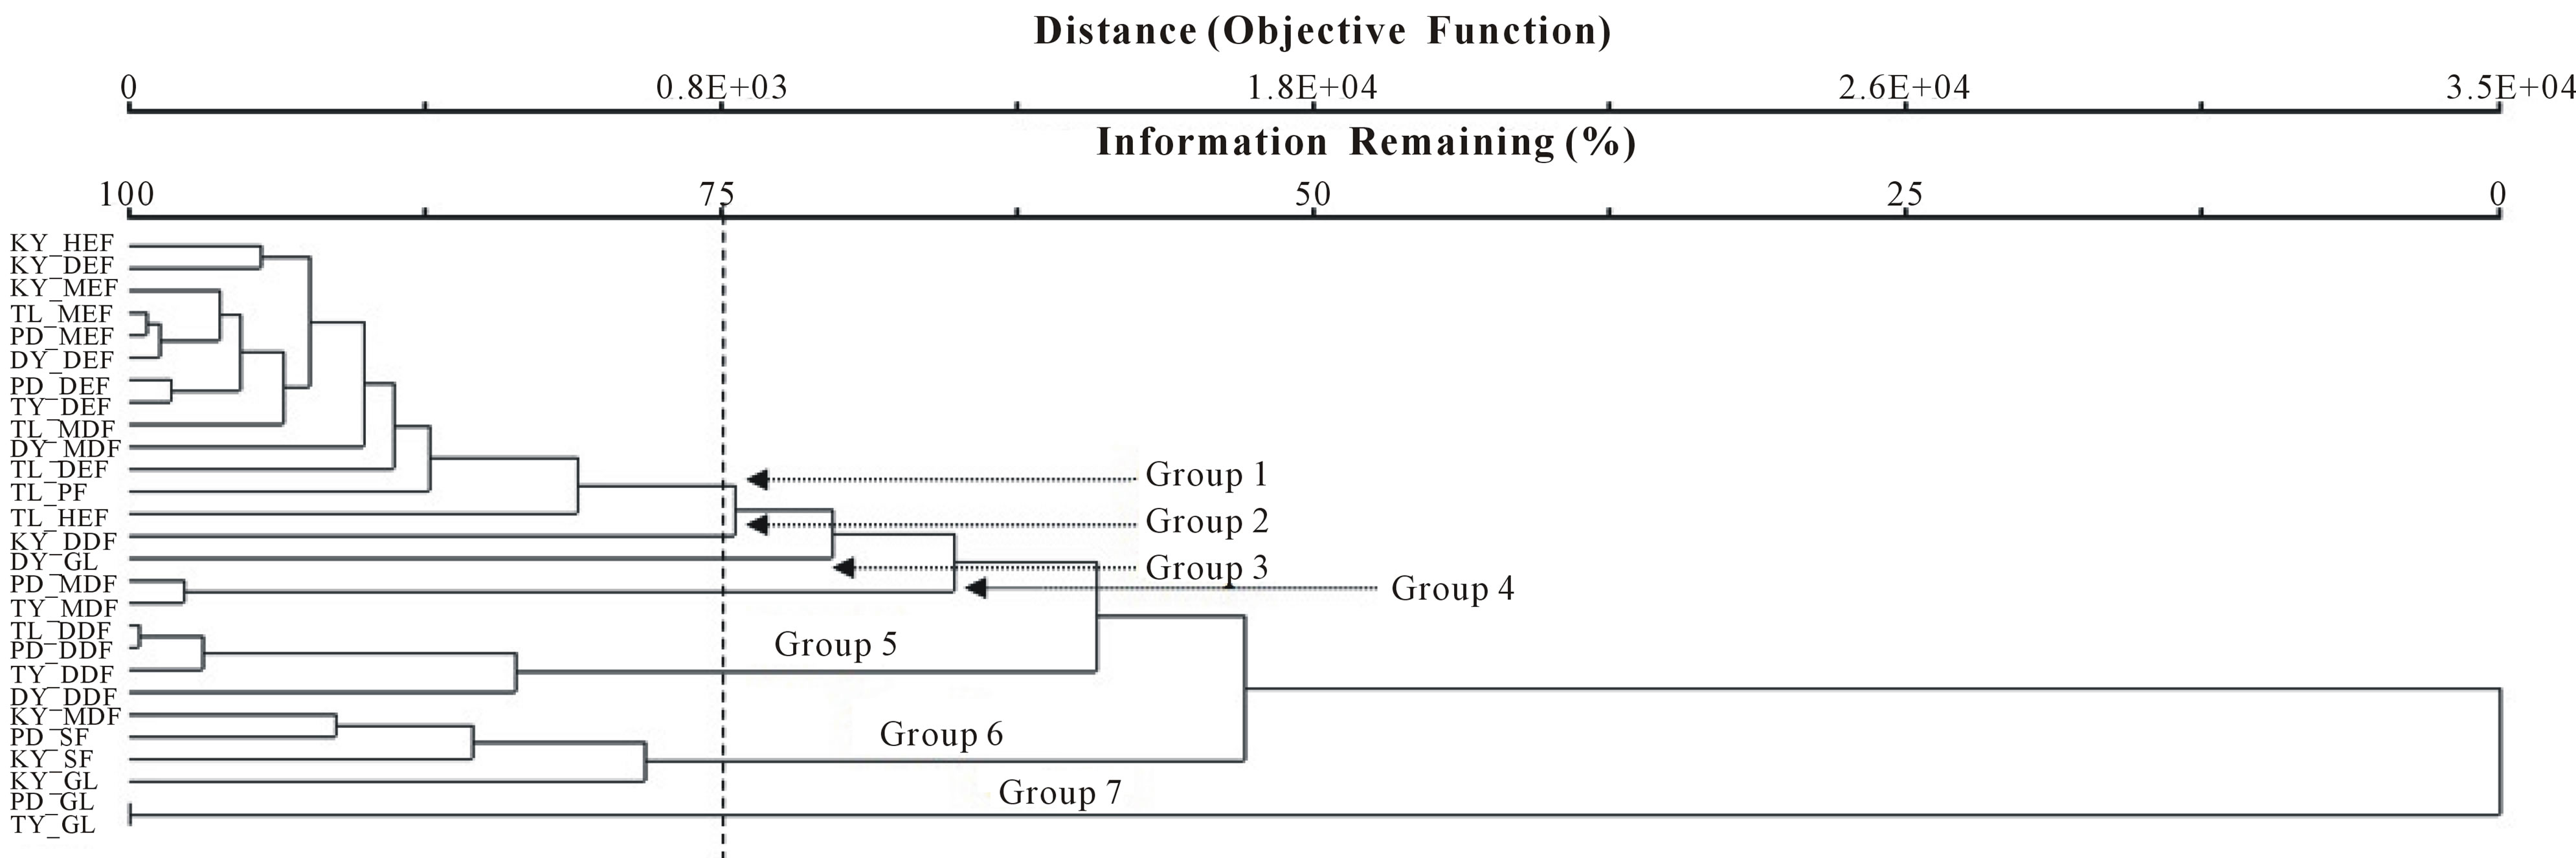
Figure 2. Cluster analysis.
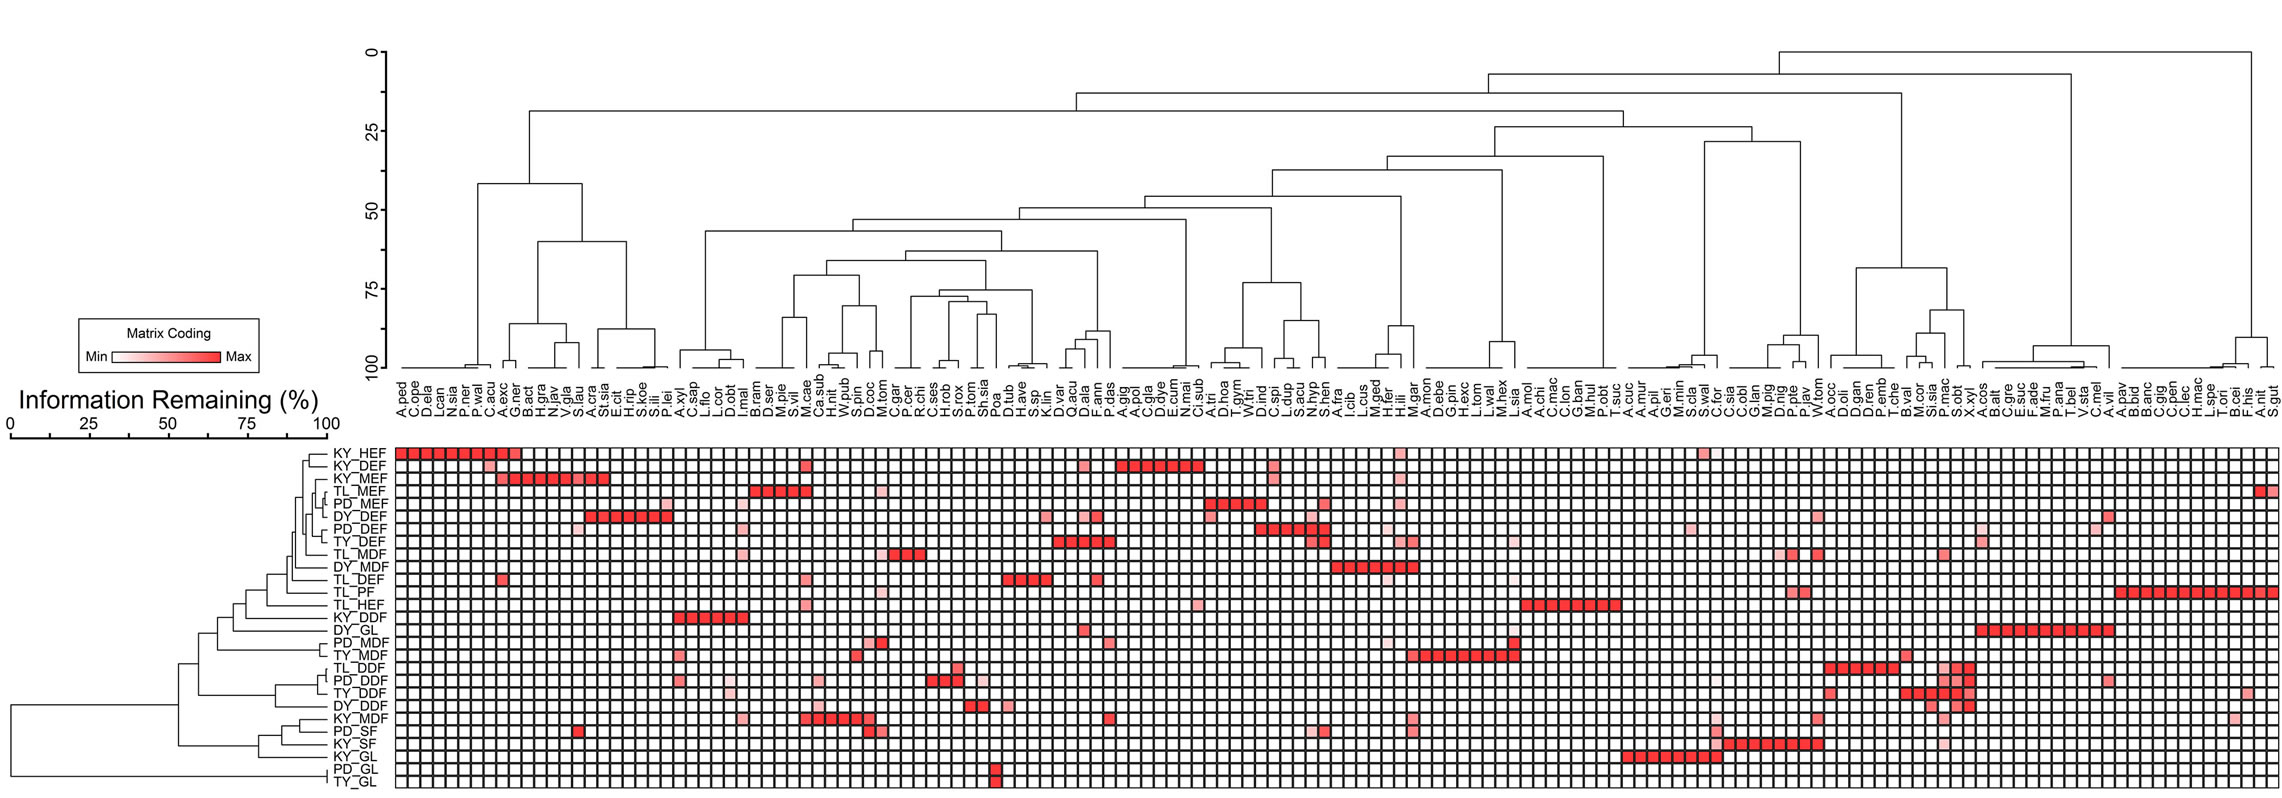
Figure 3. Two-way analyses for evergreen forest.
all parameters used for further calculations are pH, OM, K, Mg, Ca, sand, silt, and bulk density (Tables 2 and 3).
We selected the higher correlation value with plot score, pH (R = 0.939 at Axis 2), and OM (R = −0.699 at Axis 1). For the second calculation, we included above ground carbon (ABGtc) for each forest type.
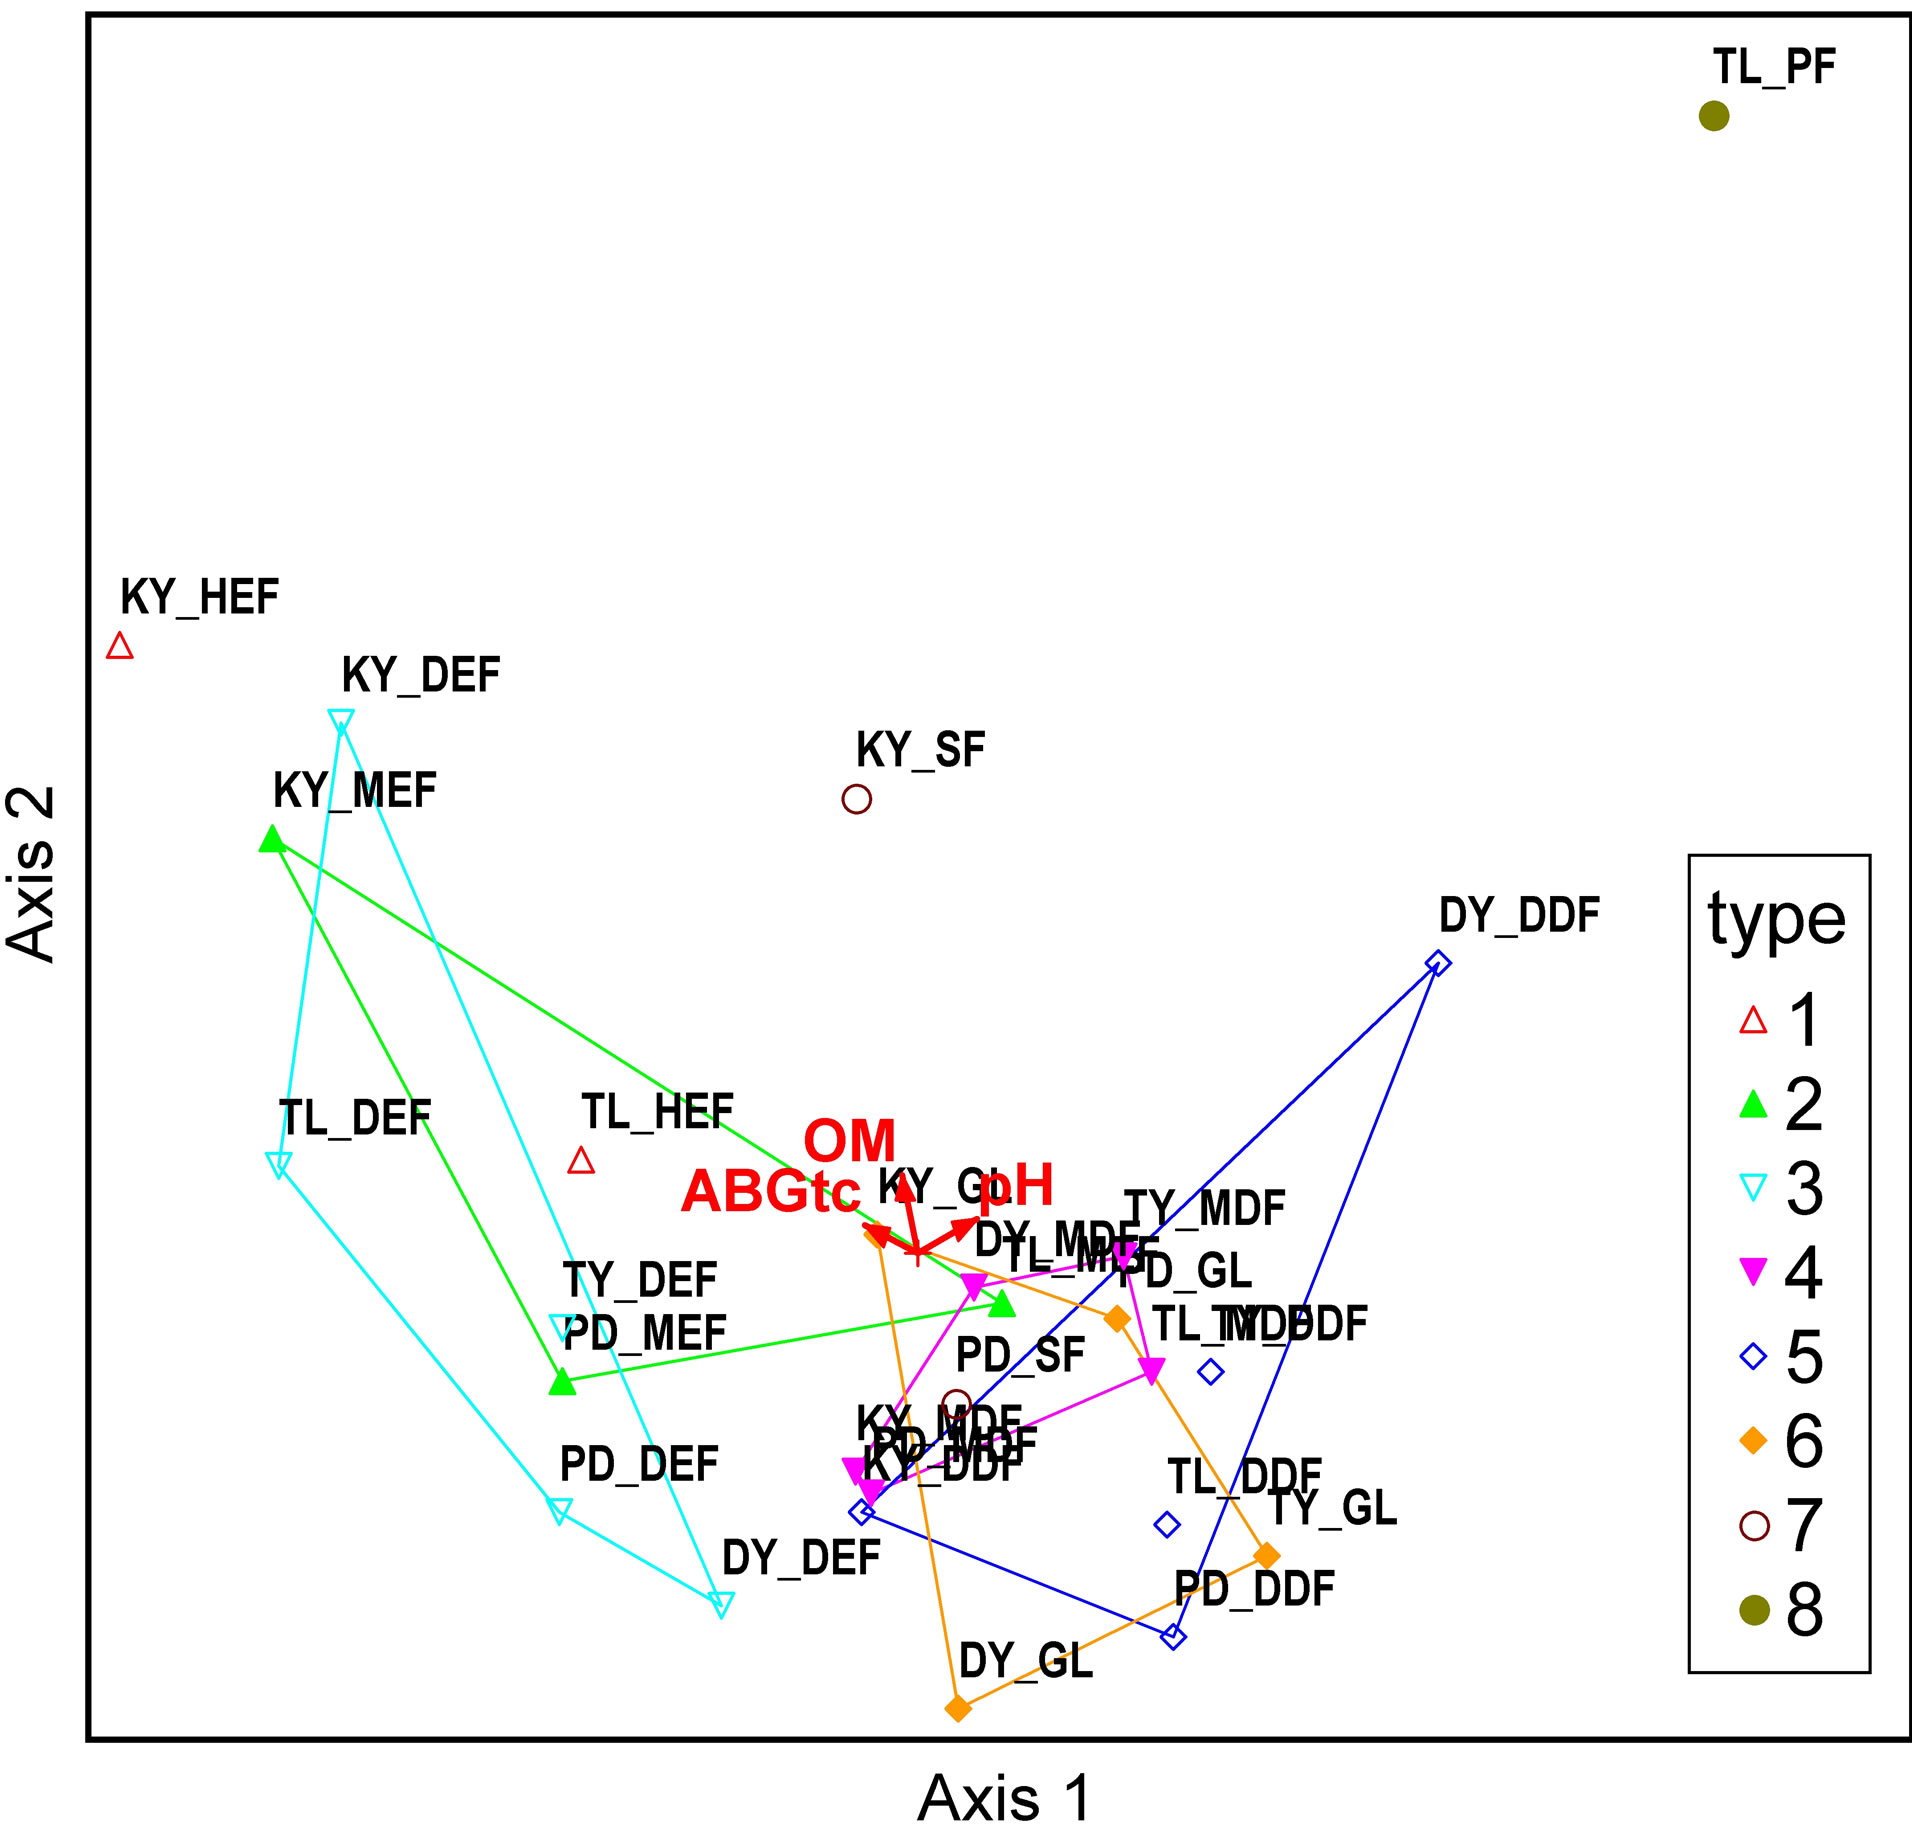
Figure 4 shows, unambiguously, that forest types HEF, DEF, MEF, MDF, DDF, GL, SF, and PF were located from left to right, a placement consistent with organic matter (OM). The correlation between Axis1 and aboveground carbon is negative (R = −0.797) and pH is positive (R = 0.835) (Tables 2 and 3). The evergreen forest had higher moisture content, consistent with potential to store high amounts of organic matter.
4.5. Total Carbon Content
Highest total carbon content, including aboveground and total soil carbon, was in KY (2507.6 tC/ha), followed by TL (1613.8 tC/ha), PD (1269.1 tC/ha), TP (844.02 tC/ha), and the smallest amount existed for DY (810.7 tC/ha). The highest of aboveground carbon content was found to be in DEF (359.2 tC/ha) at TL, followed by MEF (321.5 tC/ha), and HEF (273 tC/ha) at KY. We
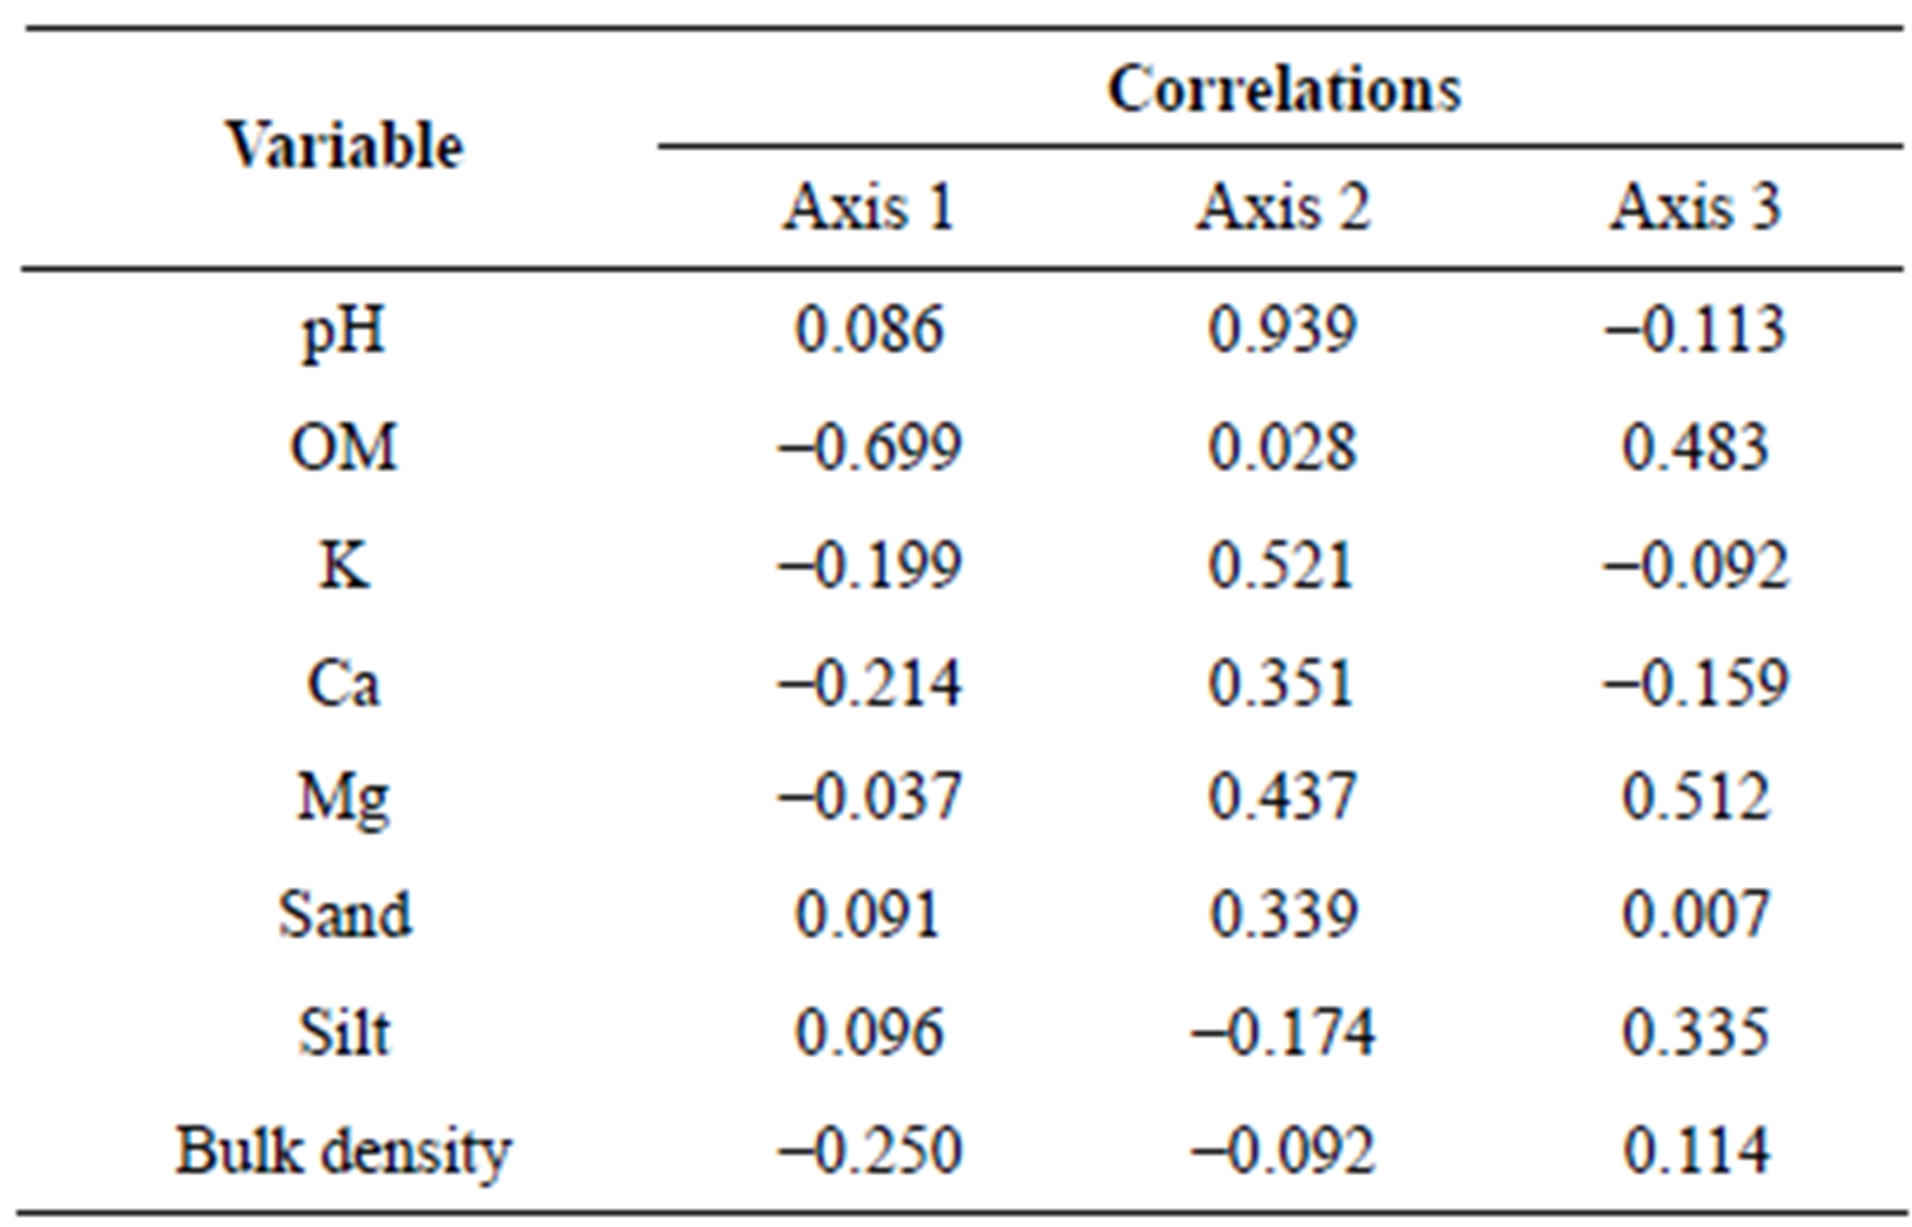
Table 2. Correlation matrix between variables and each axis.
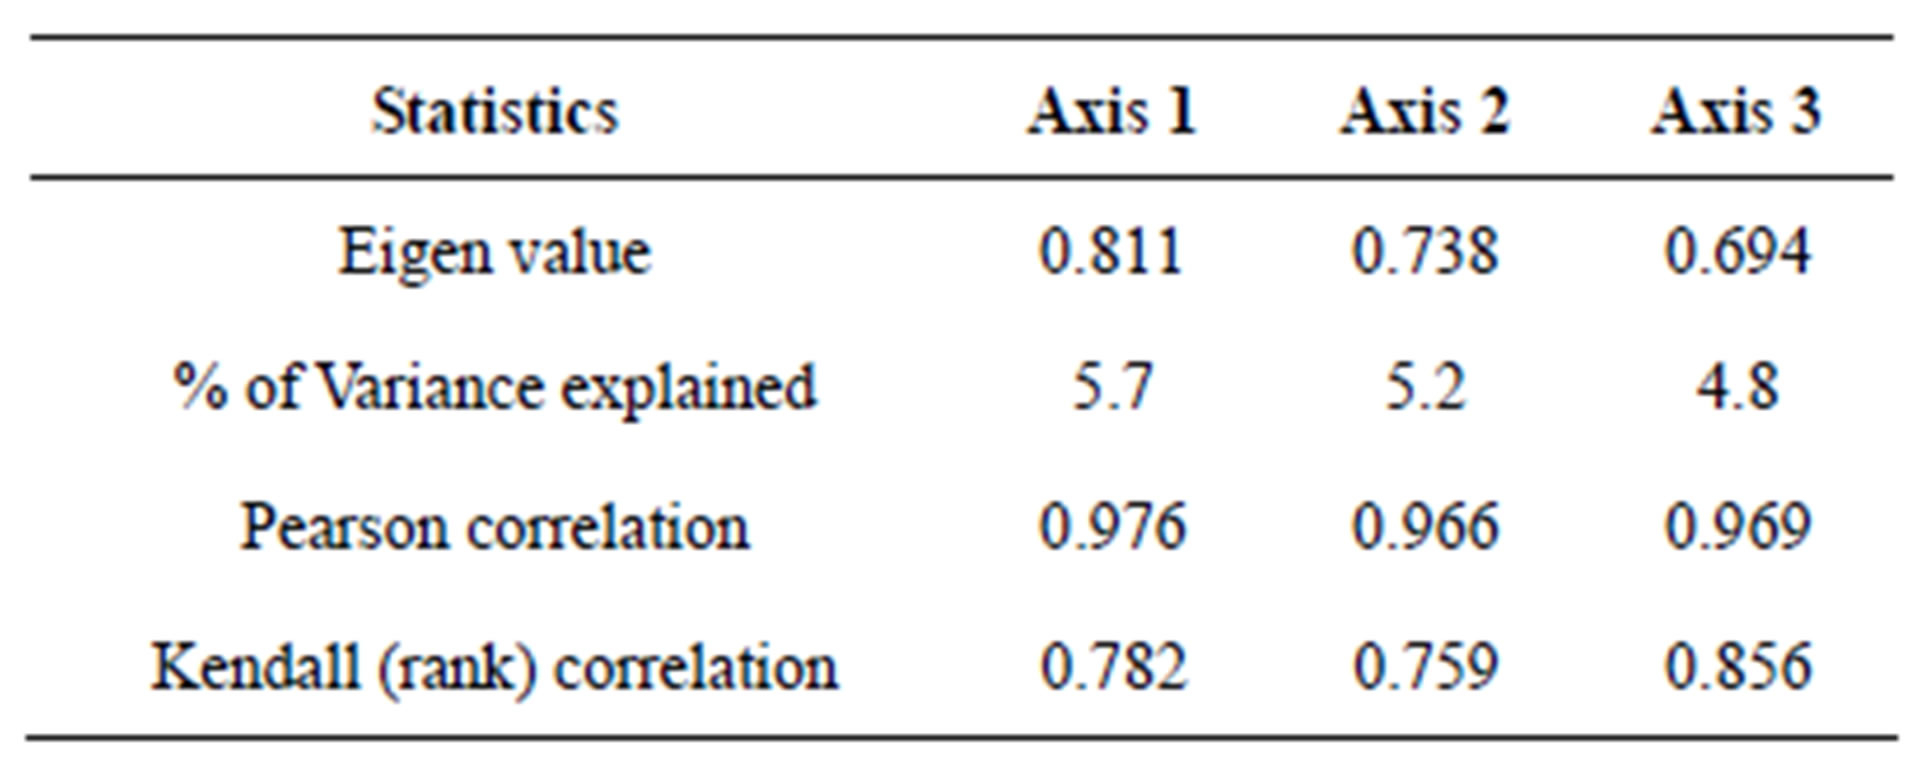
Table 3. Axis summary statistics.
 (a)
(a)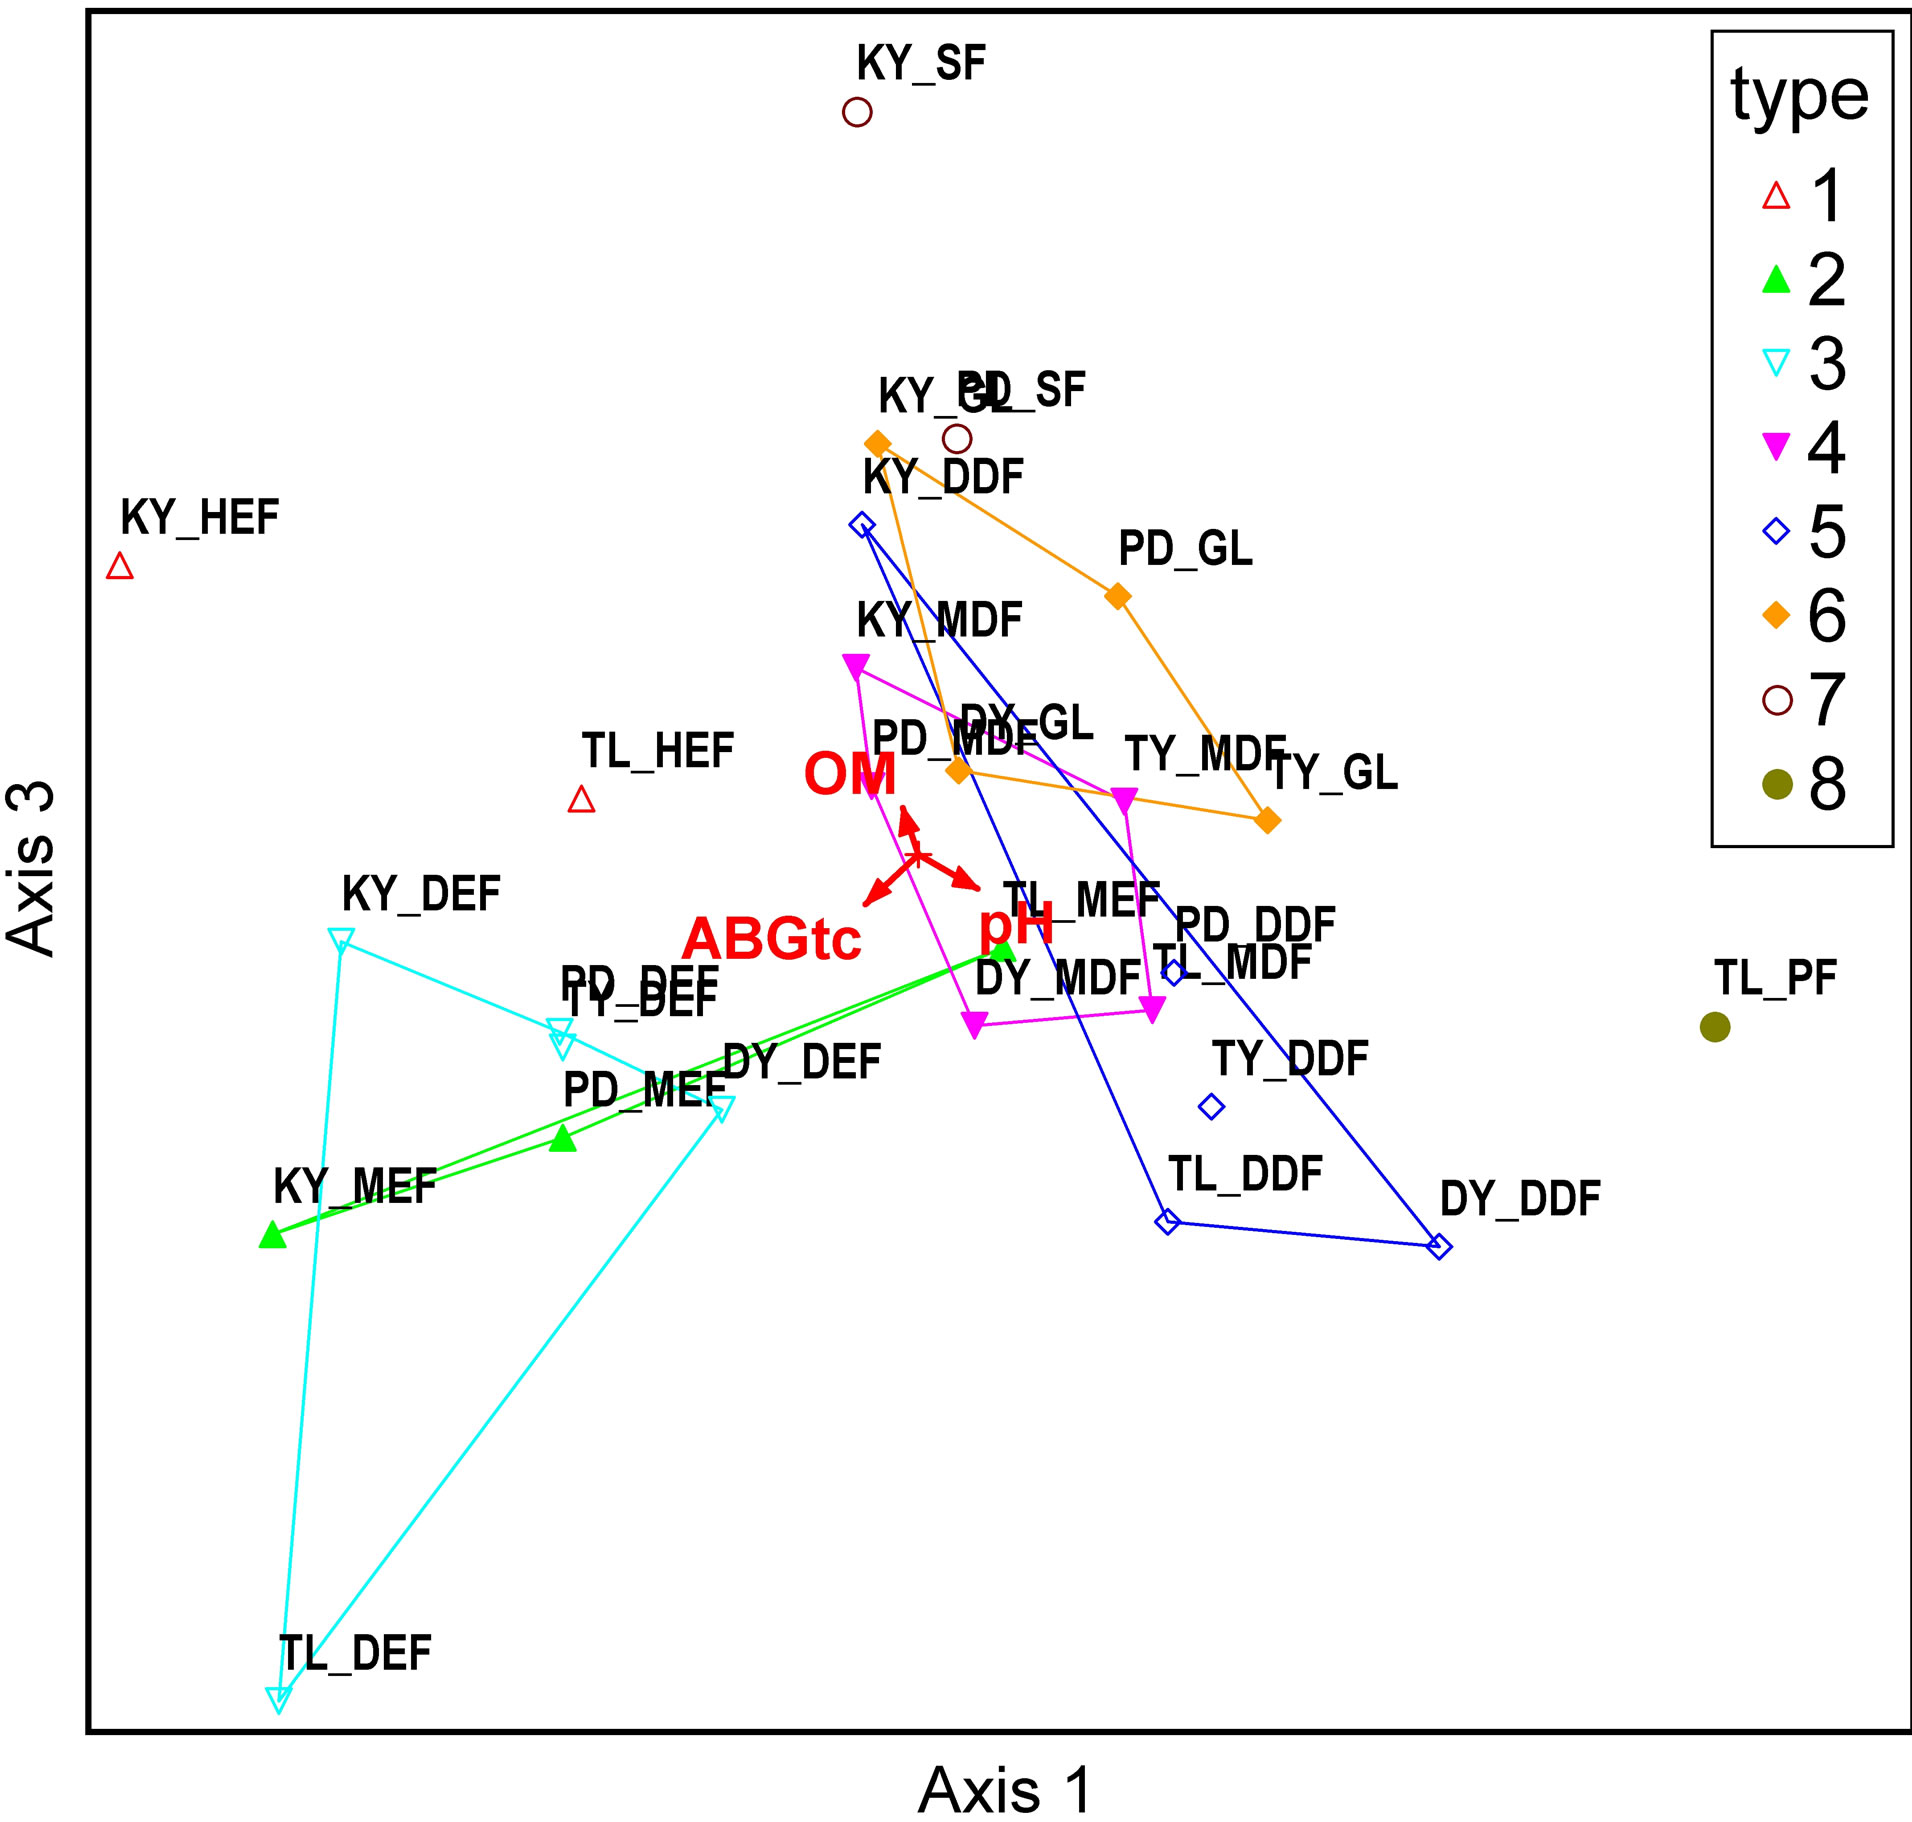 (b)
(b)
Figure 4. Correlation between variables in each forest type: Axes 1 and 2 (a), and Axes 1 and 3 (b). Note: 1 = HEF, 2 = MEF, 3 = DEF, 4 = MDF, 5 = DDF, 6 = GL, 7 = SF, 8 = PL.
found total SOC to be highest in HEF (278.8 tC/ha), followed by SF (272.3 tC/ha) and PL (227.8 tC/ha), respectively (Figure 5).
4.6. Changing Forest under the Climate Scenarios
Predicted forest types in Dong Pra Ya Yen-Khao Yai were computed by accounting for different environmental factors (elevation, soil depth, annual rainfall, wet period, mean temperature, evaporation, and precipitation
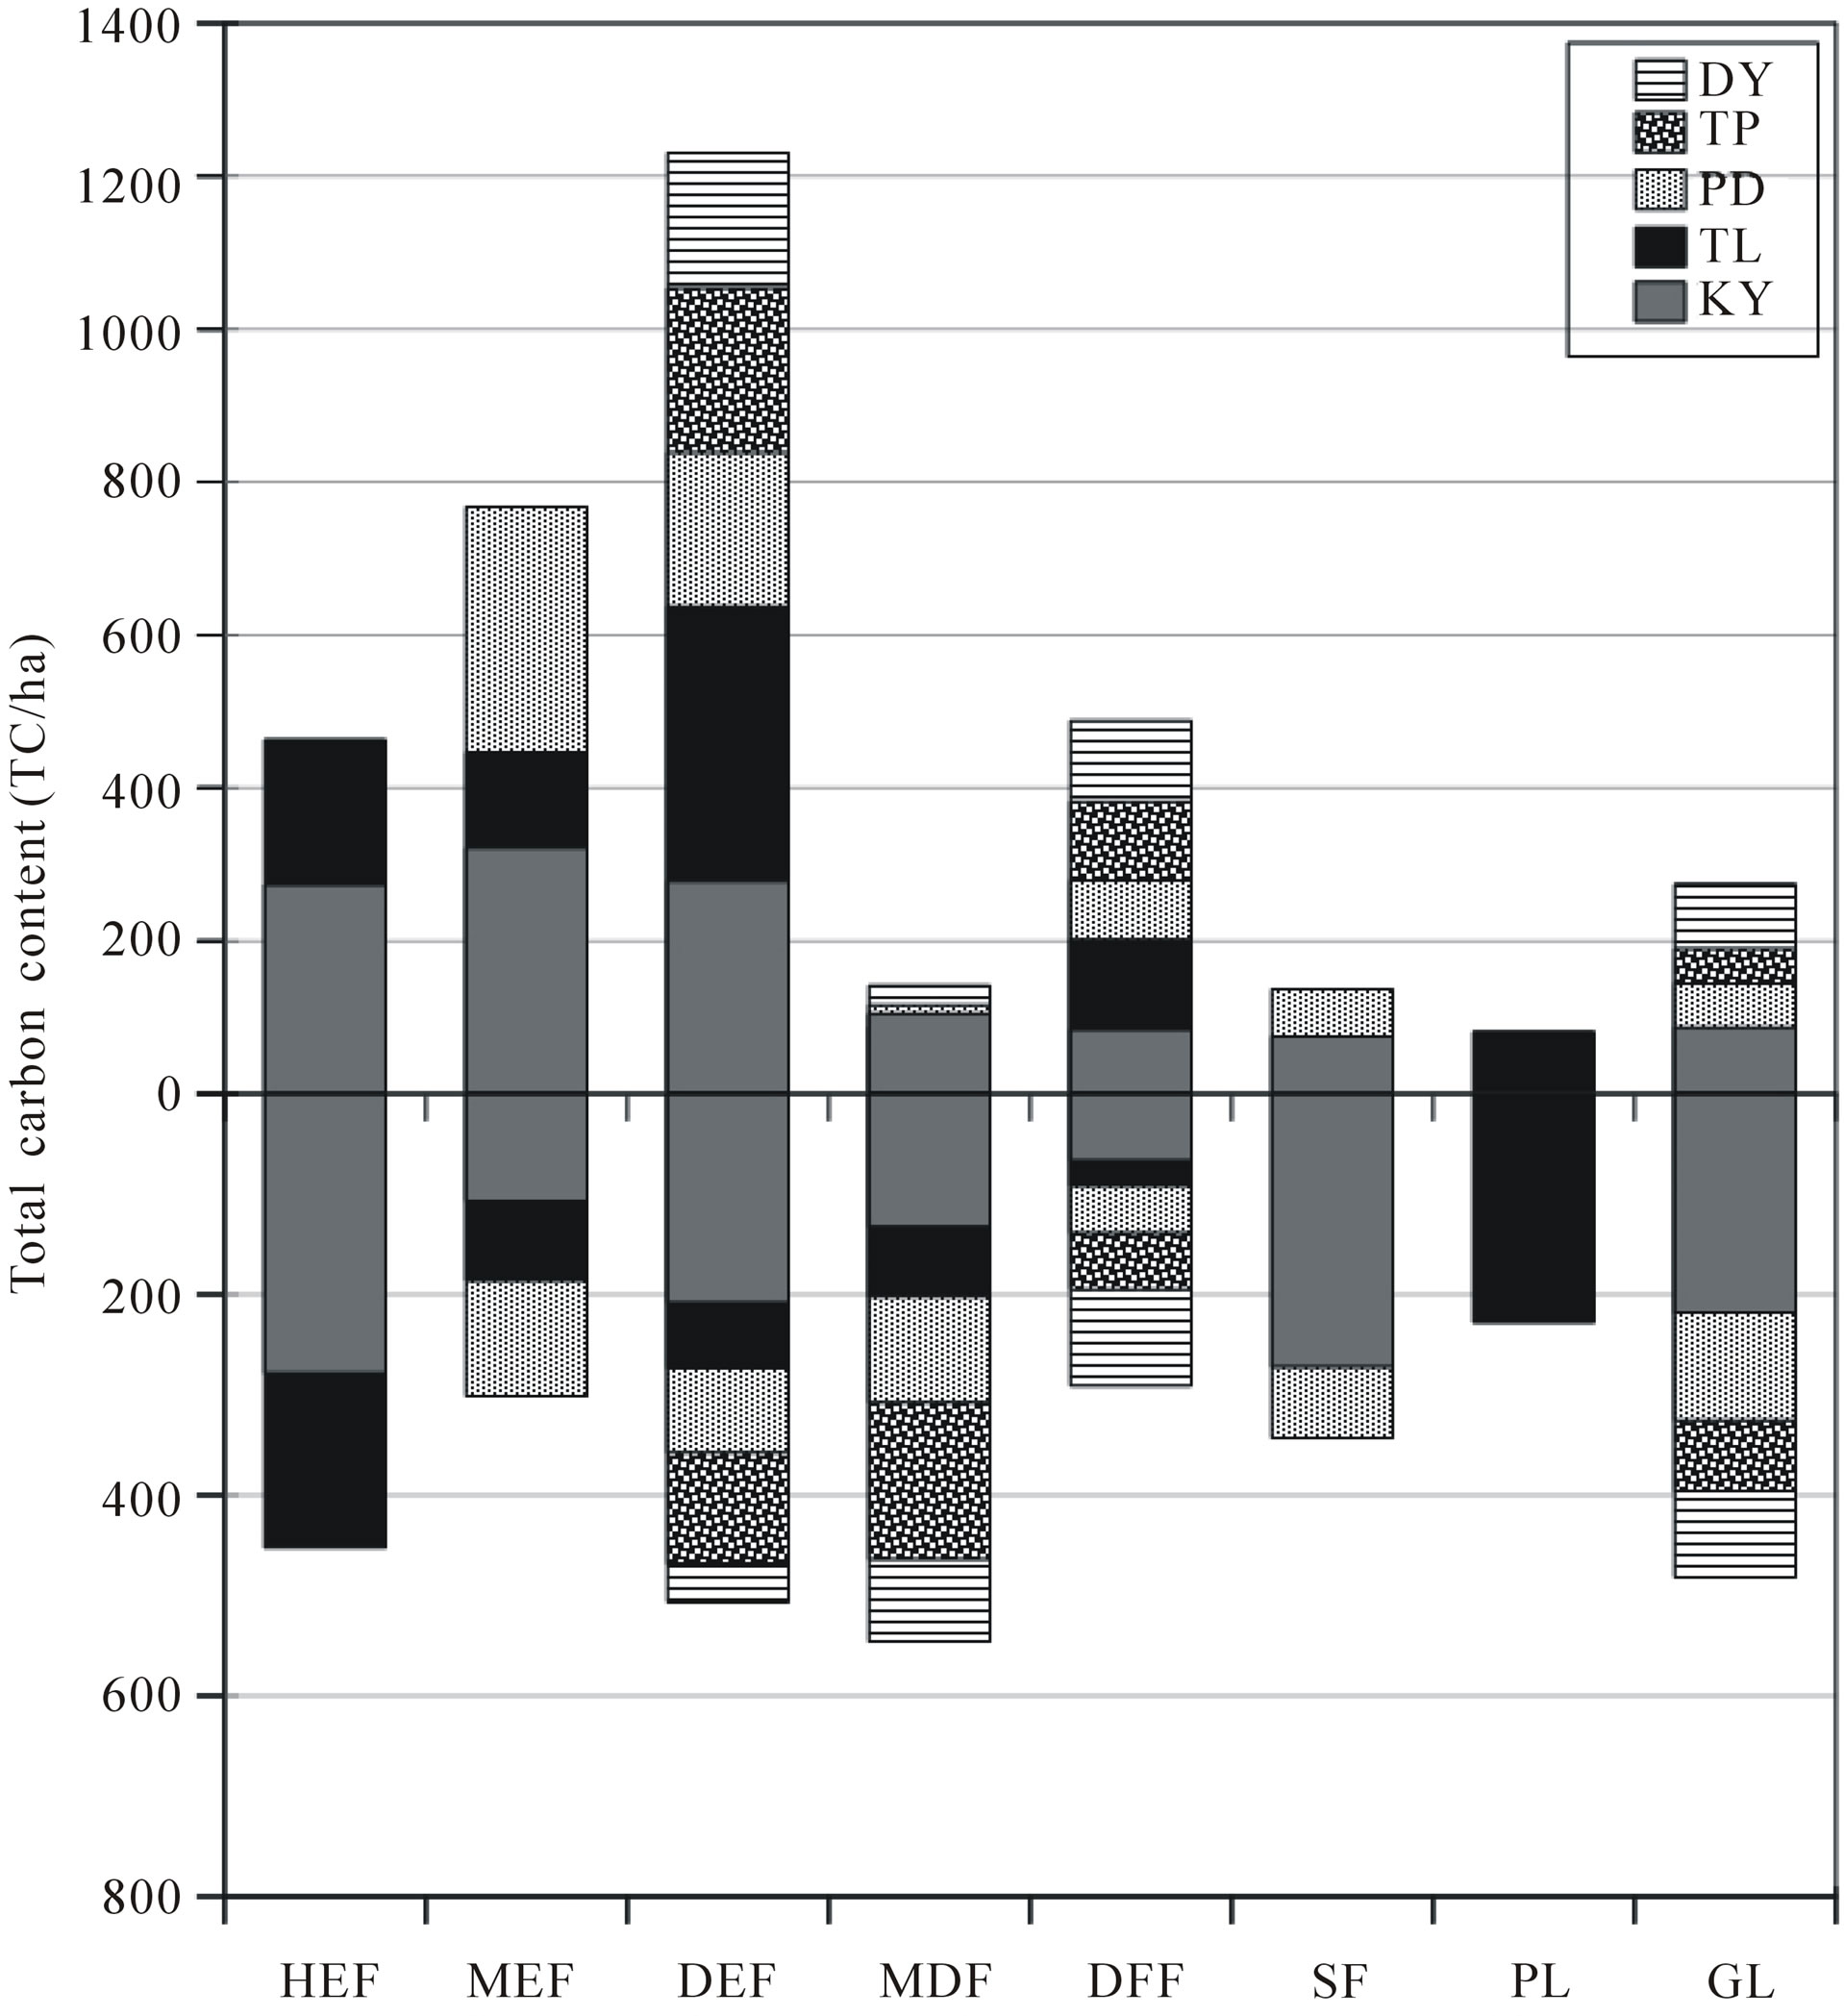
Figure 5. Total carbon content (tC/ha) of each forest type.
ratio) and applying GIS techniques. We used our predicted forest types for a base map (2000). The output climate data scenarios, A2 and B2, from 2000 and 2030- 2039 were used as input data to eventually obtain predictions of future forest types based on these climate scenarios.
4.6.1. Comparison between Actual and Predicted Forest Types
Table 4 shows a comparison between actual forest [11] and predicted forest types.
As seen in Table 4, there exists high similarity between actual and predicted evergreen forestry. This trend does not hold as true for deciduous forests. We split evergreen forests into three subtypes—MEF, DEF and MCF —according to Smitinnand [13] and Kutinatara [14] and our own surveys. Actual forest types classified by the Royal Forest Department used only satellite images and expert personal classification by ground checks. Even small distributions of forest areas are probably included in more general classifications according to this method. For example, evergreen forests were classified by only one forest type (DEF) (Table 4). This explains why our predictions can vary from the current, “actual,” method (Figures 6 and 7). We could, thus, not find a suitable source for calibration with our predicted forest model.
Note: DDF = Dry Dipterocarp Forest, DEF = Dry Evergreen Forest, HEF = Hill Evergreen Forest, MCF = Mixed Coniferous Forest and MDF = Mixed Deciduous Forest.
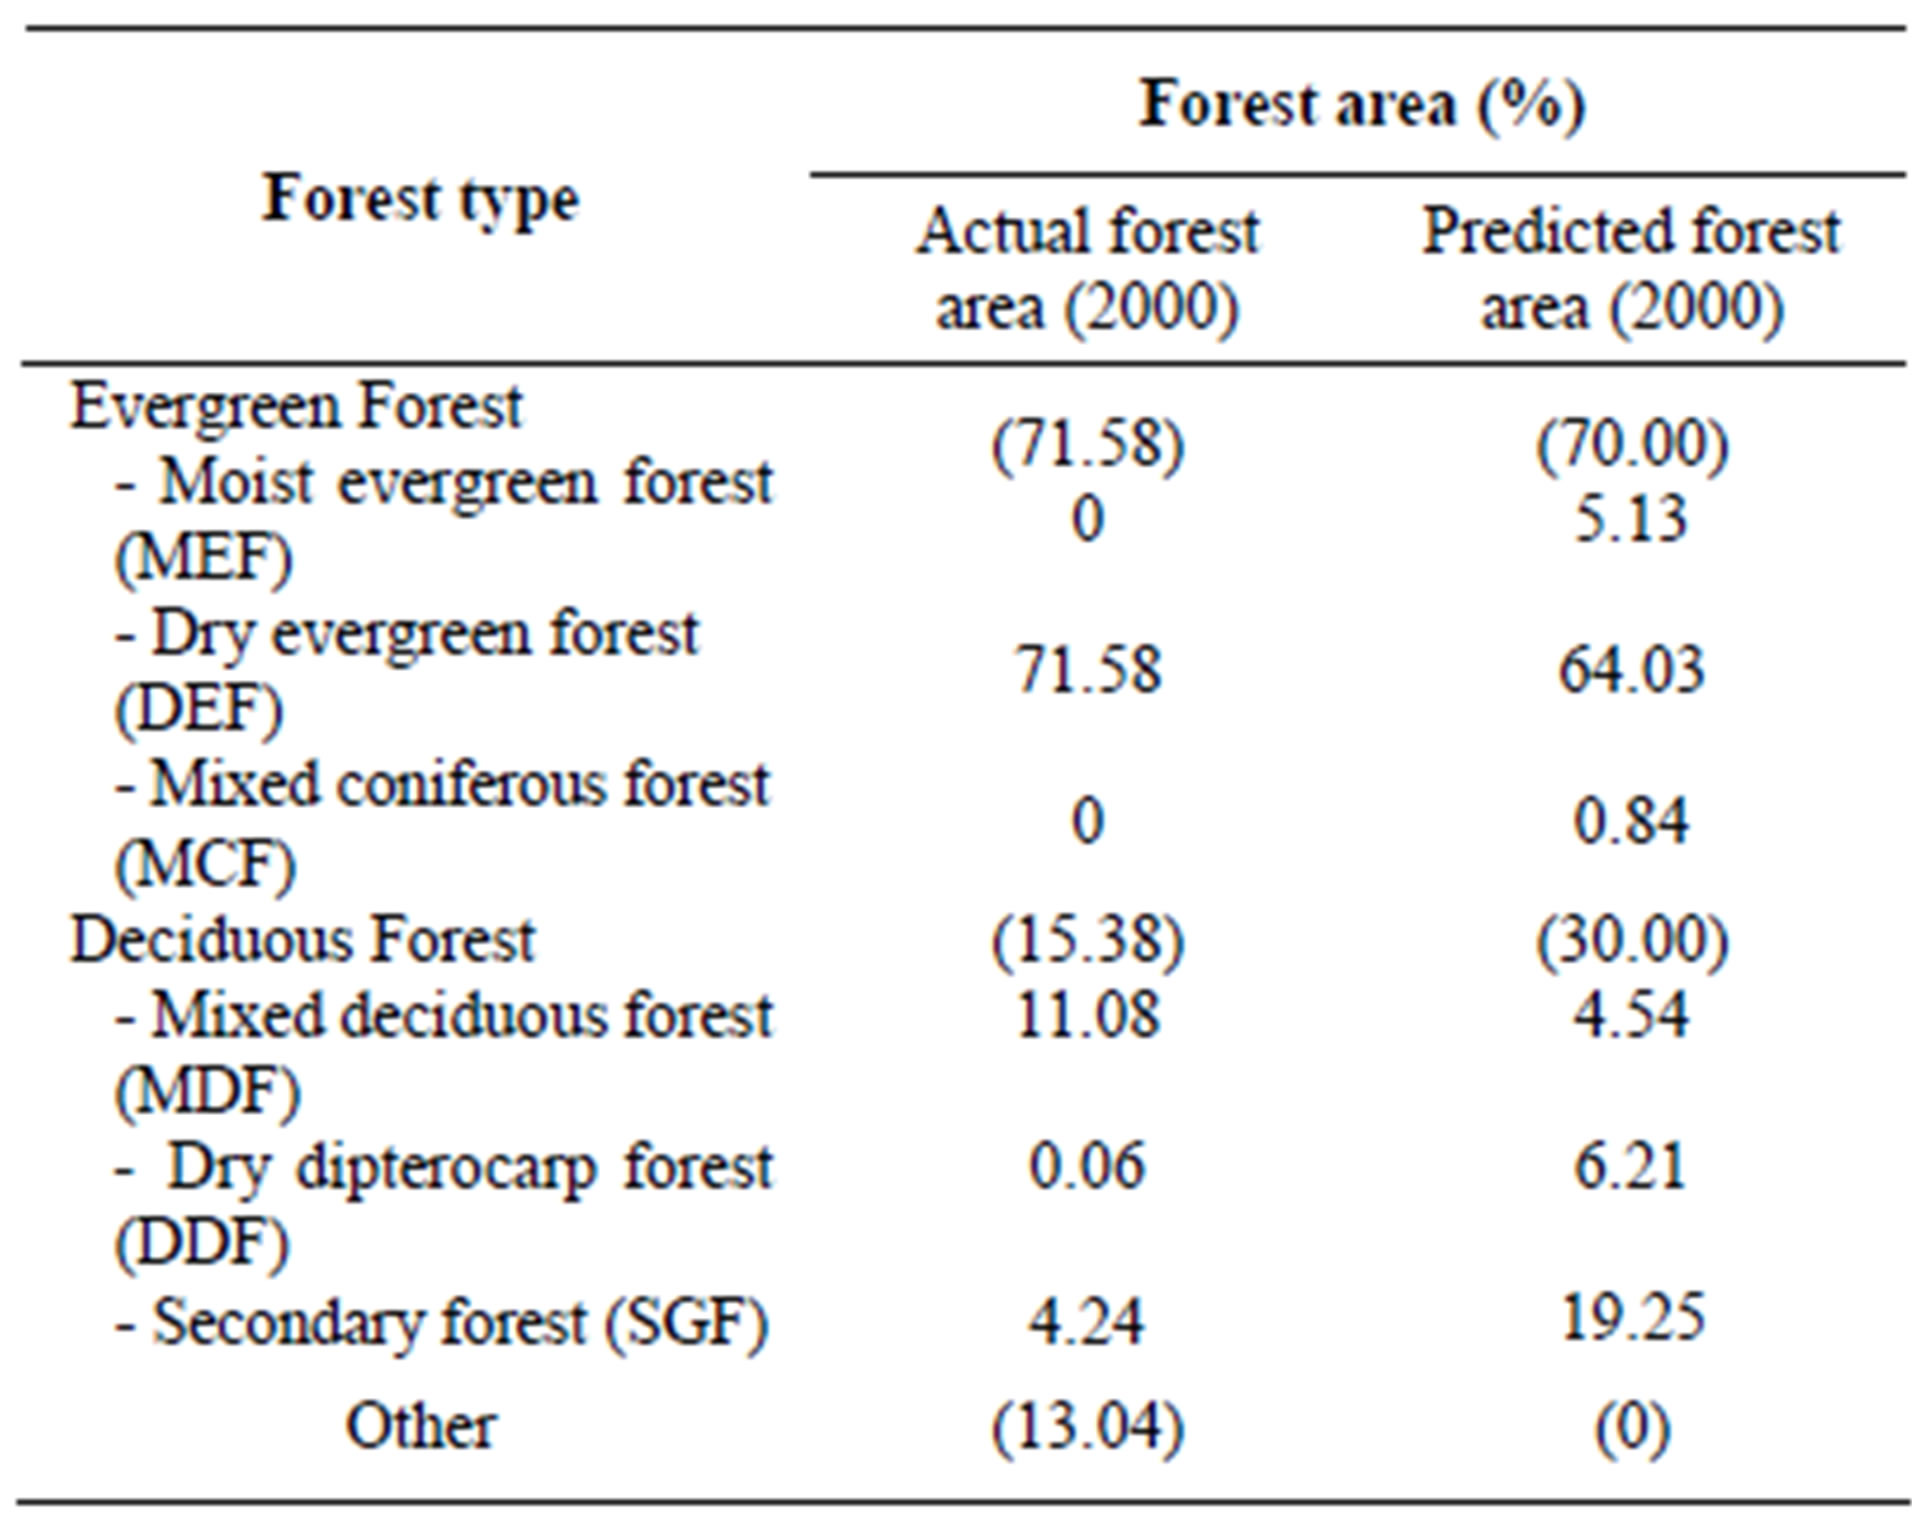
Table 4. Comparison between actual and predicted forest.
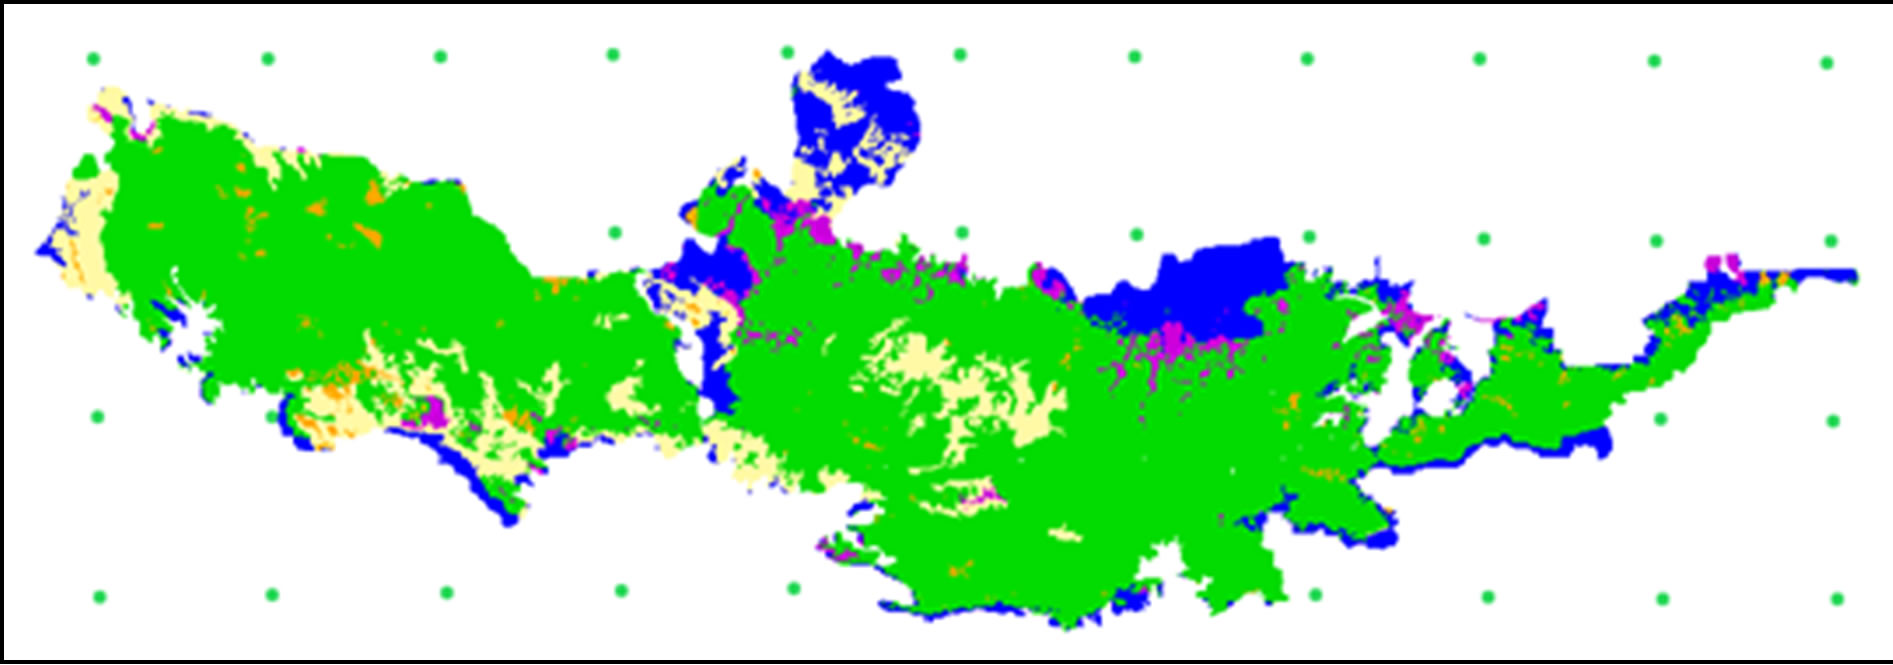
Figure 6. Actual forest type 2000 [11].
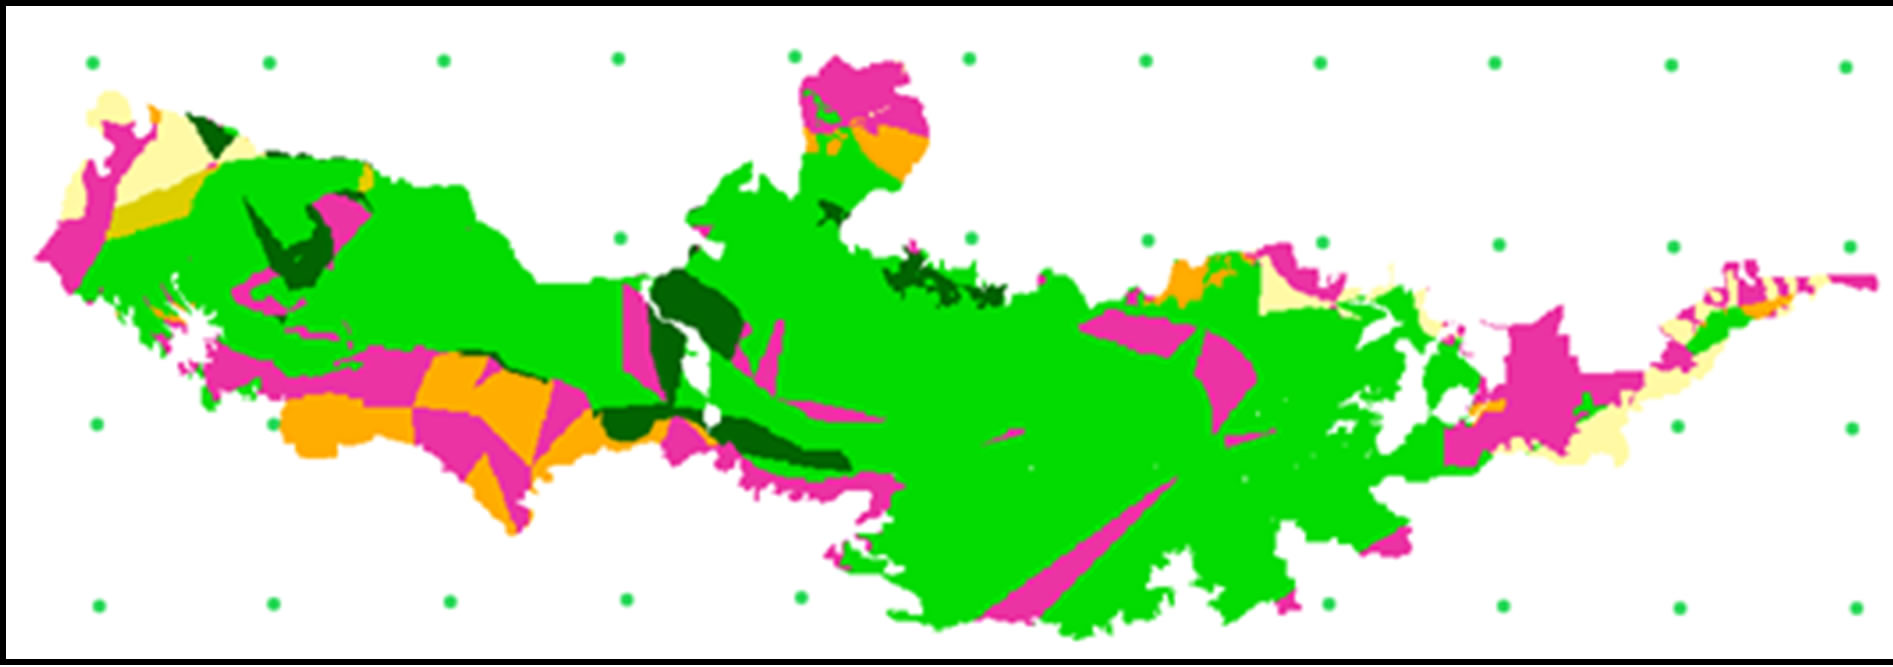
Figure 7. Predicted forest type 2000.
4.6.2. Climate Scenario under A2 and B2 and Forest Area
By using the output of climate scenario under A2 and B2 from SEA START RC [4], which provided downscaling the GCM model to a 25 km × 25 km resolution. The average temperature under A2 in 2030-2039 is predicted to be 28.41˚C, and the amount of rainfall is 1524.34 mm. Under a B2 scenario, average temperature is 27.82˚C with a 1455.23 mm rainfall. Average actual temperature and rainfall (17 meteorological stations around the study area from 2000-2009) is 28.4˚C and 1434 mm. We used forecasted rainfall and temperature from 2030-2039 as input data into our predicted forest model. Results are shown in Table 5 and Figures 8 and 9.
The basic emission scenarios or Special Report on Emissions Scenarios (A1, A2, B1, and B2) represents storylines about potential world development. In the scenario family A, economic development is the priority, while in B, environmental sustainability considerations
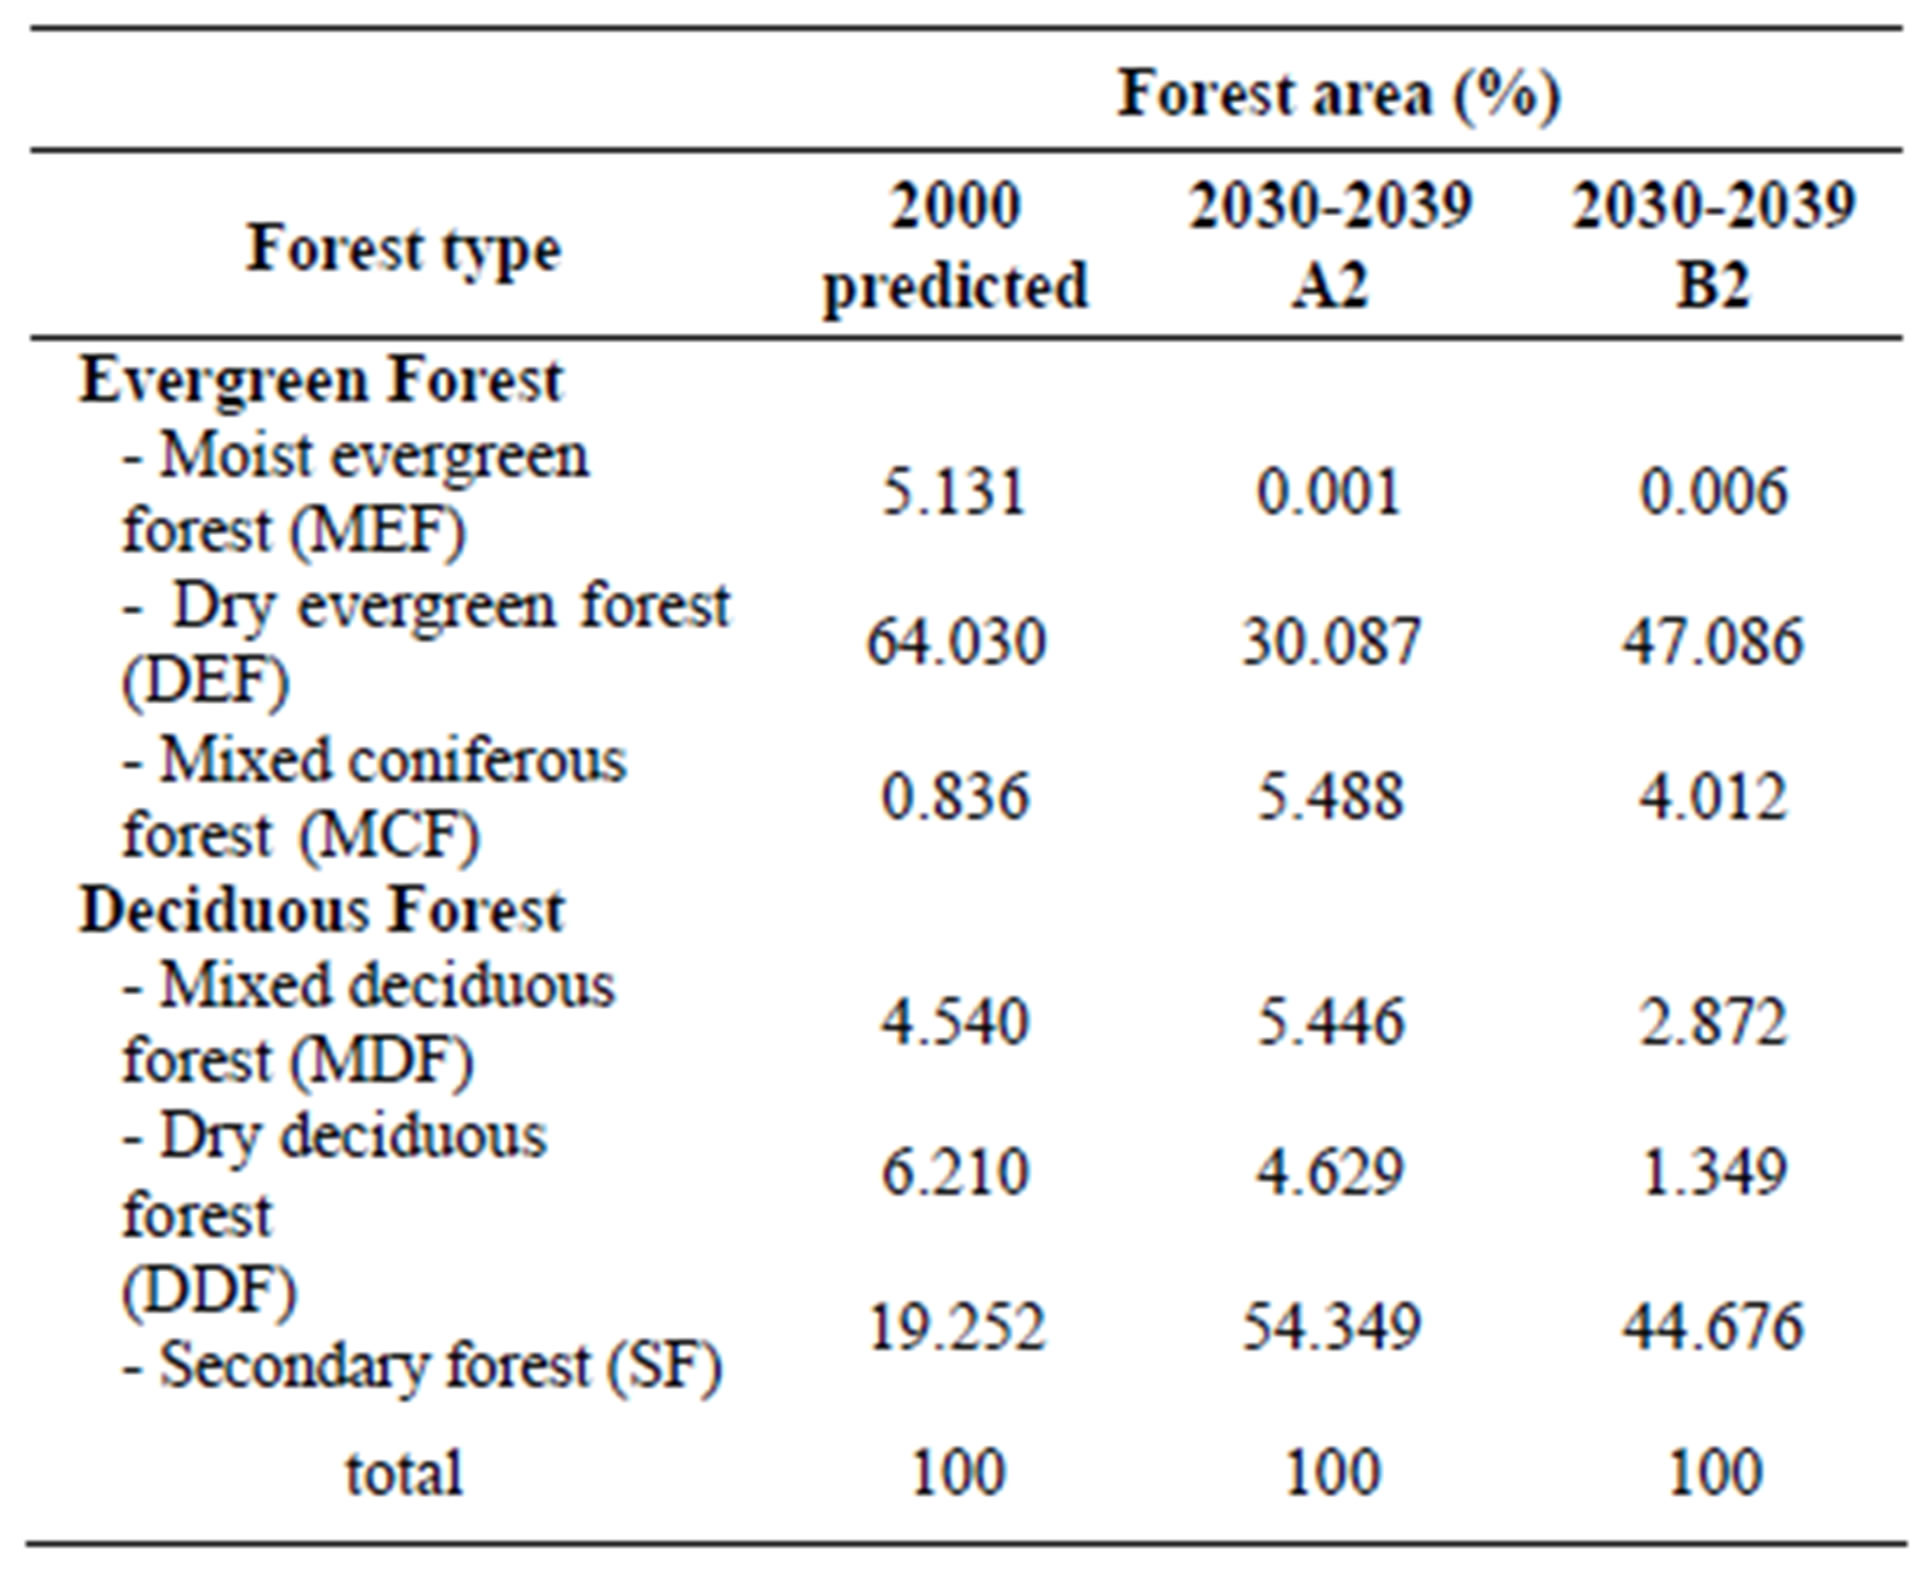
Table 5. Comparison of forest type for years 2000 and 2030- 2039 under climate scenarios A2 and B2.
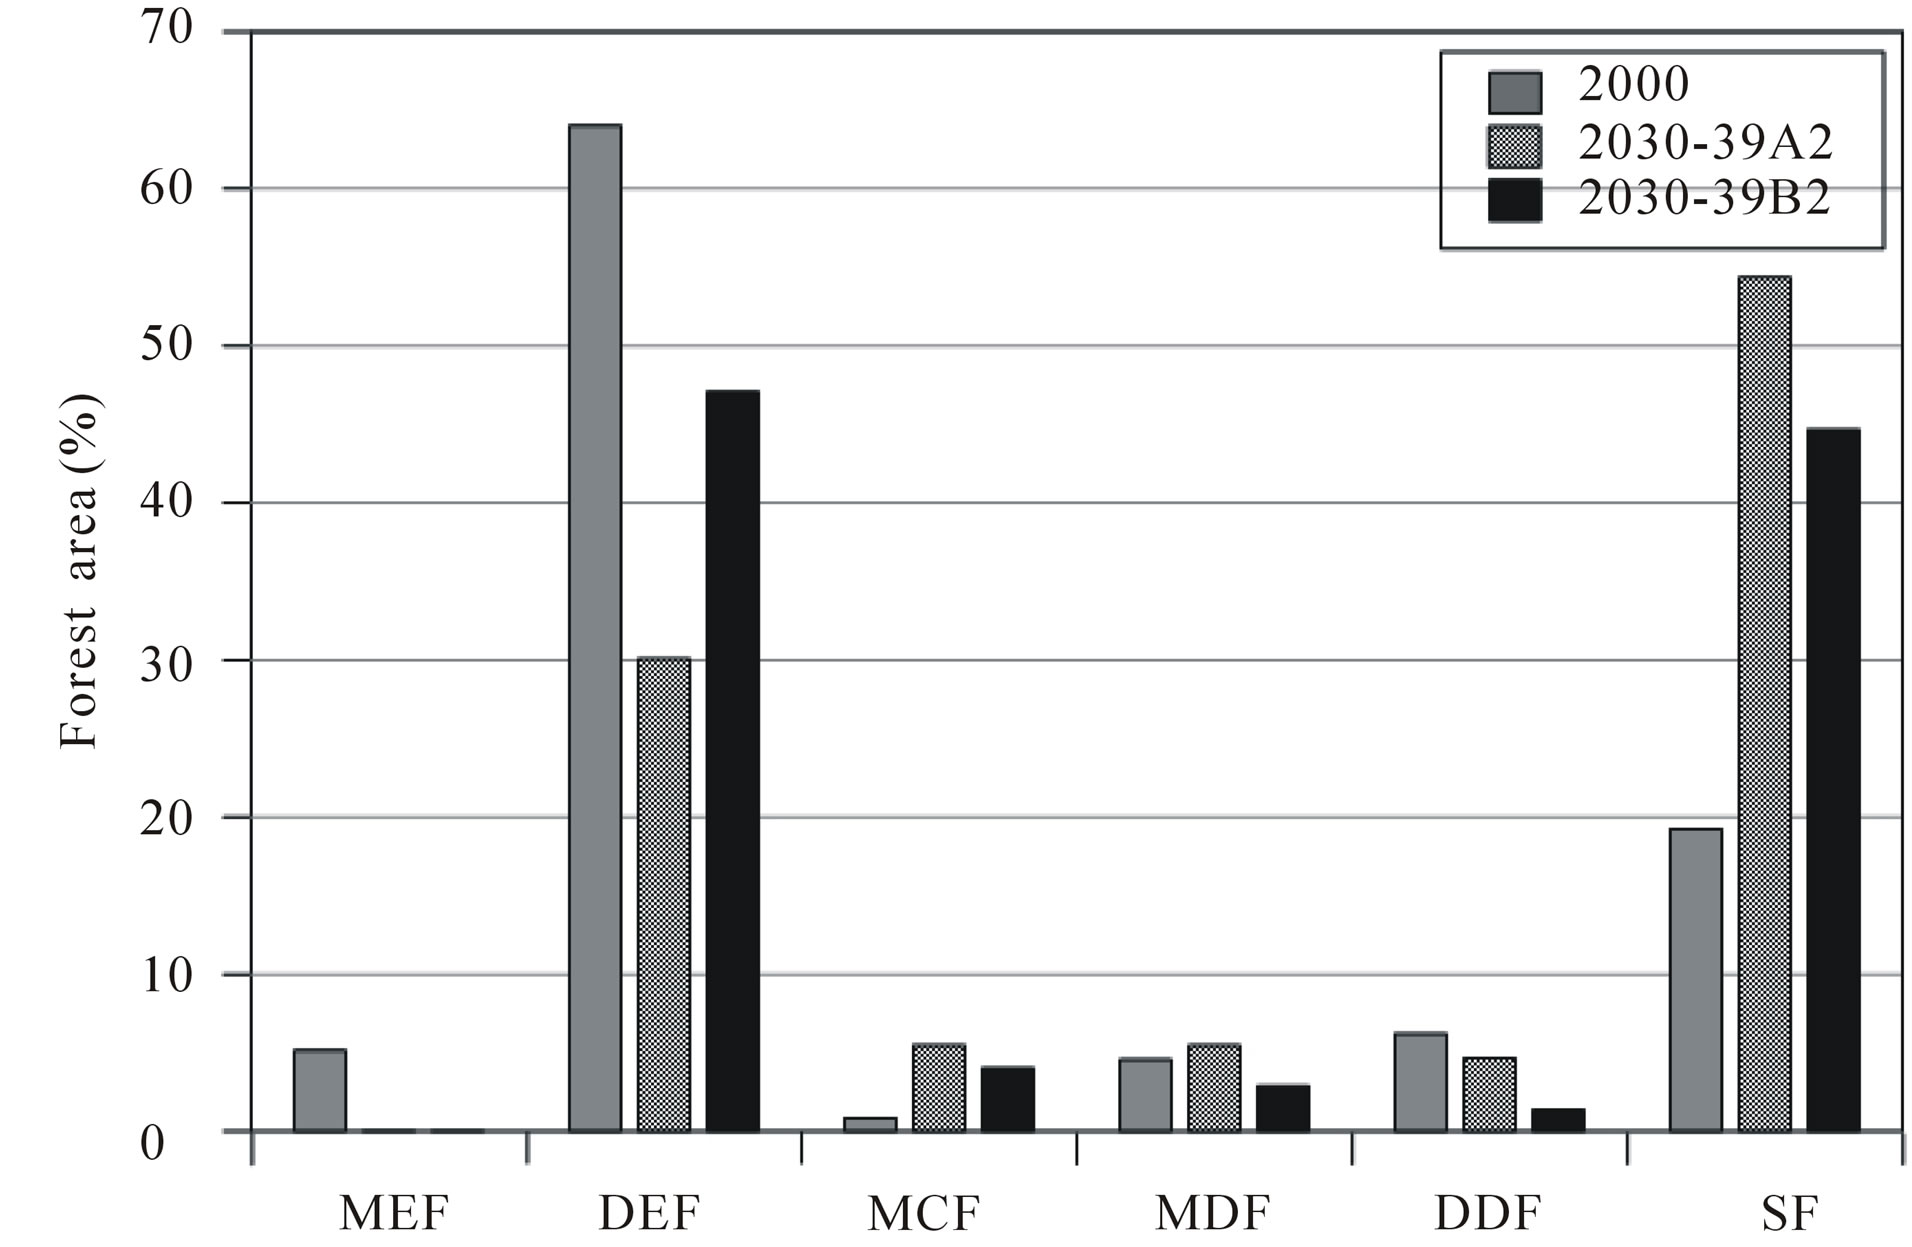
Figure 8. Graph comparison between future forest types under A2 and B2.
are valued most important. The “1” and “2” scenario groups differ in their technological development paths: 1 defines faster and more diverse, and 2 stands for regionally fragmented. Each scenario is identified as having low (B1), medium-low (B2), medium-high (A1), and high emissions (A2) [15]. We applied climate scenarios under A2 and B2 for our forest complex predictions.
5. DISCUSSION
In our scatter diagram, similar forest types are grouped in our primary classification. The secondary forest has less tress than the natural mixed deciduous forest. The secondary forest in Thailand is defined as areas that underwent either natural reforestation or artificial reforestation. Artificial reforestation may apply to an area of foliage reforested with native species or with wildlife feeding. This implies that most environmental factors that control forest type are the same across groups. SF will benefit under climate change according to our scenario.
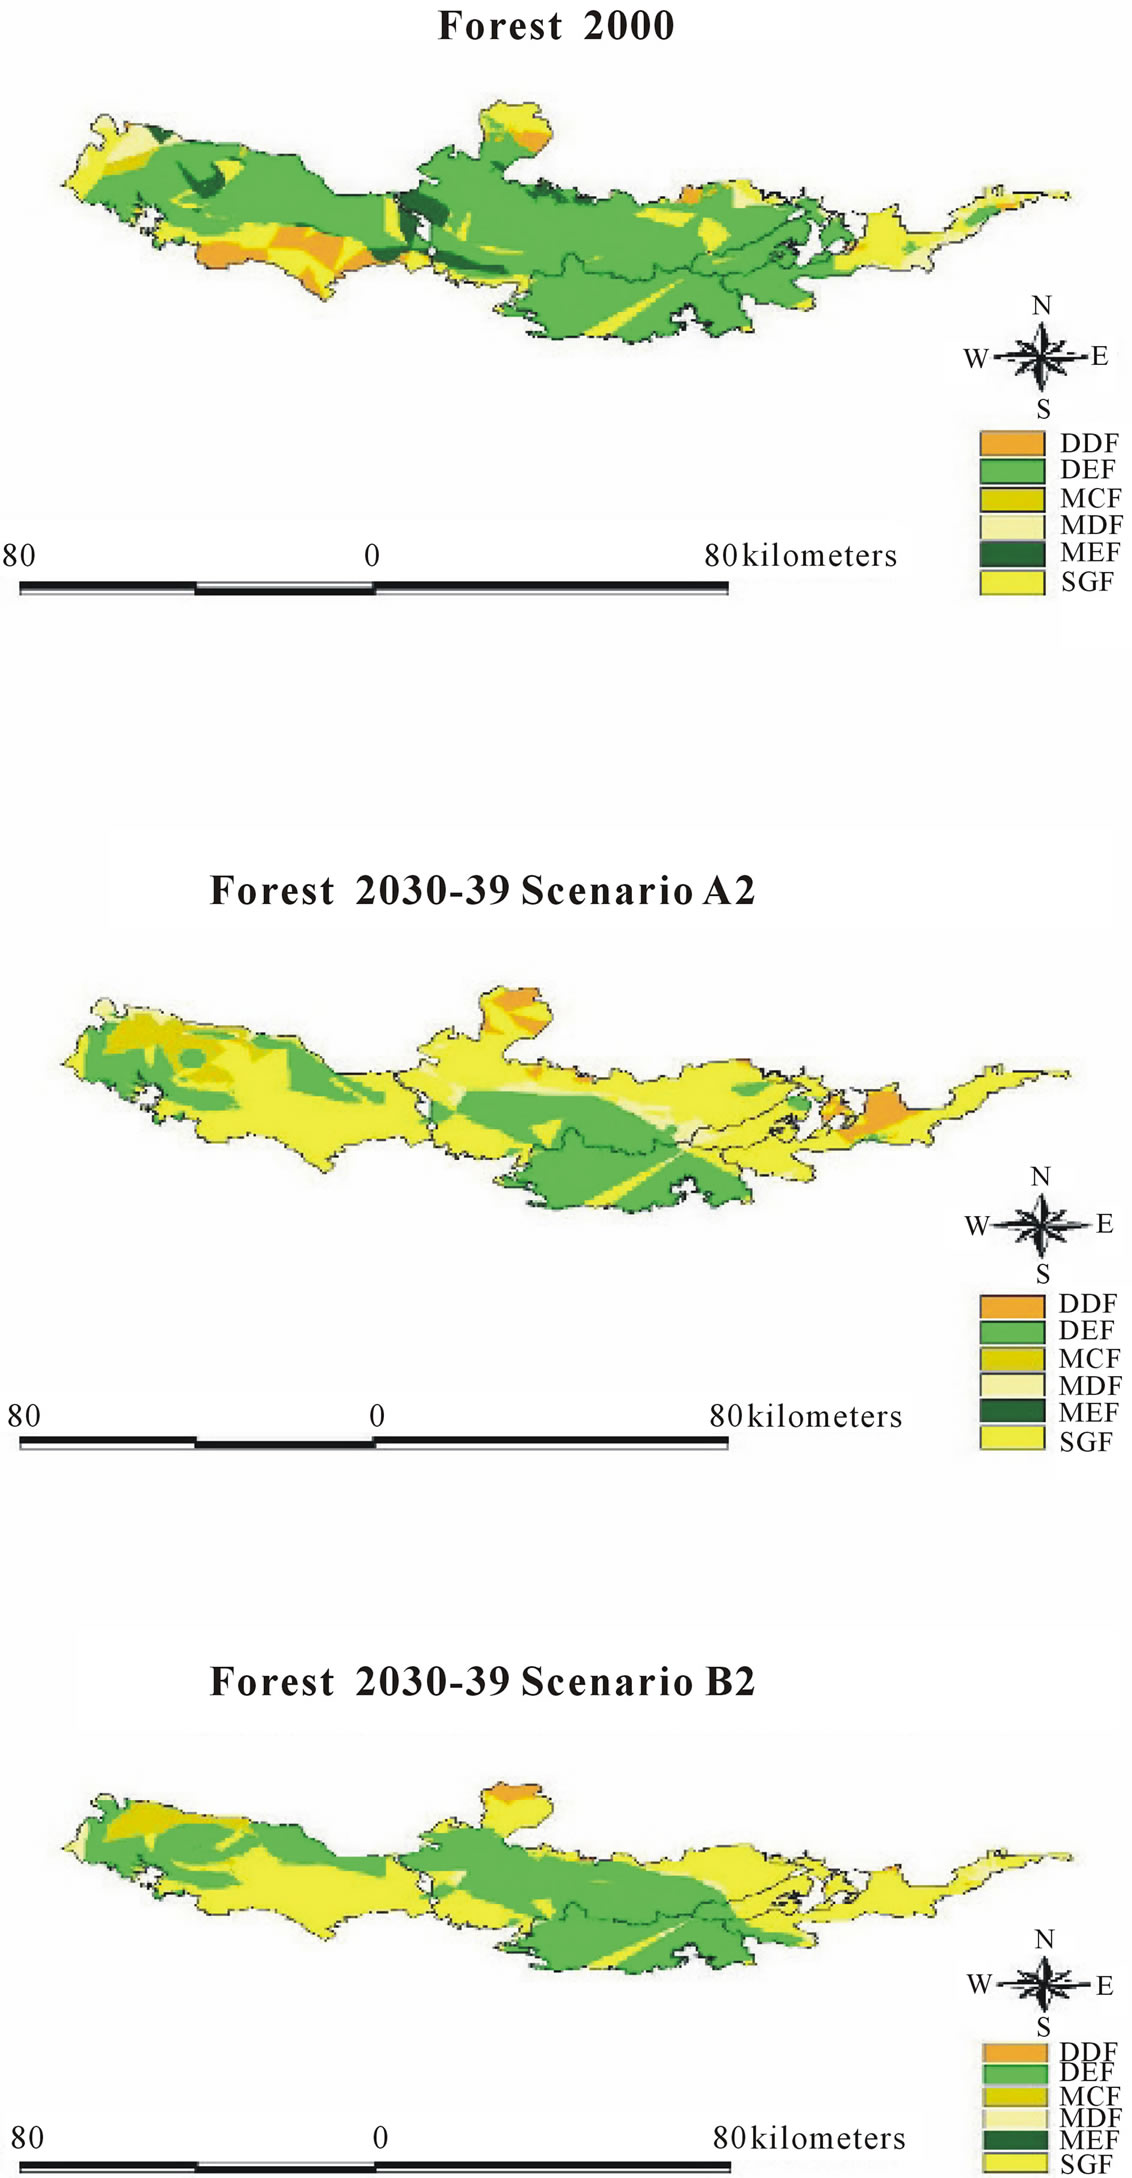
Figure 9. Comparison of forest type under climate scenario A2 and B2.
Our two-way analysis highlights the rich biodiversity in our world heritage area of interest. This biodiversity benefits mankind and mitigates flash flooding. This is important for Thailand, a country influenced by a monsoon climate and often suffers both heavy rain and long term drought. Zhang et al. [16] concluded that the soil factors (TC, TN, TP, K, Mg, Si, soil moisture, and bulk density) most strongly influence species distribution in a subtropical, broad-leaved forest in the Zhejiang province of east China. Fu et al. [17] employed the CCA to examine the relationship between three different index groups (topography, soil, and plant) in deciduous, broad-leaved forest area near Beijing. Their result revealed that elevation shares a close relationship with shrub richness and also influences SOM. Elevation, however, remains constant among forest type in our study. A study conducted in Koh Chang, Trat province, Thailand by Payomrat and Pumijumnong (unpublished) demonstrated that elevation is the main factor that segregates plant species. In Panama, 35% - 61% of tropical rainforest tree types show strong associations to soil nutrient distributions. These results indicate that belowground resource availability plays an important role in the assembly of tropical trees communities at a local scale [18].
Soil organic carbon (SOM) is one of the most important factors of soil quality. Soil moisture content remains the best variable to correlate with forest type. Different forest types have varying carbon sink capacities, additionally differing in aboveand belowground capability. We thus have to consider land use and coverage change, a main cause for greenhouse gases emission in many developing countries including Thailand. In Thailand, research is being conducted on the biomass of different forest types and their locations, but these studies only considered aboveground biomass, converting carbon sequestration by using dry weight and multiplying by 50% [19]. Janmahasatien et al. [20] studied soil carbon in dry evergreen and mixed deciduous forest ecosystems at Sakaerat environmental research station, as well as Nakhon Ratchasrima, and Maeklong watershed stations. The mean carbon storage capacities in soil at a one-meter depth were 231.05 tC/ha for evergreen and 195.42 tC/ha for mixed deciduous, respectively. The deposit of carbon was generally higher in top soil and decreased with greater soil depth. Soil organic carbon in our DEF was 101.38 tC/ha and MDF was 109.2 tC/ha. There was a smaller difference for forest type than variations found by Janmahasatien. Terakunpisut et al. [21] assessed the aboveground biomass in forests of different ecosystems in Thong PhaPhum, Kanchanaburi province, Thailand. Results for tropical rainforest, dry evergreen, and mixed deciduous were 137.73, 70.29 and 48.14 tC/ha, respectively. Moreover, carbon content for all three types remains lower than our numbers. Many factors affect aboveground biomass, specifically plant density and plant volume. Variables that control below ground biomass are as soil type, bulk density, and forest cover.
Changing forests are due not only to human encroachment, but also to climate changes. Forests with higher biodiversity are more vulnerable to this change. More research on climate change impact on biodiversity is required. In Thailand, little research exists on climate change impact on forest types. Climate change impact on forest ecosystems in Thailand was first studied by both Boonpragob [22] and Boonpragob and Santisirisomboon [23]. Forest types in the Boonpragob [22] study were classified by following Holdridge Life Zones, which use temperature and moisture as parameters to distinguish forest types in Thailand. The results indicated that carbon dioxide increases directly correlated to higher temperatures, ultimately resulting in a tendency for Subtropical Dry Forest to disappear and to be replaced by Tropical Very Dry Forest. The tropical rain forest will be replaced by dry evergreen forest, leading to a reduction in vegetation biodiversity. Trisurat et al. [24] extracted the HadCM3 A2 climate change scenario for the year 2050 in northern Thailand and subsequently generated the niche model using maximum entropy theory. Results showed that the total extent of occurrence of all selected plant species is not substantially different between current and predicted climate change conditions. However, spatial configuration and turnover rates are high, especially for evergreen tree species. Ten plant species are predicted to lose their suitable ecological niches, while the remaining 12 species will gain substantial suitable habitats. Assemblages of evergreen species are likely to shift toward the north, where lower temperature is anticipated for 2050. In contrast, deciduous species will expand their distribution ranges.
According to high biodiversity found in our evergreen forest area, climate change will directly impact individual plant species. Precise research on monitoring the growthclimate response for selected dominance trees species in each forest type is thus necessary. From our results and others interpreted the impact of climate change to our forest are the same trend. Our results remain consistent with others: that forest moisture will be harmed and decline, with high temperatures leading higher evapotranspiration. This condition is not suitable for evergreen forests.
In Indian forests [25] used the climate model of the Hadley Centre (HadRM3), applying the A2 (740 ppm CO2) and B2 scenarios (575 ppm CO2), as well as the BIOME4 vegetation response model. They summarized that only three forest types would benefit from the future climate: the tropical savannah, tropical evergreen forest, and temperate conifer forest. The lost forest types would be tropical xerophytic shrub land, tropical deciduous forest/woodland, warm mixed forest, tropical semi-deciduous forest, temperate sclerophyll woodland, cool conifer forest, evergreen taiga/montane forest, and cold mixed forest. It seems that forest types in India are mostly negatively impacted by climate change, which holds true in Thailand. In Indonesia, changes in rainfall patterns will also have serious consequences. More frequent forest fires will have significant impacts on forest losses, wildlife habitats, and biodiversity [26]. Myanmar, however, claims that the effect of climate change throughout the whole country will be minimal due to the large area of forest cover that acts as a carbon sink (www.Ambafrance-id.org, www.un.org). The whole region of Southeast Asia is affected by climate changes, exhibiting droughts normally associated with ENSO years. These periods cause massive crop failures, water shortages, and forest fires in various parts of Myanmar, Laos, Philippines, Indonesia, and Vietnam [27].
6. CONCLUSION
The evergreen forests and deciduous forests of northeast Thailand are continuous, large, and encompass high biodiversity. They are not only home for more than thousands of living things, but also provide advantage to mankind. Plant communities serve their own niche. Different belowground nutrients are essential in supporting sub communities. Carbon content in natural forests is directly relevant for forest cover and slowly released into the ecosystem by water and moisture. Future climate change will directly impact biodiversity and humanity; thus, forest preservation and restoration are urgently needed.
7. ACKNOWLEDGEMENTS
This study was funded by the Natural Research council, Thailand (2008). We thank SEA START RC (2008), who provided us with climate scenarios A2 and B2. We would like to thank the reviewers for their comments in helping improve the manuscript.
REFERENCES
- Nkem, J., Oswald, D., Kudejira, D. and Kanninen, M. (2009) Counting on forests and accounting for forest contributions in natural climate actions. Working paper 47, Center for International Forestry Research, CIFOR, Indonesia. www.cifor.cgiar.org
- Sedjo, R. and Sohngen, B. (1998) Impacts of climate change on forests. RFF Climate Issue Brief#9, 2nd Edition.
- IPCC (2007) Climate change 2007: Impacts, adaptation and vulnerability. Working Group II Contribution to the Intergovernmental Panel on Climate Change Fourth Assessment Report, Chapter 12 and Summary for Policymakers.
- Southeast Asia Regional Centre (SEA START RC) (2008) Climate change scenario model for Thailand. Chulalongkorn University, Bangkok. http://research.start.or.th/climate/
- MacKinnon, J. (1997) Protected area review of the IndoMalayan realm. The Asian Bureau for Conservation, World Bank Publication, Canterbury.
- Ogawa, H., Yoda, K., Ogino, K. and Kira, T. (1965) Comparative ecological studies on three main types of forest vegetation in Thailand II. Plant biomass. Natural and life in Southeast Asia, 4, 49-80.
- Tsutsumi, T., Yoda, K., Sahunalu, P., Dhanmanonda, P. and Prachaiyo, B. (1983) Forest: Felling, burning and regeneration. In: Kyuma, K. and Pairitra, C., Eds., Shifting Cultivation. Tokyo.
- Panaadisai, S. (2011) Carbon stock in natural forest ecosystem in world heritage Dongphraya Yen-KhaoYai forest complex, Thailand. M.Sc. Thesis, Faculty of Graduate Studies, Mahidol University, Bangkok.
- Peck, J.E. (2010) Multivariate analysis for community ecologists: Step-by-step using PC-ORD. MjM Software Design, Gleneden Beach.
- Pumijumnong, N. and Techamahasaranont, J. (2008) Climate change impact of forest area in Thailand. Proceeding of the FORTROP II: Tropical Forest Change in a Changing World. Bangkok, 17-20 November 2008, 143- 157.
- Royal Forest Department (2002) Forest type in Thailand. Office of Forest Information, Ministry of Natural Resources and Environment, Bangkok.
- Gardner, C., Sittisunthorn, P. and Anusarnsunthorn, W. (2000) Trees in north Thailand: A guide to the trees species in the forest, northern Thailand. Kopfi Publishing, Bangkok.
- Smitinnand, T. (1977) Vegetation and ground covers of Thailand. The Forest Herbarium, Royal Forest Department, Bangkok.
- Kutinatara, U. (1998) Forest ecosystem. Department of Forest Biology, Faculty of Forestry, Kasetsart University, Bangkok.
- IPCC (2001) Climate change 2001: The scientific basis. In: Houghton, J.T., Ding, Y., Griggs, D.J., Noguer, M., van der Linden, P.J., Dai, X., Maskell, K. and Johnson, C.A., Eds., Contribution of Working Group I to the Third Assessment Report of the Intergovernmental Panel on Climate Change, Cambridge University Press, Cambridge.
- Zhang, L., Mi, X., Shao, H. and Ma, K. (2011) Strong plant-soil associations in a heterogeneous subtropical broad-leaved forest. Plant Soil, 347, 211-220. doi:10.1007/s11104-011-0839-2
- Fu, B.J., Liu, S.L., Ma, K.M. and Zhu, Y.G. (2004) Relationship between soil characteristics, topography and plant diversity in a heterogeneous deciduous broad-leaved forest near Beijing, China. Plant and Soil, 261, 47-54. doi:10.1023/B:PLSO.0000035567.97093.48
- John, R., Dalling, J.W., Harms, K.E., Yavitt, J.B., Stallard, R.F., Mirabello, M., Hubbell, S.P., Valencia, R., Navarrete, H., Vallejo, M., Robin, B. and Foster, R.B. (2006) Soil nutrients influence spatial distributions of tropical tree species. www.pnas.orgcgidoi10.1073pnas.0604666104
- Brown, S. and Logo, A.E. (1982) The storage and production of organic matter in tropical forests and their role in the global carbon cycle. Biotropica, 14, 191-187. doi:10.2307/2388024
- Janmahasatien, S., Phopinit, S. and Wichiennopparat, W. (2007) Soil carbon in the Sakaerat dry evergreen forest and the Maeklong mixed deciduous forest. www.dnp.go.th
- Terakunpisut, J., Gajaseni, N. and Ruankawe, N. (2007) Carbon sequestration potential in aboveground biomass of Thong PhaPhum national forest. Applied Ecology and Environmental Research, 5, 93-102.
- Boonpragob, K. (1996) Thailand’s role in a global context. Climate change—Local solutions for global problems. Linking Local Solutions to Global Needs: Thailand’s Environment Agenda in the 21st Century, Thailand Environment Institute, Bangkok.
- Boonpragob, K. and Santisirisomboon, J. (1996) Modeling potential changes of forest area in Thailand under climate change. Water, Air and Soil Pollution, 92, 107- 117.
- Trisurat, Y., Alkemade, R. and Arets, E. (2009) Projecting forest tree distributions and adaptation to climate change in northern Thailand. Journal of Ecology and Natural Environment, 1, 055-063.
- Ravindrannath, N.H., Joshaxenai, N.V., Sukumar, R. and Saxena, A. (2006) Impact of climate on forests in India. Current science, 90, 354-361.
- Staringa, T. (2008) Indonesia’s vulnerability to climate change: An increasing trend. Regional Health Forum, 12, 56-58.
- WWF (2007) Climate change impacts on APEC countries.