Natural Science
Vol.4 No.5(2012), Article ID:19117,9 pages DOI:10.4236/ns.2012.45043
Using the improved position specific scoring matrix and ensemble learning method to predict drug-binding residues from protein sequences
![]()
1College of Chemistry, Sichuan University, Chengdu, China; *Corresponding Author: yzguo@scu.edu.cn
2College of Computer Science, Sichuan University, Chengdu, China
Received 10 March 2012; revised 15 April 2012; accepted 28 April 2012
Keywords: Drug-Binding Site Prediction; Position Specific Scoring Matrix; Ensemble Learning; Support Vector Machine
ABSTRACT
Identification of the drug-binding residues on the surface of proteins is a vital step in drug discovery and it is important for understanding protein function. Most previous researches are based on the structural information of proteins, but the structures of most proteins are not available. So in this article, a sequence-based method was proposed by combining the support vector machine (SVM)-based ensemble learning and the improved position specific scoring matrix (PSSM). In order to take the local environment information of a drug-binding site into account, an improved PSSM profile scaled by the sliding window and smoothing window was used to improve the prediction result. In addition, a new SVM-based ensemble learning method was developed to deal with the imbalanced data classification problem that commonly exists in the binding site predictions. When performed on the dataset of 985 drug-binding residues, the method achieved a very promising prediction result with the area under the curve (AUC) of 0.9264. Furthermore, an independent dataset of 349 drugbinding residues was used to evaluate the prediction model and the prediction accuracy is 84.68%. These results suggest that our method is effective for predicting the drug-binding sites in proteins. The code and all datasets used in this article are freely available at http://cic.scu.edu.cn/bioinformatics/Ensem_DBS.zip.
1. INTRODUCTION
It’s known that the function of a protein is determined to a great extent by the binding sites on its interacting surface with other molecules. Identification of these binding sites is crucial for elucidating protein functions and further assisting drug design. However, there are still abundant potential binding sites that are not identified. In recent years, although various experimental techniques [1-4] have been developed, they are all time-consuming and expensive. So it is of great practical significance to develop the reliable computational methods to facilitate the identification of drug-binding sites.
So far, several computational methods have been proposed for the prediction of drug-binding sites. Some of them are aimed at the special drug targets, such as tubulin [5], protein-protein interfaces [6]. Methods using the structural information of proteins have been reported. These methods included those directly detecting the drugbinding sites via geometric analysis of protein structures [7,8] and those using docking [9,10]. The geometric analysis method attempts to detect the solvent-accessible pockets on the protein surface [11]. The ConCavity method [7] integrated evolutionary sequence conservation with structural information. The SCREEN method [8] computed 408 physicochemical, structural and geometric features for identifying drug-binding cavities with the coverage of 88.9%. These structure-based approaches can find the concave regions of the binding ligands and receive the high prediction accuracy. However, the actual ligand-binding sites are much fewer than those found in the pocket. Therefore, the methods based on geometric analysis do not always give the precise location of the small molecule binding site [12]. In addition, the structures of most proteins are not available and the structure-based methods can not be generally used. Therefore, it is necessary to develop effective and reliable computational methods to predict the drug-binding sites based on sequence information only.
In this work, a sequence-based method based on the improved position specific scoring matrix (PSSM) and support vector machine (SVM)-based ensemble learning was firstly proposed. The improved PSSM profile accounts for the influence of the surrounding residues on the drug-binding sites by using a sliding window and a smoothing window. The amino acid residues were translated into numerical values representing evolutionary information and their local environment information. At the same time, a new SVM-based ensemble learning method was developed to deal with the imbalanced data classification problem. The entire flow chart of the prediction process is shown in Figure 1. The optimization experiment demonstrated that the local environment information would contribute to characterize the drugbinding sites. The method yielded a high area under the curve (AUC) of 0.9264 using the dataset of 985 drugbinding sites. Moreover, the final prediction model was further evaluated by an independent dataset of 349 drugbinding sites and the prediction accuracy is 84.68%.
2. MATERIALS AND METHODS
2.1. Dataset
The drug-binding protein chains used in this paper were from the work of Ghersi and Sanchez [10]. The 77 protein chains were extracted from the structures of drugprotein complexes determined by X-ray crystallography with a resolution better than 2.5 Å in protein data bank (PDB) [13]. To avoid redundancy, the 77 protein chains
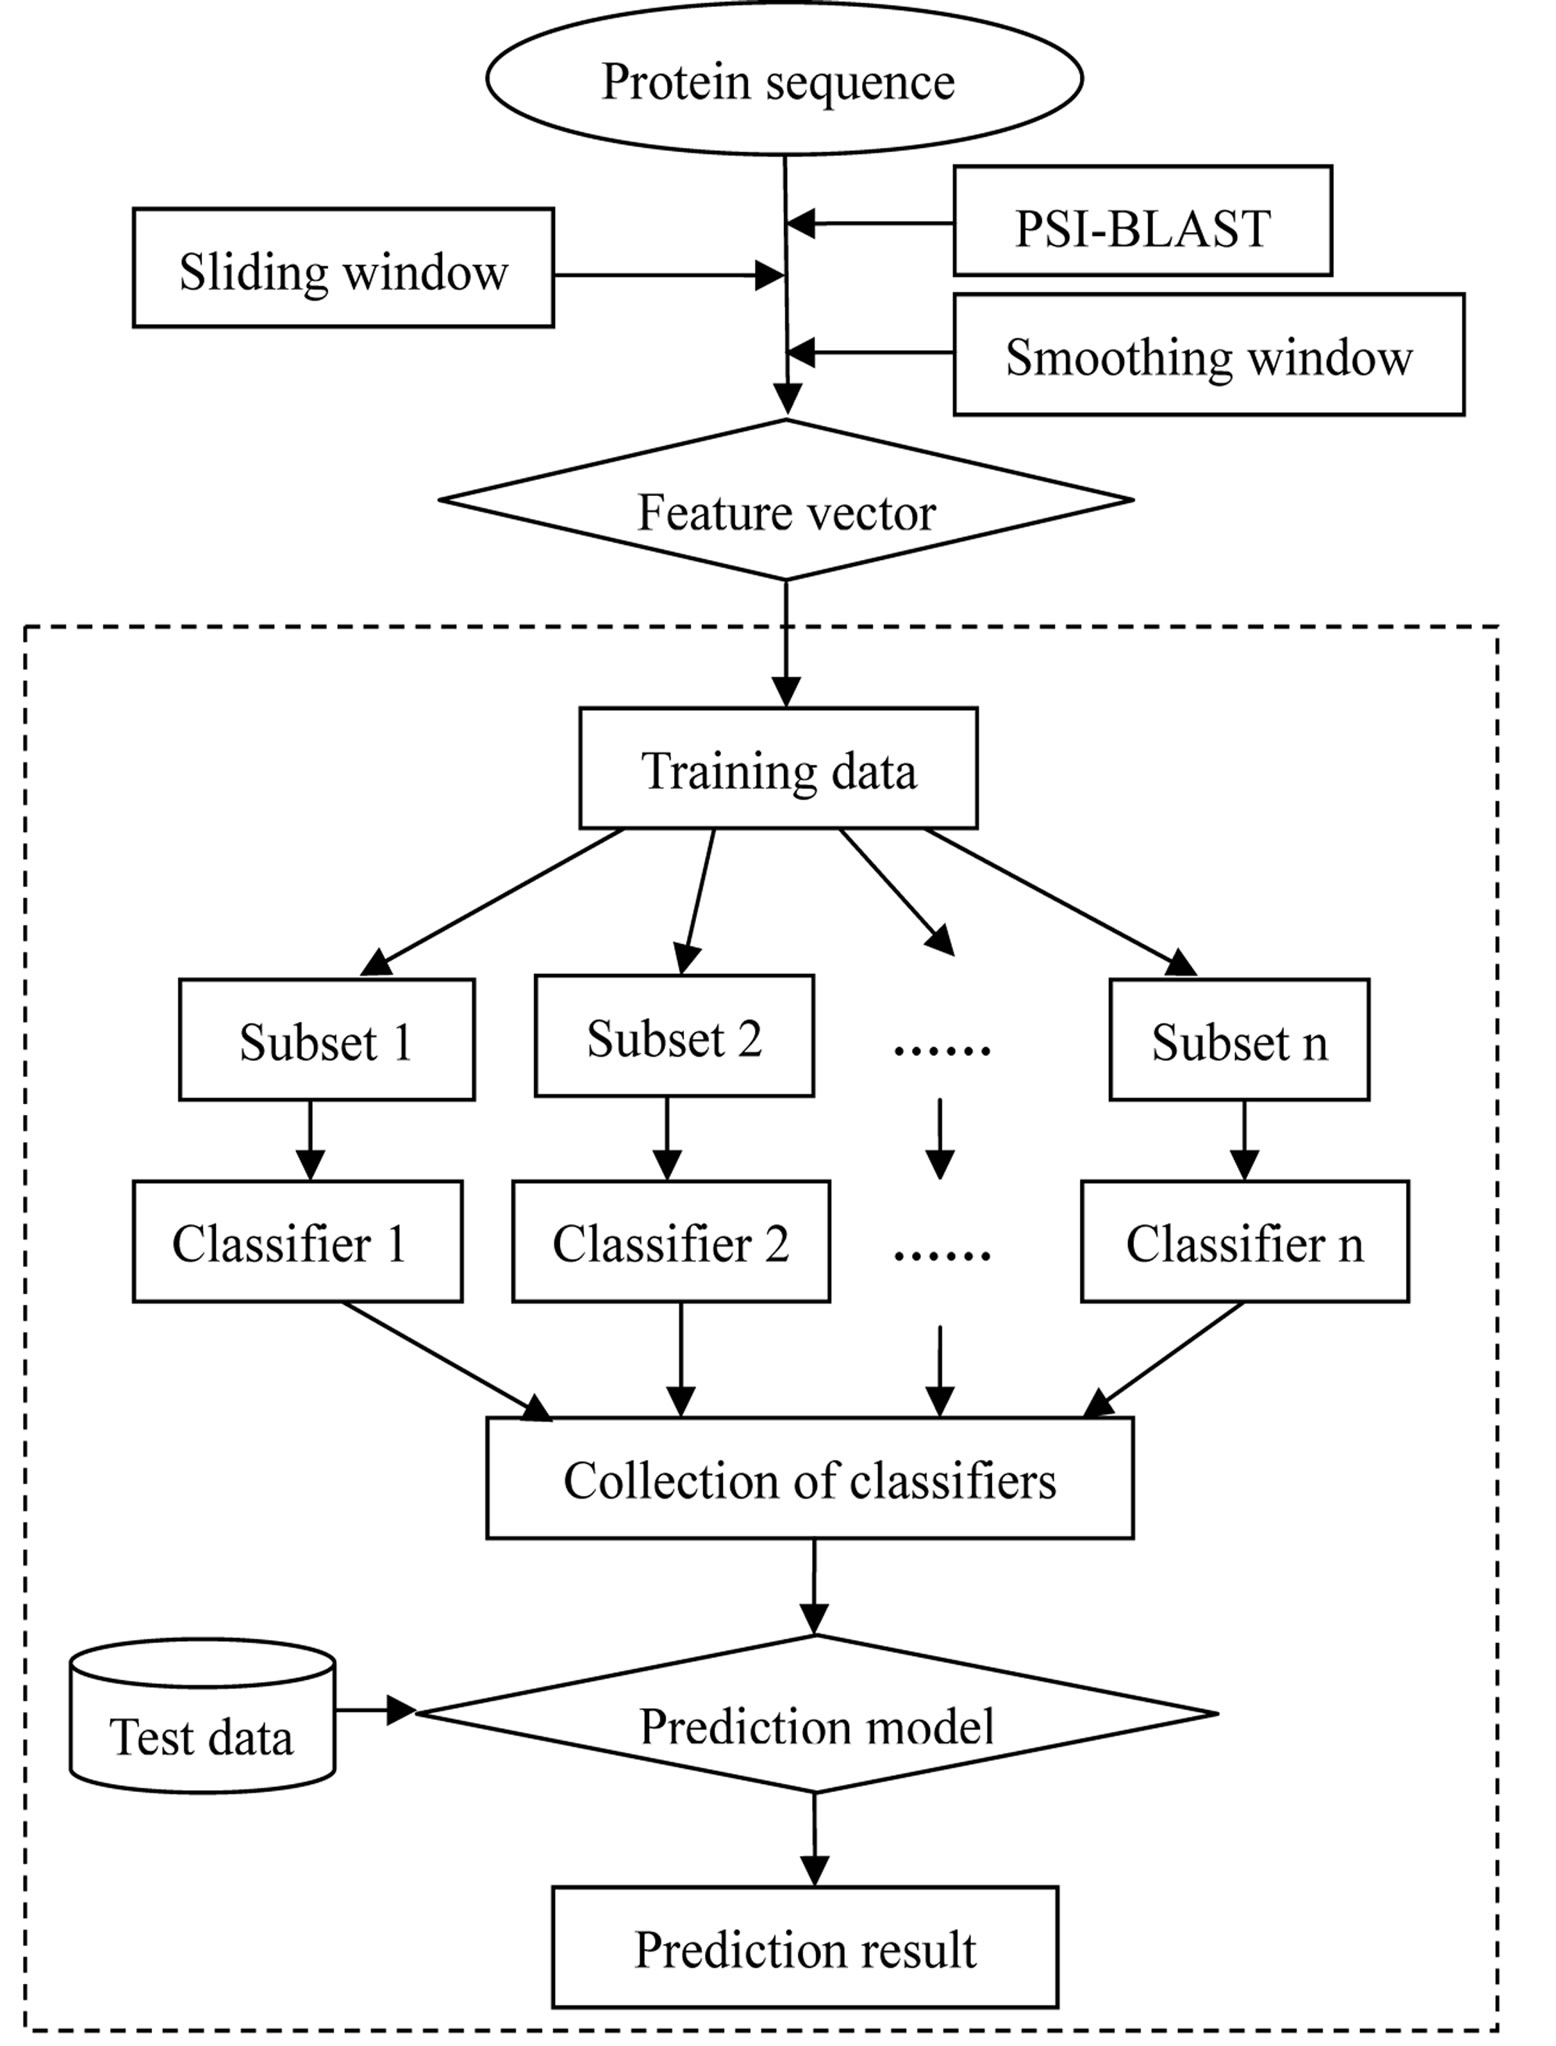
Figure 1. The entire flow chart for the prediction of drug-binding sites.
were aligned using position specific iterated-basic local alignment search tool (PSI-BLAST) [14]. In each cluster, the longest one was reserved [15]. And then, the mutual sequence identity of protein sequences in the dataset was less than 40%. At last, 69 drug-binding protein chains were remained. Here, only the residues that have PDB coordinators were used. A residue was designated as the drug-binding site if the backbone atoms of the residue have at least one atom within 6 Å of the heavy atoms of the drug molecule [10]. Otherwise, it is a non-binding residue. The final dataset contained 985 drug-binding residues and 21626 non drug-binding residues.
2.2. Feature Extraction and the Improved PSSM
A PSSM profile contains the evolutionary information of each residue in a protein which represents the loglikelihoods of the substitutions of 20 standard amino acids. Therefore, PSSM is considered as a measure of residue conservation in a given location. It has been widely used to predict the functional sites [16-20] and received good results. Some researchers have shown that evolutionary information obtained from multiple sequence alignment contains more comprehensive information than a single sequence [21,22]. In this study, the evolutionary information obtained from PSSM generated from PSIBLAST was also employed to predict drug-binding residues. A given protein sequence was searched against the Swiss-Prot database (version 54.4, released on 25 Oct. 2007) by using three iterations of PSI-BLAST for multiple sequence alignment, the original PSSM profile was created based on BLOSUM62 substitution matrix with E-value as 0.001. The size of the matrix of a protein is 20 × L, where L is the length of a protein sequence.
A residue ai in a protein sequence was encoded as a feature vector of dimension 20 using the ith row in the original PSSM profile. Considering the influence of surrounding residues on the drug-binding sites, a sliding window and a smoothing window were applied to reencode the PSSM profiles to represent the local environment information. Therefore, for a residue ai in sequence position i, a feature vector Hi of dimension 20 × w was used to represent it. w is an odd number and it is the size of sliding window.
 (1)
(1)
where h[ai] is the 20 feature vectors in the ith PSSM profile for the residue ai. If w extends beyond the sequence, (w – 1)/2 zero vectors of dimension 20 were appended on empty positions. The profile added a sliding window is defined as the standard PSSM profile [23].
In the standard PSSM profile, the feature vectors of each residue were calculated based on the assumption that each residue was independent of others. The smoothed PSSM profiles were encoded based on the sum of the evolution information of the neighbors to calculate a central residue’s evolutionary information [23,24]. A smoothing window was used to encode a smoothed PSSM profile. For the residue ai, the feature vector represented by Hsm_i·ws is also an odd number.
 (2)
(2)
For the first and the last residue of a protein, (w – 1)/2 zero vectors of dimension 20 were appended on the empty positions. Figure 2 illustrates an example of applying the sliding window and the smoothing window. Similar PSSM
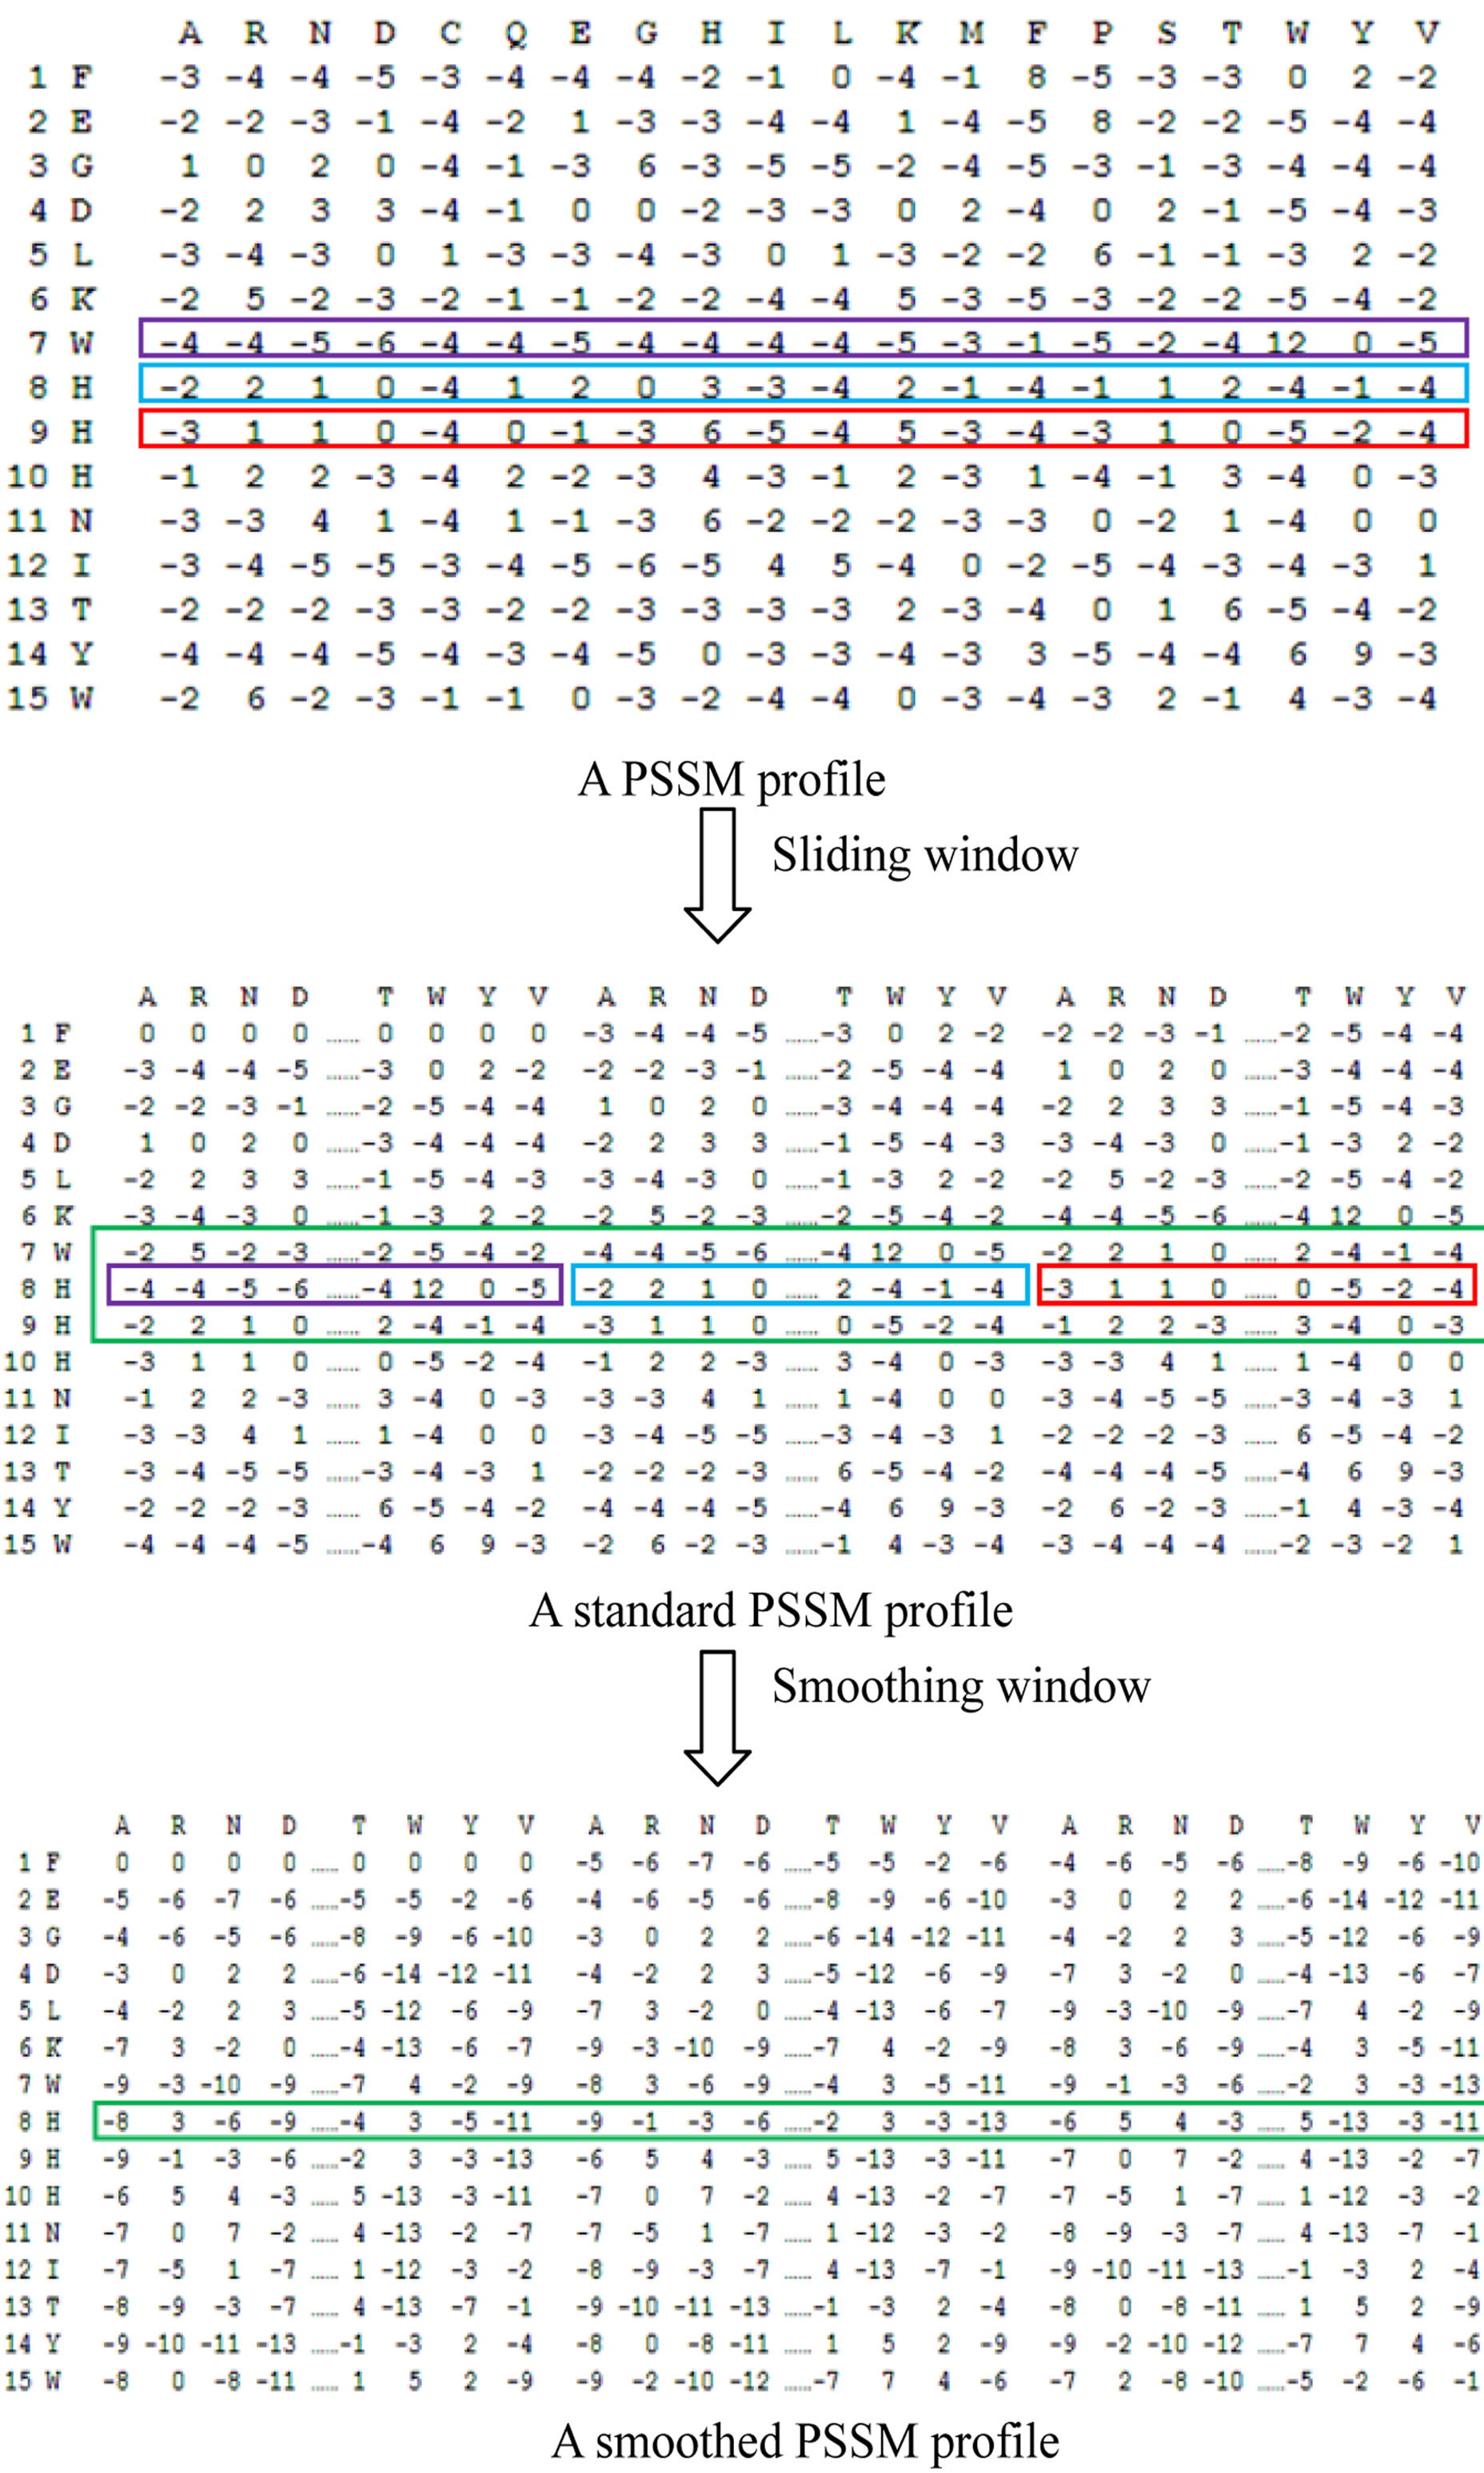
Figure 2. Examples of the improved PSSM profile using a sliding window and a smoothing window. The first profile is the evolutionary information obtained from PSSM generated by PSI-BLAST. For residue a8, the feature vector was represented by [h7, h8, h9] when a sliding window size 3 was applied on the original PSSM profile. The vector of dimension 20 × 3 was obtained in the standard profile. The corresponding value of amino acid “H” was represented by the sum of [(–2) + (–4) + (–2)] when a smoothing window size 3 was applied to reencode in smoothed profile.
approaches have been successfully used to enhance the prediction quality for various protein attributes [25-33].
2.3. Model Construction
Support vector machine (SVM) is a machine learning method based on statistical learning theory which has been proposed by Vapnik [34]. Chou and Cai [35] and Cai et al. [36,37] have given a detailed description about how to use SVM. Here, the software libsvm 2.91 (http://www.csie.ntu.edu.tw/~cjlin/libsvm/) was used to construct the classification model. A radial basis function (RBF) was chosen as the kernel function. Two parameters, the regularization parameter C and the kernel width parameter γ were optimized using a grid search approach.
Because the number of interacting residues is much smaller than that of non-interacting residues, the imbalanced data classification problem commonly exists in binding site predictions. But the standard machine learning methods without considering the class-imbalance problem tend to cause high false negative rate by predicting the positive sample as the negative one. The current methods [38-41] have been tried to change the distribution of positive and negative samples by randomly extracting a very small fraction of the negative samples as the training data, which will fail to use the most information in the original data and lead to a biased estimate of the accuracy. To solve this imbalanced data classification problem, a new SVM-based ensemble learning method [42,43] was employed to predict the drug-binding sites. This method utilizes the information available in the non drug-binding sites as much as possible to construct the prediction model, so the prediction result is more objective. The ensemble learning method has been successfully used in predicting glycosylation sites [44] and lysine acetylation sites [45] and achieve the good prediction results.
The framework of the SVM-based ensemble learning method is shown in Figure 1. It is a collection of SVM classifiers and each one is trained on a subset of the training data. Note that the ratio of positive to negative examples in each subset is equal to that of the original dataset. The final prediction result was computed based on diverse ensembles in n classifiers combination. In our experiments, considering the ratio of positive to negative examples of the original data and the information in the negative samples, we used n = 30. For a residue in a query protein, it is misclassified by the ensemble if the majority of the SVM classifiers misclassify it.
Here, nine-tenths of the residues respectively from the positive and negative dataset were randomly chosen as the training set and the remaining were used as the test set. In the training set, the number of negative sample is far more than that of positive one. So the Bootstrap program was used to re-sample the negative samples in the training set 30 times, and then combined with the positive samples in the training set as the subsets. For the same test set, there are 30 sub-training sets. A SVM model was constructed using the sub-training set and the performance of the model was evaluated by the test set. In order to test the robustness of the method, this process was repeated ten times with different combinations of training and testing datasets. The final result was given by averaging the prediction results of the ten test sets.
Three measures, sensitivity, specificity and accuracy were used to evaluate the performance of this method. They are defined as follows:
 (3)
(3)
 (4)
(4)
 (5)
(5)
where TP, TN, FN, FP are the number of correctly predicted positive ones, the number of correctly predicted negative ones, the number of positive ones incorrectly predicted as negative ones, and the number of negative ones incorrectly predicted as positive ones.
In addition, the receiver operating characteristic (ROC) curve [46] is one of the most rigorous measures for classifier evaluation. So it was employed to further evaluate the performance of the method. The ROC curve was obtained by plotting sensitivity on the y-axis against the 1-specificity on the x-axis. The area under the ROC curve (AUC) [47] was used for model evaluation. The maximum value of AUC (1) represents the perfect prediction. The random guess achieves the AUC of 0.5.
3. RESULTS AND DISCUSSION
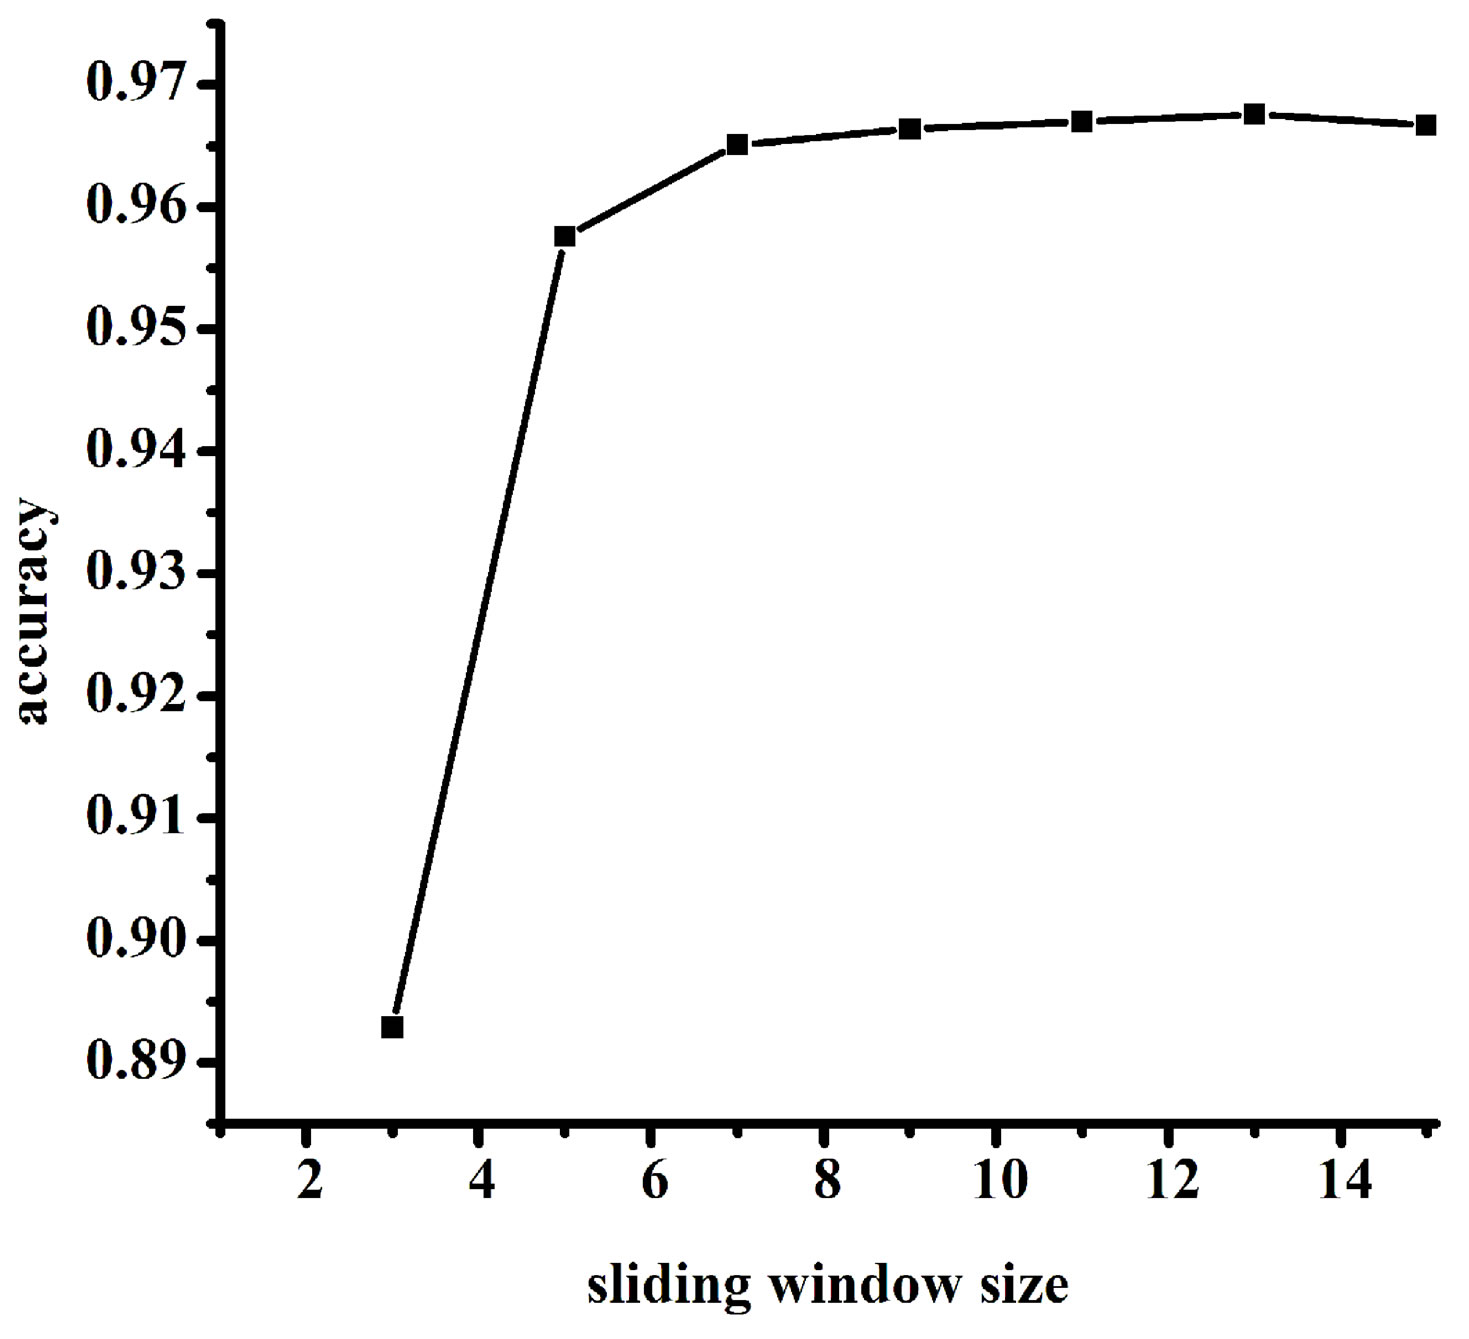
3.1. Window Size Optimization
The improved PSSM profile used in this paper can incorporate both the evolutionary information and the local environment information. A sliding window and a smoothing window were applied to re-encode the original PSSM profiles. It has been successfully used for predicting RNA-binding sites in our group [24]. But the sliding window size and the smoothing window size were needed to be optimized. In this work, the optimal window size was selected by the prediction accuracy and it was obtained by testing the performance of different sliding window sizes from 3 to 15 with the smoothing window size of 5. The results of different sliding window sizes are shown in Figure 3(a). We can see that when the sliding window size is 13, the method achieves the best performance. At the same time, from Figure 3(b), the
 (a)
(a) (b)
(b)
Figure 3. The selection of the optimal window size. (a) The results of different sliding window sizes; (b) The results of different smoothing window sizes.
optimal smoothing window size is 5.
3.2. Comparison of SVM-Based Ensemble Learning and the Weighted SVM
Here, a weighted SVM was also used to identify the drug-binding sites and the performance of the model based on a weighted SVM classifier as compared with that of the model based on ensemble learning method.
For the weighted SVM, the original dataset were divided into ten equal subsets, nine-tenths of the residues were chosen as the training data and the remaining one were used as the test data. In this process, we only give the positive samples weights. The whole process was repeated ten times. From Figure 4, we can see that the ROC curve of the ensemble learning of SVM classifiers dominates the ROC curve of the weighted SVM classifier. The ensemble learning of SVM classifiers gives a higher true positive rate than a weighted SVM classifier. So the ensemble learning method is more effective in predicting the drug-binding sites and it do solve the imbalanced data classification problem.

Figure 4. The ROC curves of the ensemble learning of SVM classifiers and the single SVM classifier for the prediction of drug-binding sites in proteins.
3.3. Comparing the Performance of the Improved PSSM with That of the Original PSSM
Using the ensemble learning method, we also used the original PSSM profile to transform the protein sequences and compared the performance of the model based on the original PSSM profile with that of the model based on the improved PSSM profile. The prediction results are listed in Table 1. We can see that the model based on the improved PSSM profile gives better result with the sensitivity of 75.51% that is much higher than that of the original PSSM based model, only 53.18%. It proves that the local environment information is important for representing the drug-binding sites. On average, the sensitivity, specificity, accuracy and AUC of the improved PSSM profile based model are 75.51%, 93.04%, 92.28% and 0.9264, respectively. So using the whole dataset of 985 positive and 21626 negative samples, the final prediction model was built with the improved PSSM profile and the SVM-based ensemble learning.
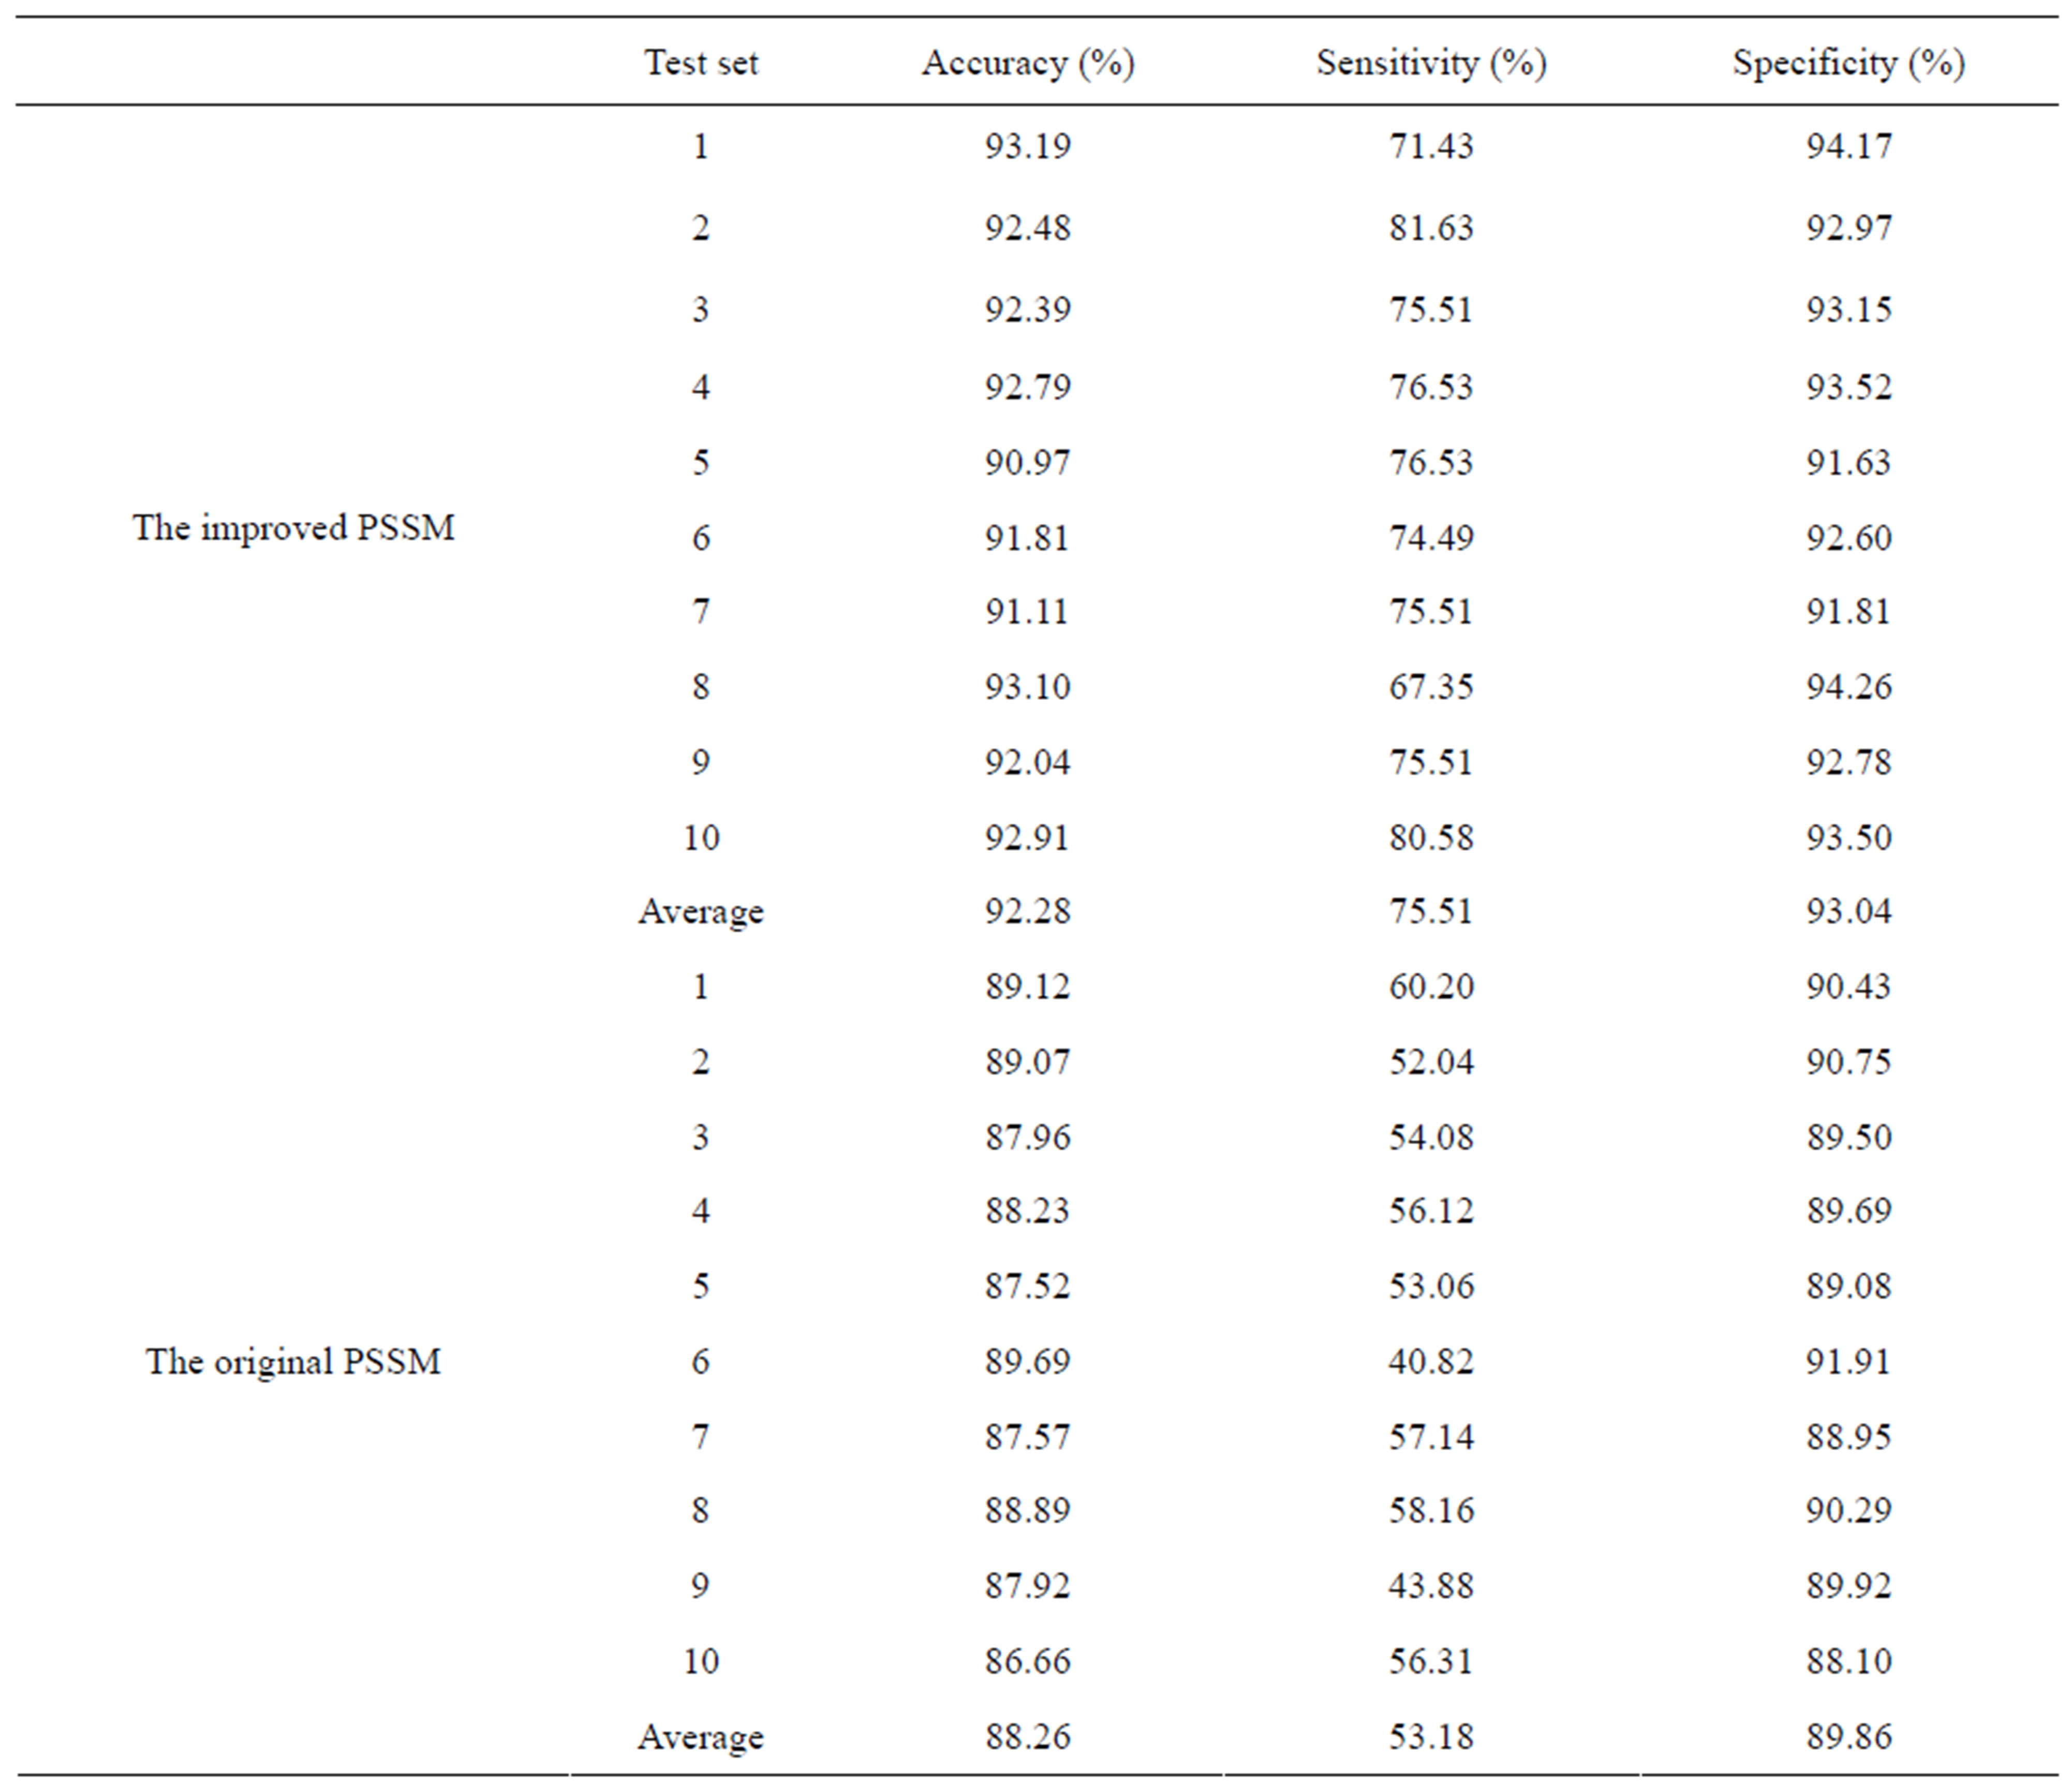
Table 1. The prediction results of the test sets using the SVM-based ensemble learning.
3.4. Performance on the Independent Dataset
In statistical prediction, the following three crossvalidation methods are often used to examine a predictor for its effectiveness in practical application: independent dataset test, subsampling test, and jackknife test [48]. However, as elaborated in [49], among the three crossvalidation methods, the jackknife test is regarded as the least arbitrary or most objective that can always yield a unique result for a given benchmark dataset, and hence has been increasingly used and widely recognized by investigators to examine the accuracy of various predictors [50-66]. However, to reduce the computational time, we adopted the 5-fold cross-validation in this study as done by many investigators with SVM as the prediction engine.
An independent dataset was selected from 100 protein complexes [9]. The mutual sequence identity in the independent dataset and the sequence identity between the independent dataset and the training dataset are both less than 40%. The independent dataset contained 349 positive samples and 6121 negative samples. Our method achieves a good performance and the sensitivity, specificity and accuracy are 65.04%, 85.80% and 84.68%, respectively. The results suggest that our method has the good generalization ability in predicting drug-binding sites for novel proteins.
4. CONCLUSIONS
In this paper, we proposed a new method for predicting drug-binding sites only using the primary sequences of proteins. A PSSM profile was employed to represent the evolutionary information of each residue in a protein. Considering the influence of the surrounding residues on the drug-binding sites, the PSSM profile was improved by using a sliding window and a smoothing window. So the improved PSSM profile adequately takes the local sequence information of a drug-binding site into account. On the other hand, because the number of drug-binding sites is much smaller than that of non drug-binding sites, a new SVM-based ensemble learning method was used to solve this imbalanced data classification problem. This method fully utilizes the information available from the non drug-binding sites and the more objective prediction result was achieved. Our method gives a high AUC of 0.9264. It suggests that our method is feasible and valid. Meanwhile, the final prediction model was tested using the independent dataset of 349 drug-binding residues with a good performance. Overall, it indicates that our method can be a useful supplement to identify the unknown drug-binding sites.
Since user-friendly and publicly accessible web-servers represent the future direction for developing practically more useful models, simulated methods, or predictors [67,68], we shall make efforts in our future work to provide a web-server for the method presented in this paper.
5. ACKNOWLEDGEMENTS
This work was supported by the National Natural Science Foundation of China (Nos. 20905054, 20972103, 20973115) and the Specialized Research Fund for the Doctoral Program of Higher Education (No. 20090181120058) and National Basic Research Program of China (2007CB512602).
REFERENCES
- Riddall, D.R., Leach, M.J. and Garthwaite, J. (2006) A novel drug binding site on voltage-gated sodium channels in rat brain. Molecular Pharmacology, 69, 278-287. doi:10.1124/mol.105.015966
- Zsila, F. and Iwao, Y. (2007) The drug binding site of human α1-acid glycoprotein: Insight from induced circular dichroism and electronic absorption spectra. Biochimica et Biophysica Acta, General Subjects, 1770, 797-809. doi:10.1016/j.bbagen.2007.01.009
- Barasoain, I., Matesanz, R., Maccari, G., Trigili C., Mori, M., et al. (2010) Probing the pore drug binding site of Microtubules with fluorescent taxanes: Evidence of two binding poses. Chemistry & Biology, 17, 243-253. doi:10.1016/j.chembiol.2010.02.006
- Messori, L., Piccioli, F., Gabrielli, S., Orioli, P., Angelonia, L. and Bugnob, C.D. (2002) The disaccharide anthracycline MEN 10755 binds human serum albumin to a non-classical drug binding site. Bioorganic &Medicinal Chemistry, 10, 3425-3430. doi:10.1016/S0968-0896(02)00265-1
- Chen, K., Huzil, J.T., Freedman, H., Ramachandran, P., Antoniou, A., Tuszynski, J.A., et al. (2008) Identification of tubulin drug binding sites and prediction of relative differences in binding affinities to tubulin isotypes using digital signal processing. Journal of Molecular Graphics &Modelling, 27, 497-505. doi:10.1016/j.jmgm.2008.09.001
- Fuller, J.C., Burgoyne, N.J. and Jackson, R.M. (2009) Predicting druggable binding sites at the protein-protein interface. Drug Discovery Today, 14, 155-161. doi:10.1016/j.drudis.2008.10.009
- Capra, J.A., Laskowski, R.A., Thornton, J.M., Singh, M. and Funkhouser, T.A. (2009) Predicting protein ligand binding sites by combining evolutionary sequence conservation and 3D structure. Plos Computational Biology, 5, e1000585. doi:10.1371/journal.pcbi.1000585
- Nayal, M. and Honig, B. (2006) On the nature of cavities on protein surfaces: Application to the identification of drug-binding sites. Proteins: Structure, Function, and Bioinformatics, 63, 892-906. doi:10.1002/prot.20897
- Perola, E., Walters, W.P. and Charifson, P.S. (2004) A detailed comparison of current docking and scoring methods on systems of pharmaceutical relevance. Proteins: Structure, Function, and Bioinformatics, 56, 235- 249. doi:10.1002/prot.20088
- Ghersi, D. and Sanchez, R. (2009) Improving accuracy and efficiency of blind protein-ligand docking by focusing on predicted binding sites. Proteins: Structure, Function, and Bioinformatics, 74, 417-424. doi:10.1002/prot.22154
- Thangudu, R.R., Tyagi, M., Shoemaker, B.A., Bryant, S.H., Panchenko, A.R. and Madej, T. (2010) Knowledge-based annotation of small molecule binding sites in proteins. BMC Bioinformatics, 11, 365. doi:10.1186/1471-2105-11-365
- Laurie, A.T.R. and Jackson, R.M. (2006) Methods for the prediction of protein-ligand binding sites for structure-based drug design and virtual ligand screening. Current Protein and Peptide Science, 7, 395-406. doi:10.2174/138920306778559386
- Berman, H.M., Westbrook, J., Feng, Z.K., Gilliland, G., Bhat, T.N., Weissig, H., et al. (2000) The protein data bank. Nucleic Acids Research, 28, 235-242. doi:10.1093/nar/28.1.235
- Altschul, S.F., Madden, T.L., A.A., J.H., Z. Zhang, Miller, W. and Lipman, D.J. (1997) Gapped BLAST and PSIBLAST: A new generation of protein database search programs. Nucleic Acids Research, 25, 3389-3402. doi:10.1093/nar/25.17.3389
- Wu, J.S., Liu, H.D., Duan, X.Y., Ding, Y., Wu, H.T., Bai, Y.F., et al. (2009) Prediction of DNA-binding residues in proteins from amino acid sequences using a random forest model with a hybrid feature. Bioinformatics, 25, 30-35. doi:10.1093/bioinformatics/btn583
- Wang Y., Xue, Z., Shen, G. and Xu, J. (2008) PRINTR: Prediction of RNA binding sites in proteins using SVM and profiles. Amino Acids, 35, 295-302. doi:10.1007/s00726-007-0634-9
- Zhang T., Zhang, H., Chen, K., Shen, S.Y., Ruan, J.S. and Kurgan, L. (2008) Accurate sequence-based prediction of catalytic residues. Bioinformatics, 24, 2329-2338. doi:10.1093/bioinformatics/btn433
- Kumar, M., Gromiha, M.M. and Raghava, G.P.S. (2008) Prediction of RNA binding sites in a protein using SVM and PSSM profile. Proteins: Structure, Function, and Bioinformatics, 71, 189-194. doi:10.1002/prot.21677
- Ahmad, S. and Sarai, A. (2005) PSSM-based prediction of DNA binding sites in proteins. BMC Bioinformatics, 6, 33. doi:10.1186/1471-2105-6-33
- Chauhan, J.S., Mishra, N.K. and Raghava, G.P.S. (2009) Identification of ATP binding residues of a protein from its primary sequence. BMC Bioinformatics, 10, 434. doi:10.1186/1471-2105-10-434
- Kaur, H. and Raghava, G.P.S. (2003) Prediction of b-turns in proteins from multiple alignment using neural network. Protein Science, 12, 627-634. doi:10.1110/ps.0228903
- Garg, A., Kaur, H. and Raghava, G.P.S. (2005) Real value prediction of solvent accessibility in proteins using multiple sequence alignment and secondary structure. Proteins, 61, 318-324. doi:10.1002/prot.20630
- Cheng, C.W., Su, E.C., Hwang, J., Sung, T.Y. and Hsu, W.L. (2008) Predicting RNA-binding sites of proteins using support vector machines and evolutionary information. BMC Bioinformatics, 9, S6. doi:10.1186/1471-2105-9-S12-S6
- Wang, C.C., Fang, Y.P., Xiao, J.M. and Li, L.M. (2011) Identification of RNA-binding sites in proteins by integrating various sequence information. Amino Acids, 40, 239-248. doi:10.1007/s00726-010-0639-7
- Hayat, M. and Khan, A. (2012) MemHyb: Predicting membrane protein types by hybridizing SAAC and PSSM. Journal of Theoretical Biology, 292, 93-102. doi:10.1016/j.jtbi.2011.09.026
- Li, D., Jiang, Z., Yu, W. and Du, L. (2010) Predicting caspase substrate cleavage sites based on a hybrid SVMPSSM method. Protein and Peptide Letters, 17, 1566- 1571.
- Mundra, P., Kumar, M., Kumar, K.K., Jayaraman, V.K. and Kulkarni, B.D. (2007) Using pseudo amino acid composition to predict protein subnuclear localization: Approached with PSSM. Pattern Recognition Letters, 28, 1610-1615. doi:10.1016/j.patrec.2007.04.001
- Shen, H.B. and Chou, K.C. (2007) Nuc-PLoc: A new web-server for predicting protein subnuclear localization by fusing PseAA composition and PsePSSM. Protein engineering. Design & Selection, 20, 561-567. doi:10.1093/protein/gzm057
- Chou, K.C., Wu, Z.C. and Xiao, X. (2011) iLoc-Euk: A multi-label classifier for predicting the subcellular localization of singleplex and multiplex eukaryotic proteins. PLoS ONE, 6, e18258. doi:10.1371/journal.pone.0018258
- Wu, Z.C., Xiao, X. and Chou, K.C. (2011) iLoc-plant: A multi-label classifier for predicting the subcellular localization of plant proteins with both single and multiple sites. Molecular Biosystems, 7, 3287-3297. doi:10.1039/c1mb05232b
- Chou, K.C. and Shen, H.B. (2007) MemType-2L: A Web server for predicting membrane proteins and their types by incorporating evolution information through PsePSSM. Biochemical and Biophysical Research Communications, 360, 339-345. doi:10.1016/j.bbrc.2007.06.027
- Wu, Z.C., Xiao, X. and Chou, K.C. (2012) iLoc-Gpos: A multi-layer classifier for predicting the subcellular localization of singleplex and multiplex gram-positive bacterial proteins. Protein & Peptide Letters, 19, 4-14.
- Chou, K.C., Wu, Z.C. and Xiao, X. (2012) iLoc-Hum: Using accumulation-label scale to predict subcellular locations of human proteins with both single and multiple sites. Molecular Biosystems, 8, 629-641. doi:10.1039/c1mb05420a
- Vapnik, V.N. (1998) Statistical learning theory. Wiley, New York.
- Chou, K.C. and Cai, Y.D. (2002) Using functional domain composition and support vector machines for prediction of protein subcellular location. Journal of Biological Chemistry, 277, 45765-45769. doi:10.1074/jbc.M204161200
- Cai, Y.D., Liu X.J., Xu, X.B. and Chou, K.C. (2002) Support vector machines for predicting HIV protease cleavage sites in protein. Journal of Computational Chemistry, 23, 267-274. doi:10.1002/jcc.10017
- Cai, Y.D., Zhou, G.P. and Chou, K.C. (2003) Support vector machines for predicting membrane protein types by using functional domain composition. Biophysical Journal, 84, 3257-3263. doi:10.1016/S0006-3495(03)70050-2
- Petrova, N.V. and Wu, C.H. (2006) Prediction of catalytic residues using support vector machine with selected protein sequence and structural properties. BMC Bioinformatics, 7, 312. doi:10.1186/1471-2105-7-312
- Pugalenthi, G., Kumar, K.K., Suganthan, P.N. and Gangal, R. (2008) Identification of catalytic residues from protein structure using support vector machine with sequence and structural features. Biochemical and Biophysical Research Communications, 367, 630-634. doi:10.1016/j.bbrc.2008.01.038
- Li, S.L., Li, H., Li, M.F., Shyr, Y., Xie, L. and Li, Y.X. (2009) Improved prediction of lysine acetylation by support vector machines. Protein & Peptide Letters, 16, 977- 983. doi:10.2174/092986609788923338
- Li, Z.C., Zhou, X., Dai, Z. and Zou, X.Y. (2011) Identification of protein methylation sites by coupling improved ant colony optimization algorithm and support vector machine. Analytical Chimica Acta, 703, 163-171.
- Dietterich, T.G. (2000) Ensemble methods in machine learning. Lecture Notes in Computer Science, 1857, 1-15. doi:10.1007/3-540-45014-9_1
- Kuncheva, L.I., Skurichina, M. and Duin, R.P.W. (2002) An experimental study on diversity for bagging and boosting with linear classifiers. Inform Fusion, 3, 245- 258. doi:10.1016/S1566-2535(02)00093-3
- Caragea, C., Sinapov, J., Silvescu, A., Dobbs, D. and Honavar, V. (2007) Glycosylation site prediction using ensembles of support vector machine classifiers. BMC Bioinformatics, 8, 438. doi:10.1186/1471-2105-8-438
- Xu Y., Wang, X.B., Ding, J., Wu, L.Y. and Deng, N.Y. (2010) Lysine acetylation sites prediction using an ensemble of support vector machine classifiers. Journal of Theoretical Biology, 264, 130-135. doi:10.1016/j.jtbi.2010.01.013
- Swets, J.A. (1988) Measuring the accuracy of diagnostic systems. Science, 240, 1285-1293. doi:10.1126/science.3287615
- Bradley, A.P. (1997) The use of the area under the ROC curve in the evaluation of machine learning algorithms. Pattern Recognition, 30, 1145-1159. doi:10.1016/S0031-3203(96)00142-2
- Chou, K.C. and Zhang, C.T. (1995) Review: Prediction of protein structural classes. Critical Reviews in Biochemistry and Molecular Biology, 30, 275-349. doi:10.3109/10409239509083488
- Chou, K.C. (2011) Some remarks on protein attribute prediction and pseudo amino acid composition (50th Anniversary Year Review). Journal of Theoretical Biology, 273, 236-247. doi:10.1016/j.jtbi.2010.12.024
- Chen, C., Chen, L., Zou, X. and Cai, P. (2009) Prediction of protein secondary structure content by using the concept of Chou’s pseudo amino acid composition and support vector machine. Protein & Peptide Letters, 16, 27-31. doi:10.2174/092986609787049420
- Ding, H., Luo, L. and Lin, H. (2009) Prediction of cell wall lytic enzymes using Chou’s amphiphilic pseudo amino acid composition. Protein & Peptide Letters, 16, 351-355. doi:10.2174/092986609787848045
- Esmaeili, M., Mohabatkar, H. and Mohsenzadeh, S. (2010) Using the concept of Chou’s pseudo amino acid composition for risk type prediction of human papillomaviruses. Journal of Theoretical Biology, 263, 203-209. doi:10.1016/j.jtbi.2009.11.016
- Georgiou, D.N., Karakasidis, T.E., Nieto, J.J. and Torres, A. (2009) Use of fuzzy clustering technique and matrices to classify amino acids and its impact to Chou’s pseudo amino acid composition. Journal of Theoretical Biology, 257, 17-26. doi:10.1016/j.jtbi.2008.11.003
- Gu, Q., Ding, Y.S. and Zhang, T.L. (2010) Prediction of G-protein-coupled receptor classes in low homology using Chou’s pseudo amino acid composition with approximate entropy and hydrophobicity patterns. Protein & Peptide Letters, 17, 559-567. doi:10.2174/092986610791112693
- Guo, J., Rao, N., Liu, G., Yang, Y. and Wang, G. (2011) Predicting protein folding rates using the concept of Chou’s pseudo amino acid composition. Journal of Computational Chemistry, 32, 1612-1617. doi:10.1002/jcc.21740
- Jiang, X., Wei, R., Zhang, T.L. and Gu, Q. (2008) Using the concept of Chou’s pseudo amino acid composition to predict apoptosis proteins subcellular location: An approach by approximate entropy. Protein & Peptide Letters, 15, 392-396. doi:10.2174/092986608784246443
- Lin, H. (2008) The modified Mahalanobis discriminant for predicting outer membrane proteins by using Chou’s pseudo amino acid composition. Journal of Theoretical Biology, 252, 350-356. doi:10.1016/j.jtbi.2008.02.004
- Lin, J. and Wang, Y. (2011) Using a novel AdaBoost algorithm and Chou’s pseudo amino acid composition for predicting protein subcellular localization. Protein & Peptide Letters, 18, 1219-1225. doi:10.2174/092986611797642797
- Mei, S. (2012) Multi-kernel transfer learning based on Chou’s PseAAC formulation for protein submitochondria localization. Journal of Theoretical Biology, 293, 121- 130. doi:10.1016/j.jtbi.2011.10.015
- Mohabatkar, H. (2010) Prediction of cyclin proteins using Chou’s pseudo amino acid composition. Protein & Peptide Letters, 17, 1207-1214. doi:10.2174/092986610792231564
- Mohabatkar, H., Mohammad Beigi, M. and Esmaeili, A. (2011) Prediction of GABA(A) receptor proteins using the concept of Chou’s pseudo-amino acid composition and support vector machine. Journal of Theoretical Biology, 281, 18-23. doi:10.1016/j.jtbi.2011.04.017
- Mohammad Beigi, M., Behjati, M. and Mohabatkar, H. (2011) Prediction of metalloproteinase family based on the concept of Chou’s pseudo amino acid composition using a machine learning approach. Journal of Structural and Functional Genomics, 12, 191-197. doi:10.1007/s10969-011-9120-4
- Nanni, L., Lumini, A., Gupta, D. and Garg, A. (2012) Identifying bacterial virulent proteins by fusing a set of classifiers based on variants of Chou’s pseudo amino acid composition and on evolutionary information. IEEE/ACM Transactions on Computational Biology and Bioinformatics, 9, 467-475.
- Qiu, J.D., Huang, J.H., Shi, S.P. and Liang, R.P. (2010) Using the concept of Chou’s pseudo amino acid composition to predict enzyme family classes: An approach with support vector machine based on discrete wavelet transform. Protein & Peptide Letters, 17, 715-722. doi:10.2174/092986610791190372
- Sahu, S.S. and Panda, G. (2010) A novel feature representation method based on Chou’s pseudo amino acid composition for protein structural class prediction. Computational Biology and Chemistry, 34, 320-327. doi:10.1016/j.compbiolchem.2010.09.002
- Zou, D., He, Z., He, J. and Xia, Y. (2011) Supersecondary structure prediction using Chou’s pseudo amino acid composition. Journal of Computational Chemistry, 32, 271-278. doi:10.1002/jcc.21616
- Chou, K.C. and Shen, H.B. (2009) Review: Recent advances in developing web-servers for predicting protein attributes. Natural Science, 2, 63-92. doi:10.4236/ns.2009.12011
- Chou, K.C. and Shen, H.B. (2008) Cell-PLoc: A package of Web servers for predicting subcellular localization of proteins in various organisms (updated version: CellPLoc 2.0: An improved package of web-servers for predicting subcellular localization of proteins in various organisms. Natural Science, 2, 1090-1103. doi:10.1038/nprot.2007.494