Health
Vol.5 No.12(2013), Article ID:40667,7 pages DOI:10.4236/health.2013.512267
Relationship between body mass index and course of pregnancy in women
![]()
1Department of Disability and Health, Division of Health Sciences, Hirosaki University Graduate School of Health Sciences, Aomori, Japan; *Corresponding Author: takamagi@cc.hirosaki-u.ac.jp
2Department of Health Promotion, Division of Health Sciences, Hirosaki University Graduate School of Health Sciences, Aomori, Japan
Copyright © 2013 Shizuka Takamagi, Hideaki Yamabe. This is an open access article distributed under the Creative Commons Attribution License, which permits unrestricted use, distribution, and reproduction in any medium, provided the original work is properly cited.
Received 22 October 2013; revised 25 November 2013; accepted 1 December 2013
Keywords: Pregnant Women; Body Mass Index; Nutrition; Food Frequency Questionnaire Based on Food Groups (FFQg)
ABSTRACT
Nutritional management and suitable weight control during pregnancy are very important. However, in clinical practice, it is difficult to determine in detail precisely what pregnant women are eating. We investigated nutritional balance and nutritional requirements in pregnant women and their relationship to the course of pregnancy. A Food Frequency Questionnaire Based on Food Groups (FFQg) was distributed to 223 women at 12 weeks gestation attending one obstetrics clinic. We observed the women’s statuses until delivery and obtained information on pregnancy, delivery, and newborn from their medical records. One hundred and forty-seven (65.9%) of the subjects had problem-free pregnancies. Only 2 (0.9%) subjects developed pregnancy-induced hypertension syndrome. Participants were classified by pre-pregnancy BMI (body mass index; kg/m2) as follows: 44 (19.7%) were underweight (BMI < 18.5); 164 (73.6%) were of normal weight (BMI 18.5 - 24.9) and 15 (6.7%) were overweight (BMI < 25.0). Average infant birth weight was significantly lower in the underweight group than in the normal group (P < 0.05). There was no relationship between outcome of pregnancy and pre-pregnancy BMI. There were no marked differences in daily nutrients consumed among the three groups. However, the underweight group consumed significantly more fat than the normal group and gained significantly more weight before delivery than the others. Blood pressure was significantly higher in the overweight group than in the other groups at some points of gestation, although it remained within the normal range. Fat intake overall was more than the recommended value, especially in the underweight group. The relationship between course of pregnancy and nutritional intake was unclear. However, pre-pregnancy BMI may influence the course of pregnancy in terms of infant weight, gestational weight gain, and blood pressure.
1. INTRODUCTION
Suitable weight control during pregnancy is very important for the health of both the pregnant woman and her baby. Previous studies have reported that the amount of weight gained during pregnancy and the pre-pregnancy body mass index (BMI) can influence pregnancy, delivery, and newborn health [1-4]. For example, excess weight gain during pregnancy is associated with increased risk of hypertensive disorders, cesarean delivery, and large-for-gestational-age neonates [5]. Being underweight before pregnancy increases the risk of having small-for-gestational-age and low-body-weight babies, whereas being overweight or obese before pregnancy increases the risk of having large-for-gestational-age babies with high birth weight or macrosomia, as well as the risk of subsequent overweight or obesity in these children when they reach adulthood [6]. Children who are malnourished in utero or born underweight have a high probability of developing obesity, diabetes, lipid abnormalities, hypertension, and metabolic syndrome in adulthood; this is an example of “DOHaD” (the developmental origins of health and disease) [7]. These findings indicate that the dietary status of pregnant women is reflected in the future health of their children. Therefore, nutritional management and weight management before pregnancy—not just during pregnancy—are important.
In Japan, weight control in pregnant woman is guided by charts released by the Ministry of Health, Labour, and Welfare for appropriate weight increase in pregnancy [8]. Actual intakes of nutrients by pregnant women are probably less than the recommended values. One study has shown that the diets of 39.6% of Japanese pregnant women do not meet the recommended criteria [9]. Recent Japanese data show that over 20% of young women are underweight (body mass index [BMI] < 18.5 kg/m2), possibly because of the strong desire among contemporary young women to be thin [10]. Although nutritional education on weight gain restriction has been undertaken in many Japanese hospitals or clinics following the recommendation charts, very few studies have been done on the adverse effects of excessive maternal weight gain on pregnancy outcome.
We attempted to clarify objectively the nutritional status of pregnant women by using the Food Frequency Questionnaire Based on Food Groups (FFQg), which can estimate daily dietary intake. Our aim was to evaluate the women’s nutritional status and elucidate any associated problems; we also aimed to help reduce the incidence of abnormal outcomes of pregnancy by elucidating the relationship between nutritional status and course of pregnancy.
2. MATERIALS AND METHODS
2.1. Study Design and Subjects
This study was part of a prospective study. The FFQg question sheet was distributed to 223 pregnant women at 12 weeks gestation who attended one obstetrics clinic in the city of Hirosaki, in northern Honshu, between July 2011 and June 2012. We observed the women’s statuses until delivery, and we obtained information on pregnancy, delivery, and newborn from medical records.
2.2. Dietary Assessment and Calculation of Nutrient Intakes
Dietary intake was assessed by using FFQg Ver. 3.0, developed by Yoshimura (Kenpaku-sha, Tokyo, Japan) [11]. The FFQ has been widely used for epidemiological purposes because it satisfies the above conditions [12]. The FFQg can be used to estimate daily meal content from easy questions covering 29 food groups and 10 kinds of cooking method. In this established semiquantitative questionnaire, subjects state their frequency of intake (i.e. food frequency) and amount of food intake (i.e. portion size) over a period of 1 week in 1 or 2 recent months. The established software “Excel-eiyoukun” Ver. 5.0 and FFQg Ver. 3.0 (Kenpaku-sha, Tokyo, Japan) [13] was used to calculate daily intakes of nutrients from foods. This method has been shown in Japan to be reliable and valid [14].
2.3. Statistical Analysis
Data were expressed as means ± standard deviation (SD). Differences between groups were tested for statistical significance by using Student’s t-test, or one-way ANOVA and multiple comparison. All data analyses were performed with IBM SPSS statistics 19 on a Windows operating system. A P-value of less than 0.05 was considered statistically significant.
2.4. Ethical Approval
All procedures were approved by the Ethics Committee of Hirosaki University, and informed consent was obtained from all participants.
3. RESULTS
3.1. Overall Characteristics of Participants
Two hundred and twenty-three participants completed the FFQg and were included in the validation study. Tables 1 and 2 show the patient characteristics. Participants ranged in age from 18 to 41 years, with a mean age of 29.6 ± 4.4 years. Mean ± SD height was 158.9 ± 5.4 cm, pre-pregnancy body weight was 52.0 ± 7.4 kg, and prepregnancy BMI was 20.5 ± 2.6 kg/m2. Mean ± SD weight gain during pregnancy was 9.5 ± 3.1 kg, length of gestation was 39.1 ± 7.4 weeks, and infant birth weight was 3119.7 ± 364.6 g.
The women were classified by pre-pregnancy BMI as follows: 44 (19.7%) were underweight (BMI < 18.5 kg/m2), 164 (73.6%) were of normal weight (BMI 18.5 - 24.9 kg/m2), and 15 (6.7%) were overweight (BMI > 25.0 kg/m2). Ninety-seven (43.5%) were primiparous and 126 (56.5%) were multiparous; 173 (79.7%) had spontaneous deliveries, 24 (11.0%) had vacuum-assisted deliveries, and 19 (8.8%) had cesarean deliveries. The average infant birth weight was significantly lighter in the underweight group than in the normal group (P < 0.05) (Figure 1).
3.2. Outcomes
One hundred and forty-seven women (65.9%) had uneventful pregnancies. Thirteen subjects (5.8%) were hospitalized for threatened premature delivery, 11 (8.9%) for impaired glucose tolerance, and 2 (0.9%) for other problems. Two (0.9%) subjects had pregnancy-induced hypertension syndrome. Twelve (5.4%) required emergency transport; 18 (8.1%) were transferred to other hospitals by the reasons at their own request or because of
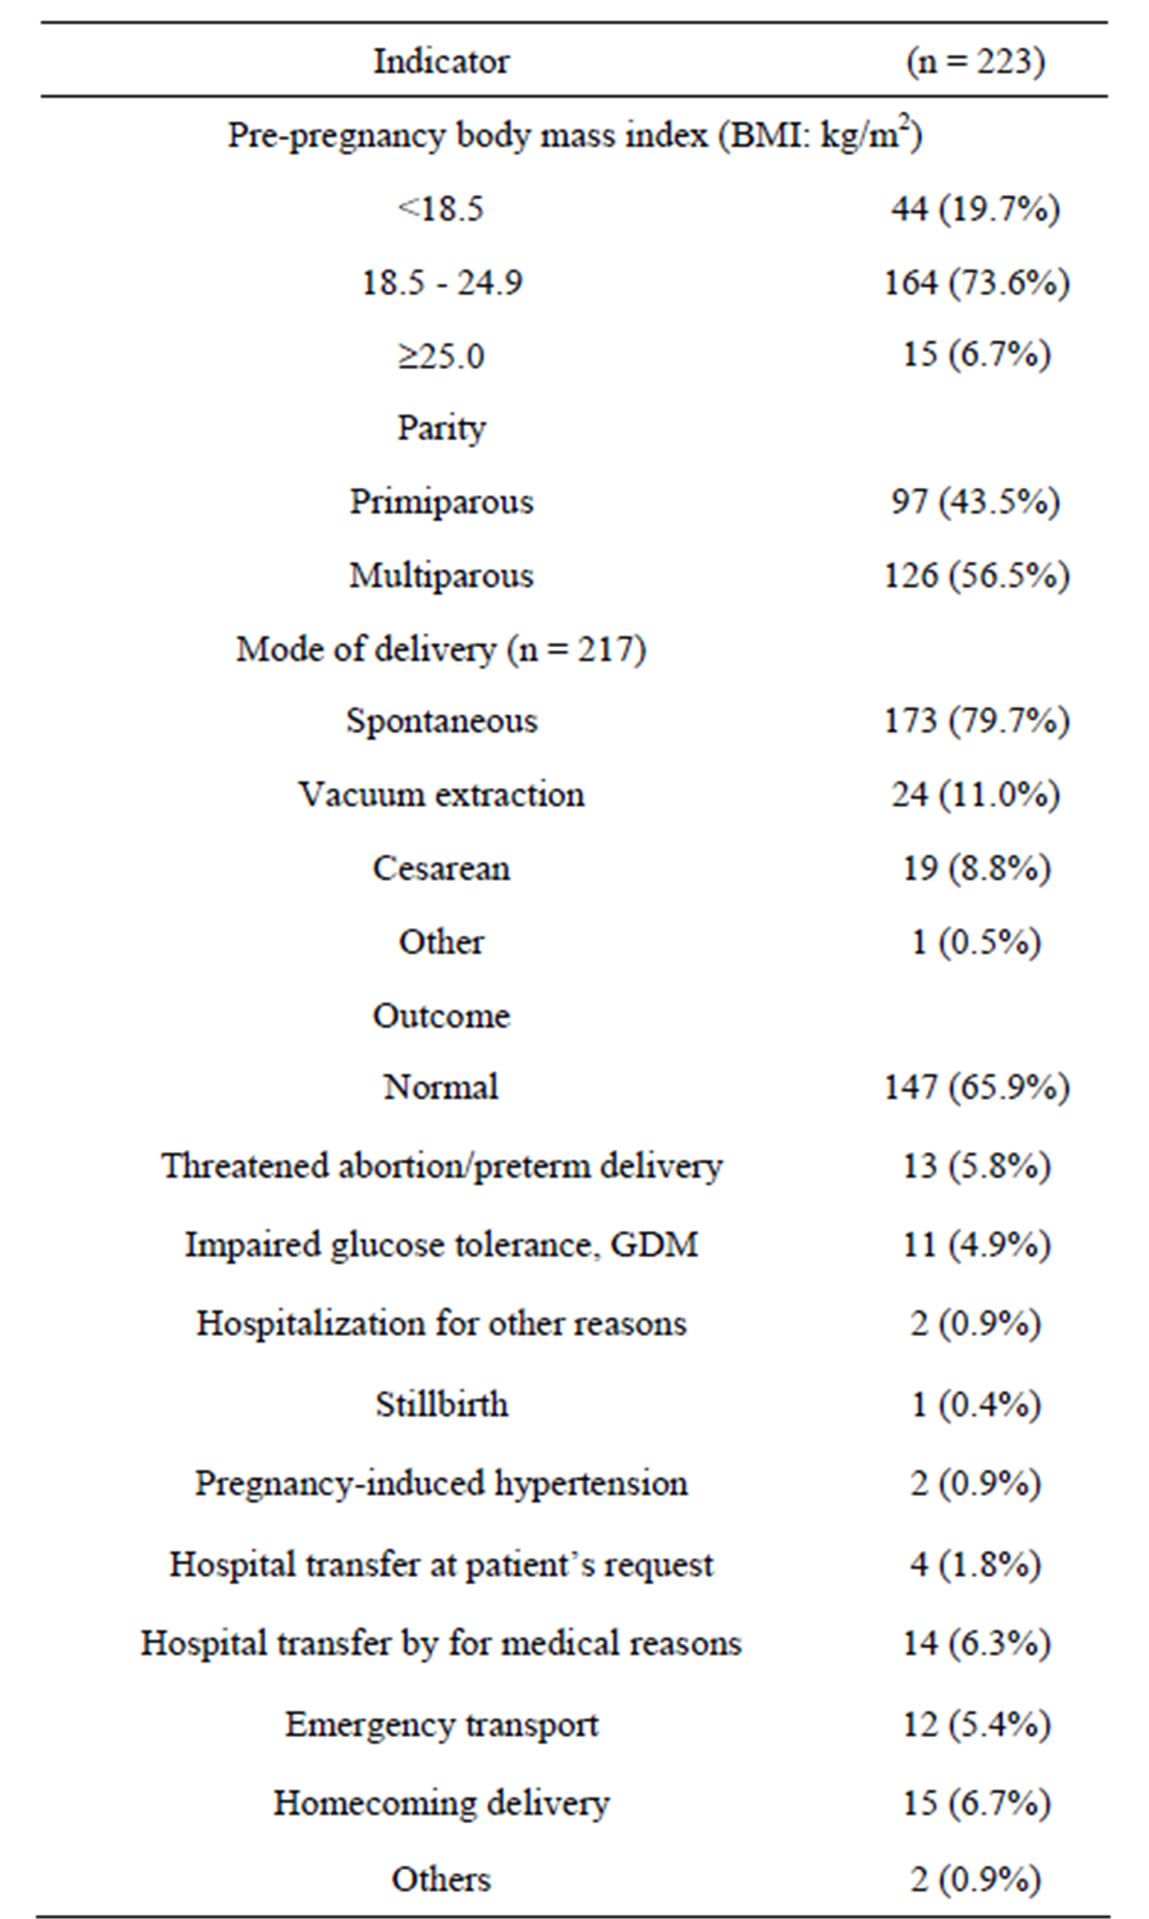
Table 1. Subject characteristics and pregnancy outcomes.
Data are expressed as numbers, with percentages in parentheses.
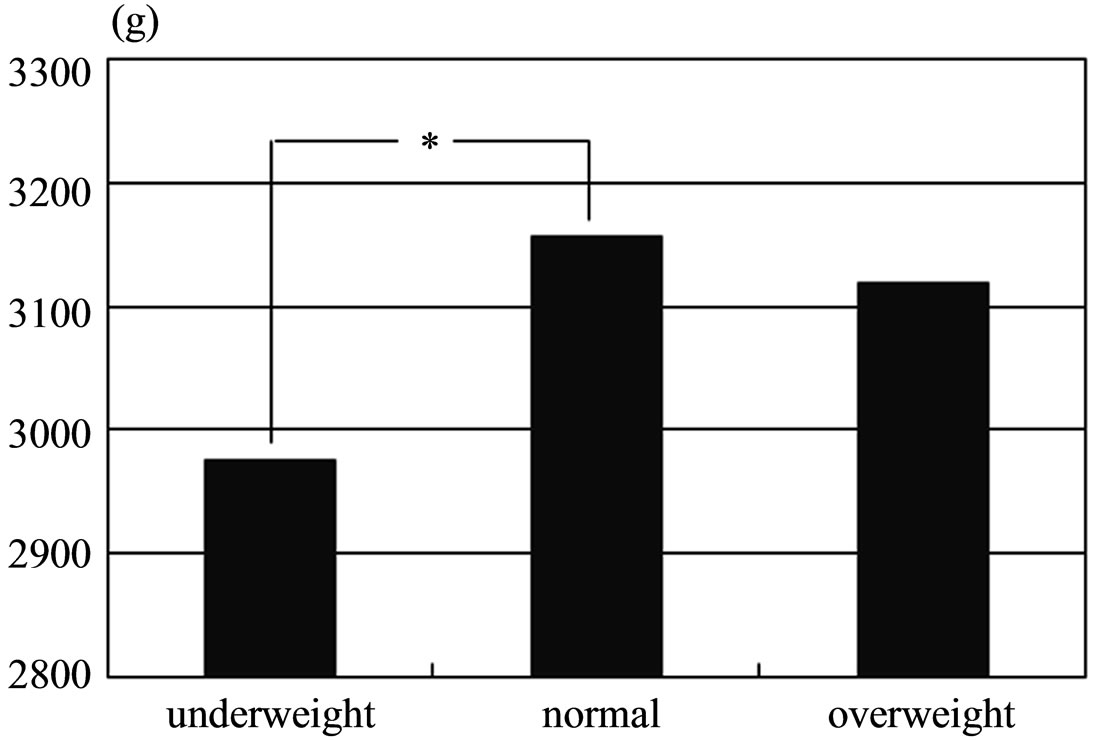
Figure 1. Comparison of average infant birth weights. *P < 0.05 by one-way ANOVA and multiple comparison.
the need for particular medical procedures, and 15 (6.7%) returned to their home towns for delivery.
To investigate the relationship between pre-pregnancy weight and outcome, pre-pregnancy BMI was scored as underweight, 1; normal weight, 2; and overweight, 3.
The average score of subjects who gave birth normally was 1.87; that of subjects who did not have normal births (i.e. were hospitalized for threatened premature delivery or stillbirth or required transfer to specialist units) was 1.85. There was no significant difference between the two scores.
3.3. Nutrient Intakes
We estimated the intakes of energy and various nutrients, as calculated by using the FFQg (Table 3). The mean (± SD) daily intakes of total energy, protein, total lipids, and carbohydrates were 1717.7 ± 364.8 kcal, 57.4 ± 14.6 g, 58.7 ± 16.8 g, and 234.5 ± 48.6 g, respectively. The mean (± SD) intakes of calcium, iron, total fiber, and salt were 519.6 ± 185.5 mg, 6.5 ± 1.9 mg, 11.1 ± 3.2 g,
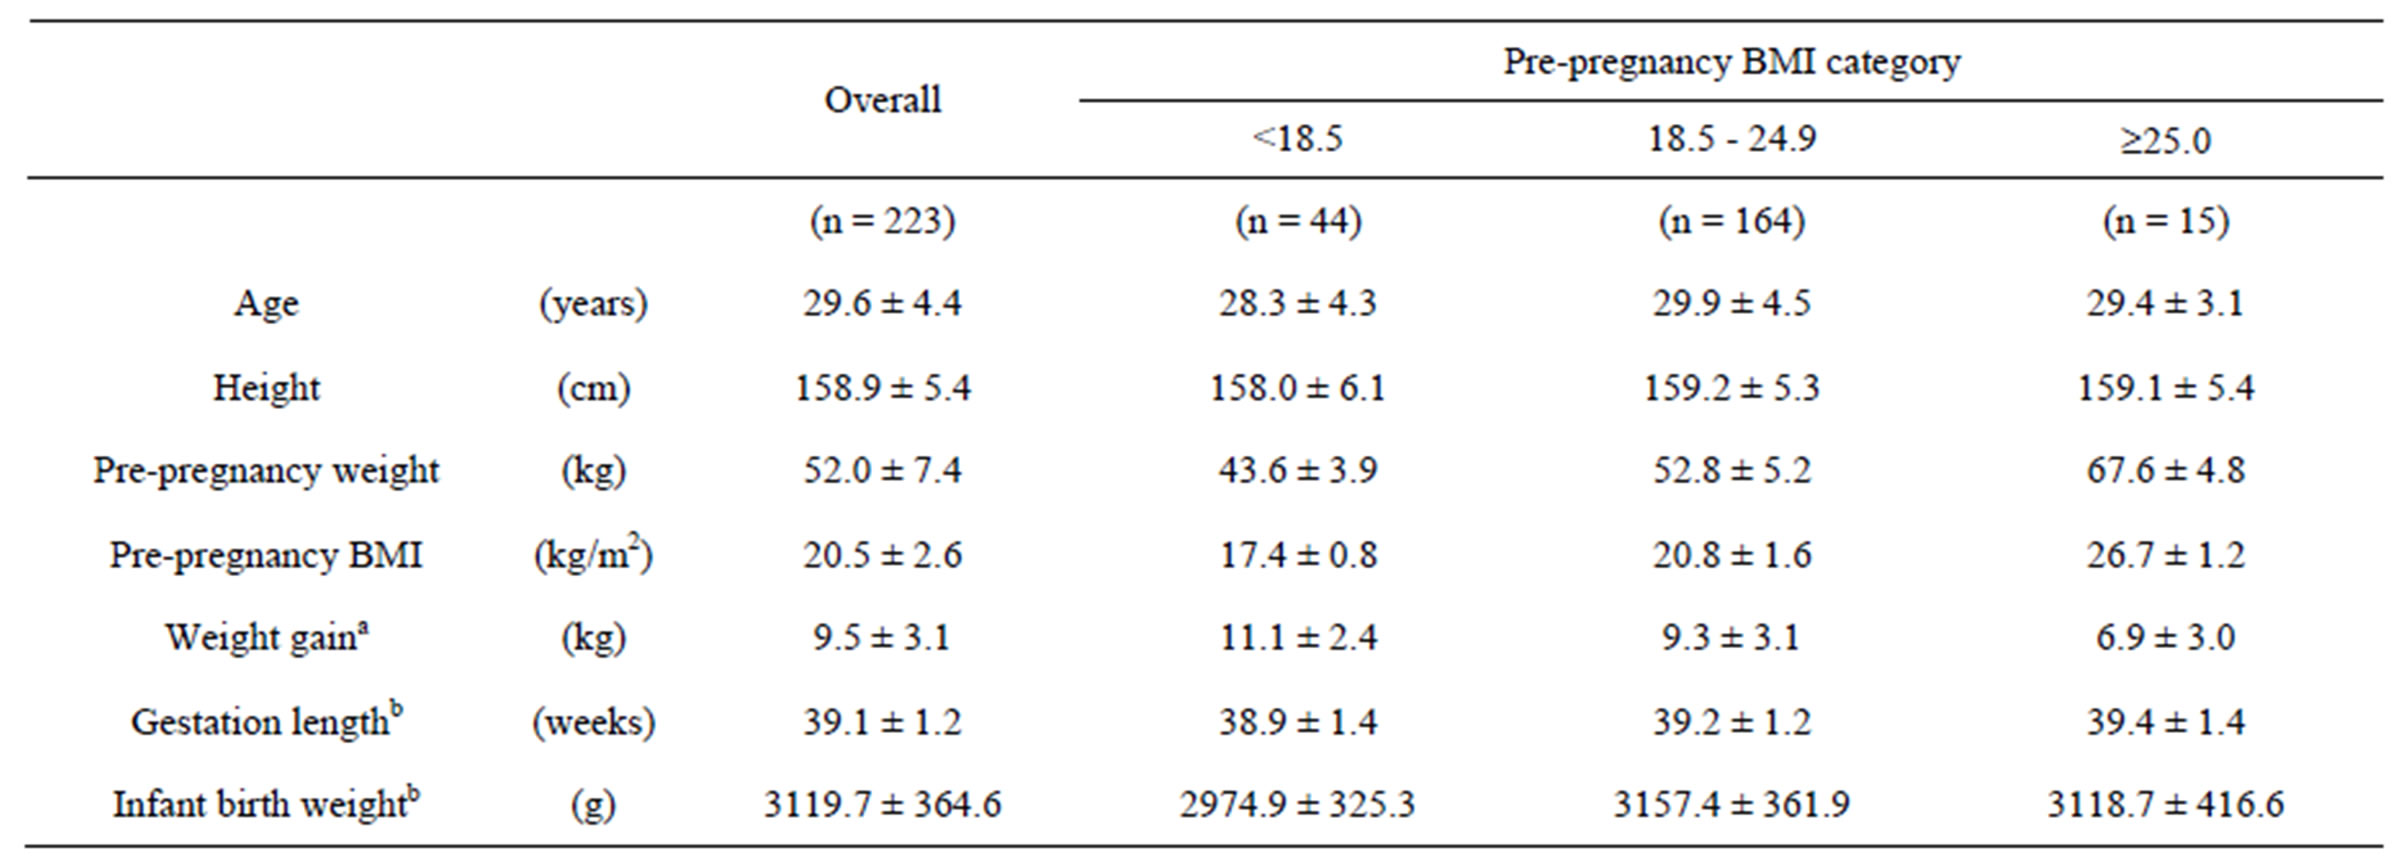
Table 2. Subject characteristics by pre-pregnancy BMI category.
Data are expressed as means ± SD. aTotal of 169 subjects (BMI < 18.5, n = 31; 18.5 - 24.9, n = 126; ³25.0, n = 12); bTotal of 214 subjects (BMI < 18.5, n = 41; 18.5 - 24.9, n = 158; ³25.0, n = 15).
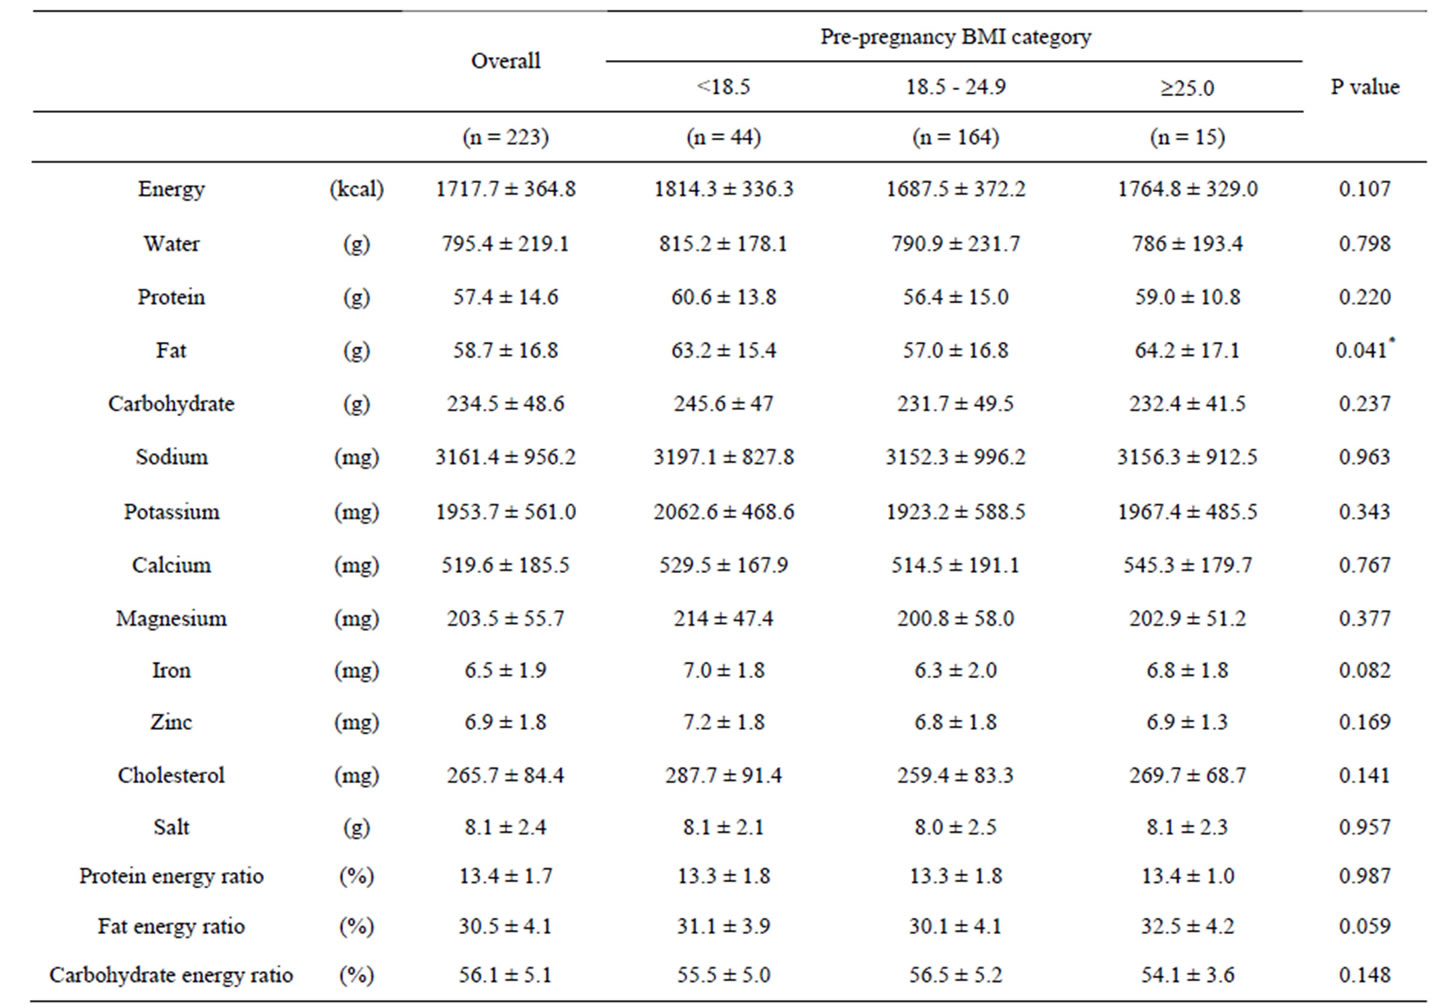
Table 3. Daily intake of selected nutrients in pregnant women, as obtained from the FFQg.
*P < 0.05 by one way ANOVA; Data are expressed as means ± SD.
and 8.1 ± 2.4 g, respectively. The mean (± SD) intakes of protein energy ratio, fat energy ratio, and carbohydrate energy ratio were 13.4% ± 1.7%, 30.5% ± 4.1%, and 56.1% ± 5.1%.
In our analysis by pre-pregnancy BMI, the mean (± SD) intake of total energy in the underweight, normal, and overweight groups was 1814.3 ± 336.3 kcal, 1687.5 ± 372.2 kcal, 1764.8 ± 329.0 kcal. There was no significant difference among these energy intake of three groups. Significantly more fat was consumed by underweight subjects than by those of normal weight (P < 0.041).
3.4. Change in Weight Gain during Pregnancy According to Pre-Pregnancy BMI
We examined change in weight gain during pregnancy according to pre-pregnancy BMI (Figure 2), as well as average weight gain before delivery (Figure 3). Weight gain before delivery in underweight, normal weight, and overweight subjects was 11.1 ± 2.4 kg, 9.3 ± 3.1 kg, and 6.9 ± 3.0 kg. Body weight gain in the underweight group
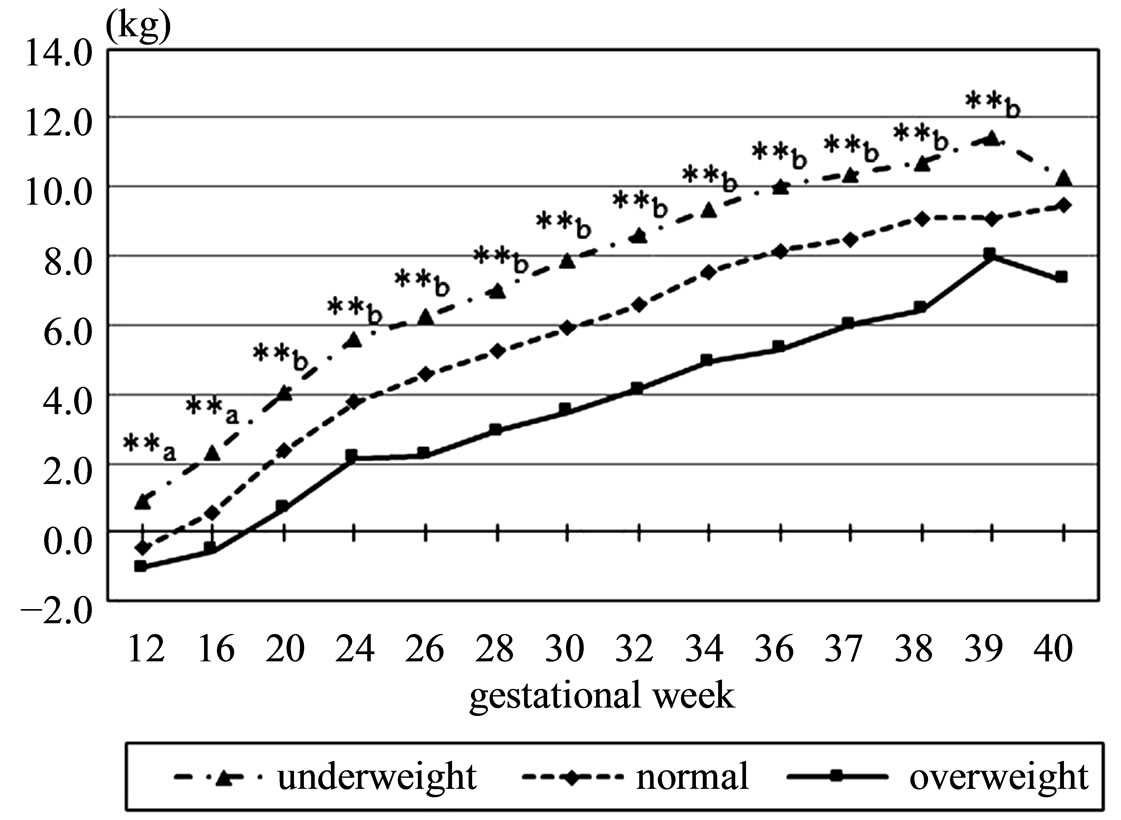
Figure 2. Changes in body weight gain during pregnancy. **a: P < 0.01 for underweight vs. normal and for underweight vs. overweight by one-way ANOVA and multiple comparison; **b: P < 0.01 for all three combinations by one-way ANOVA and multiple comparison.
was significantly higher than in the normal and overweight groups, and weight gain in the overweight group was significantly lower than in the others (P < 0.001).
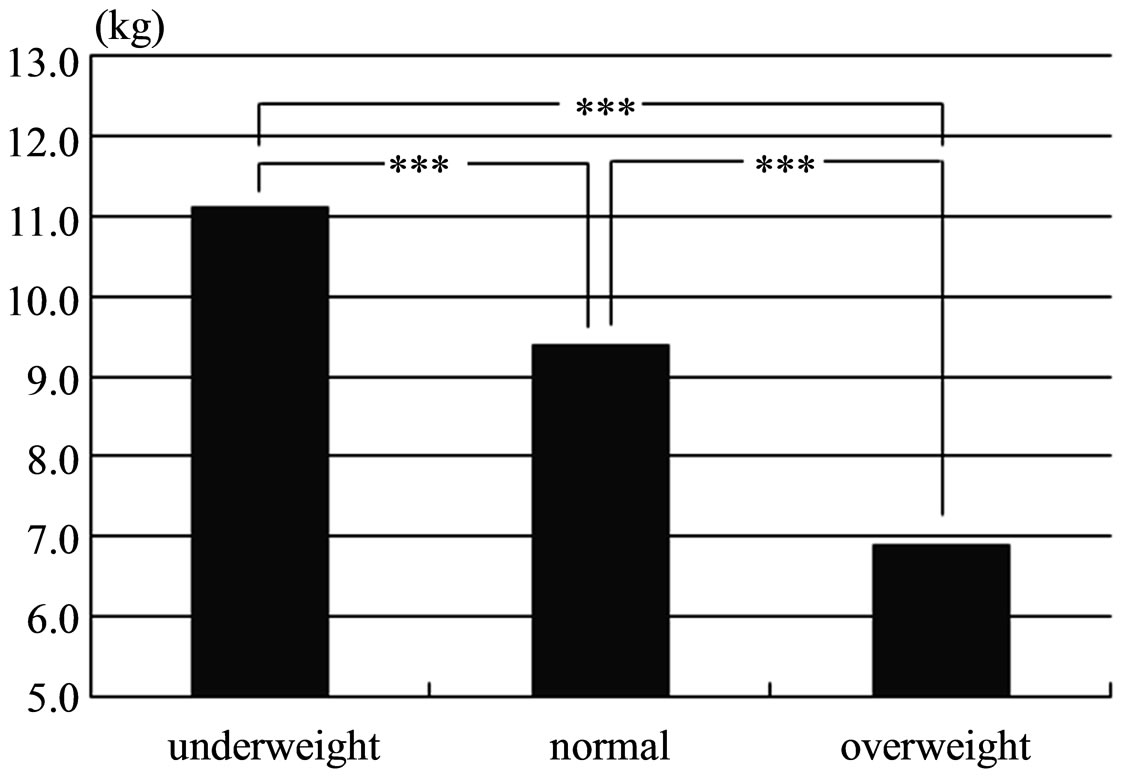
Figure 3. Comparison of average weight gain up to delivery. ***P < 0.001 by one-way ANOVA and multiple comparison.
3.5. Changes in Blood Pressure during Pregnancy According to Pre-Pregnancy BMI
We examined changes in systolic blood pressure, diastolic blood pressure, and mean blood pressure during pregnancy (Figure 4). Overall, blood pressure in the overweight group was high and that in the underweight group was low, although blood pressure levels overall were within the normal range. Blood pressure was significantly higher in the overweight group than in the other groups at some points of gestation.
4. DISCUSSION
Our aim was to investigate nutritional balance and nutritional requirements in pregnant women and to examine how they were related to the course of pregnancy, with a focus on pre-pregnancy BMI.
Estimation of nutritional intakes revealed a significant change in fat intake by BMI category: underweight women consumed significantly more fat than normal. Energy intake did not differ significantly among groups, but fat as a percentage of the total energy intake in all groups exceeded 30%, although 20% to 30% is the recommendation. Overall, this suggests that fat intake is slightly excessive and nutritional balance is not optimal, especially among underweight woman. Previous study, which examined the nutritional status and PFC balance (that mean the balance of protein, fat, and carbohydrate energy ratio) using the FFQ by comparing weight gain during pregnancy in Japanese women, shows that all the groups with weight gain had a shortage of nutrient intake and the groups of overweight and underweight had significantly higher intakes of fat [15]. It might not be considered carefully about the balance of the meal, since it can be tolerate more weight gain in the case of underweight pregnant women than other groups. Disturbance of eating habits and misconceptions about physique among
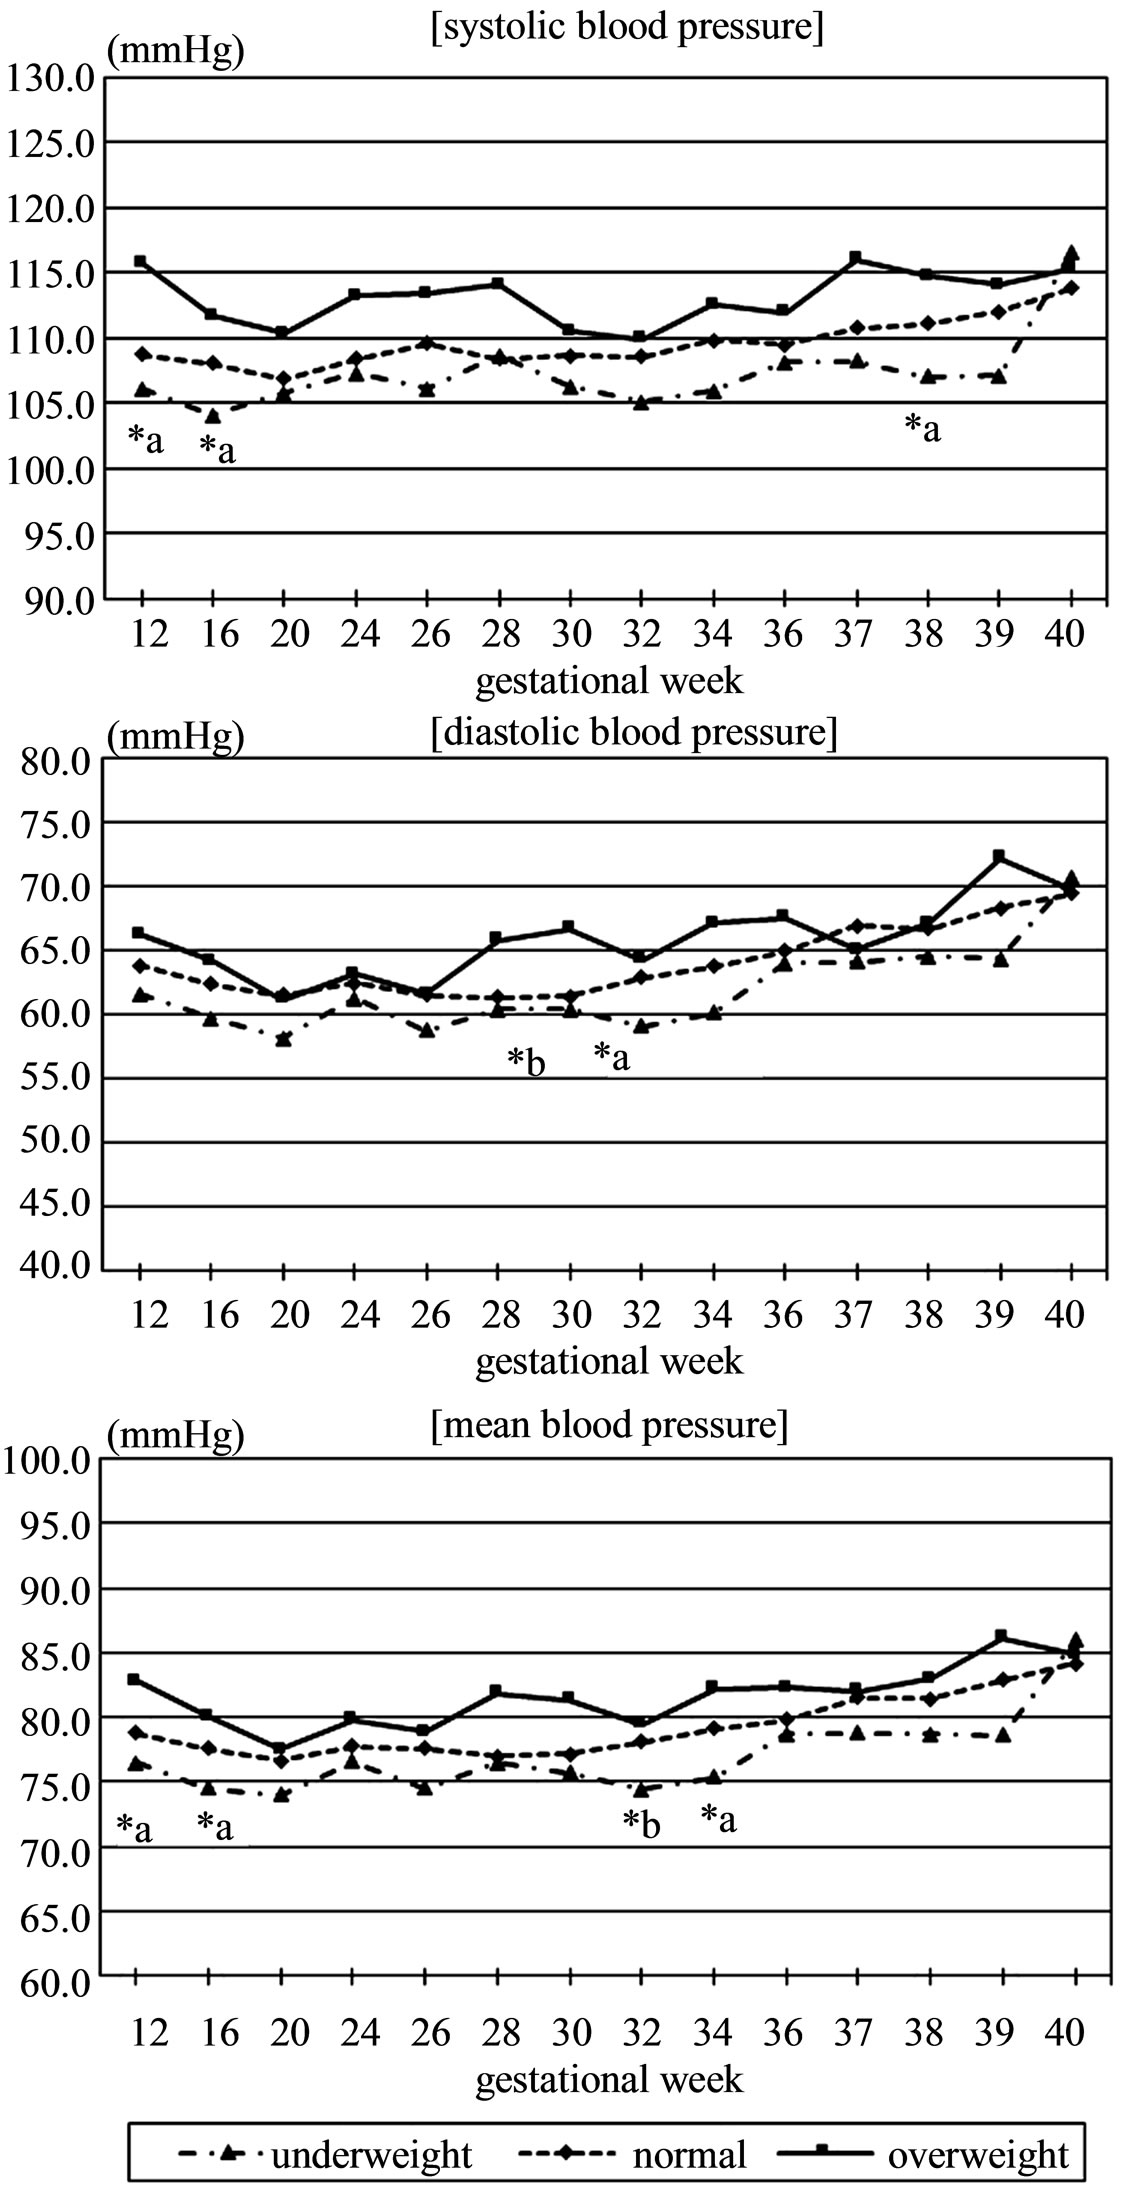
Figure 4. Changes in systolic blood pressure, diastolic blood pressure, and mean blood pressure during pregnancy. *a: P < 0.05 at the underweight vs overweight by one way ANOVA and multiple comparison; *b: P < 0.05 at the underweight vs normal by one way ANOVA and multiple comparison.
young women are social issues. Moreover, inappropriate weight management can greatly affect the health of the fetus and the mother.
Our analysis of the relationship between pre-pregnancy BMI and outcome revealed no significant differences among groups. Birth weight was significantly less in newborns of underweight pregnant women than in those of normal-weight pregnant women. This result was similar those of previous studies. The overall incidence of pregnancy-induced hypertension was only 0.9% in our study, although it is known to be about 5% to 10% [16] or 2.4% [17] in Japan. This difference is probably because our survey was done at a maternity clinic, not in a hospital. Pregnant women who have pregnancy or delivery risk factors are usually sent to general hospitals, not clinics; the clinic population therefore likely contained a relatively large percentage of women with normal pregnancies.
Even though the incidence of pregnancy-induced hypertension was very low, the changes in blood pressure showed some differences according to pre-pregnancy BMI. In general, blood pressure during pregnancy is greater toward the third trimester of pregnancy than in the beginning. Blood pressure in the overweight pregnant women remained higher than in the other groups, although it was in the normal range. There is evidence of an association between high baseline BMI and increased blood pressure in pregnancy [18].
The state of health of mother and child is influenced by the degree of self-discipline in terms of lifestyle in pre-pregnancy, not only during pregnancy. It is hard to say whether all young women recognize this. Like eating habits before pregnancy, those during pregnancy tend to be ingrained and unlikely to change markedly. Although health guidance of individual pregnant women is important and is done at many hospitals, health education for all ages is also becoming important.
There was a limitation of the present study. This study was conducted in only one obstetric clinic of the small province of Japan, and the sample size was small. Therefore, it is not intended that expresses the current situation in Japan.
5. CONCLUSION
The effects of nutrition on the course of pregnancy were not well defined. However, pre-pregnancy BMI may influence the course of pregnancy in terms of maternal weight gain and blood pressure and infant weight.
6. ACKNOWLEDGEMENTS
The authors thank the participants, Dr. Hideaki Yoshida and staffs of Aoyama birth clinic.
REFERENCES
- Ehrenberg, H.M., Dierker, L., Milluzzi, C. and Mercer, B.M. (2003) Low maternal weight, failure to thrive in pregnancy, and adverse pregnancy outcomes. American Journal of Obstetrics and Gynecology, 189, 1726-1730. http://dx.doi.org/10.1016/S0002-9378(03)00860-3
- Masho, S.W., Bishop, D.L. and Munn, M. (2013) Prepregnancy BMI and weight gain: Where is the tipping point for preterm birth? BMC Pregnancy and Childbirth, 13, 120. http://dx.doi.org/10.1186/1471-2393-13-120
- Baeten, J.M., Bukusi, E.A. and Lambe, M. (2001) Pregnancy complications and outcomes among overweight and obese nulliparous women. American Journal of Public Health, 91, 436-440. http://dx.doi.org/10.2105/AJPH.91.3.436
- Young, T.K. and Woodmansee, B. (2002) Factors that are associated with cesarean delivery in a large private practice: The importance of prepregnancy body mass index and weight gain. American Journal of Obstetrics and Gynecology, 87, 32-38.
- Johnson, J., Clifton, R.G., Roberts, J.M., Myatt, L., Hauth, J.C., Spong, C.Y., Varner, M.W., Wapner, R.J., Thorp Jr., J.M., Mercer, B.M., Peaceman, A.M., Ramin, S.M., Samuels, P., Sciscione, A., Harper, M., Tolosa, J.E., Saade, G. and Sorokin, Y. (2013) Pregnancy outcomes with weight gain above or below the 2009 Institute of Medicine guidelines. Obstetrics & Gynecology, 121, 969-975. http://dx.doi.org/10.1097/AOG.0b013e31828aea03
- Yu, Z.B., Han, S.P., Zhu, J.G., Sun, X.F., Ji, C.B. and Guo, X.R., (2013) Pre-pregnancy body mass index in relation to infant birth weight and offspring overweight/obesity: A systematic review and meta-Analysis. PLoS One, 8, e61627. http://dx.doi.org/10.1371/journal.pone.0061627
- Osmond, C. and Barker, D.J. (2000) Fetal, infant, and childhood growth are predictors of coronary heart disease, diabetes, and hypertension in adult men and women. Environmental Health Perspectives, 108, 545-553.
- Ministry of Health, Labour and Welfare (2006) Dietary guidelines for pregnant women. http://www.mhlw.go.jp/houdou/2006/02/h0201-3a.html#top
- Aizawa, S. (2007) Maternal weight gain and neonatal outcomes. Japanese Journal of Maternal Health, 48, 114- 121.
- Ministry of Health, Labour and Welfare (2011) http://www.mhlw.go.jp/stf/houdou/2r9852000002q1st-att/2r9852000002q1wo.pdf
- Yoshimura, Y. and Takahashi, K. (2010) “Excel-eiyoukun” add-in software “FFQg”. Ver. 3.0, KENPAKUSHA, Tokyo.
- Willet, W. (1998) Food frequency methods. Nutritional Epidemiology. Oxford University Press, Oxford, 69-91. http://dx.doi.org/10.1093/acprof:oso/9780195122978.001.0001
- Yoshimura, Y. (2010) Microsoft Excel add-in software “Excel-eiyoukun”. Ver. 5.0., KENPAKUSHA, Tokyo.
- Takahashi, K., Yoshimura, Y., Kaimoto, T., Kunii, D., Komatsu, T. and Yamamoto, S. (2001) Validation of a food frequency questionnaire based on food groups for estimating individual nutrient intake. Japanese Journal of Nutrition and Dietetics, 59, 221-232. http://dx.doi.org/10.5264/eiyogakuzashi.59.221
- Fujita, M., Yamaguchi, S., Uno, H., Sato, S. and Sato, Y. (2013) The nutritional status and PFC balance in Japanese pregnant women: A comparison with weight gain during pregnancy. Journal of Japan Society of Nursing Research, 36, 135-140.
- Japan Society of Obstetrics and Gynecology (2006) A standard for medical care and clinical practice: Pregnancy induced hypertension. http://www.jsog.or.jp/PDF/58/5805-061.pdf
- Morikawa, M., Cho, K., Yamada, T., Yamada, T., Sato, S. and Minakami, H. (2012) Risk factors for eclampsia in Japan between 2005 and 2009. International Journal of Gynecology & Obstetrics, 117, 66-68. http://dx.doi.org/10.1016/j.ijgo.2011.11.009
- Tomoda, S., Tamura, T., Sudo, Y. and Ogita, S. (1996) Effects of obesity on pregnant women: Maternal hemodynamic change. American Journal of Perinatology, 13, 73-78. http://dx.doi.org/10.1055/s-2007-994295