Engineering
Vol. 4 No. 9 (2012) , Article ID: 23232 , 4 pages DOI:10.4236/eng.2012.49070
Power Generation with Vegetable Oils in the Italian Scenario: A 20 MW Case Study. Technical Feasibility Analysis and Economical Aspects
Department of Mechanical and Aerospace Engineering, University of Roma “Sapienza”, Rome, Italy
Email: alfonso.calabria@uniroma1.it, roberto.capata@uniroma1.it
Received June 23, 2012; revised July 25, 2012; accepted August 6, 2012
Keywords: Bio fuel; plant feasibility; Vegetable oil; economic analysis
ABSTRACT
Nowadays the utilization of vegetable oils, particularly the palm oil, as fuel in the power plant, has made a significant development in the last few years. This vegetable oil can be used in particular in slow marine-derived diesel internal combustion engine (ICE), with an electric efficiency of about 40%. The efficiency is connected to the size of the power plant. Moreover, the considerable amount of the required vegetable oil to feed the system forces, especially in Italy, makes it necessary to import the fuel. This is the most critical element as the palm oil is subject to continuous variations in prices. Due to this variation it is difficult to stabilize a convenient fuel supply for a long period. The paper aims to evaluate and estimate the economic, technical and environmental feasibility of a 20 MW plant for the stationary power generation fed with palm oil, enlightening the system solution (technical constructive aspects) and the economic appraisal, on the basis of variations in oil prices. A comparison with a cogenerative power plant has been also carried out and, at last, the economic sensibility analysis based on the fuel cost and the European mechanisms of biomass incentives is performed.
1. Introduction
As bio fuels are to indent all products derived from biomass, used to feed power stationary equipment, such as boilers, turbines, diesel engines. Bio fuels from biomass are obtained by appropriate physical processes. Biomass is all those materials of organic origin, from which it is possible to obtain energy, without a fossilization processe. Biomass and bio fuels are considered renewable energy sources. Environmental benefits related to the use of bio fuels are linked to:
• A very short regeneration times in comparison with fossil fuels;
• “Neutrality” of CO2 emissions; the CO2 released during combustion is equal to that absorbed during the plant growth from which they are derived, so they do not increase the greenhouse effect;
• Lower polluting emissions during combustion; they produce significantly less sulphur, aromatic hydrocarbons and particulates.
In February 2011 the GSE (Energy Services Manager) [1] publishes a report on renewable biomass utilization, (the 2009 Statistical Report) that provides the main characteristics of operational biomass plants in Italy at the end of 2009 year. At December 31, 2009 the biomass plants park counts 419 operational plants, with 2019 MW of installed power. The production reached 7631 GWh. Biomasses in Italy are responsible of the 11.1% of total production from renewable energy sources, and 2.6% of the total country production of electricity.
Specifically, the crude oil plants, pass from a total installed power in 2008 of about 54,509 kW to a total installed power of 302,543 kW in 2009, with a percentage increase of 455%.
2. Italian Legislation for Vegetable Oil
The Italian National Legislation (i.e. Italian Directive D.Lgs n.128/2005, derived from the European Directive 2003/30/CE), defines the “vegetable oil” produced by oily plants by extraction processes, as crude oil or refined vegetable “but chemically not modified” as bio-fuel. The vegetable oil, for being considered as bio-fuel, can be extracted from several oily plants such as colza, sunflower, soy, palm, coconut, peanut and cotton. The fuel can be produced from “dedicated cultivations”, possibly close to the power plant, or obtained from “non-dedicated cultivations” by exclusively mechanical working of agricultural products seeds and fruits of oily culture. The production for hectare of the principal seeds related to the species is reported in Table 1. The Directive 2009/28/CE defines the calculation of the percentage reduction of the emissions of greenhouse gases resulting from the use of bio-fuels compared to the current usual fossil fuels, by the following ratio:
 (1)
(1)
where:
EB = bio-fuel total emissions [gCOeq/MJ];
EF = fossil fuel total emissions [gCOeq/MJ].
In the particular case of “raw materials supply, cultivated outside the UE”, the reduction percentage can be assumed equal to a standard value, defined in the law text for every considered bio-fuel. Some fixed standard values, reported in the Directive, are summarized in Table 2.
3. Oil Characteristics and Utilization
Oil with specific characteristics is produced from any oily species, indicating the modality of the proper utilization as fuel. Table 3 illustrates the most important typical properties of the palm oil, compared to diesel fuel. The parameter that mainly differentiates the vegetable oil from the traditional diesel oil, for its use in the ICE, is the viscosity that, as shown in figure 1, at ambient temperature can assume values ten times higher. The higher viscosity can produce several problems to the fuel injection system and the formation of disposal and unburned, that obstacles the combustion, decreases the overall efficiency and engine lifetime. Consequently, it is necessary, at least, pre-heating the oil until temperatures of 60˚C - 70˚C are reached, so as to increase the fuel fluidity to
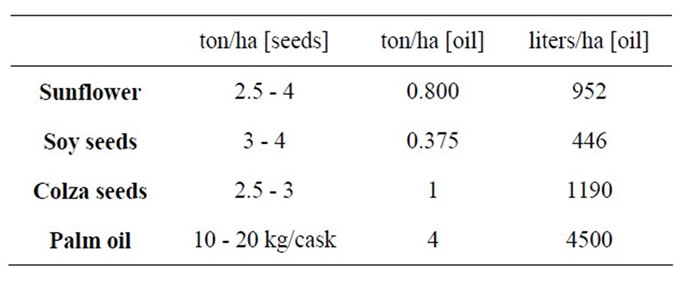
Table 1. Production per hectare of the main oily culture [2].
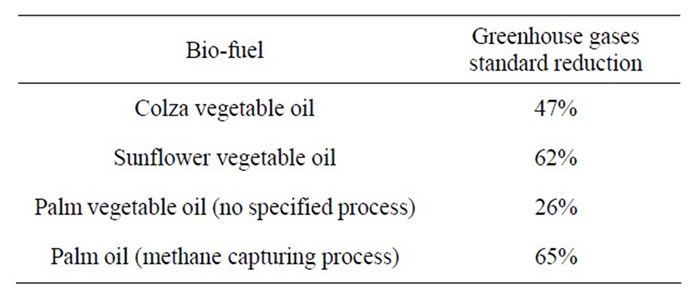
Table 2. Standard emission reduction indicated by the European Directive 2009/28/CE [3].
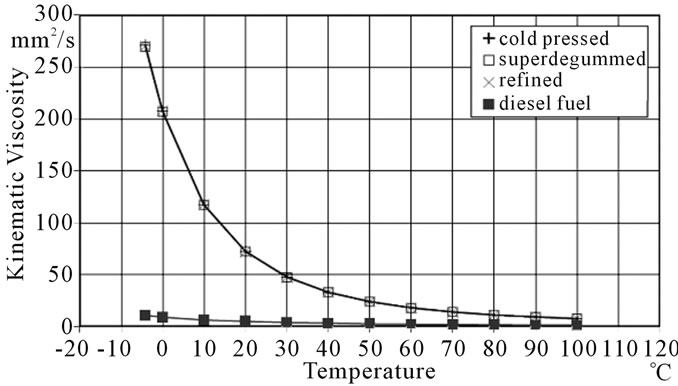
Figure 1. Variation of the kinematic viscosity according to the temperature [4].

Table 3. Bio fuels specifications [5,6].
levels comparable to those of the diesel engine.
The Energy density of the vegetable oil, expressed by means of low heat value (LHV), is lower than the diesel oil of about 10% - 15% in mass; this implies, with equal supplied power, a greater specific fuel consumption.
The Cetane number indicates the fuel capacity to the ignition. This number is proportional to the pressure necessary to auto-ignite the air-fuel mixture. It is determined by measuring the time delay between the injection of the fuel and its ignition. The higher the value, the better the behaviour of the fuel during the ignition phase; optimal values range between 40 and 50. The vegetable oils having lower cetane number than diesel oil give ignition problems in the cold start affecting the quality of the combustion and the noisiness of the motor. The advantage of the pure vegetable oil is its elevated flash point, which represents the minimal temperature to which the fuel vapours are ignited in presence of the flame. Vegetable oils have a higher flash point than diesel, this characteristics is fundamental for safety as to transport and storage operations.
Cloud point and pour point (sliding point), both higher than in conventional diesel engine, underline the capacity of oils to operate at low temperatures. The former describes the minimum temperature to which the first solid formations appear and to which the fuel can be safely pumped in the feeding system; the latter the temperature at which the fuel supply stops.
The Iodine number is the index of oil saturation degree, i.e. the presence of double bonds between carbon atoms not completely saturated by the hydrogen atoms that reacting with atmospheric oxygen or iodine can cause the oil deterioration and rubber formation. This is defined as the iodine value, expressed in grams, that can be fixed at 100 grams of grease fat substance. In comparison with the diesel the higher value characterises a greater tendency to the deterioration.
Oxidation stability index: it indicates the level of oil aging, i.e. the tendency, in presence of oxidising agents, to deposit rubber and waxes in the tanks and on the engine fixed components. It is related to the saturation degree. It is expressed in terms of “induction period”, i.e. the time, expressed in hours, necessary to the formation of rubber and waxes in the fuel, exposing a sample to 110˚C, at determined pressure conditions and in presence of oxygen. Moreover, the oxidation degree of vegetable oil is influenced by the seeds quality and storage conditions, and determines a decrease of its characteristics, as the formation of rubber deposits increases oil viscosity.
Total acidity index: it expresses the free fatty acid amount (FFA: Free Fatty Acid) in the oil. It indicates the degree of oil aging and alteration. In fact, the high level of acidity makes the oil keener to the oxidation. Moreover, at high temperatures, the fatty acids react to the engine metal components forming salts that can damage the engine and storage tanks. The index is calculated by measuring the potassium hydroxide (KOH), in milligrams, needed to neutralise all free fatty acids present in one (1) gram of oil. The crude oils have total acidity index equal to approximately 3 mg KOH/g, while refined oils have less than 1 mg KOH/g.
Phosphorus index: it is the amount of phospholipids contained in the oil, which can absorb the air humidity and form insoluble rubber residues in the tanks, in the feeding system piping and filters. The phosphorus causes an increase in the Conradson Carbon Residue (CCR), favouring the formation of deposits in combustion chamber. The phosphorus content varies according to the characteristics of the oily starting species, in particular to the humidity and fragmented seeds, and the degree of oil refining. As it increases at higher pressure temperature, it is necessary to guarantee the maximum overheating of the seed lower than 80˚C, so as not to obtain oil with excessive phosphorus content, and meet the conditions for the correct engine operations.
Total contamination index: it is the amount of insoluble materials remaining in the oil after filtration. It is produced by the residuals of expression process, not adequately removed during the cleaning phase. Elevated pollution levels can cause the filters and injectors blocking. Therefore, this parameter has to be carefully checked.
Carbon residue index: it measures the presence of some compounds of natural origin with high molecular weight at high temperatures, developed in combustion chamber. Their decomposition causes the formation of carbon residue. It indicates the tendency of a fuel to produce residues, ashes, etc., on the injectors and in the combustion chamber.
(Ca + Mg) amount index: the presence of alkaline elements depends on the quality of the seed and the pressure temperature. An excessive content can cause the residue formation in the combustion chamber, the filters blocking or undesired catalytic reactions, and alter the emissions control system.
The strict definition of the quality and characteristics of the vegetable oil is fundamental for its correct use as fuel; the reliable engine operation and the respect of the emission limits can, in fact, be guaranteed only by using oils that meet the detailed specifications and regulatory standards.
4. ICE Manufacturers Data
Every manufacturer indicates a detailed list of the vegetable oil to be used in diesel ICE. The Table 4 shows, as an example, the detailed list of the oil used in diesel ice manufactured by MAN Diesel & Turbo leader in this engineering field.
5. Emissions Analysis [6]
The vegetable oil guarantees a reduced emission of greenhouse gas, equal to 65%. The emissions connected to the combustion process need to be considered. In particular, the levels of nitrogen oxide emission (NOx), carbon monoxide and ash formation have to be considered.
Comparing the current values of fossil fuels, a meaningful reduction of hydrocarbons unburned (THC) with no
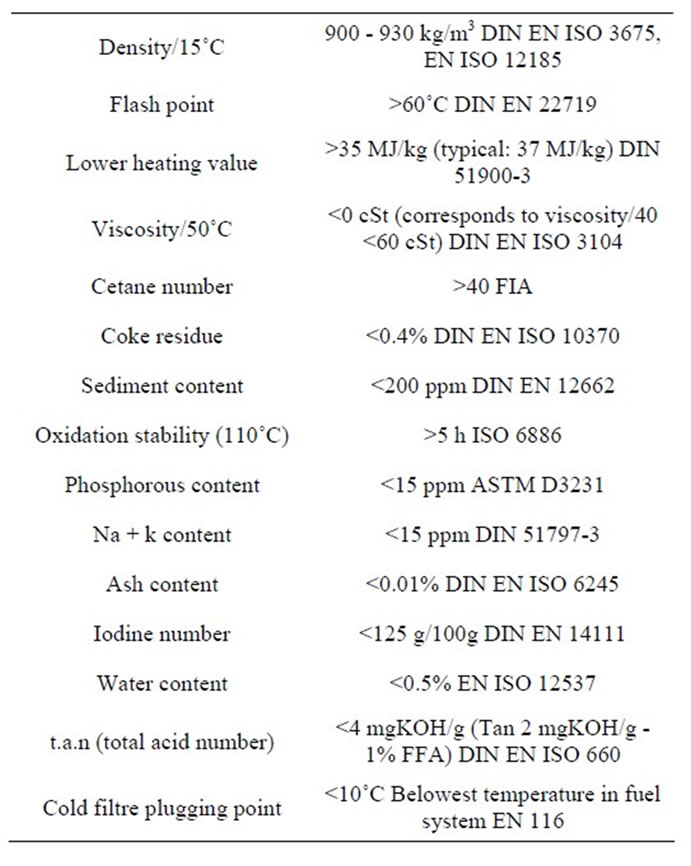
Table 4. Vegetable oil specifications [7].
SO2 emissions can be obtained, thanks to the fuel that practically does not contain sulphur. On the other hand, a higher NOx production has been measured, due to the higher residence time in the combustion chamber at high temperatures and to the presence of oxygen in the oil. Such emissions need to be within the limits provided for by the Italian legislation [D.Lgs. 152/2006]. Table 5 indicates these limits for a gaseous effluent having oxygen tenor equal to 5%.
It can be noticed that the biofuel is characterized by lower typical greenhouse emissions. This particular aspect forces the Italian Government to improve and develop the use of oil as fuel for the stationary power generation. Table 6 shows the comparison between the different fuel.
6. Fuel Supply
The modalities of oil supply represent the key elements for the correct plant operation and for the profit of the investment. Generally, the vegetable oil is purchased on the international market; in particular, it can be reported to the CPO (crude palm oil), coming from Malaysia and Indonesia. One of the main problems related to the purchase of such commodity regards the uncertainty of its supply. The following diagram illustrates the last decade fluctuation of the palm oil cost.
The following diagram shows the cost of palm oil during last year (2011-2012). The increase in bio-diesel
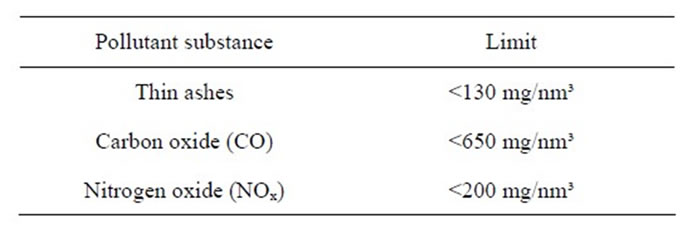
Table 5. D.Lgs 152/2006 Emissions limits.
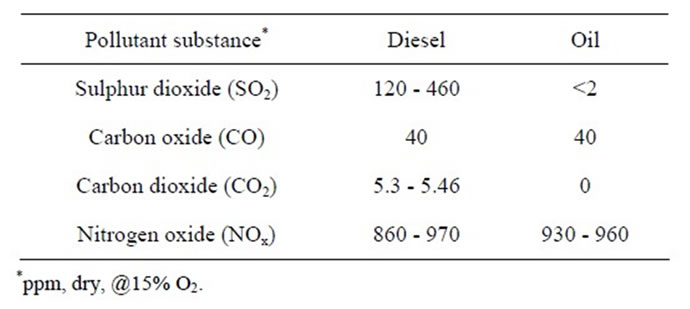
Table 6. Emissions comparison between colza oil and diesel fuel [7,8].
demand, as well as a higher demand for edible oils from India and China, has produced, in recent years, a progressive increase in the price of palm oil, so that in January 2011 it reached more than 927.30 EUR/ton (probably due to some speculative actions). The wide price fluctuations in last 10 years are evident, as shown in Figure 2. The market instability makes it difficult to obtain any supply mid-long term contracts at prefixed conditions, which is indispensable for a good investment planning. Figure 3 shows the oil cost trend during last year. The certainty of raw materials supply, including the availability of coastal storage close to the plant, is an essential key aspect for the project banking investment. It will be crucial to preview supplies that need the certification of sustainability and traceability and that meet the future requirements to be introduced soon in the Italian legislation on the basis of the Directive 2009/28/CE.
6.1. Cases Studies
In order to estimate the economic technical feasibility of the investment according to the fuel cost, a 20 MW power plant diesel ICE was investigated. 8000 hours of annual operation were assumed, as well as the palm oil LHV equal to 37 MJ/kg and an electrical transformation efficiency of 45%. The analysis was focused on two cases: a simple power plant, described in Figure 4, and a co-generative plant.
6.1.1. Case A—20 MWe Power Plant [3]
A production of 152,960 MWh/year with a fuel consumption of 34,264 ton/year is predicted.
For the abatement and control of the NOx level in the exhaust gas, an SCR (Selective Catalytic Reduction) reduction system is expected. The deNOx-SCR process con-
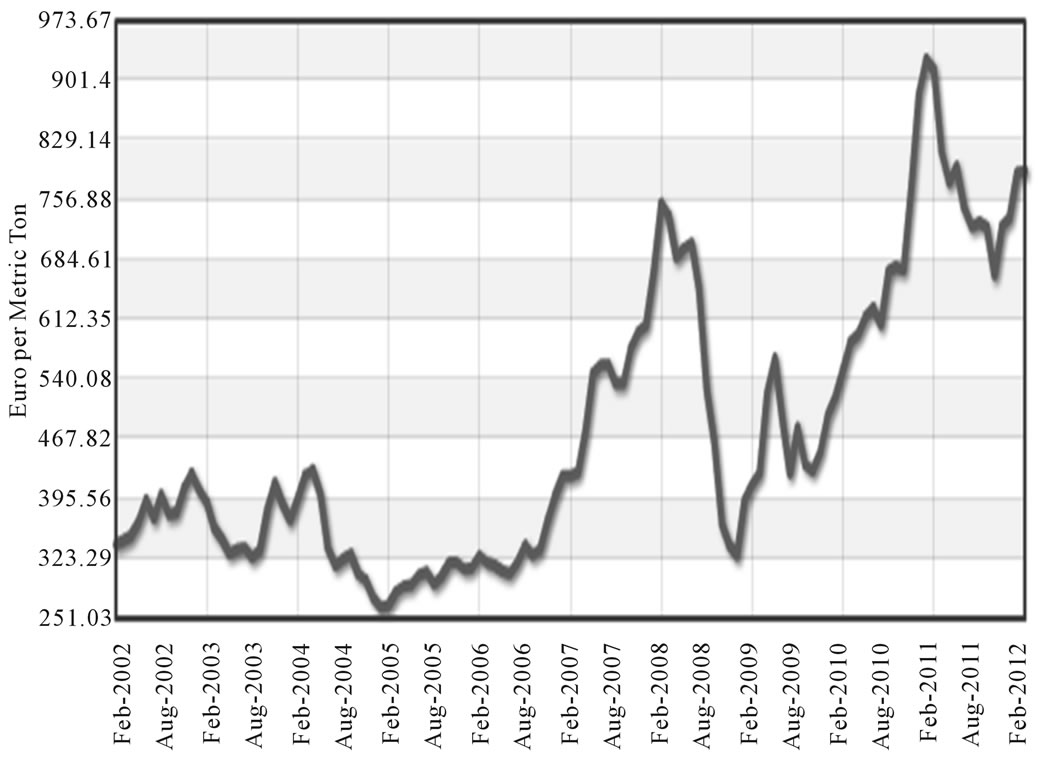
Figure 2. Palm oil cost trend of the last 10 years [9].

Figure 3. Palm oil cost trend in the last year [9].
sists in the conversion in gaseous nitrogen (N2) and vapour (H2O) of produced nitrogen oxides during combustion, which, in presence of an adequate catalyst, reacts with a reducing agent and the oxygen contained in the flux to clean. Ammonia (NH3) is used as the reducing agent, the catalyst is made up of a ceramic support on whose porosity surface vanadium is dispersed, allowing the reaction at temperatures ranging from 250˚C and 450˚C with high reduction efficiency. The well known reduction equations are:
4NO + 4NH3 + O2 = 4N2 + 6H2O (2)
2NO2 + 4NH3 + O2 = 3N2 + 6H2O (3)
The catalytic device is constituted by 5 stages. Three of them foresee the allocation of the deNOx catalyst; in the others there are the CO Catalyst and PM Reducing Catalyst, which abates respectively CO emissions and thin ashes below the limits defined by legislation. With a gaseous effluent having oxygen tenor equal to 11%, the Table 7 shows these typical concentrations values.
6.1.2. Case A—Economic Analysis
The economic analysis was performed on fixing plant cost, varying the fuel cost EUR/t, and obtaining the payback time. To give an example, we carried out the analysis with a diesel cost of about 700 EUR/kWe and palm oil cost equal to 540 EUR/t (February 2010) and 836 EUR/t (December 2010). We considered the cost of the generator, ICE motor, civil buildings and electric devices, terrain rental cost and the possible future plant development. In Table 8 are reported these considerations. As to management cost fuel supply, ordinary maintenance, and electricity distribution were considered [3]. The system revenues were associated to the sale of electric power and the sale of Green Certificates (GC). As the system produces a remarkable quantitative of thermal energy, its sale would be a further gain source. All voices are listed in Tables 9 and 10. However, thermal users have to be at a reasonable distance from the plant. The Green Certificates, with a unitary value of 1 electrical MWh, released for 15 years resulted in the product between the grid electric power production and a coefficient, in this case, equal to 1.3 [10].
The active of the economic account was computed as the sum of the price of the Dedicated Withdrawal of the electric power (73 EUR/MWh) and the revenue of the sale of the GC whose price on the market for the year 2012, is equal to 74.72 EUR/MWh, which multiplied by the coefficient of reference for typical biomass power plant, is equal to 97.13 EUR/MWh. With the previous assumptions and referring to the cost of February 2012, a simple payback time was calculated. The results are very interesting. However, repeating the simulation for different values of the fuel cost, in particular, referring to the average cost of the palm oil for the last year, the following table 11 was obtained.
6.1.3. Case A—Results
The results underline how the fuel cost can affect the feasibility of the power plant, so as to make investments unacceptable not even in presence of Italian Feed-in tariff.
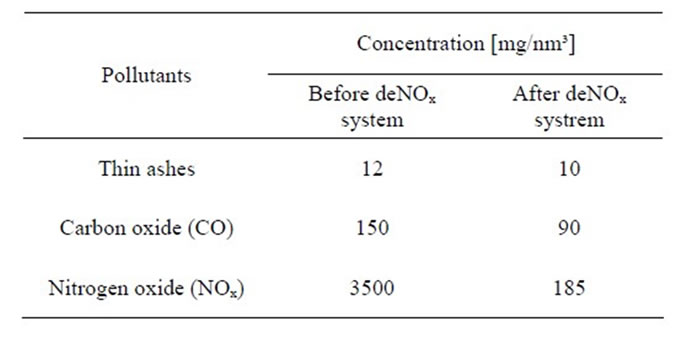
Table 7. Concentration values throughout the deNOx catalyst system.
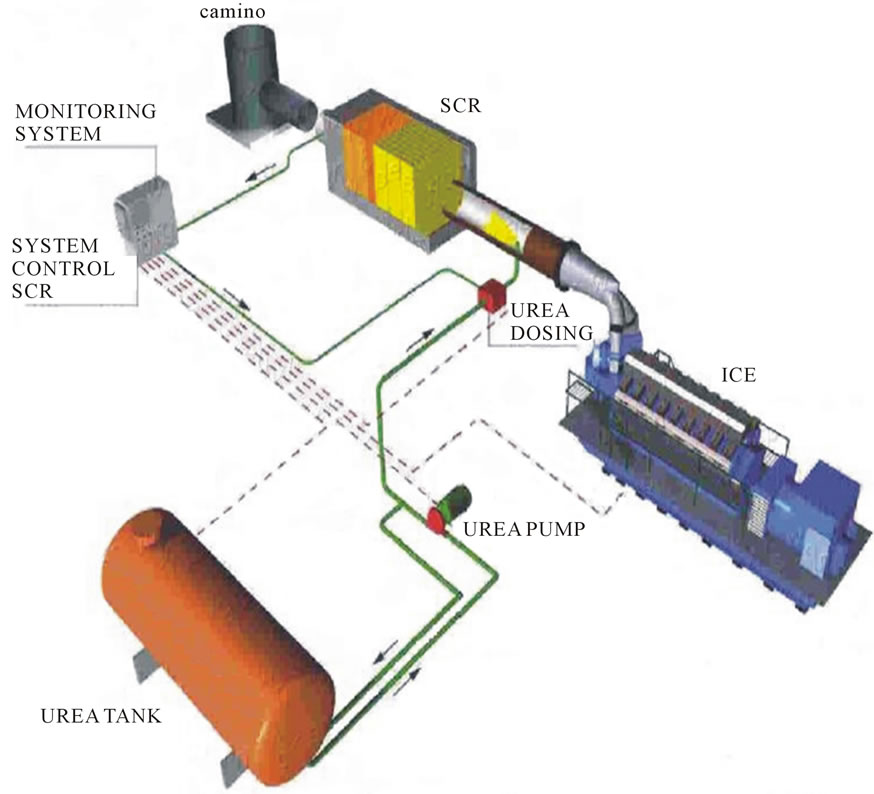
Figure 4. Plant lay-out [9].
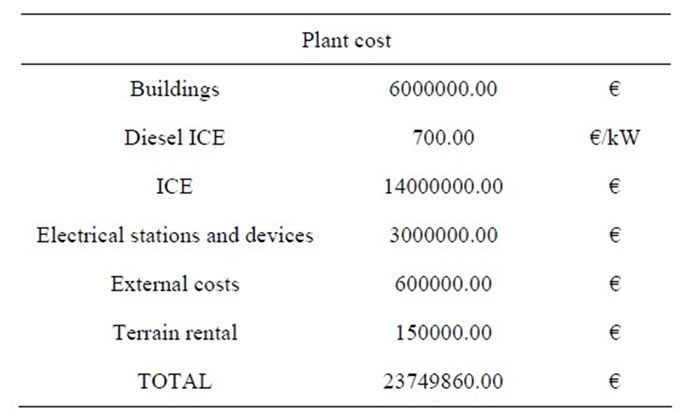
Table 8. The plant costs.
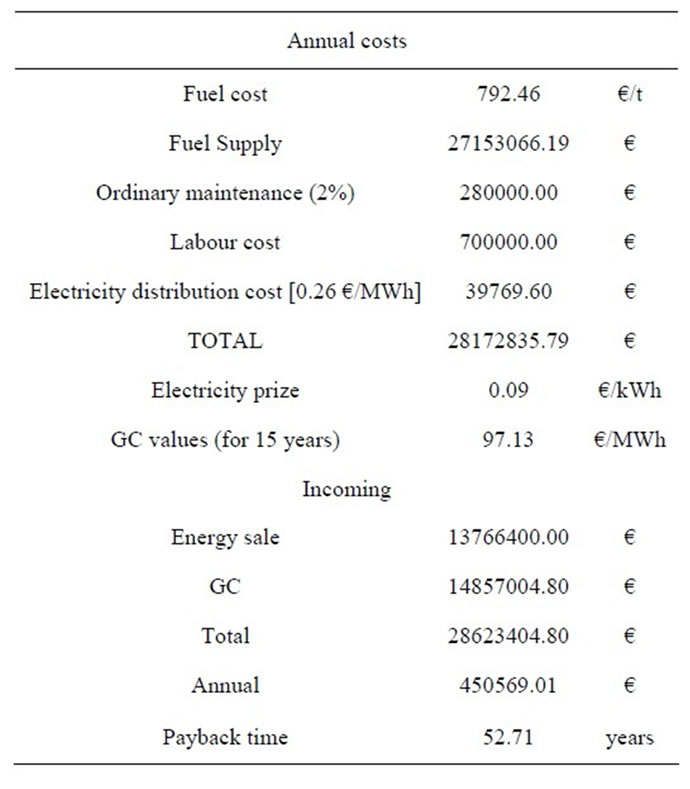
Table 9. Annual costs estimation with fuel prizes of 792.46 EUR/t.
This highlights the special attention to be paid in searching for suppliers able to ensure affordable and stable oil purchase conditions in the long period. However, the instability of the market of palm oil makes it very difficult to obtain contracts of mid-long term period supply at fixed conditions. The supplying condition of raw materials, including the availability of coastal storage at reasonable distance from the plant, is also a fundamental element for the sponsor investmentand banking plan.
6.1.4. Case B—A Cogenerative 20 MWe Power Plant
The case of a co-generative power plant (Figure 5) satisfying simultaneously electric and thermal demand is very interesting [11,12]. Such plant solutions can find the most
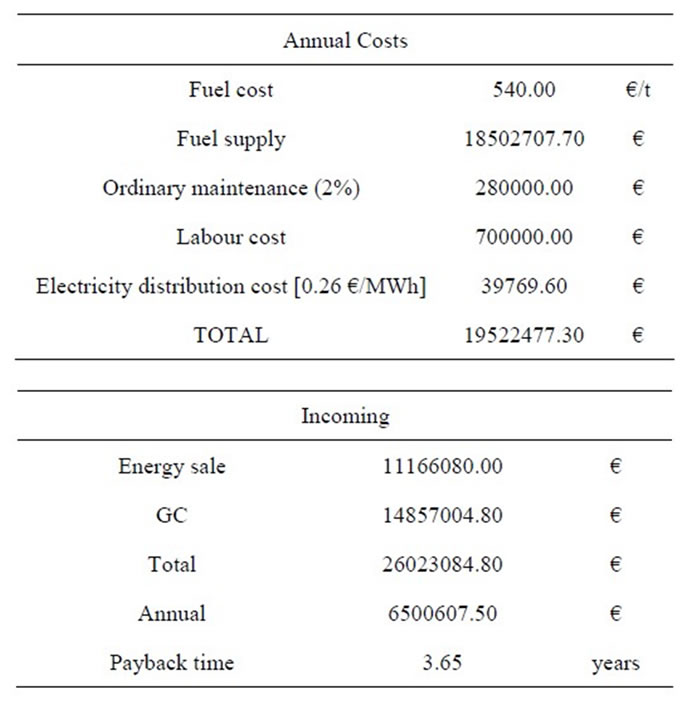
Table 10. Annual costs estimation with fuel prizes of 540.00 EUR/t.
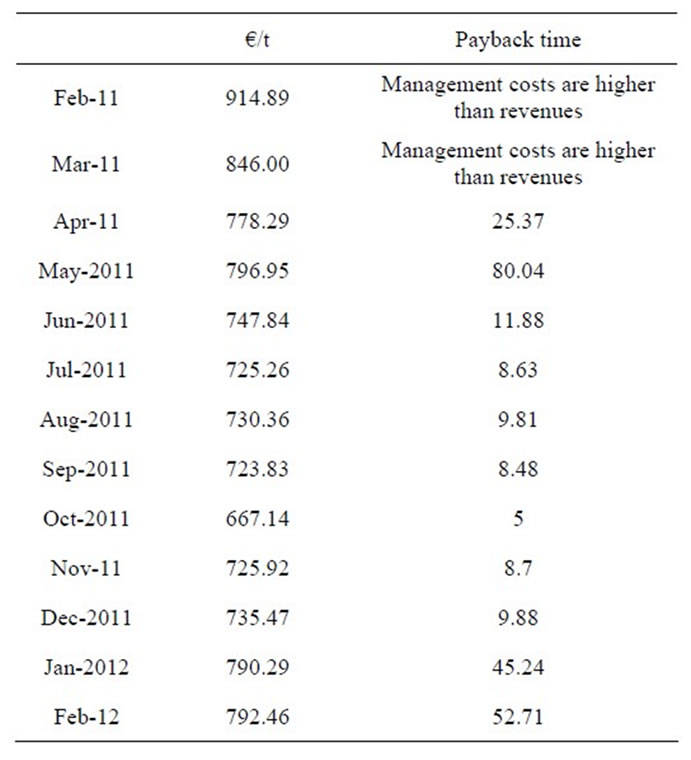
Table 11. Sensitivity analysis in function of fuel prize.
suitable application in productive sites, where it is necessary to produce steam at low pressures and average temperature, to be directly used in the production cycle. A typical cogenerative unit (the previous MAN diesel ICE) can produce with the following specifications:
• Potentiality 12 ton/h;
• Temperature 200˚C;
• Pressure 8 bar.
The plant modifications do not influence the system of the pollutant reduction. Its structure is identical to the one described previously. In this case the economic analysis must take into account a specific higher installation cost, to introduce the related cost for extra heat exchangers and for all the necessary components for the thermal secondary cycle. The engine specific cost can be assumed equal to approximately 850 EUR/kW (Table 12 reports all plant costs). Moreover, the cost must include the thermal grid construction. In the following table, a thermal distribution network with a length of 2 km was considered, with a specific cost of 800,000 EUR/km. In comparison with the previous case study, in this scenario an increase in the investment of about 4,600,000 EUR was observed. It was not observed a cost increase in management annual costs in the case of a non-co-generative ICE. The active of the economic account, in this case, must take into account of four factors (see Table 13):
• Revenue from the Dedicated Withdrawal of the electric power (73 EUR/MWhe);
• Revenue of the sale of GCs, with a market price, for the year 2012, equal to 74.72 EUR/MWh that multiplied by the coefficient of reference biomass plant, becomes 97.13 EUR/MWh; 97.13e;
• Revenue from the obtaining rational use of energy (RUE) Certificates for the co-generation benefits (86 EUR/tep): in this case it was assumed that approximately 80% of thermal power is effectively used in the productive site; revenue from the sale of heat power (60 EUR/MWht). In this case it is necessary to underline that if the producer of thermal energy coincides with the user the saving achieved is higher than 60 EUR/MWht.
The annual incoming, reported in Table 14, in the cogenerative case, allows a payback time lower than 2 years. Such result demonstrates that the choice to adopt a cogenerative solution is more convenient for the simple production of electric power.
Extending such analysis to different values of the average cost of the palm oil, the following results were obtained.
The analysis of the results shows that when the cost of the palm oil is lower than 800 EUR/t, the corresponding payback time is lower than the previous case study. In any case, the problem of ensuring steady supply contracts for a long period is persistent. The goal is to make the plant operational lifecycle irrespective of the vegetable oil cost fluctuations.
7. Conclusion
The analysis shows that for case A the value of approximately 700 EUR/t represents the maximum fuel purchase rating to build the power plant, beyond which its convenience considerably decreases. Such value is around 800 EUR/t for a co-generative plant. However, it is useful to realize a cogenerative power system exclusively in presence of thermal users, because not using the exceeding
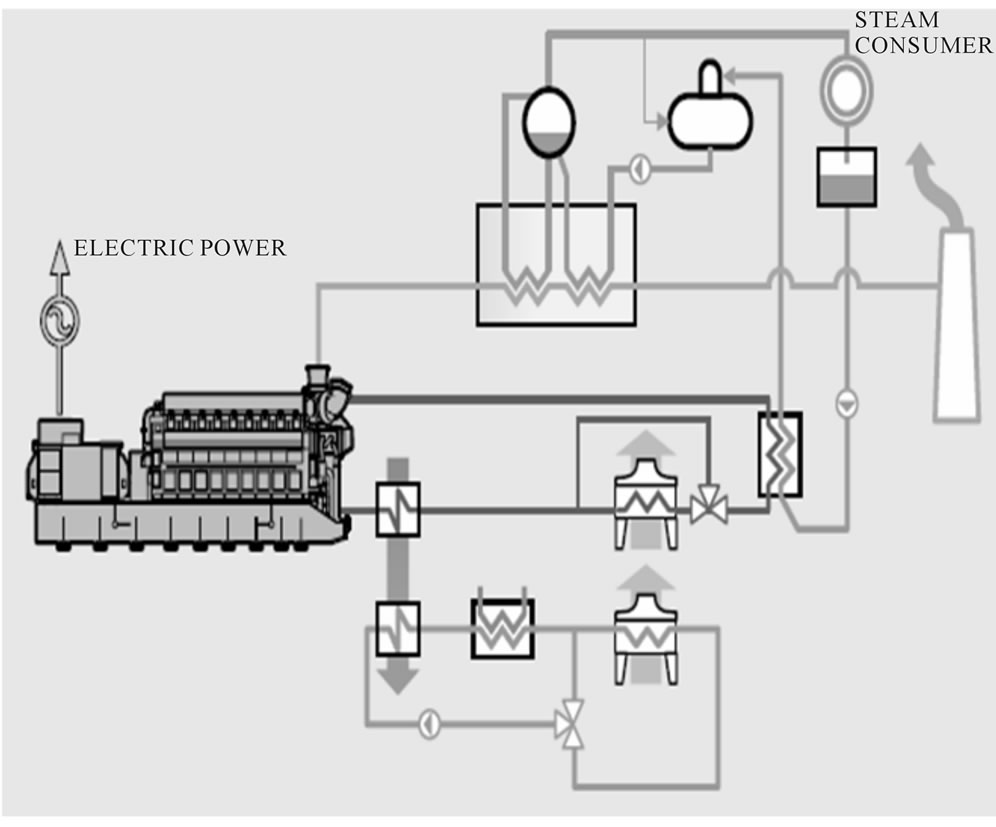
Figure 5. A cogenerative power plant layout [7].
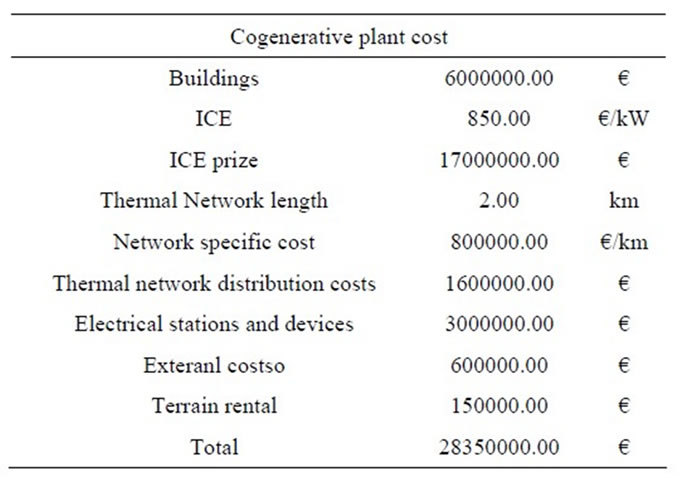
Table 12. Cogenerative power plant costs analysis.

Table 13. Economic revenues estimation.
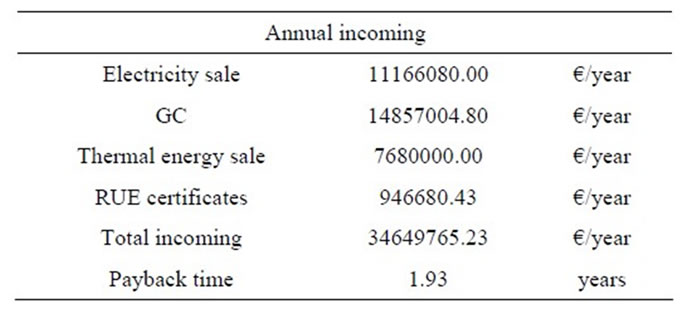
Table 14. Cogenerative plant annual incoming.
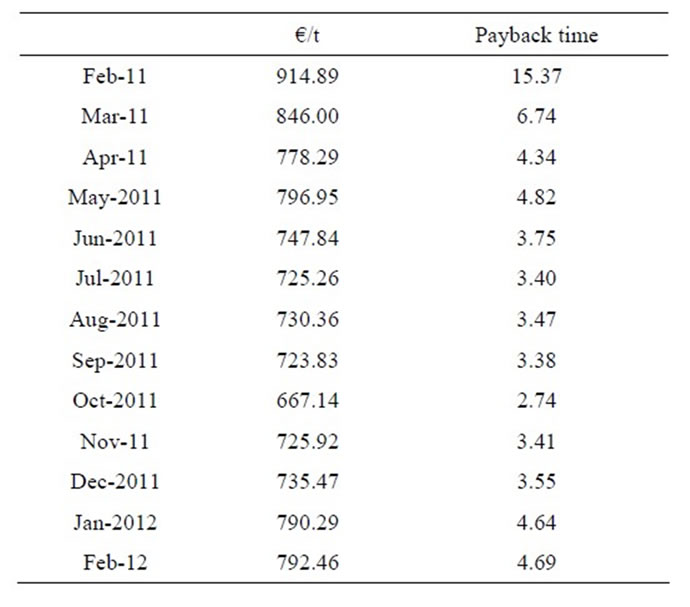
Table 15. Sensitivity analysis for case B.
thermal energy would not guarantee the economic feasibility [10-13]. Considering that the cost of the system will not decrease in the future, the oil price is the only key factor and realisation “constraint”. This parameter, unfortunately, is not immune from speculative actions. Finally, all these results and considerations, suggest to build the plant and the cultivation in the same place, or nearby, in the same country or nation [10-12]. In this way, it is possible to achieve a satisfying payback time, making the plant irrespective of price variation. Table 15 shows the results of the sensitivity analysis.
REFERENCES
- Italian Energy Services Manager, 2012. http://www.gse.it
- Padua Chamber of Commerce, “The Power Generation with Vegetable Oils,” 2007. (in Italian)
- A. Calabria, R. Capata and M. Di Veroli, “The Power Generation with Vegetable Oils: A Case Study,” Proceedings of International Mechanical Engineering Congress and Exhibition, Denver, 11-18 November 2011, pp. 27-32.
- K. Thuneke, “Vegetable Oils and Diesel Blends,” 2nd International Seminar on Bio-Fuels and Alternative Fuels, Bogotá, 9-11 August 2006.
- AA.VV., “The Bio Fuels. The Productive Rows, the Technologies, the Environmental Advantages and the Diffusion Future Perspectives,” AREA Science Park. (in Italian)
- Italian Thermo-Technical Committee, “Bio Fuels: Specifications and Classification,” 2006. (in Italian)
- “Man Diesel Bio-Fuel Specification,” 2012. www.mandieselturbo.com/
- International Energy Agency, “Biomass for Power Generation and CHPm,” 2011. http://www.iea.org/techno/essentials3.pdf
- Siemens Official Website, 2011. http://www.energy.siemens.com/hq/en/power-generations /power-plants
- International Monetary Found, 2011. http://www.indexmundi.com
- Italian Legislative n. 99 (D.Lgs. 23/07/2009).
- National Renewable Energy Laboratory, 2011. http://www.nrel.gov/biomass/pdfs/sun.pdf
- Electropedia, “Battery and Energy Technologies,” 2011. http://www.mpoweruk.com/biofuels.htm

