Engineering
Vol. 3 No. 2 (2011) , Article ID: 4286 , 4 pages DOI:10.4236/eng.2011.32017
Taguchi Optimization of Process Parameters in Friction Stir Welding of 6061 Aluminum Alloy: A Review and Case Study
School of Engineering, University of British Columbia, Okanagan Campus, Kelowna, Canada
E-mail: abbas.milani@ubc.ca
Received November 5, 2010; revised November 19, 2010; December 28, 2010
Keywords: Friction Stir Welding, Temperature Distribution, FEM, Taguchi Method, ANOVA
ABSTRACT
This study is intended to present a straightforward and computationally efficient methodo-logy for optimizing the process parameters of friction stir welding (FSW) of 6061 aluminum alloy. In particular, it is shown how to minimize the heat affected zone (HAZ) distance to the weld line in the joined parts using a Taguchi optimization method and a temperature-field finite element model. The peak temperature during the process has also been minimized. Since the method is used for the first time in relation to the HAZ objective function, an auxiliary full factorial search is conducted to ensure Taguchi’s orthogonal design assumption for the FSW problems. Results confirm that the method can be successfully used for minimizing both the HAZ distance to the weld line and the peak temperature, with a minimal number of simulation runs via orthogonal arrays. In addition, a new ANOVA analysis on the L9 orthogonal array with three factors is performed and results indicate that among the parameters considered (i.e., the tool rotational speed, transverse speed, and the axial force), the most significant parameter on the weld quality is the rotational speed, followed by the axial force and transverse speed.
1. Introduction
Friction Stir Welding (FSW), a solid state joining method developed and patented by TWI Ltd., Cambridge, UK in 1991 [1], has attracted significant interest from aircraft and car manufacturers for joining high strength aluminum alloy components. Specific examples include the wrought 6000-series Al-Mg-Si (Cu) alloys that are commonly used in aircraft fuselage skin and automotive body panels, mainly due to their ability to be strengthened by artificial aging after forming. FSW has also been used to produce rocket shells, the panel of the cabin of aircrafts with stringers and beams, hollow panels of wagons, and pipes [2].
The basic concept behind FSW is simple: A non-consumable rotating tool with a specially designed pin and shoulder is inserted into the abutting edges of the two parts to be joined and traversed along the line of joint (Figure 1).
The FSW tool primarily serves two functions: a) heating the work piece, and b) flowing the material to produce the joint. A detailed list of parameters controlling this joining process is given in [3] as follows:
1) Rotational speed (rpm)
2) Welding speed (mm/s)
3) Axial force (KN)
4) Tool geometry
i) Pin length (mm)
ii) Tool shoulder diameter, D (mm)
iii) Pin diameter, d (mm)
iv) Tool tilt angle (◦)
v) D/d ratio of the tool
1.1. Metallurgical Aspects
During friction stir welding, heating is accomplished by friction between the tool and the work piece and plastic deformation of the work piece. The localized heating softens the material around the pin, and a combination of the tool rotation and translation leads to the movement of material from the front of the pin to its backside. As a result of this process a joint is produced in the ‘solid state’. Because of various geometrical features of the tool, the material movement around the pin can be complex to study [4]. During the FSW process, the material undergoes intense plastic deformation at elevated temperature, resulting in the generation of fine and equiaxed dynamicrecrystallized grains [5-8]. Consequently, the fine microstructure in friction stir welds results in good mechanical properties (e.g., the tensile strength for FSW of Al 7039 plates is as high as 311 MPa while the base metal has a tensile strength of 383 MPa [9]).
FSW joints usually consist of four, as opposed to primarily three in “normal” welds, different regions as shown in Figure 1. a) unaffected base metal; b) heat affected zone (HAZ); c) thermomechanically affected zone (TMAZ) and (d) friction stir processed (FSP) zone (nugget). The formation of these regions is affected by the material flow behavior under the action of the rotating non-consumable tool. The material flow behavior is predominantly influenced by the FSW tool profile, tool dimensions and welding process parameters [8,10].
Frictional heat and plastic flow during FSW create fine and equiaxed dynamic-recrystallized grains in the stir zone (SZ) and elongated and recovered grains in the thermomechanically affected zone (TMAZ). The heat affected zone (HAZ) is often identified by means of only material hardness changes as there is no difference in grain structure compared to the base metal. This softened HAZ region can be characterized by the dissolution and coarsening of the strengthening precipitates during friction stir welding [11]. As an example, the precipitation sequence during aging of pseudobinary Al-Mg2Si alloys has been characterized as follows: supersaturated solid solution, needle shaped precipitates ( ), rod shaped precipitates (
 ), and β-Mg2Si [11-13]. It is known that needle shaped precipitates correspond to coherent
  phase, which contributes predominantly to the strength of 6000 series aluminum alloys. During prolonged aging,
  nee-
nee-
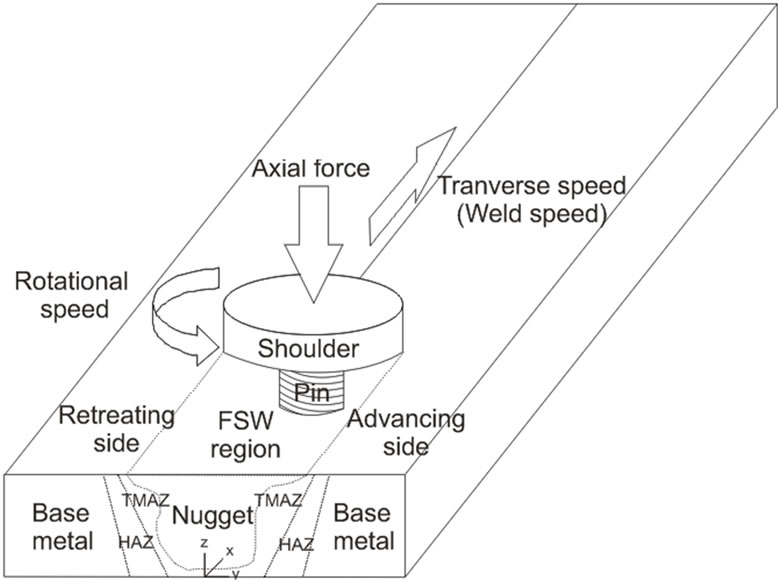
Figure 1. Schematic of the FSW process.
dless are transformed into semi-coherent  rod shaped precipitates. Coarsened precipitates and the associated loss of coherency lead to a diminished strengthening effect relative to the needle shaped precipitates [14].
1.2. Motivation and Objective of this Work
As discussed in Section 1.1, the HAZ encompasses the weld region that undergoes softening (i.e., minimum hardness region of the welded part). Beyond the HAZ, no change in the base metal properties is expected. The HAZ is formed in a region which experiences minimum temperature rise during the friction stir welding process, causing dissolution and coarsening of the strengthening precipitates in the joining alloy (see, e.g., [15] for FSW of 6061 aluminum alloy). The closer HAZ is to the weld center, the higher the possibility to merge the weld nugget with fine and equiaxed dynamic-recrystallized grains, and the lower the possibility of hardness decrease of the base metal. As a result, the quality of the welded part can be directly related to the size and position of the HAZ. In addition, one would physically expect that minimizing the HAZ size would affect the peak temperature that often occurs in the workpiece in the vicinity of the tool. The main objective of the present work is to show that using a Taguchi optimization procedure, the FSW process parameters (such as the tool transverse speed, rotational speed, and applied normal force) can be controlled in a way that both the HAZ distance to the weld line and the maximum (peak) temperature in the weld are minimized simultaneously. To this end, following a review of the prediction and optimization models of FSW (Section 2), a case study is established via a thermal model in the COMSOL multi-physics package along with a set of reported experimental data in the literature on SFW of 6061 aluminum alloy (Section 3). Subsequently, the proposed optimization routine is presented and discussed in Section 4. Using an adjusted ANOVA framework for the Taguchi’s L9 orthogonal array with three factors, it is also shown how each process parameter affects the HAZ distance to the weld line as well as the maximum peak temperature. Finally, the optimum levels of the process parameters are identified and validated using confirmation runs. Concluding remarks and potential future developments are included in Section 5.
2. Prediction and Optimization Models of FSW: Background
2.1. Prediction Models
Based on the physics involved (Section 1.1), prediction models of FSW should account for heat transfer, toolpart contact phenomenon, and the material plastic deformation. This makes detailed simulations of the process time consuming and complex [16]. A number of different FSW prediction models have been used in the literature by different research groups. The process thermal models were developed, e.g., by Colegrove et al. [17], Schmidt et al. [18], and Khandkar & Khan [19]. Computation fluid dynamics (CFD) models have been used, e.g., by Colegrove et al. [20], and Schmidt & Hattel [21]. Thermomechanical models of FSW have been used, e.g., by Chen & Kovacevic [22] and Schmidt & Hattel [23].
The most common approach reported on the prediction of FSW processes includes the thermal models, ranging from simple analytical models based on Rosenthal’s solutions [24] to three-dimensional numerical models by Kovacevic et al. [25] and Schmidt et al. [26]. Traditionally the thermal models are either transient Lagrangian [25] or stationary Eulerian [26]. The first type allows finite plate dimensions to be used and the transient starting/stopping phases to be studied. The latter type has the advantage of fast solution time and the possibility of using a fine mesh close to the heat source (tool) [27]. The fully coupled Eulerian-Lagrangian approaches for this process are only recently under investigation.
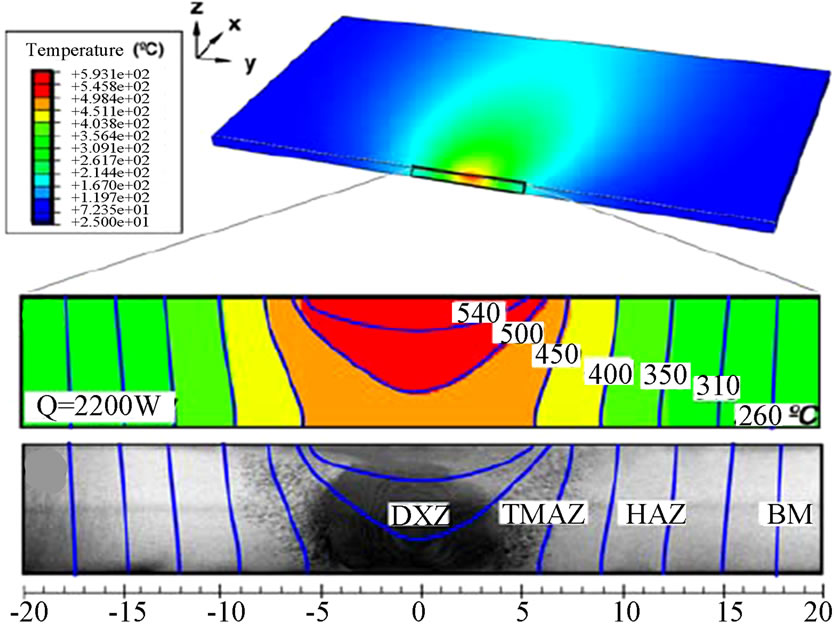
Depending on a given study’s objectives, the prediction models of FSW process may be used to investigate different mechanical/thermal/metallurgical properties of the weld. In the study by Myhr & Grong [28] a time-dependent model for determining the ‘hardness’ of a 6082- T6 aluminum alloy after an arbitrary thermal treatment, such as welding, is presented. In the T6 heat treated condition this alloy exhibits maximum attainable values of hardness and strength due to fine Mg2Si precipitates. The model uses a relative fraction between 1 to Xd of these particles to interpolate between the maximum and the minimum possible hardness of the material. Heat treatment at an elevated temperature can decrease Xd and thereby the hardness [28-29]. Recently, Larsen et al. [30] proposed a hardness model for the optimization of friction stir welds following the work by Myhr & Grong [29], which could not predict the real hardness changes in the weld nugget because it did not consider dynamic recystallization during the process. Another prediction of hardness minimum locations during natural aging in 6061-T6 aluminum alloy friction stir welds was carried out by Woo et al. [15]. In their model, the peak temperature profiles were calculated for each characteristic region in the FSW (Figure 2): DXZ about 480-550oC, TMAZ about 430-480oC, and HAZ less than 430oC. Thus, the critical temperature for the material to reduce its hardness was identified to be ~430oC.
2.2. Optimization Models
The optimization problems considered in the literature
 (a)
(a)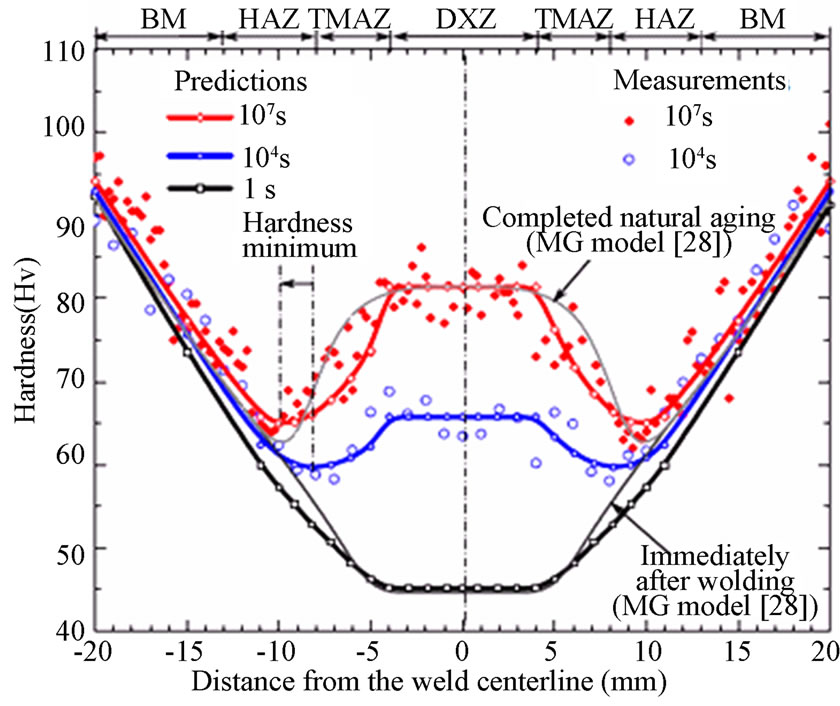 (b)
(b)
Figure 2. (a) Simulated temperature distribution in the cross-section of 6061-T6 aluminum alloy and (b) the measured and predicted hardness profiles at 1, 104, and 107 seconds after FSW [15,28].
for FSW, in general, are realized by considering a set of process parameters (in most cases, the translational welding speed and the rotational speed or heat input), and a few constraints and objective functions. The use of complex numerical models may become expensive and, in some cases, calculation of reliable analytic sensitivities of objective and constraint functions is prohibitive. While the real welding process is thermo-mechanically coupled in essence, purely thermal models have been among the least expensive models that provide important knowledge on the temperature distribution of a FSW process. Furthermore, they can be used as the first step of, for example, an uncoupled heat transfer, residual stress, microstructure or fatigue analysis [17,18, 25-27].
Numerical techniques that are specifically developed to reduce the cost of expensive computer simulations are also available. These include the space and manifold mapping techniques developed by Bandler et al. [31] and Echeverria & Hemker [32]. In these techniques, a mapping between a high-level and low-level model is created and iteratively updated such that when applied to a coarse mesh, a good approximation of the true model is obtained during optimization. In the present work, a similar space mapping technique for FSW [16] is used to convert the three dimensional heat flux due to the heat of deformation to an equivalent two dimensional (surface) heat flux (more details to follow in Section 3).
Nandan et al. [33] presented a genetic algorithm (GA) to determine an optimum set of four process parameters by minimizing the differences between their numerical model and experimental data. The parameters considered were the contact friction coefficient, the extent of sticking between the tool and the workpiece, the heat transfer coefficient at the bottom surface of the workpiece, and the amount of viscous dissipation converted into heat. The objective was to minimize the peak temperature and the time that temperature reaches above a critical limit. Tutum et al. [34] also used a genetic algorithm to solve a multi-objective optimization problem considering residual stress and the tool wear. In the study by Fratini & Corona [35], the steepest descent optimization method was used to maximize the strength of a friction stir welded lap joint using the welding speed and the tool rotational speed as process variables. The procedure was, however, purely experimental and objective function gradients were obtained using a forward finite difference approach. In the same study, in order to account for uncertainties during the experiments, several identical samples were tested at each set of variables and the final results showed an increase in the joint strength after the optimization. In the study by Gebhard & Zaeh [36], the authors established an empirical (second order polynomial) relationship between the tool temperature (response) and parameters of the welding including the rotational and transverse speeds. More specifically, the objective of the work was not optimization but rather the modeling and understanding of the FSW process by promptly predicting the effect of changes in welding parameters on the temperature response. In other case studies, trial and error approaches have been used to improve the welding process parameters. An example is given in the study by Shercliff et al. [37] where the welding speed was optimized such that the material in front of the tool was sufficiently softened to allow easy tool traversing. There have also been studies that include trial and error methods for curve-fitting, e.g., the workpiece-backing plate heat transfer coefficient to reduce the difference in calculated and measured temperatures (Khandkar et al. [38] and Schmidt & Hattel [39]). Recently, Larsen proposed a systematic inverse modeling technique to estimate the workpiece-backing plate heat transfer coefficient in the FSW process [27] and Atharifar used a genetically optimized neural network system to optimize the process parameters in friction stir spot welding [40].
Jayaraman et al. [41] analyzed the effect of rotational and transverse speeds as well as the axial tool force on the tensile strength of the friction stir welded cast aluminum alloy A319. A full-factorial matrix was used to design the experiments. The Taguchi method has also been used for the optimization of the FSW process parameters using mechanical tests on tensile specimens (Lakshminarayanan et al. [9]) and for studying the impact resistance of dissimilar metal joints (Chen [42]).
The Taguchi optimization method is an efficient quality improvement tool that has been receiving attention in several engineering problems, owing to its simplicity and minimal optimization cost requirement based on the concept of orthogonal arrays. The use of trial and error, full factorial, and heuristic search methods such as GA for large-scale optimization problems can be prohibitive due to the high computation times associated with complex simulations/experiments. For instance, for an optimization with four variables and three levels each, a full factorial search would require a total of 34 = 81 runs whereas the Taguchi L9 orthogonal array only requires 9 runs to complete the optimization [43]. In a more intricate example, a process with 8 factors, each with 3 levels, would require 6561 (=38) experiments in order to test all possible factor combinations. With a Taguchi orthogonal array, only 18 experiments would be necessary, i.e., less than 0.3% of the original number. The method can also be used for screening purposes when the number of variables is high and the key parameters need to be identified before launching the final optimization routine. The main disadvantage of the Taguchi method, however, is that it assumes no interaction among design factors. Thus, it is critical to check the validity of the method for new applications using other methods such as full factorial design, follow-up (conforming) experiments, etc. The method has also been criticized in the literature for designing the product/process quality rather than correcting for poor quality, however this aspect of the method would be more concerned when non-repeatability of process data (noise effect) is high [43].
The next section presents an application of the Taguchi method with computer simulations for minimizing the HAZ distance to the weld line during a FSW process. Since the method is used for the first time with an HAZ objective function, as addressed above the orthogonality assumption of the search space needs to be verified. To this end, a separate full factorial design has been used and compared to the Taguchi optimization results. A detailed ANOVA framework for assessing the significance of the process parameters is also provided.
3. Case study
According to the study by Woo et al. [15], during FSW the regions experiencing the temperature of ~430oC are the locations of minimum hardness of the 6061 aluminum alloy because of the dissolution and coarsening of the strengthening precipitates (see also Figure 2(b)). Hence, by decreasing the distance of this region to the weld line, the volume of the region with low hardness can be decreased as it will merge to weld nugget with fine and equiaxed dynamic-recrystallized grains with maximum hardness after aging. A steady-state heat transfer model of the FSW process is established in the COMSOL Multiphysics finite element package, where for modeling purposes a fixed tool approach [44] is employed by moving the workpiece towards the tool (Figure 3). The tool tilt angle is zero. The plates are long enough to ensure the steadystate condition (i.e., as the tool passes through the joint line, there is enough time for the welded regions behind the tool to come to the final temperature equilibrium, resulting in a uniform temperature profile along the weld line). The aluminum alloy has temperature dependent yield strength as shown in Table 1, and constant physical and thermal properties that are given in Table 2 [45].
The FSW tool is made of steel with flat shoulder and cylindrical pin shapes. The thermal boundary conditions are illustrated in Figure 3. The model geometry is symmetric around the weld, allowing to model only one alu minum plate and half of the tool [17]. It is considered that according to the experimental study by Woo et al. [15], the temperature of 430oC is the critical temperature that provides sufficient activation energy and kinetics for dissolution and coarsening of the strengthening precipitates during the process, thus causing the minimum hardness locations at the outer boundary of the HAZ (Figure 2).
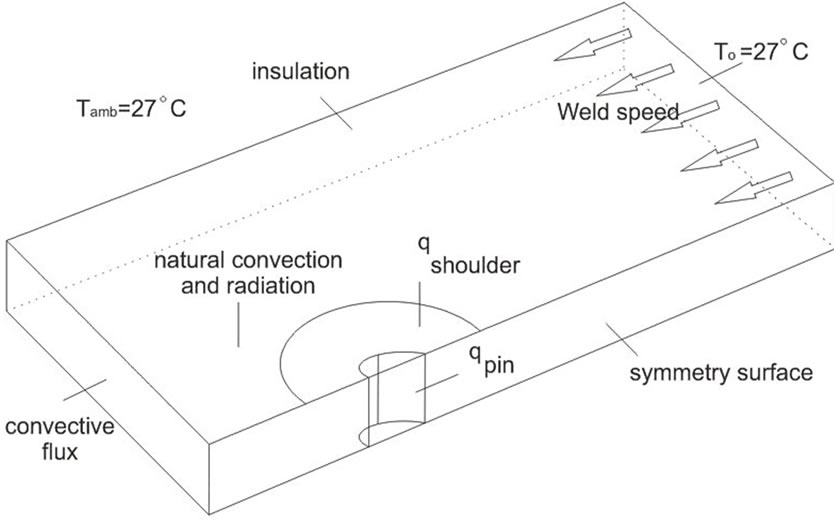
Figure 3. Boundary conditions of the FSW thermal model; due to symmetry, one plate is shown, also thermal insulation is set along the weld joint boundary; the upper and lower surfaces experience natural convection and surfaceto-ambient radiation.
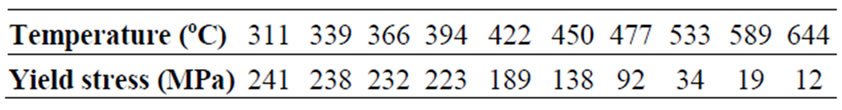
Table 1. Temperature dependence of the shear yield strength of aluminum 6061 alloy.
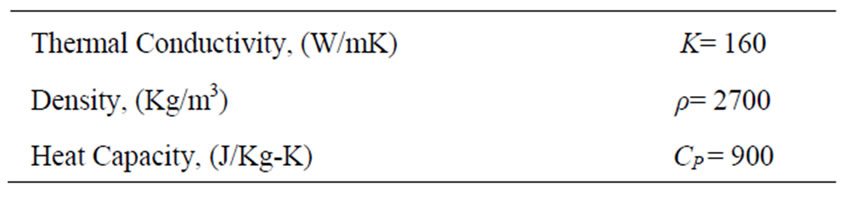
Table 2. Physical properties of aluminum 6061 alloy.
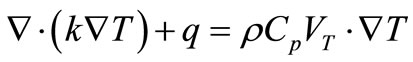
Equation (1) describes the steady-state heat transfer in the plate where a convective term (right-hand side) is included to account for the effect of material movement.
 (1)
(1)
 represents the rate of heat source per volume, VT is the welding (transverse) speed.
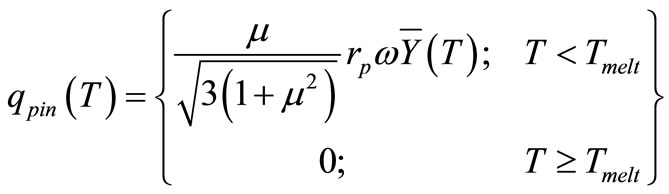
The model simulates the heat dissipation due to the interaction among the tool’s pin and shoulder with the workpiece (surface heat of friction and volumetric heat of deformation) as a surface heat flux (space mapping) in the tool pin and shoulder (Colegrove et al.) [17]:
 (2)
(2)
 (W/m2) is the pin heat flux and μ is the friction coefficient between the pin and the workpiece, rp denotes the pin radius, ω refers to the pin’s angular velocity (rad/ s), and
  is the average shear yield stress of the material as a function of temperature, T. The latter function is approximated by an interpolation of experimental data given in Table 1. Equation (3) defines the local heat flux from the shoulder at the distance-r from the center axis of the tool (Colegrove et al.) [17]:
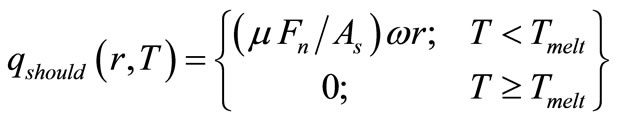 (3)
(3)
Fn represents the normal force, As is the shoulder’s surface area, and Tmelt is the aluminum 6061 melting temperature (652 oC).
On the right-cross section of the part (see also Figure 3) the temperature boundary condition is applied, whereas for the left-side cross section a convective flux boundary condition is used (i.e., the flux created in that cross-section moves out of the domain by movement of the plate compared to the tool). The upper and lower surfaces of the aluminum plates lose heat due to natural convection and surface-to-ambient radiation. The corresponding heat flux expressions for these boundaries are [46]:
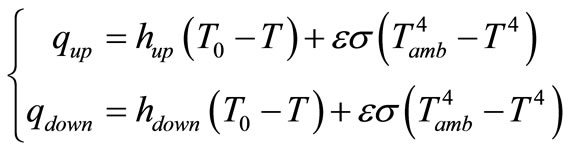 (4)
(4)
Where hup and hdown are the heat transfer coefficients for natural convection, T0 is an associated reference temperature, ε is the surface emissivity, σ is the StefanBoltzmann constant, and Tamb is the ambient air temperature. In the current model, the following values are used: hup = 12.25 W/(m2·K) and hdown = 6.25 W/(m2·K); T0 = Tamb = 27oC, and ε = 0.3.
Setting up the taguchi optimization problem
The nominal process parameters are chosen from reference [17] as follows: ω = 350 rpm, the transverse speed VT = 1.72 (mm/sec), and the axial force Fn =11 kN, which produce the same peak temperature of 550oC as reported in [17]. Next, we consider a ± 10 % variation around the nominal values to define two new levels for each of the above parameters as shown in Table 3.
From a practical viewpoint, it is important to note that during numerical optimization one should not choose the FSW parameter ranges at extreme conditions (e.g., ±50% of the nominal/working condition), as they may correspond to failure modes in the actual weld as observed by Lakshminarayanan [9]:
• When the rotational speed is low, a wormhole at the retreating side of the weld nugget was observed, and it may be due to insufficient heat generation and insufficient metal transportation;
• When the rotational speed is high, a tunnel defect was observed and it may be due to excessive turbulence caused by higher rotational speed;
• When the welding speed was low, a pin hole type of defect was observed due to excessive heat input per unit length of the weld and no vertical movement of the metal;
• When the welding speed was high, a tunnel at the bottom in the retreating side was observed due to insufficient heat input caused by inadequate flow of material;
• When the axial force was low, tunnel and crack – like defects in the middle of the weld cross section in the retreating side was observed since insufficient downward force causes no vertical flow of
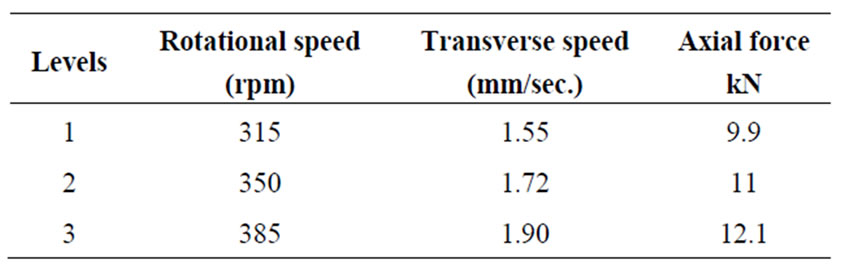
Table 3. Typical FSW process parameters used in the Taguchi optimiza-tion model
material; and
• When the axial force was increased beyond a threshold, a large mass of flash and excessive thinning were observed due to higher heat input.
In order to reduce the number of simulation runs (33 = 27), the Taguchi L9 orthogonal design [43] (shown in Table 4) is used to analyze the effect of each processing parameter (the rotational speed, the transverse speed, and the axial force) on the HAZ distance to the weld line of the friction stir welded joints. The ultimate goal is to minimize the distance of the points on the HAZ boundary having the critical temperature of 430oC from the weld center line (as explained in Section 1). Since there may be several points (a contour) having the same critical temperature in each run, the HAZ distance to the weld line is measured as the maximum distance of a location with 430 oC on the mid plane to the weld line. For solving the finite element model in each run, 957 tetragonal normal elements (chosen through a mesh sensitivity analysis on the temperature response) and the stationary linear direct UMFPACK solver were used with 1867 degrees of freedom [46].
4. Results and Discussion
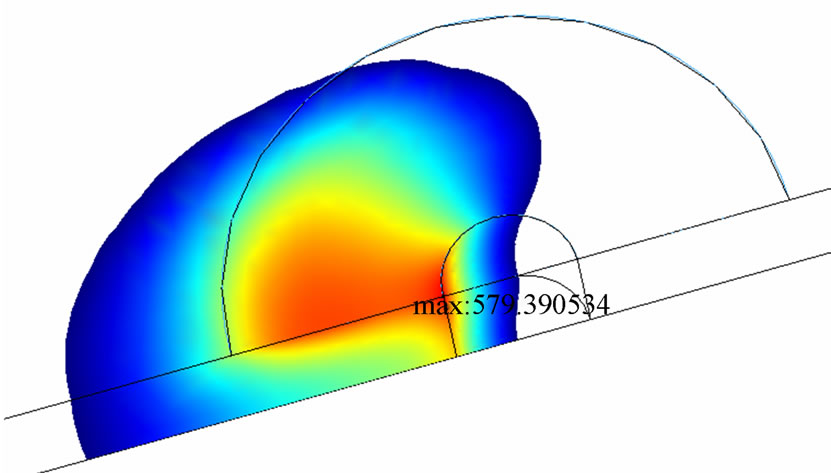
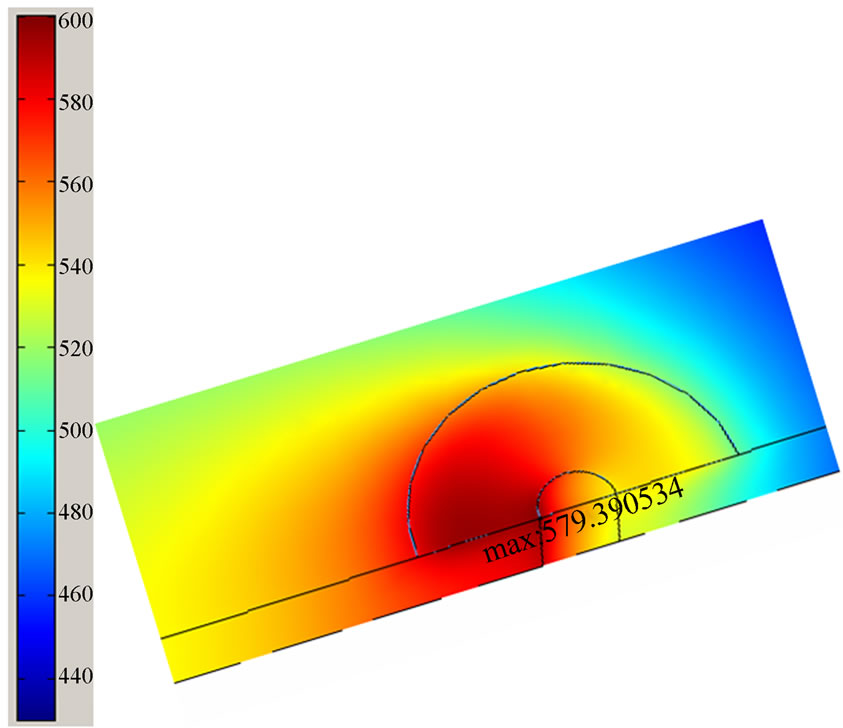
Table 4 shows the HAZ distance to the weld line in each of the nine runs dictated by the Taguchi L9 design. The corresponding peak temperature for each case has also been included in the table. For illustrative purposes, the extracted regions of the weld having a temperature of 430oC or higher for two sample runs are illustrated in Figure 4.
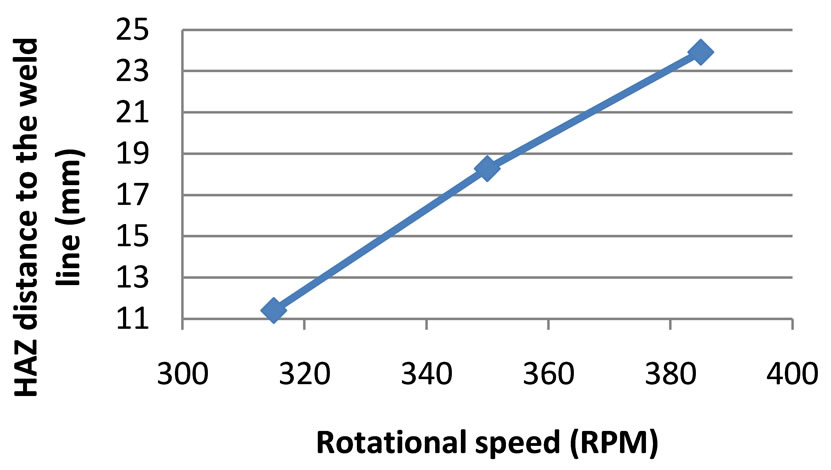
By plotting the main effects according to the values of Table 4, it is readily seen from Figure 5 that according to the Taguchi method the lowest value of HAZ distance is achieved at the lowest level of rotational speed = 315 RPM, the highest level of transverse speed = 1.9 mm/sec, and the lowest level of axial force = 9.9 kN. Note that this combination was not among the original nine runs in Table 4 but the method has been able to capture the optimum based on the (base) L9 orthogonal array. To validate the solution, a new simulation was run at the aforementioned optimum levels and the results were obtained as follows.
• the peak temperature = 458.98oC, and
• the distance of the HAZ from the weld center line = 2.56 mm
which are the lowest for both criteria when compared to the original L9 runs in Table 4. It is seen that the minimization of HAZ distance criterion has automatically resulted in the minimization of the peak temperature criterion. The temperature distribution of the optimum solution is shown in Figure 6 and compared to run#9 for illu-
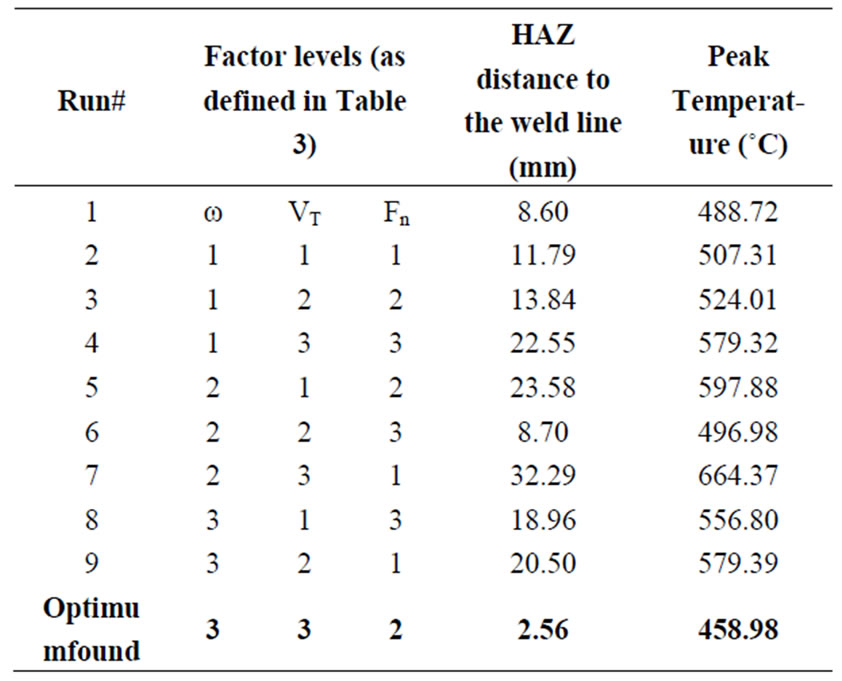
Table 4. The Taguchi L9 design with three factors-each three levels, along with the obtained response values from the corresponding runs.
 (a)
(a)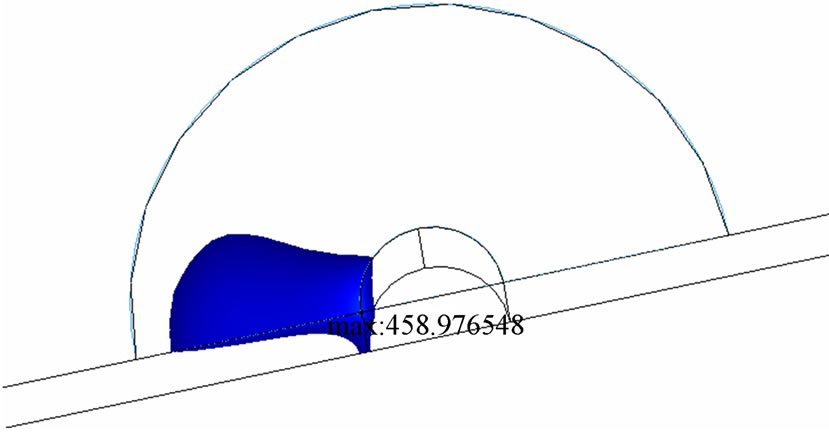 (b)
(b)
Figure 4. Sample regions extracted from the simulation model having a temperature equal to or higher than 430oC; (a) run# 9 and (b) the optimum solution (indicated in Table 4); tool moves from left to right.
stration purposes. The temperature distribution in Figure 6 between the two plates is symmetric as the effect of material movement around the tool is not considered in thermal models. Having a low peak temperature is occasinally refered to as cold FSW condition, which has been shown to yield higher formability in aluminum 6061 as
 (a)
(a)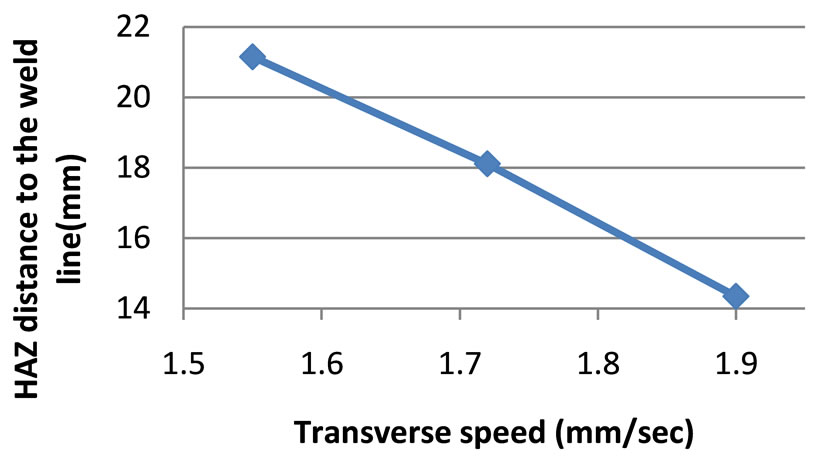 (b)
(b) (c)
(c)
Figure 5. Main effect plots of the process parameters for the HAZ distance from the weld line (points are based on the values of run#1 to #9 in Table 4).
measured by the limited dome height (LDH) test [47]. The proportionality of the HAZ distance criterion and the peak temperature criterion is formally shown in Figure 7 using the optimization Pareto front. Finally, it is important to recall that the Taguchi method’s assumption is that there are no significant interactions among design factors. While the above obtained optimum point implies the suitability of the method for the FSW problems, a full factorial design (i.e., with 33 runs) needs to be conducted to validate the assumption. Results of the full factorialsearch are shown in Table 5 (the highlighted value is the optimum response which is coincident with the Taguchi solution).
 (a)
(a)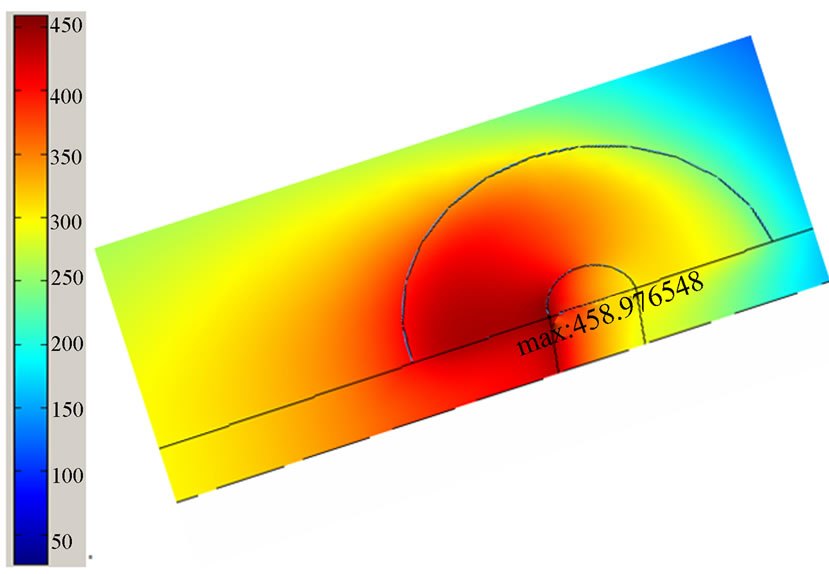 (b)
(b)
Figure 6. Temperature distribution in (a) run# 9 and (b) the optimum solution (see also Table 4).
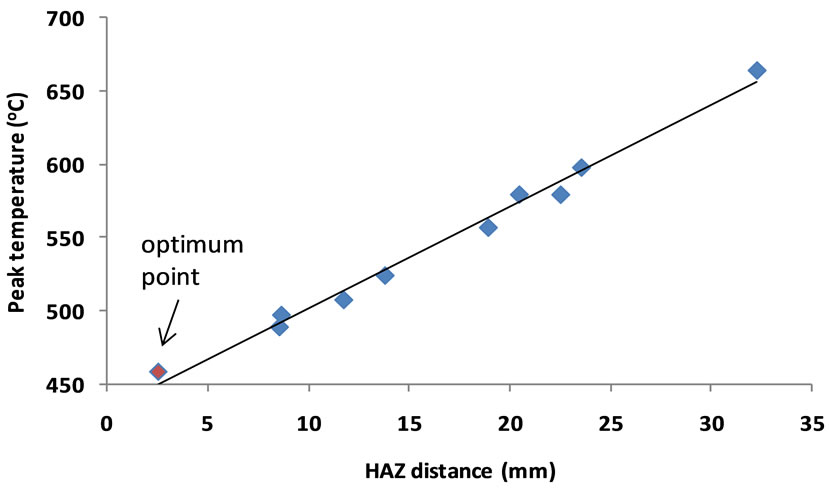
Figure 7. Proportionality of the maximum temperature and the HAZ distance criteria in the FSW optimization problem under study.
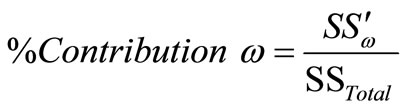
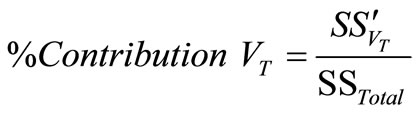
ANOVA Analysis: Percentage Contribution of the Process Parameters
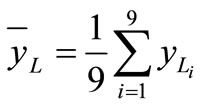
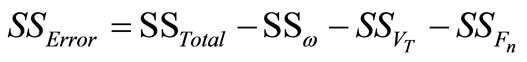
Following the ANOVA scheme used for the L9 Taguchi method in reference [9], the percentage contribution of each FSW process parameter on the peak temperature as well the HAZ distance to the weld line are calculated in the present case study. Detailed formulae of this analysis framework (which were not given in [9]) are included in Equations (5)-(13). The idea is that the original L9 design is with four factors but here three factors are active. Thus, the effect of the fourth factor can be used to estimate a pooled error in the actual experiments. Subsequently, the sum of squares, SS, of the main factors should be adjusted to pure values,  (i.e., without reflecting the error). The analysis results are summarized in Tables 6 and 7, and graphically in Figures 8 and 9. The rotational speed has the highest contribution on both peak temperature and HAZ distance to the weld line. It has been reported in other studies that the tool rotational speed ω also has a maximum contribution on the resulting weld material properties such as tensile strength [9,41]. This suggests that the FSW rotational speed is a key parameter to control welding process characteristics such as peak temperature and the HAZ distance to weld line as well as the mechanical properties of the final welded part. By examining Equation (2) it can be seen that ω has a direct effect on the heat generation of the pin. In Equation (3) both ω and Fn (axial force) have effects on heat generation of the tool shoulder. Thus, between the two parameters, one would expect that ω has more influence on the process response, as shown in Figures 8 and 9. To scrutinize these effects further, in Figure 10 the distribution of surface heat fluxes on the pin and shoulder,
  and
and  according to Equation (2) and Equation (3) respectively, are presented for the optimum solution point
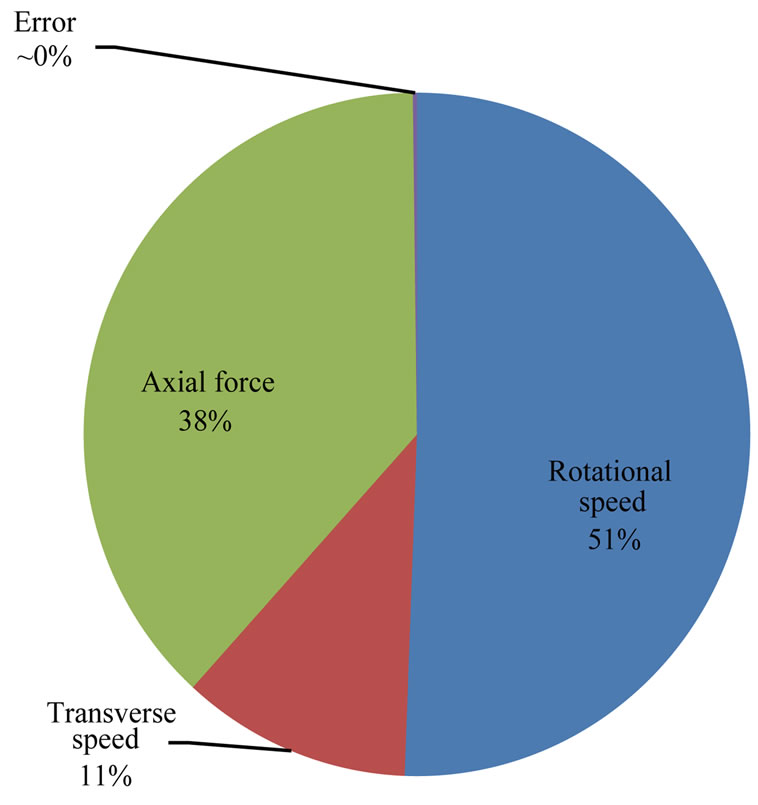
Figure 8. Contributions of the process parameters on the peak tempera-ture.
as indicated in Table 4. According to Figure 10, the maximum heat flux in the shoulder is 80% higher than that of the pin. Physically, the shoulder has higher radius compared to pin and the rotational speed of the tool causes a higher heat flux through the material shearing and frictional heat.
Remark: From a statistical standpoint, in the presence of interactions (which were not significant in this case study as shown), the ANOVA formulation outlined above on the Taguchi method with pooled error can be used to explore the main effect percentage contributions that one would identically obtain from a full factorial analysis.
This means saving a significant amount of time to identify the process parameters effects by conducting only a
Calculation of percentage contributions in the L9 design with three active factors:
 , (
, ( is the total average response in the Taguchi design) (5)
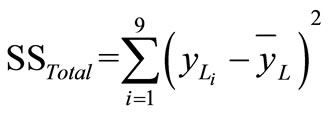 , (
, ( is the total sum of squares) (6)
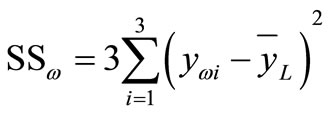 ,
,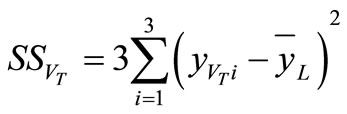 ,
,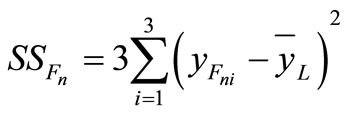 (7)
(7)
( is the i-th level average response of the corresponding factor x in the design)
 , (pooled error) (8)
 , (mean square error) (9)
 ,
, ,
, , (Fisher ratio) (10)
 , (pure sum of square) (11)
Similarly,
 and
and (12)
(12)
 ,
,  ,
, (13)
(13)
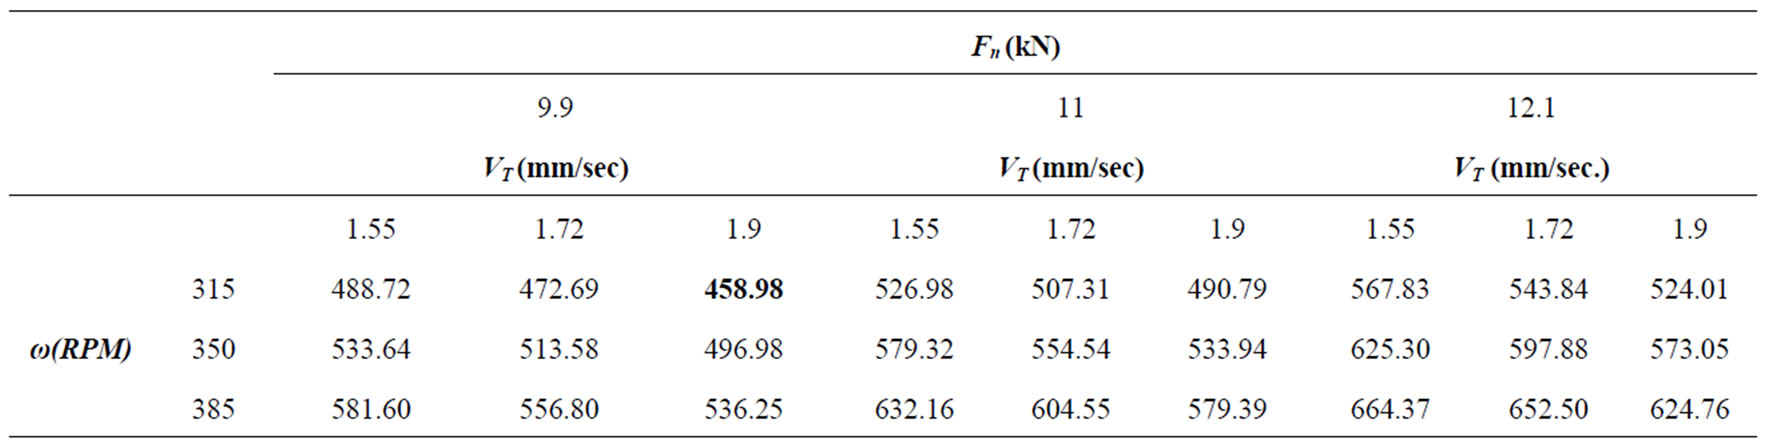
Table 5. Peak temperature values (oC) in the full factorial search (the highlighted value indicates the optimum).
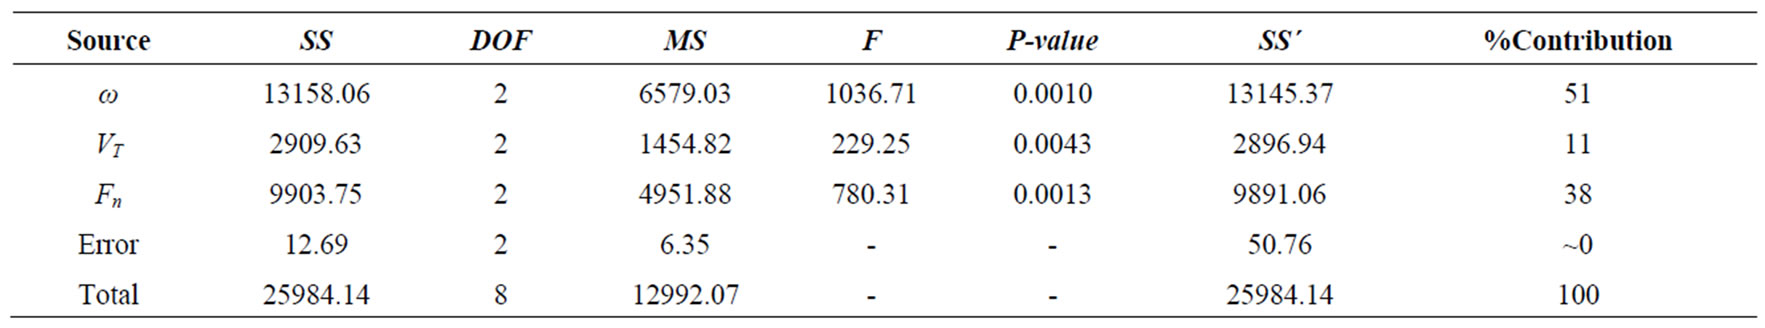
Table 6. ANOVA results on the peak temperature response using the values of Table 4 (statistical confidence level: 95%).
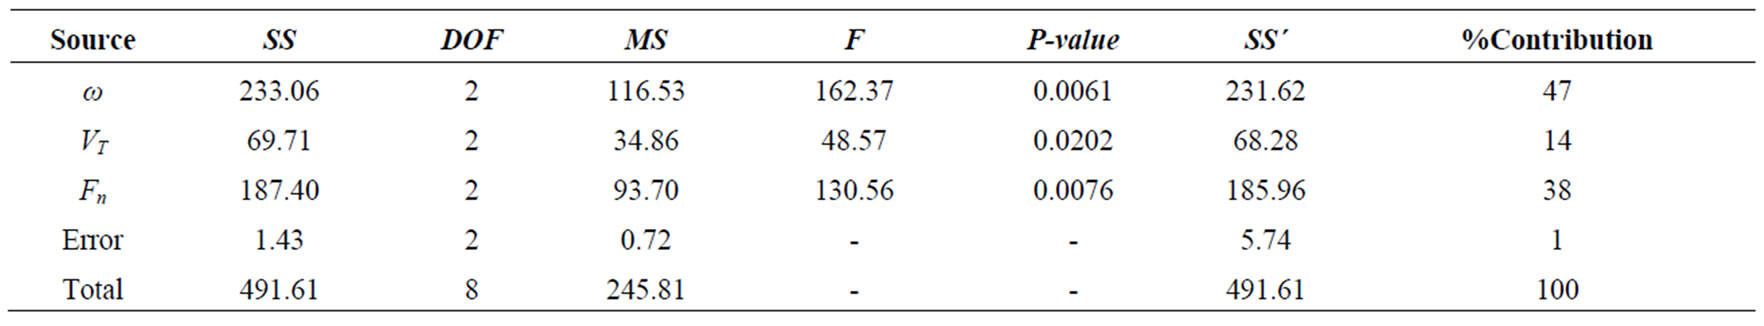
Table 7. ANOVA results on the HAZ distance to the weld line using the values of Table 4 (statistical confidence level: 95%).
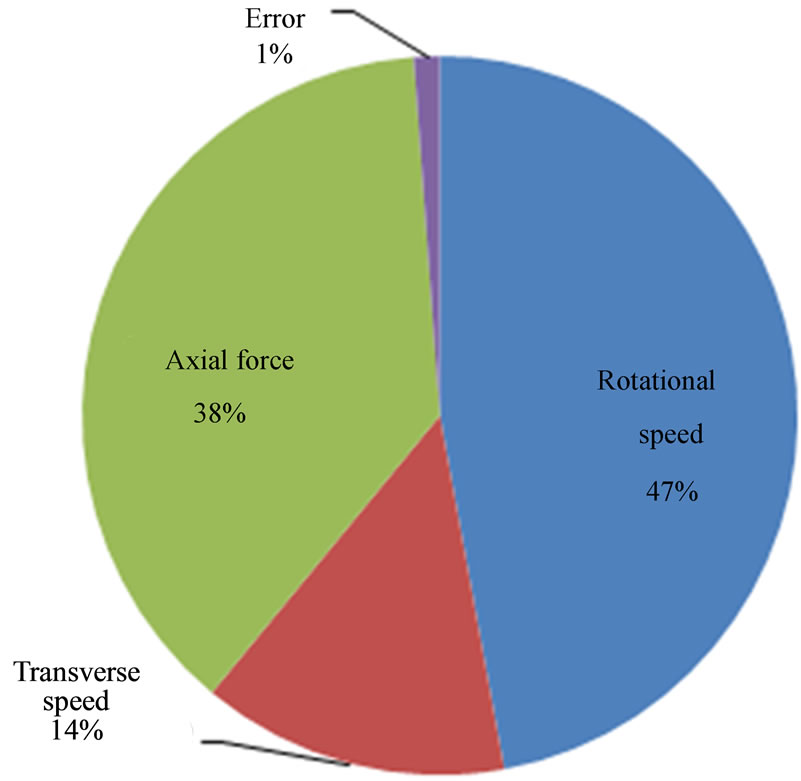
Figure 9. Contributions of the process parameters on the HAZ distance.
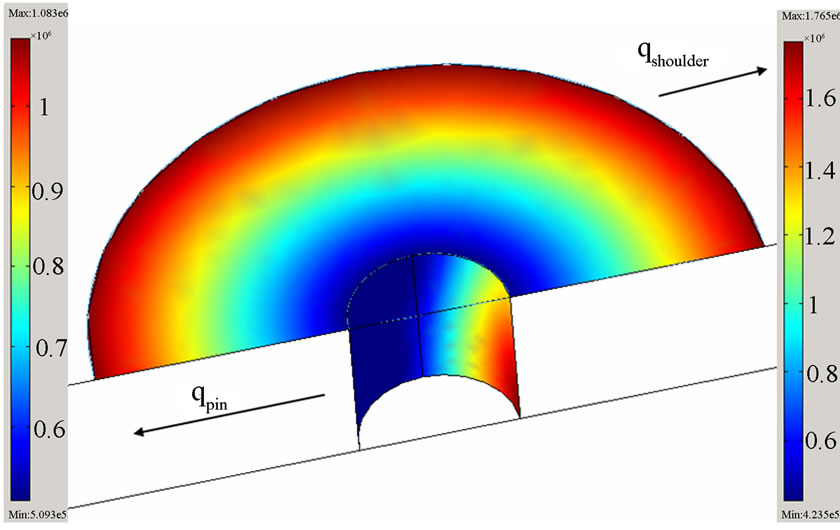
Figure 10. Distribution of the surface heat flux (W/m2) on the tool pin and shoulder for the optimum solution; tool moves from left to right.
fraction of a full factorial design (here 9 vs. 27 runs).
5. Conclusions
After a review of prediction and optimization models of FSW, the Taguchi optimization of a FSW process was conducted on a temperature field for the 6061 aluminum alloy. The (auxiliary) full factorial analysis of the process confirmed that the result of the Taguchi optimization is efficient and no significant interaction effects are present when the objective function comprises temperature field characteristics of the weld such as the HAZ distance to the weld line and/or the peak temperature in the workpiece. Contributions of the process parameters on both criteria were found to be comparable in the conducted case study; namely, the tool rotational speed showed the highest significance, followed by the normal force and the welding transverse speed. The variation of the rotational speed of the tool resulted in a 51% contribution on the HAZ distance to the weld line. The minimized peak temperature of 458.9oC in the case study indicated a 91oC temperature reduction from the nominal (initial) value of 550oC. The ANOVA method of the Taguchi L9 design and the full factorial analysis yielded similar parameter contributions.
While the application of optimization techniques on FSW reveals an increasing trend in the literature, it is important to recognize practical limitations of the process parameters. An example of such problem is excessive welding speed which can practically mean the risk of void creation in the weld line. Such phenomena cannot be modeled with, e.g., pure thermal or CFD models and a given optimizer may overestimate the practical range of the welding process. Consequently, while care should be taken in defining realistic ranges of process variables during numerical optimization routines, further research is needed on advancing multi-scale finite element modeling techniques to include FSW process defects.
6. Acknowledgments
The authors wish to acknowledge financial support from the Natural Sciences and Engineering Research Council (NSERC) of Canada. Constructive comments and suggestions from the anony-mous referee are also acknowledged.
7. REFERENCES
- W. M. Thomas, E. D. Nicholas, J. C. Needham, M. G. Murch, P. Temple-Smith and C. J. Dawes, “Friction Welding,” The Welding Institute TWI (1991) Patent Application No. 91259788, Cambridge, 1991.
- M. M. Shtrikman, “Current State and Development of Friction Stir Welding Part 3,” Welding International, Vol. 22, No. 11, 2008, pp. 806-815. doi:10.1080/09507110802 593620
- S. Vijayan and R. Raju, “Process Parameter Optimization and Characterization of Friction Stir Welding of Aluminum Alloys,” International Journal of Applied Engineering Research, Vol. 3, No. 10, 2008, pp. 1303-1316.
- B. London, M. Mahoney, B. Bingel, M. Calabrese and D. Waldron, “High Strain Rate Superplasticity in Thick Section 7050 Aluminum Created by Friction Stir Processing,” Proceedings of the Third International Symposium on Friction Stir Welding, Kobe, Japan, 27-28 September, 2001.
- C. G. Rhodes, M. W. Mahoney, W. H. Bingel, R. A. Spurling and C. C. Bampton, “Effects of Friction Stir Welding on Microstructure of 7075 Aluminum,” Scripta Materialia, Vol. 36, No. 1, 1997, pp. 69-75. doi:10.1016/ S1359-6462(96)00344-2
- G. Liu, L. E. Murr, C. S. Niou, J. C. McClure and F. R. Vega, “Microstructural Aspects of the Friction-Stir Welding of 6061-T6 Aluminum,” Scripta Materialia, Vol. 37, No. 3, 1997, pp. 355-361. doi:10.1016/S1359-6462(97) 00093-6
- K. V. Jata and S. L. Semiatin, “Continuous Dynamic Recrystallization during Friction Stir Welding of High Strength Aluminum Alloys,” Scripta Materialia, Vol. 43, No. 8, 2000, pp. 743-749. doi:10.1016/S1359-6462(00)00 480-2
- S. Benavides, Y. Li, L. E. Murr, D. Brown and J. C. McClure, “Low-Temperature Friction-stir Welding of 2024 Aluminum,” Scripta Materialia, Vol. 41, No. 8, 1999, pp. 809-815. doi:10.1016/S1359-6462(99)00226-2
- A. K. Lakshminarayanan, “Process Parameters Optimization for Friction Stir Welding of RDE-40 Aluminum Alloy Using Taguchi Technique,” Transactions of Nonferrous Metals Society of China, Vol. 18, No. 3, 2008, pp. 548-554. doi:10.1016/S1003-6326(08)60096-5
- Y. Chen, H. Liu and J. C. Feng, “Friction Stir Welding Characteristics of Different Heat-Treated-State 2219 Aluminum Alloy Plates,” Materials Science and Engineering A, Vol. 420, No, 1-2, 2006, pp. 21-25. doi:10.1016/j.msea. 2006.01.029
- W. B. Lee, “Evaluation of the Microstructure and Mechanical Properties of Friction Stir Welded 6005 Aluminum Alloy,” Materials Science and Technology, Vol. 19, No. 11, 2003, pp. 1513-1518. doi:10.1179/026708303225 008068
- H. W. L. Phillips, “The Constitution of Alloys of Aluminium with Magnesium, Silicon and Iron,” Journal Institute of Metals, Vol. 72, 1946, pp. 151-227.
- J. Zhang, Z. Fan, Y. Q. Wang and B. L. Zhou, “Equilibrium Pseudo-Binary Al-Mg2Si Phase Diagram,” Materials Science and Technology, Vol. 17, No. 5, 2001, pp. 494-496.
- D. L. Zhang and L. Zheng, “The Quench Sensitivity of Cast Al-7pct Si-0.4pct Mg Alloy,” Metallurgical and Materials Transactions A, Vol. 27, 1996, pp. 3983-3991. doi:10.1007/BF02595647
- W. Woo, H. Choo, P. J. Withers and Z. Feng, “Prediction of Hardness Minimum Locations during Natural Aging in an Aluminum Alloy 6061-T6 Friction Stir Weld,” Journal of Materials Science, Vol. 44, No. 23, 2009, pp. 6302-6309. doi:10.1007/s10853-009-3868-y
- A. A. Larsen, M. Bendsøe, J. Hattel and H. Schmidt, “Optimization of Friction Stir Welding Using Space Mapping and Manifold Mapping-an Initial Study of Thermal Aspects,” Structural and Multidisciplinary Optimization, Vol. 38, No. 3, 2009, pp. 289-299. doi:10. 1007/s00158-008-0288-6
- P. Colegrove, M. Painter, D. Graham and T. Miller, “3-Dimensional Flow and Thermal Modelling of the Friction Stir Welding Process,” Proceedings of the 2nd International Symposium on Friction Stir Welding, Gothenburg, 2000.
- H. Schmidt, J. Hattel and J. Wert, “An Analytical Model for the Heat Generation in Friction Stir Welding,” Modelling and Simulation in Materials Science and Engineering, Vol. 12, No. 1, 2004, pp. 143-157. doi:10.1088/0965- 0393/ 12/1/013
- M. Khandkar and J. Khan, “Thermal Modeling of Overlap Friction Stir Welding for Al-Alloys,” Journal of Materials Processing and Manufacturing Science, Vol. 10, 2001, pp, 91-105.
- P. Colegrove, H. Shercliff and P. Threadgill, “Modelling and Development of the Trivex (TM) Friction Stir Welding Tool,” Proceedings of 4th International Symposium on Friction Stir Welding, Park City, 14-16 May 2003.
- H. Schmidt and J. Hattel, “CFD Modelling of the Shear Layer Around the Tool Probe in Friction Stir Welding,” Proceedings of Friction Stir Welding and Processing III, TMS, San Francisco, 13-17 February 2005.
- C. Chen and R. Kovacevic, “Finite Element Modeling of Friction Stir Welding-Thermal and Thermomechanical Analysis,” International Journal of Machine Tools and Manufacture, Vol. 43, No. 13, 2003, pp. 1319-1326. doi: 10.1016/ S0890-6955(03)00158-5
- H. Schmidt and J. Hattel, “A Local Model for the Thermomechanical Conditions in Friction Stir Welding,” Journal of Materials Processing and Manufacturing Science, Vol. 13, No. 1, 2005, pp. 77-93.
- D. Rosenthal, “The Theory of Moving Sources of Heat and Its Application to Metal Treatments,” Transactions of the ASME, Vol. 68, No. 8, November 1946, pp. 849-866.
- V. Soundararajan, S. Zekovic and R. Kovacevic, “Thermo-Mechanical Model with Adaptive Boundary Conditions for Friction Stir Welding of Al 6061,” International Journal of Machine Tools and Manufacture, Vol. 45, No. 14, 2005, pp. 1577-1587.
- H. B. Schmidt and J. H. Hattel, “Thermal Modelling in Friction Stir Welding,” Scripta Materialia, Vol. 58, No. 5, 2008, pp. 332-337. doi:10.1016/j.scriptamat.2007.10.008
- A. A. Larsen, “Process Optimization of Friction Stir Welding Based on Thermal Models,” PhD Dissertation, Department of Mathematics, Technical University of Denmark, Lyngby, June 2009.
- O. R. Myhr and Ø Grong, “Process Modelling Applied to 6082-T6 Aluminium Weldments-I. Reaction Kinetics,” Acta Metallurgica et Materialia, Vol. 39, No. 11, 1991, pp. 2693-2702. doi:10.1016/0956-7151(91)90085-F
- O. R. Myhr and Ø Grong, “Process Modelling Spplied to 6082-T6 Aluminium Weldments-II. Applications of Model,” Acta Metallurgica et Materialia, Vol. 39, No. 11, 1991, pp. 2703-2708. doi:10.1016/0956-7151(91)90086-G
- A. A. Larsen, M. Stolpe, J. Hattel and H. Schmidt, “Optimization of Hardness in Friction Stir Welds,” 8th World Congress on Structural and Multidisciplinary Optimization, Lisbon, 1-5 June 2009.
- J. Bandler, Q. Cheng, S. Dakroury, A. Mohamed, M. Bakr, K. Madsen and J. Søndergaard, “Space Mapping, The State of the Art,” IEEE Transaction on Microwave Theory and Techniques, Vol. 52, No. 1, 2004, pp. 337- 361. doi:10.1109/TMTT.2003.820904
- D. Echeverria and P. Hemker, “Manifold Mapping: A Two-Level Optimization Technique,” Computing and Visualization in Science, Vol. 11, No. 4-6, 2008, pp. 193- 206. doi:10.1007/s00791-008-0096-y
- R. Nandan, B. Prabu, A. De and T. Debroy, “Improving Reliability of Heat Transfer and Materials Flow Calculations during Friction Stir Welding of Dissimilar Aluminum Alloys,” Welding journal, Vol. 86, 2007, pp. 313- 322.
- C. C. Tutum and J. H. Hattel, “Optimisation of Process Parameters in Friction Stir Welding Based on Residual Stress Analysis: A Feasibility Study,” Science and Technology of Welding and Joining, Vol. 15, No. 5, 2010, pp. 369-377. doi:10.1179/136217110X12707333260455
- L. Fratini and V. Corona, “Friction Stir Welding Lap Joint Resistance Optimization through Gradient Techniques,” Journal of Manufacturing Science and Engineering, Vol. 129, No. 6, 2007, pp. 985-990. doi:10.1115/ 1.2769727
- P. Gebhard and M. Zaeh, “Empirical Model for the Tool Shoulder Temperature during Friction Stir Welding,” Sixth International Symposium on Friction Stir Welding 2006, Saint-Sauveur, 10-13 October 2006.
- H. Shercliff, M. Russell, A. Taylor and T. Dickerson, “Microstructural Modeling in Friction Stir Welding of 2000 Series Aluminium Alloys,” Mecanique & Industries, Vol. 6, 2005, pp. 25-35. doi:10.1051/meca:2005004
- M. Khandkar, J. Khan and A. Reynolds, “Input Torque Based Thermal Model of Friction Stir Welding of Al-6061,” Proceedings of the 6th International Trends in Welding Research Conference, Pine Mountain, 15-19 April 2002.
- H. Schmidt and J. Hattel, “Thermal Modelling of Friction Stir Welding,” Scripta Materialia, Vol. 58, No. 5, 2008, 332-337. doi:10.1016/j.scriptamat.2007.10.008
- H. Atharifar, “Optimum Parameters Design for Friction Stir Spot Welding Using a Genetically Optimized Neural Network System,” Proceedings of the Institution of Mechanical Engineers, Part B: Journal of Engineering Manufacture, Vol. 224, No. 3, 2010, pp. 403-418. doi:10. 1243/09544054JEM1467
- M. Jayaraman, R. Sivasubramanian, V. Balasubramanian and A. K. Lakshminarayanan, “Optimization of Process Parameters for Friction Stir Welding of Cast Aluminium Alloy A319 by Taguchi Method,” Journal of Scientific & Industrial Research, Vol. 68, 2009, pp. 36-43.
- T. Chen, “A Study on Dissimilar FSW Process Parameters in Aluminum Alloy and Low Carbon Steel,” International Conference on Smart Manufacturing Application, Gyeonggi-do, 9-11 April 2008. doi:10.1109/ICSMA.2008. 4505603
- K. Ranjit Roy, “A Primer on the Taguchi Method,” 2nd Edition, Society of Manufacturing Engineers, Michigan, 2010.
- M. Song and R. Kovacevic, “Thermal Modeling of Friction Stir Welding in a Moving Coordinate and Its Validation,” International Journal of Machine Tools & Manufacture, Vol. 43, 2003, pp. 605-615. doi:10.1016/S0890- 6955(03)00022-1
- H. Baker, “Properties and Selection: Nonferrous Alloy and Pure Metals,” 9th Edition, Metal Handbook, Vol. 2, American Society for Metals, Ohio, 1979.
- “Heat Transfer Module-Model Library of Comsol 3.4,” Comsol Inc., Burlington, October 2007.
- D. M. Rodrigues, A. Loureiro. C. Leitao, R. M. Leal, B. M. Chaparro and P. Vilaca, “Influence of Friction Stir Welding Parameters on the Microstructural and Mechanical Properties of AA 6016-T4 Thin Welds,” Materials and Design, Vol. 30, No. 6, 2009, pp. 1913-1921. doi: 10.1016/j.matdes.2008.09.016